EXHIBIT 99.1
Published on August 4, 2020

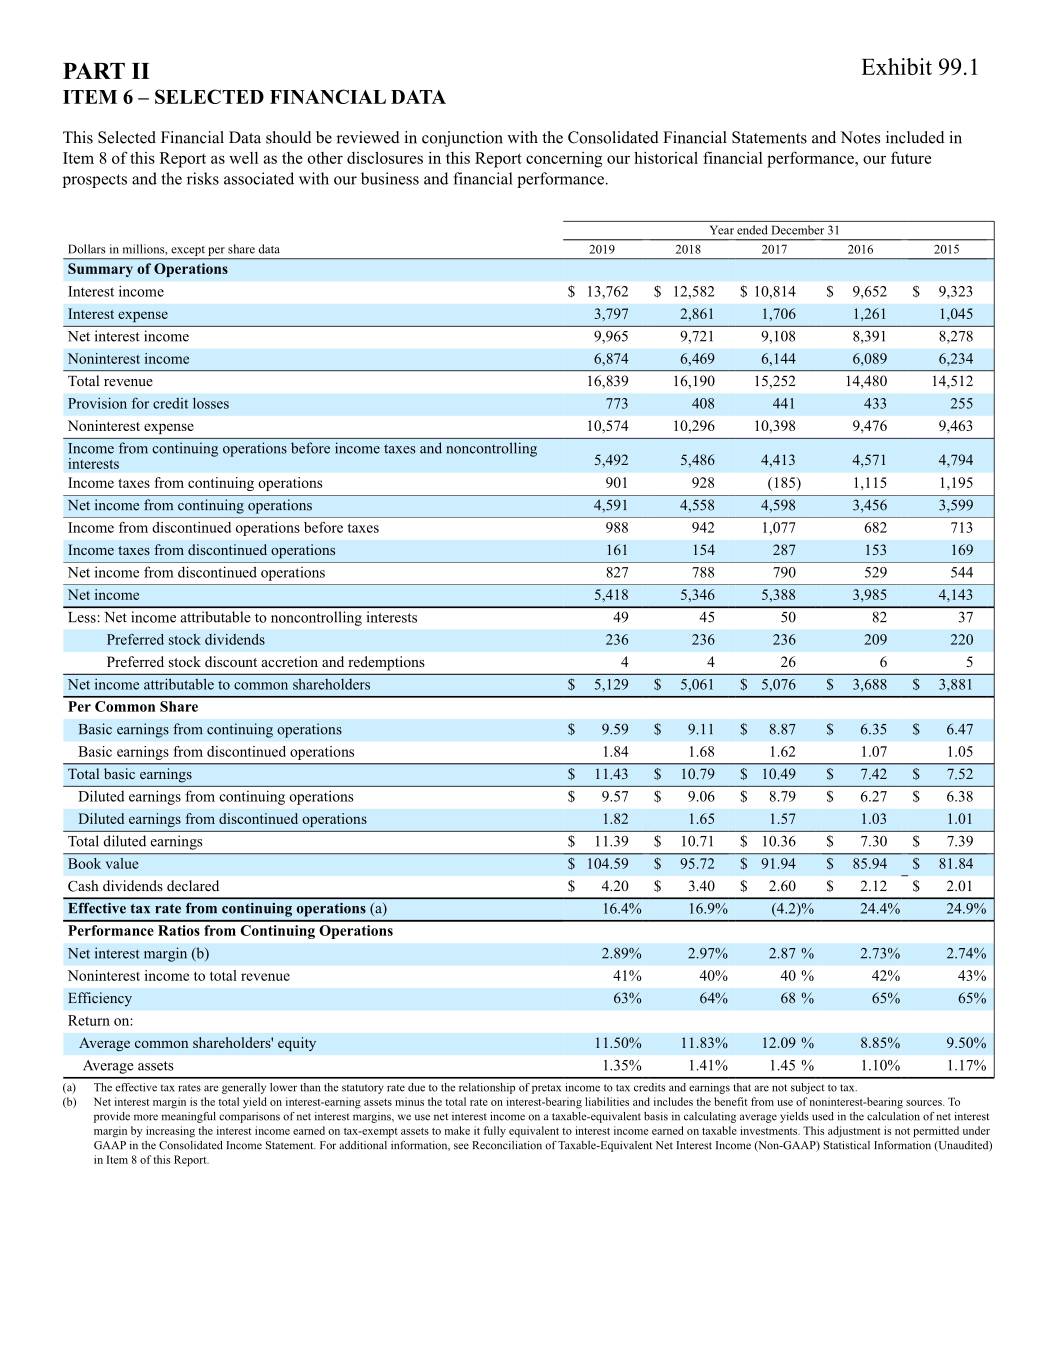
PART II Exhibit 99.1 ITEM 6 – SELECTED FINANCIAL DATA This Selected Financial Data should be reviewed in conjunction with the Consolidated Financial Statements and Notes included in Item 8 of this Report as well as the other disclosures in this Report concerning our historical financial performance, our future prospects and the risks associated with our business and financial performance. Year ended December 31 Dollars in millions, except per share data 2019 2018 2017 2016 2015 Summary of Operations Interest income $ 13,762 $ 12,582 $ 10,814 $ 9,652 $ 9,323 Interest expense 3,797 2,861 1,706 1,261 1,045 Net interest income 9,965 9,721 9,108 8,391 8,278 Noninterest income 6,874 6,469 6,144 6,089 6,234 Total revenue 16,839 16,190 15,252 14,480 14,512 Provision for credit losses 773 408 441 433 255 Noninterest expense 10,574 10,296 10,398 9,476 9,463 Income from continuing operations before income taxes and noncontrolling interests 5,492 5,486 4,413 4,571 4,794 Income taxes from continuing operations 901 928 (185) 1,115 1,195 Net income from continuing operations 4,591 4,558 4,598 3,456 3,599 Income from discontinued operations before taxes 988 942 1,077 682 713 Income taxes from discontinued operations 161 154 287 153 169 Net income from discontinued operations 827 788 790 529 544 Net income 5,418 5,346 5,388 3,985 4,143 Less: Net income attributable to noncontrolling interests 49 45 50 82 37 Preferred stock dividends 236 236 236 209 220 Preferred stock discount accretion and redemptions 4 4 26 6 5 Net income attributable to common shareholders $ 5,129 $ 5,061 $ 5,076 $ 3,688 $ 3,881 Per Common Share Basic earnings from continuing operations $ 9.59 $ 9.11 $ 8.87 $ 6.35 $ 6.47 Basic earnings from discontinued operations 1.84 1.68 1.62 1.07 1.05 Total basic earnings $ 11.43 $ 10.79 $ 10.49 $ 7.42 $ 7.52 Diluted earnings from continuing operations $ 9.57 $ 9.06 $ 8.79 $ 6.27 $ 6.38 Diluted earnings from discontinued operations 1.82 1.65 1.57 1.03 1.01 Total diluted earnings $ 11.39 $ 10.71 $ 10.36 $ 7.30 $ 7.39 Book value $ 104.59 $ 95.72 $ 91.94 $ 85.94 $ 81.84 Cash dividends declared $ 4.20 $ 3.40 $ 2.60 $ 2.12 $ 2.01 Effective tax rate from continuing operations (a) 16.4% 16.9% (4.2)% 24.4% 24.9% Performance Ratios from Continuing Operations Net interest margin (b) 2.89% 2.97% 2.87 % 2.73% 2.74% Noninterest income to total revenue 41% 40% 40 % 42% 43% Efficiency 63% 64% 68 % 65% 65% Return on: Average common shareholders' equity 11.50% 11.83% 12.09 % 8.85% 9.50% Average assets 1.35% 1.41% 1.45 % 1.10% 1.17% (a) The effective tax rates are generally lower than the statutory rate due to the relationship of pretax income to tax credits and earnings that are not subject to tax. (b) Net interest margin is the total yield on interest-earning assets minus the total rate on interest-bearing liabilities and includes the benefit from use of noninterest-bearing sources. To provide more meaningful comparisons of net interest margins, we use net interest income on a taxable-equivalent basis in calculating average yields used in the calculation of net interest margin by increasing the interest income earned on tax-exempt assets to make it fully equivalent to interest income earned on taxable investments. This adjustment is not permitted under GAAP in the Consolidated Income Statement. For additional information, see Reconciliation of Taxable-Equivalent Net Interest Income (Non-GAAP) Statistical Information (Unaudited) in Item 8 of this Report.

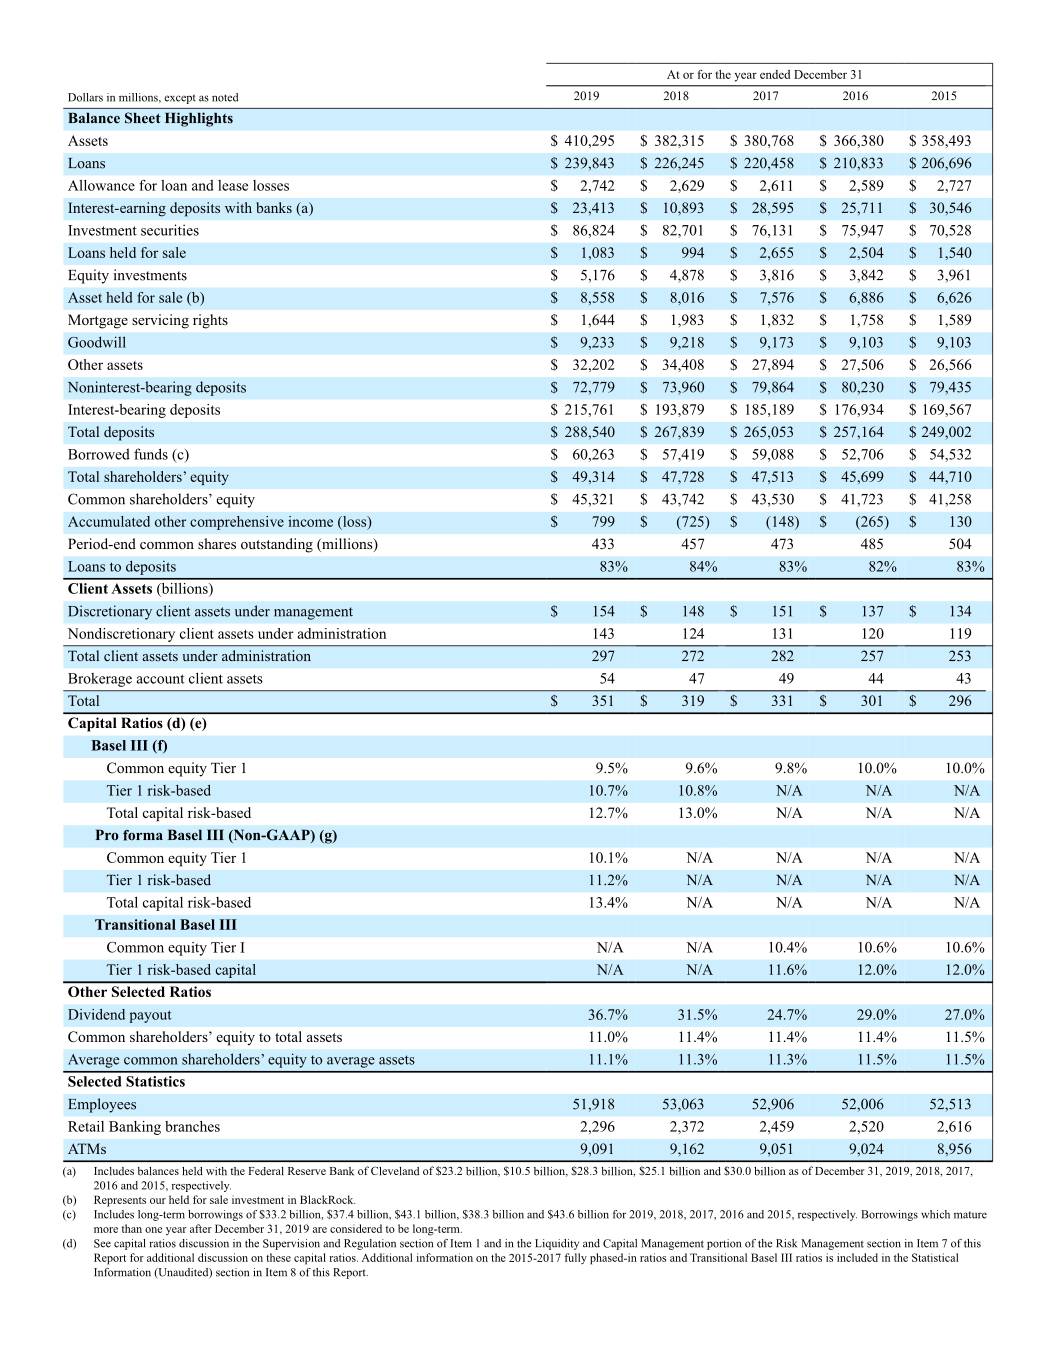
At or for the year ended December 31 Dollars in millions, except as noted 2019 2018 2017 2016 2015 Balance Sheet Highlights Assets $ 410,295 $ 382,315 $ 380,768 $ 366,380 $ 358,493 Loans $ 239,843 $ 226,245 $ 220,458 $ 210,833 $ 206,696 Allowance for loan and lease losses $ 2,742 $ 2,629 $ 2,611 $ 2,589 $ 2,727 Interest-earning deposits with banks (a) $ 23,413 $ 10,893 $ 28,595 $ 25,711 $ 30,546 Investment securities $ 86,824 $ 82,701 $ 76,131 $ 75,947 $ 70,528 Loans held for sale $ 1,083 $ 994 $ 2,655 $ 2,504 $ 1,540 Equity investments $ 5,176 $ 4,878 $ 3,816 $ 3,842 $ 3,961 Asset held for sale (b) $ 8,558 $ 8,016 $ 7,576 $ 6,886 $ 6,626 Mortgage servicing rights $ 1,644 $ 1,983 $ 1,832 $ 1,758 $ 1,589 Goodwill $ 9,233 $ 9,218 $ 9,173 $ 9,103 $ 9,103 Other assets $ 32,202 $ 34,408 $ 27,894 $ 27,506 $ 26,566 Noninterest-bearing deposits $ 72,779 $ 73,960 $ 79,864 $ 80,230 $ 79,435 Interest-bearing deposits $ 215,761 $ 193,879 $ 185,189 $ 176,934 $ 169,567 Total deposits $ 288,540 $ 267,839 $ 265,053 $ 257,164 $ 249,002 Borrowed funds (c) $ 60,263 $ 57,419 $ 59,088 $ 52,706 $ 54,532 Total shareholders’ equity $ 49,314 $ 47,728 $ 47,513 $ 45,699 $ 44,710 Common shareholders’ equity $ 45,321 $ 43,742 $ 43,530 $ 41,723 $ 41,258 Accumulated other comprehensive income (loss) $ 799 $ (725) $ (148) $ (265) $ 130 Period-end common shares outstanding (millions) 433 457 473 485 504 Loans to deposits 83% 84% 83% 82% 83% Client Assets (billions) Discretionary client assets under management $ 154 $ 148 $ 151 $ 137 $ 134 Nondiscretionary client assets under administration 143 124 131 120 119 Total client assets under administration 297 272 282 257 253 Brokerage account client assets 54 47 49 44 43 Total $ 351 $ 319 $ 331 $ 301 $ 296 Capital Ratios (d) (e) Basel III (f) Common equity Tier 1 9.5% 9.6% 9.8% 10.0% 10.0% Tier 1 risk-based 10.7% 10.8% N/A N/A N/A Total capital risk-based 12.7% 13.0% N/A N/A N/A Pro forma Basel III (Non-GAAP) (g) Common equity Tier 1 10.1% N/A N/A N/A N/A Tier 1 risk-based 11.2% N/A N/A N/A N/A Total capital risk-based 13.4% N/A N/A N/A N/A Transitional Basel III Common equity Tier I N/A N/A 10.4% 10.6% 10.6% Tier 1 risk-based capital N/A N/A 11.6% 12.0% 12.0% Other Selected Ratios Dividend payout 36.7% 31.5% 24.7% 29.0% 27.0% Common shareholders’ equity to total assets 11.0% 11.4% 11.4% 11.4% 11.5% Average common shareholders’ equity to average assets 11.1% 11.3% 11.3% 11.5% 11.5% Selected Statistics Employees 51,918 53,063 52,906 52,006 52,513 Retail Banking branches 2,296 2,372 2,459 2,520 2,616 ATMs 9,091 9,162 9,051 9,024 8,956 (a) Includes balances held with the Federal Reserve Bank of Cleveland of $23.2 billion, $10.5 billion, $28.3 billion, $25.1 billion and $30.0 billion as of December 31, 2019, 2018, 2017, 2016 and 2015, respectively. (b) Represents our held for sale investment in BlackRock. (c) Includes long-term borrowings of $33.2 billion, $37.4 billion, $43.1 billion, $38.3 billion and $43.6 billion for 2019, 2018, 2017, 2016 and 2015, respectively. Borrowings which mature more than one year after December 31, 2019 are considered to be long-term. (d) See capital ratios discussion in the Supervision and Regulation section of Item 1 and in the Liquidity and Capital Management portion of the Risk Management section in Item 7 of this Report for additional discussion on these capital ratios. Additional information on the 2015-2017 fully phased-in ratios and Transitional Basel III ratios is included in the Statistical Information (Unaudited) section in Item 8 of this Report.

(e) All ratios are calculated using the regulatory capital methodology applicable to PNC during each period presented, except for the 2015-2017 Basel III Common equity Tier 1 ratios, which are fully phased-in Basel III ratios and are presented as pro forma estimates. Ratios for all periods were calculated based on the standardized approach. (f) The 2019 and 2018 Basel III ratios for Common equity Tier 1 capital and Tier 1 risk-based capital reflect the full phase-in of all Basel III adjustments to these metrics applicable to PNC. The 2019 and 2018 Basel III Total capital risk-based ratios include nonqualifying trust preferred capital securities of $60 million and $80 million, respectively, that are subject to a phase- out period that runs through 2021. (g) Pro forma Basel III ratios are calculated as if the 2019 Tailoring Rules, and PNC's election to opt-out of the inclusion of certain elements of accumulated other comprehensive income in regulatory capital, had been in effect on December 31, 2019. We believe that the pro forma Basel III ratios are a useful tool to assess the impact to our capital position after adoption of the 2019 Tailoring Rules.