10-Q: Quarterly report pursuant to Section 13 or 15(d)
Published on August 4, 2020
UNITED STATES
SECURITIES AND EXCHANGE COMMISSION
Washington, DC 20549
______________________________________
FORM 10-Q
______________________________________
QUARTERLY REPORT PURSUANT TO SECTION 13 OR 15(d) OF THE SECURITIES EXCHANGE ACT OF 1934 |
|
For the quarterly period ended June 30, 2020
or
TRANSITION REPORT PURSUANT TO SECTION 13 OR 15(d) OF THE SECURITIES EXCHANGE ACT OF 1934 |
|
For the transition period from to
Commission file number 001-09718
The PNC Financial Services Group, Inc.
(Exact name of registrant as specified in its charter)
___________________________________________________________
|
(State or other jurisdiction of
incorporation or organization)
|
(I.R.S. Employer Identification No.) |
|
(Address of principal executive offices, including zip code)
(888 ) 762-2265
(Registrant’s telephone number including area code)
(Former name, former address and former fiscal year, if changed since last report)
___________________________________________________________
Securities registered pursuant to Section 12(b) of the Act:
Title of Each Class |
Trading Symbol(s) |
Name of Each Exchange
on Which Registered
|
Floating Rate Non-Cumulative Perpetual Preferred Stock, Series P |
||
Non-Cumulative Perpetual Preferred Stock, Series Q |
||
Indicate by check mark whether the registrant: (1) has filed all reports required to be filed by Section 13 or 15(d) of the Securities Exchange Act of 1934 during the preceding 12 months (or for such shorter period that the registrant was required to file such reports), and (2) has been subject to such filing requirements for the past 90 days. Yes ☒ No ☐
Indicate by check mark whether the registrant has submitted electronically every Interactive Data File required to be submitted pursuant to Rule 405 of Regulation S-T (§232.405 of this chapter) during the preceding 12 months (or for such shorter period that the registrant was required to submit such files). Yes ☒ No ☐
Indicate by check mark whether the registrant is a large accelerated filer, an accelerated filer, a non-accelerated filer, a smaller reporting company, or an emerging growth company. See the definitions of “large accelerated filer”, “accelerated filer”, “smaller reporting company”, and “emerging growth company” in Rule 12b-2 of the Exchange Act.
☒ |
Accelerated filer |
☐ |
||||
Non-accelerated filer |
☐ |
Smaller reporting company |
||||
Emerging growth company |
||||||
If an emerging growth company, indicate by check mark if the registrant has elected not to use the extended transition period for complying with any new or revised financial accounting standards provided pursuant to Section 7(a)(2)(B) of the Securities Act. ☐
Indicate by check mark whether the registrant is a shell company (as defined in Rule 12b-2 of the Exchange Act).
Yes ☐ No ☒
As of July 17, 2020, there were 424,502,851 shares of the registrant’s common stock ($5 par value) outstanding.
THE PNC FINANCIAL SERVICES GROUP, INC.
Cross-Reference Index to Second Quarter 2020 Form 10-Q
Pages |
|
PART I – FINANCIAL INFORMATION |
|
Item 1. Financial Statements (Unaudited). |
|
Item 2. Management’s Discussion and Analysis of Financial Condition and Results of Operations (MD&A). |
|
Item 3. Quantitative and Qualitative Disclosures about Market Risk. |
22-43, 54-66 and 99-105 |
Item 4. Controls and Procedures. |
|
THE PNC FINANCIAL SERVICES GROUP, INC.
Cross-Reference Index to Second Quarter 2020 Form 10-Q (continued)
MD&A TABLE REFERENCE |
||
Table |
Description |
Page |
1 |
||
2 |
||
3 |
||
4 |
||
5 |
||
6 |
||
7 |
||
8 |
||
9 |
||
10 |
||
11 |
||
12 |
||
13 |
||
14 |
||
15 |
||
16 |
||
17 |
||
18 |
||
19 |
||
20 |
||
21 |
||
22 |
||
23 |
||
24 |
||
25 |
||
26 |
Allowance for Credit Losses by Loan Class
|
|
27 |
||
28 |
||
29 |
||
30 |
||
31 |
||
32 |
||
33 |
||
34 |
||
THE PNC FINANCIAL SERVICES GROUP, INC.
Cross-Reference Index to Second Quarter 2020 Form 10-Q (continued)
NOTES TO CONSOLIDATED FINANCIAL STATEMENTS TABLE REFERENCE |
||
Table |
Description |
Page |
35 |
||
36 |
||
37 |
||
38 |
||
39 |
|
|
40 |
||
41 |
||
42 |
||
43 |
||
44 |
||
45 |
||
46 |
||
47 |
||
48 |
||
49 |
||
50 |
||
51 |
||
52 |
||
53 |
||
54 |
||
55 |
||
56 |
||
57 |
||
58 |
||
59 |
||
60 |
||
61 |
||
62 |
||
63 |
||
64 |
||
65 |
||
66 |
||
67 |
||
68 |
||
69 |
||
70 |
||
71 |
||
72 |
||
73 |
||
74 |
||
75 |
||
76 |
||
77 |
||
78 |
||
79 |
||
80 |
||
81 |
||
82 |
||
83 |
||
84 |
||
FINANCIAL REVIEW
THE PNC FINANCIAL SERVICES GROUP, INC.
This Financial Review, including the Consolidated Financial Highlights, should be read together with our unaudited Consolidated Financial Statements and unaudited Statistical Information included elsewhere in this Quarterly Report on Form 10-Q (the Report or Form 10-Q) and with Items 6, 7, 8 and 9A of our 2019 Annual Report on Form 10-K (2019 Form 10-K). We have reclassified certain prior period amounts to conform with the current period presentation, which we believe is more meaningful to readers of our consolidated financial statements. For information regarding certain business, regulatory and legal risks, see the following: the Risk Management section of this Financial Review and of Item 7 in our 2019 Form 10-K; Item 1A Risk Factors included in our first quarter 2020 Form 10-Q and our 2019 Form 10-K; and the Commitments and Legal Proceedings Notes of the Notes To Consolidated Financial Statements included in Item 1 of this Report and Item 8 of our 2019 Form 10-K. Also, see the Cautionary Statement Regarding Forward-Looking Information section in this Financial Review and the Critical Accounting Estimates And Judgments section in this Financial Review and in our 2019 Form 10-K for certain other factors that could cause actual results or future events to differ, perhaps materially, from historical performance and from those anticipated in the forward-looking statements included in this Report. See Note 15 Segment Reporting in the Notes To Consolidated Financial Statements included in this Report for a reconciliation of total business segment earnings to total PNC consolidated net income as reported on a generally accepted accounting principles (GAAP) basis. In this Report, “PNC”, “we” or “us” refers to The PNC Financial Services Group, Inc. and its subsidiaries on a consolidated basis (except when referring to PNC as a public company, its common stock or other securities issued by PNC, which just refer to The PNC Financial Services Group, Inc.). References to The PNC Financial Services Group, Inc. or to any of its subsidiaries are specifically made where applicable.
Table 1: Consolidated Financial Highlights
|
Dollars in millions, except per share data
Unaudited
|
Three months ended June 30 |
Six months ended June 30 |
|||||||||||
2020 |
2019 |
2020 |
2019 |
||||||||||
Financial Results (a) |
|||||||||||||
Revenue |
|||||||||||||
Net interest income |
$ |
2,527 |
$ |
2,498 |
$ |
5,038 |
$ |
4,973 |
|||||
Noninterest income |
1,549 |
1,717 |
3,374 |
3,303 |
|||||||||
Total revenue |
4,076 |
4,215 |
8,412 |
8,276 |
|||||||||
Provision for credit losses |
2,463 |
180 |
3,377 |
369 |
|||||||||
Noninterest expense |
2,515 |
2,611 |
5,058 |
5,189 |
|||||||||
|
Income (loss) from continuing operations before income taxes and noncontrolling interests
|
$ |
(902 |
) |
$ |
1,424 |
$ |
(23 |
) |
$ |
2,718 |
|||
|
Income taxes (benefit) from continuing operations
|
(158 |
) |
239 |
(38 |
) |
451 |
|||||||
Net income (loss) from continuing operations |
$ |
(744 |
) |
$ |
1,185 |
$ |
15 |
$ |
2,267 |
||||
|
Income from discontinued operations before taxes
|
$ |
5,596 |
$ |
224 |
$ |
5,777 |
$ |
449 |
|||||
|
Income taxes from discontinued operations
|
1,197 |
35 |
1,222 |
71 |
|||||||||
|
Net income from discontinued operations
|
$ |
4,399 |
$ |
189 |
$ |
4,555 |
$ |
378 |
|||||
Net income |
$ |
3,655 |
$ |
1,374 |
$ |
4,570 |
$ |
2,645 |
|||||
Less: |
|||||||||||||
Net income attributable to noncontrolling interests |
7 |
12 |
14 |
22 |
|||||||||
Preferred stock dividends (b) |
55 |
55 |
118 |
118 |
|||||||||
Preferred stock discount accretion and redemptions |
1 |
1 |
2 |
2 |
|||||||||
Net income attributable to common shareholders |
$ |
3,592 |
$ |
1,306 |
$ |
4,436 |
$ |
2,503 |
|||||
|
Per Common Share
|
|||||||||||||
Basic earnings (loss) from continuing operations |
$ |
(1.90 |
) |
$ |
2.47 |
$ |
(.29 |
) |
$ |
4.68 |
|||
Basic earnings from discontinued operations |
10.28 |
.42 |
10.60 |
.83 |
|||||||||
|
Total basic earnings
|
$ |
8.40 |
$ |
2.89 |
$ |
10.33 |
$ |
5.51 |
|||||
Diluted earnings (loss) from continuing operations |
$ |
(1.90 |
) |
$ |
2.47 |
$ |
(.29 |
) |
$ |
4.67 |
|||
Diluted earnings from discontinued operations |
10.28 |
.41 |
10.59 |
.82 |
|||||||||
Total diluted earnings |
$ |
8.40 |
$ |
2.88 |
$ |
10.32 |
$ |
5.49 |
|||||
Cash dividends declared per common share |
$ |
1.15 |
$ |
.95 |
$ |
2.30 |
$ |
1.90 |
|||||
Effective tax rate from continuing operations (c) |
17.5 |
% |
16.8 |
% |
165.2 |
% |
16.6 |
% |
|||||
Performance Ratios |
|||||||||||||
Net interest margin (d) |
2.52 |
% |
2.91 |
% |
2.67 |
% |
2.94 |
% |
|||||
Noninterest income to total revenue |
38 |
% |
41 |
% |
40 |
% |
40 |
% |
|||||
Efficiency |
62 |
% |
62 |
% |
60 |
% |
63 |
% |
|||||
Return on: |
|||||||||||||
Average common shareholders’ equity |
30.11 |
% |
11.75 |
% |
19.15 |
% |
11.45 |
% |
|||||
Average assets |
3.21 |
% |
1.39 |
% |
2.11 |
% |
1.36 |
% |
|||||
(a) |
The Executive Summary and Consolidated Income Statement Review portions of this Financial Review section provide information regarding items impacting the comparability of the periods presented. |
(b) |
Dividends are payable quarterly other than Series O, Series R and Series S preferred stock, which are payable semiannually, with the Series O payable in different quarters than the Series R and Series S preferred stock. |
(c) |
The effective income tax rates are generally lower than the statutory rate due to the relationship of pretax income to tax credits and earnings that are not subject to tax. |
(d) |
Net interest margin is the total yield on interest-earning assets minus the total rate on interest-bearing liabilities and includes the benefit from use of noninterest-bearing sources. To provide more meaningful comparisons of net interest margins, we use net interest income on a taxable-equivalent basis in calculating average yields used in the calculation of net interest margin by increasing the interest income earned on tax-exempt assets to make it fully equivalent to interest income earned on taxable investments. This adjustment is not permitted under GAAP in the Consolidated Income Statement. For additional information, see Reconciliation of Taxable-Equivalent Net Interest Income (Non-GAAP) in the Statistical Information (Unaudited) section in Item 1 of this Report. |
The PNC Financial Services Group, Inc. – Form 10-Q 1
Table 1: Consolidated Financial Highlights (Continued) (a)
Unaudited |
June 30 2020 |
December 31 2019 |
June 30 2019 |
|||||||
Balance Sheet Data (dollars in millions, except per share data)
|
||||||||||
Assets |
$ |
458,978 |
$ |
410,295 |
$ |
405,761 |
||||
Loans |
$ |
258,236 |
$ |
239,843 |
$ |
237,215 |
||||
|
Allowance for loan and lease losses (b)
|
$ |
5,928 |
$ |
2,742 |
$ |
2,721 |
||||
Interest-earning deposits with banks (c) |
$ |
50,233 |
$ |
23,413 |
$ |
18,362 |
||||
Investment securities |
$ |
98,493 |
$ |
86,824 |
$ |
88,303 |
||||
Loans held for sale |
$ |
1,443 |
$ |
1,083 |
$ |
1,144 |
||||
Equity investments |
$ |
4,943 |
$ |
5,176 |
$ |
4,817 |
||||
|
Asset held for sale (d)
|
$ |
8,558 |
$ |
8,184 |
||||||
Mortgage servicing rights |
$ |
1,067 |
$ |
1,644 |
$ |
1,627 |
||||
Goodwill |
$ |
9,233 |
$ |
9,233 |
$ |
9,221 |
||||
Other assets |
$ |
34,920 |
$ |
32,202 |
$ |
34,193 |
||||
Noninterest-bearing deposits |
$ |
99,458 |
$ |
72,779 |
$ |
69,867 |
||||
Interest-bearing deposits |
$ |
246,539 |
$ |
215,761 |
$ |
203,393 |
||||
Total deposits |
$ |
345,997 |
$ |
288,540 |
$ |
273,260 |
||||
Borrowed funds |
$ |
47,026 |
$ |
60,263 |
$ |
69,025 |
||||
|
Allowance for unfunded lending related commitments (b)
|
$ |
662 |
$ |
318 |
$ |
291 |
||||
Total shareholders’ equity |
$ |
52,923 |
$ |
49,314 |
$ |
49,340 |
||||
Common shareholders’ equity |
$ |
48,928 |
$ |
45,321 |
$ |
45,349 |
||||
Accumulated other comprehensive income |
$ |
3,069 |
$ |
799 |
$ |
631 |
||||
Book value per common share |
$ |
115.26 |
$ |
104.59 |
$ |
101.53 |
||||
Period-end common shares outstanding (in millions) |
425 |
433 |
447 |
|||||||
Loans to deposits |
75 |
% |
83 |
% |
87 |
% |
||||
Common shareholders’ equity to total assets |
10.7 |
% |
11.0 |
% |
11.2 |
% |
||||
Client Assets (in billions)
|
||||||||||
Discretionary client assets under management |
$ |
151 |
$ |
154 |
$ |
162 |
||||
Nondiscretionary client assets under administration |
138 |
143 |
132 |
|||||||
Total client assets under administration |
289 |
297 |
294 |
|||||||
Brokerage account client assets |
53 |
54 |
52 |
|||||||
Total client assets |
$ |
342 |
$ |
351 |
$ |
346 |
||||
Basel III Capital Ratios (e) (f) |
||||||||||
Common equity Tier 1 |
11.3 |
% |
9.5 |
% |
9.7 |
% |
||||
Common equity Tier 1 fully implemented (g) |
10.9 |
% |
N/A |
N/A |
||||||
Tier 1 risk-based |
12.4 |
% |
10.7 |
% |
10.9 |
% |
||||
Total capital risk-based (h) |
14.9 |
% |
12.7 |
% |
12.8 |
% |
||||
Leverage |
9.4 |
% |
9.1 |
% |
9.6 |
% |
||||
Supplementary leverage |
9.3 |
% |
7.6 |
% |
8.0 |
% |
||||
Asset Quality |
||||||||||
Nonperforming loans to total loans |
.73 |
% |
.68 |
% |
.73 |
% |
||||
Nonperforming assets to total loans, OREO and foreclosed assets |
.76 |
% |
.73 |
% |
.78 |
% |
||||
Nonperforming assets to total assets |
.43 |
% |
.43 |
% |
.46 |
% |
||||
Net charge-offs to average loans (for the three months ended) (annualized) |
.35 |
% |
.35 |
% |
.24 |
% |
||||
|
Allowance for loan and lease losses to total loans (i)
|
2.30 |
% |
1.14 |
% |
1.15 |
% |
||||
Allowance for credit losses to total loans (i) (j) |
2.55 |
% |
1.28 |
% |
1.27 |
% |
||||
|
Allowance for loan and lease losses to nonperforming loans (i)
|
316 |
% |
168 |
% |
158 |
% |
||||
Accruing loans past due 90 days or more (in millions) |
$ |
456 |
$ |
585 |
$ |
524 |
||||
(a) |
The Executive Summary and Consolidated Balance Sheet Review portions of this Financial Review provide information regarding items impacting the comparability of the periods presented. |
(b) |
Amounts at June 30, 2020 reflect the impact of adopting Accounting Standards Update 2016-13 - Financial Instruments - Credit Losses, which is commonly referred to as the Current Expected Credit Losses (CECL) standard and our transition from an incurred loss methodology for these reserves to an expected credit loss methodology. See Note 1 Accounting Policies of this Report for additional information related to our adoption of this standard.
|
(c) |
Amounts include balances held with the Federal Reserve Bank of Cleveland (Federal Reserve Bank) of $50.0 billion, $23.2 billion and $18.1 billion as of June 30, 2020, December 31, 2019 and June 30, 2019, respectively.
|
2 The PNC Financial Services Group, Inc. – Form 10-Q
(d) |
Represents our held for sale investment in BlackRock, Inc. In the second quarter of 2020, PNC divested its entire investment in BlackRock. Prior period BlackRock investment balances have been reclassified to the Asset held for sale line in accordance with ASC 205-20, Presentation of Financial Statements - Discontinued Operations. Refer to Note 1 Accounting Policies and Note 2 Discontinued Operations for additional details. |
(e) |
All ratios are calculated using the regulatory capital methodology applicable to PNC during each period presented and calculated based on the standardized approach. See Basel III Capital discussion in the Capital Management portion of the Risk Management section of this Financial Review and the capital discussion in the Banking Regulation and Supervision section of Item 1 Business and Item 1A Risk Factors in our 2019 Form 10-K. |
(f) |
The June 30, 2020 ratios are calculated to reflect PNC's election to adopt the CECL optional five-year transition provision, unless noted differently. |
(g) |
The June 30, 2020 fully implemented CET1 ratio is calculated to reflect the full impact of CECL and excludes the benefits of the five-year transition provision. |
(h) |
The 2020 and 2019 Basel III Total risk-based capital ratios include nonqualifying trust preferred capital securities of $40 million and $60 million, respectively, that are subject to a phase-out period that runs through 2021. |
(i) |
Ratios at June 30, 2020 reflect the changes in methodology due to the adoption of the CECL accounting standard on January 1, 2020, along with increases in reserves during 2020 due to the significantly adverse economic impact of the pandemic and its resulting effects on loan portfolio credit quality and loan growth. |
(j) |
Calculated as the Allowance for loan and lease losses plus the Allowance for unfunded lending related commitments divided by total loans. |
EXECUTIVE SUMMARY
Headquartered in Pittsburgh, Pennsylvania, we are one of the largest diversified financial services companies in the United States (U.S.). We have businesses engaged in retail banking, including residential mortgage, corporate and institutional banking and asset management, providing many of our products and services nationally. Our retail branch network is located primarily in markets across the Mid-Atlantic, Midwest and Southeast. We also have strategic international offices in four countries outside the U.S.
Key Strategic Goals
At PNC we manage our company for the long term. We are focused on the fundamentals of growing customers, loans, deposits and revenue and improving profitability, while investing for the future and managing risk, expenses and capital. We continue to invest in our products, markets and brand, and embrace our commitments to our customers, shareholders, employees and the communities where we do business.
We strive to serve our customers and expand and deepen relationships by offering a broad range of deposit, credit and fee-based products and services. We are focused on delivering those products and services to our customers with the goal of addressing their financial objectives and putting customers’ needs first. Our business model is built on customer loyalty and engagement, understanding our customers’ financial goals and offering our diverse products and services to help them achieve financial well-being. Our approach is concentrated on organically growing and deepening client relationships across our businesses that meet our risk/return measures.
We are focused on our strategic priorities, which are designed to enhance value over the long term, and consist of:
• |
Expanding our leading banking franchise to new markets and digital platforms; |
• |
Deepening customer relationships by delivering a superior banking experience and financial solutions; and |
• |
Leveraging technology to innovate and enhance products, services, security and processes. |
Our capital priorities are to support customers and business investment, maintain appropriate capital in light of economic conditions, the Basel III framework, and other regulatory expectations, and return excess capital to shareholders. For more detail, see the Capital Highlights portion of this Executive Summary and the Liquidity and Capital Management portion of the Risk Management section of this Financial Review and the Supervision and Regulation section in Item 1 Business of our 2019 Form 10-K.
Economic Environment
The coronavirus (COVID-19) pandemic and public health response to contain it led to a severe recession in the first and second quarters of 2020, after the US economy reached a peak in economic activity in February 2020. Most measures of economic activity contracted with enormous declines in consumer spending, employment, retail sales, business investment, industrial production and corporate profitability. The unemployment rate peaked at 14.7% in April before declining in June 2020 to a still extremely elevated level of 11.1%. While economic conditions have started to improve, including a rebound in consumer spending and job growth, economic activity remains far below its pre-recession level with real GDP not expected to return to its pre-recession level until 2022. There is still a great deal of uncertainty about the length and severity of the pandemic and the strength or reversal of the economic rebound.
The Federal Reserve has undertaken extraordinary efforts to combat the economic weakness, reducing the federal funds rate 1.5 percentage points in March to a range of 0.00% to 0.25%. The central bank put downward pressure on long-term rates by expanding its balance sheet and purchasing long-term Treasury and mortgage-backed securities (“quantitative easing”). The Federal Reserve has also implemented multiple programs to support the flow of credit to businesses, consumers, and state and local governments, including, for the first time, direct purchases of corporate bonds and of bank loans to small and medium-sized businesses. In addition, the federal government has authorized $2.4 trillion in federal spending to support household incomes and businesses, including the $1.8 trillion Coronavirus Aid, Relief and Economic Security (CARES) Act.
The PNC Financial Services Group, Inc. – Form 10-Q 3
PNC is committed to putting our resources to work to support our customers, communities and the broader financial system. PNC is participating in the Paycheck Protection Program (PPP) under the CARES Act and funded $13.7 billion of PPP loans during the second quarter of 2020. We granted short-term loan modifications for loan customers experiencing hardships through extensions, deferrals, partial payments and forbearance. In addition, we have temporarily halted the majority of consumer real estate related foreclosures, while we continue to monitor the situation. See the Troubled Debt Restructurings and Loan Modifications in the Credit Risk Management portion of the Risk Management section of this Financial Review for details on our commercial and consumer loan modifications.
Our retail branch operations remain temporarily modified and have begun a gradual return to business as usual as we continue to prioritize the safety and well-being of our customers and employees. A majority of our branch locations have remained open and offer full in-branch services by appointment only, as well as options for ATM and, in equipped branches, drive-up services. Additionally, digital and call center channels have experienced elevated customer activity.
See the Recent Regulatory Developments section of this Financial Review as well as the Recent Regulatory Developments section in our first quarter 2020 Form 10-Q for additional detail on the CARES Act and other governmental responses to the COVID-19 pandemic and its economic and financial impacts. See also Risk Factors in Part II, Item 1A of our first quarter 2020 Form 10-Q for a description of the associated risks.
Sale of Equity Investment in BlackRock, Inc.
During the second quarter, we divested our entire 22.4% investment in BlackRock. PNC completed the sale of 31.6 million shares of BlackRock common and preferred stock through a registered secondary offering on May 15, 2020, and BlackRock repurchased 2.65 million shares from PNC. Total proceeds from the sale were $14.2 billion in cash, net of $.2 billion in expenses. The after-tax gain on the sale of $4.3 billion, and donation expense and BlackRock's results for all periods presented, are reported as discontinued operations. After completion of the registered secondary offering and BlackRock's share repurchase, PNC retained 500,000 shares of BlackRock common stock. These shares were donated to the PNC Foundation on May 18, 2020. As a result of the sale and donation, PNC and its affiliates only hold shares of BlackRock stock in a fiduciary capacity for clients of PNC and its affiliates. See Note 2 Discontinued Operations for additional details on our results and cash flows for the three and six months ended June 30, 2020 and 2019.
Income Statement Highlights
Results from continuing operations was a net loss of $744 million, or $1.90 loss per diluted common share for the second quarter of 2020, a decrease of $1.9 billion, compared to net income from continuing operations of $1.2 billion, or $2.47 per diluted common share, for the second quarter of 2019, driven by a higher provision for credit losses.
• |
Total revenue decreased $139 million, or 3%, to $4.1 billion.
|
• |
Net interest income of $2.5 billion increased $29 million, or 1%.
|
• |
Net interest margin decreased to 2.52% compared to 2.91% for the second quarter of 2019.
|
• |
Noninterest income decreased $168 million, or 10%, to $1.6 billion.
|
• |
Provision for credit losses of $2.5 billion, which was calculated under the Current Expected Credit Losses (CECL) accounting standard adopted January 1, 2020, increased $2.3 billion compared to the second quarter of 2019 reflecting the change in methodology together with the significantly adverse economic impact of the pandemic and its resulting effects on loan portfolio credit quality and loan growth.
|
• |
Noninterest expense decreased $96 million, or 4%, to $2.5 billion.
|
For additional detail, see the Consolidated Income Statement Review section of this Financial Review.
Balance Sheet Highlights
Our balance sheet was strong and well positioned at June 30, 2020 and December 31, 2019. In comparison to December 31, 2019:
• |
Total assets increased $48.7 billion, or 12%, to $459.0 billion.
|
• |
Total loans increased $18.4 billion, or 8%, to $258.2 billion.
|
• |
Total commercial loans grew $19.6 billion, or 12%, to $180.2 billion, reflecting PPP lending under the CARES Act and higher utilization of loan commitments driven by the economic impact of the pandemic on customer liquidity preferences.
|
• |
Total consumer loans decreased $1.2 billion, or 2%, to $78.0 billion.
|
• |
Investment securities increased $11.7 billion, or 13%, to $98.5 billion.
|
• |
Interest-earning deposits with banks, primarily with the Federal Reserve Bank, increased $26.8 billion to $50.2 billion due to higher liquidity from deposit growth and proceeds from the sale of our equity investment in BlackRock.
|
4 The PNC Financial Services Group, Inc. – Form 10-Q
• |
Total deposits increased $57.5 billion, or 20%, to $346.0 billion due to growth in commercial deposits reflecting pandemic-related accumulation of liquidity by customers and higher consumer deposits driven by government stimulus payments and lower consumer spending.
|
• |
Borrowed funds decreased $13.2 billion, or 22%, to $47.0 billion reflecting use of liquidity from deposit growth and proceeds from the sale of our equity investment in BlackRock.
|
For additional detail, see the Consolidated Balance Sheet Review section of this Financial Review.
Credit Quality Highlights
Credit quality metrics in the second quarter of 2020 reflected a challenging economic environment.
• |
At June 30, 2020 compared to December 31, 2019:
|
• |
Nonperforming assets of $2.0 billion increased $203 million, or 12%, driven by higher commercial nonperforming loans primarily related to industries economically impacted by the pandemic and the energy industry.
|
• |
Overall loan delinquencies of $1.3 billion decreased $194 million, or 13%, reflecting CARES Act and other forbearance and extension treatments. |
• |
Net charge-offs were $236 million, or .35% of average loans on an annualized basis, in the second quarter of 2020 compared to $142 million, or .24%, for the second quarter of 2019. Commercial loan net charge-offs increased $75 million and consumer loan net charge-offs increased $19 million.
|
• |
The allowance for credit losses increased to $6.6 billion, or 2.55% of total loans, at June 30, 2020, calculated under the CECL accounting standard adopted January 1, 2020, compared to $3.1 billion, or 1.28% of total loans, at December 31, 2019, due to the change in methodology together with the significantly adverse economic impact of the pandemic and its resulting effects on loan portfolio credit quality and loan growth. |
For additional detail, including the adoption of the CECL accounting standard and the significant economic impact of COVID-19, see the Credit Risk Management portion of the Risk Management section of this Financial Review.
Capital Highlights
We further strengthened our already strong capital position.
• |
The Basel III common equity Tier 1 (CET1) capital ratio increased to 11.3% at June 30, 2020 from 9.5% at December 31, 2019.
|
• |
The June 30, 2020 ratio reflects a capital increase due to proceeds from the sale of our equity investment in BlackRock, changes under the Tailoring Rules, effective January 1, 2020 for PNC, and our election of a five-year transition provision that delays CECL's estimated impact on CET1 capital, as defined by the rule. CECL's estimated impact on CET1 capital is defined as the change in retained earnings at adoption plus or minus 25% of the change in CECL Allowance for credit losses (ACL) at the balance sheet date compared to CECL ACL at transition. The estimated CECL impact is added to CET1 capital through December 31, 2021, then phased-out over the following three years.
|
• |
Common shareholders' equity increased 8% to $48.9 billion at June 30, 2020, compared to $45.3 billion at December 31, 2019.
|
• |
The PNC board of directors declared a quarterly cash dividend on common stock payable on August 5, 2020 of $1.15 per share, consistent with the second quarter dividend paid on May 5, 2020. |
• |
We announced on March 16, 2020 a temporary suspension of our common stock repurchase program in conjunction with the Federal Reserve's effort to support the U.S. economy during the pandemic, and will continue the suspension through the third quarter of 2020, with the exception of share repurchases to offset the effects of employee benefit plan-related issuances as permitted by recent guidance from the Federal Reserve. The estimated amount of these repurchases in the third quarter of 2020 is $100 million, but the timing and amount of executed repurchases will be based on market conditions and other factors. |
See the Liquidity and Capital Management portion of the Risk Management section of this Financial Review for more detail on our 2020 liquidity and capital actions as well as our capital ratios.
PNC’s ability to take certain capital actions, including returning capital to shareholders beginning in the fourth quarter of 2020, is subject to PNC meeting or exceeding a stress capital buffer established by the Federal Reserve Board in connection with the Federal Reserve Board's Comprehensive Capital Analysis and Review (CCAR) process. The Federal Reserve also has imposed limitations on capital distributions in the third quarter of 2020 by CCAR-participating bank holding companies and may extend these limitations, potentially in modified form. For additional information, see Capital Management in the Risk Management section in this Financial Review and the Supervision and Regulation section in Item 1 Business of our 2019 Form 10-K.
The PNC Financial Services Group, Inc. – Form 10-Q 5
Business Outlook
Our forward-looking financial statements are subject to the risk that economic and financial market conditions will be substantially different than those we are currently expecting and do not take into account potential legal and regulatory contingencies. These statements are based on our views, as follow:
• |
PNC’s baseline economic forecast is for an economic recovery in the second half of 2020 and into 2021, following a very severe but short recession in the first half of 2020. Consumers are increasing their spending and workers are returning to their job sites as states are gradually lifting restrictions on businesses and activities because of the COVID-19 pandemic; fiscal stimulus from the federal government is also supporting economic growth in mid-2020. After a significant contraction in real GDP, steep job losses, and a large increase in the unemployment rate earlier in the second quarter, economic growth has resumed and the labor market is improving. |
• |
In the baseline forecast, real GDP increases in the third quarter as consumers start to spend again. Fiscal stimulus and extremely low interest rates support the recovery. Real GDP surpasses its pre-recession peak in 2022, and growth is well above its long-term trend through 2023. |
• |
The baseline forecast assumes that the Federal Open Market Committee keeps the federal funds rate in its current range of 0.00% to 0.25% into 2023. |
Given the many unknowns and potential downside risks, including additional COVID-19 outbreaks, our forward-looking statements are subject to the risk that conditions will be substantially different than we are currently expecting. If efforts to contain COVID-19 are unsuccessful and restrictions on businesses and activities are reimposed or expanded, the economy could fall back into recession. The potential expiration of fiscal stimulus is also a major downside risk. The longer the labor market recovery takes, the more it will damage consumer fundamentals and sentiment. This could make the recovery weaker. Similarly, weak near-term growth could damage business fundamentals and an extended global recession due to COVID-19 would weaken the U.S. recovery. As a result, the outbreak and its consequences, including responsive measures to manage it, have had and are likely to continue to have an adverse effect, possibly materially, on our business and financial performance by adversely affecting, possibly materially, the demand and profitability of our products and services, the valuation of assets and our ability to meet the needs of our customers.
For the third quarter of 2020 compared to the second quarter of 2020, we expect:
• |
Average loans to decline in the low-single digits percentage range; |
• |
Net interest income to be down approximately 1%; |
• |
Noninterest income to be down between 3% and 5%, including our expectation for lower other noninterest income; |
• |
Noninterest expense to be flat to down; and |
• |
Net loan charge-offs to be between $250 million and $350 million. |
For the full year 2020, we expect total revenue and noninterest expense to each be down between 2% and 5% and we expect the 2020 effective tax rate to be in the low teens percentage range.
See the Cautionary Statement Regarding Forward-Looking Information section in this Financial Review and Item 1A Risk Factors in our first quarter 2020 Form 10-Q and 2019 Form 10-K for other factors that could cause future events to differ, perhaps materially, from those anticipated in these forward-looking statements.
CONSOLIDATED INCOME STATEMENT REVIEW
Our Consolidated Income Statement is presented in Part I, Item 1 of this Report.
Results from continuing operations for the second quarter of 2020 was a net loss of $744 million, or $1.90 diluted loss per common share, a decrease of $1.9 billion compared to net income from continuing operations of $1.2 billion, or $2.47 per diluted common share, for the second quarter of 2019. For the first six months of 2020, net income from continuing operations was $15 million, or $0.29 diluted loss per common share, compared to $2.3 billion, or $4.67 per diluted common share, for the first six months of 2019.
The second quarter loss was driven by a $2.3 billion increase in the provision for credit losses, calculated under the CECL accounting standard adopted January 1, 2020 and reflecting the change in methodology together with the significantly adverse economic impact of the pandemic and its resulting effects on loan portfolio credit quality and loan growth.
6 The PNC Financial Services Group, Inc. – Form 10-Q
Net Interest Income
Table 2: Summarized Average Balances and Net Interest Income (a)
2020 |
2019 |
||||||||||||||||||||||
Three months ended June 30 Dollars in millions |
Average
Balances
|
Average
Yields/
Rates
|
Interest
Income/
Expense
|
Average
Balances
|
Average
Yields/
Rates
|
Interest
Income/
Expense
|
|||||||||||||||||
Assets |
|||||||||||||||||||||||
Interest-earning assets |
|||||||||||||||||||||||
Investment securities |
$ |
88,430 |
2.41 |
% |
$ |
533 |
$ |
83,641 |
3.03 |
% |
$ |
635 |
|||||||||||
Loans |
268,114 |
3.37 |
% |
2,270 |
234,845 |
4.56 |
% |
2,693 |
|||||||||||||||
Interest-earning deposits with banks |
34,600 |
0.10 |
% |
9 |
13,469 |
2.38 |
% |
80 |
|||||||||||||||
Other |
10,867 |
2.26 |
% |
62 |
13,145 |
3.55 |
% |
116 |
|||||||||||||||
Total interest-earning assets/interest income |
$ |
402,011 |
2.85 |
% |
2,874 |
$ |
345,100 |
4.06 |
% |
3,524 |
|||||||||||||
Liabilities |
|||||||||||||||||||||||
Interest-bearing liabilities |
|||||||||||||||||||||||
Interest-bearing deposits |
$ |
241,445 |
.23 |
% |
141 |
$ |
201,234 |
1.03 |
% |
515 |
|||||||||||||
Borrowed funds |
53,229 |
1.39 |
% |
187 |
62,335 |
3.08 |
% |
484 |
|||||||||||||||
Total interest-bearing liabilities/interest expense |
$ |
294,674 |
.44 |
% |
328 |
$ |
263,569 |
1.51 |
% |
999 |
|||||||||||||
Net interest margin/income (Non-GAAP) |
2.52 |
% |
2,546 |
2.91 |
% |
2,525 |
|||||||||||||||||
Taxable-equivalent adjustments |
(19 |
) |
(27 |
) |
|||||||||||||||||||
Net interest income (GAAP) |
$ |
2,527 |
$ |
2,498 |
|||||||||||||||||||
2020 |
2019 |
||||||||||||||||||||||
Six months ended June 30 Dollars in millions |
Average
Balances
|
Average
Yields/
Rates
|
Interest
Income/
Expense
|
Average
Balances
|
Average
Yields/
Rates
|
Interest
Income/
Expense
|
|||||||||||||||||
Assets |
|||||||||||||||||||||||
Interest-earning assets |
|||||||||||||||||||||||
Investment securities |
$ |
86,426 |
2.59 |
% |
$ |
1,121 |
$ |
82,983 |
3.04 |
% |
$ |
1,262 |
|||||||||||
Loans |
255,843 |
3.71 |
% |
4,766 |
231,712 |
4.58 |
% |
5,315 |
|||||||||||||||
Interest-earning deposits with banks |
26,085 |
0.50 |
% |
65 |
14,238 |
2.41 |
% |
171 |
|||||||||||||||
Other |
10,167 |
2.84 |
% |
144 |
12,113 |
3.82 |
% |
231 |
|||||||||||||||
Total interest-earning assets/interest income |
$ |
378,521 |
3.21 |
% |
6,096 |
$ |
341,046 |
4.09 |
% |
6,979 |
|||||||||||||
Liabilities |
|||||||||||||||||||||||
Interest-bearing liabilities |
|||||||||||||||||||||||
Interest-bearing deposits |
$ |
228,390 |
.45 |
% |
516 |
$ |
198,540 |
1.00 |
% |
987 |
|||||||||||||
Borrowed funds |
55,209 |
1.80 |
% |
501 |
61,066 |
3.14 |
% |
965 |
|||||||||||||||
Total interest-bearing liabilities/interest expense |
$ |
283,599 |
.71 |
% |
1,017 |
$ |
259,606 |
1.50 |
% |
1,952 |
|||||||||||||
Net interest margin/income (Non-GAAP) |
2.67 |
% |
5,079 |
2.94 |
% |
5,027 |
|||||||||||||||||
Taxable-equivalent adjustments |
(41 |
) |
(54 |
) |
|||||||||||||||||||
Net interest income (GAAP) |
$ |
5,038 |
$ |
4,973 |
|||||||||||||||||||
(a) |
Interest income calculated as taxable-equivalent interest income. To provide more meaningful comparisons of interest income and yields for all interest-earning assets, as well as net interest margins, we use interest income on a taxable-equivalent basis in calculating average yields and net interest margins by increasing the interest income earned on tax-exempt assets to make it fully equivalent to interest income earned on taxable investments. This adjustment is not permitted under GAAP on the Consolidated Income Statement. For more information, see Reconciliation of Taxable-Equivalent Net Interest Income (Non-GAAP) in the Statistical Information (Unaudited) section in Item 1 of this Report. |
Changes in net interest income and margin result from the interaction of the volume and composition of interest-earning assets and related yields, interest-bearing liabilities and related rates paid, and noninterest-bearing sources of funding. See the Statistical Information (Unaudited) – Average Consolidated Balance Sheet And Net Interest Analysis section of this Report for additional information.
Net interest income increased $29 million, or 1%, and $65 million, or 1%, for the second quarter and first six months of 2020, respectively, compared with the same periods in 2019. The increase in both comparisons was driven by lower rates on borrowings and deposits and higher average loans, balances held with the Federal Reserve Bank and securities, partially offset by lower yields on interest-earning assets. Net interest margin in the quarterly comparison decreased 39 basis points reflecting the full quarter impact of the 1.5% reduction in the federal funds rate by the Federal Reserve in March 2020 and related changes in other short-term rates.
Average investment securities increased $4.8 billion, or 6%, in the quarterly comparison and $3.4 billion, or 4% in the year-to-date comparison. The increase in both comparisons was primarily due to increases in agency residential mortgage-backed securities and commercial mortgage-backed securities, partially offset by a decrease in U.S. Treasury and government agency securities.
The PNC Financial Services Group, Inc. – Form 10-Q 7
Average investment securities represented 22% of average interest-earning assets for the second quarter of 2020 and 23% for the first six months of 2020 compared to 24% for the same periods in 2019.
Average loans grew $33.3 billion, or 14%, and $24.1 billion, or 10%, in the quarterly and year-to-date comparisons, respectively. Loan growth was driven by an increase in both commercial and consumer loans. Average commercial loans increased by $29.2 billion and $19.2 billion in the respective comparisons, reflecting PPP lending under the CARES Act and higher utilization of loan commitments at the end of first quarter and extending through most of the second quarter 2020, driven by the economic impact of the pandemic on customer liquidity preferences.
Average consumer loans increased $4.1 billion and $4.9 billion in the quarterly and year-to-date comparisons, respectively. Growth in residential mortgage, auto, credit card, and unsecured installment loans was partially offset by declines in education loans due to runoff in the guaranteed government loan portfolio and home equity loan paydowns and payoffs that exceeded new origination volumes.
Average loans represented 67% and 68% of average interest-earning assets for the second quarter of 2020 and 2019, respectively, and 68% for the first six months of both 2020 and 2019.
Average interest-earning deposits with banks increased $21.1 billion and $11.8 billion in the respective quarterly and year-to-date comparisons, as average balances held with the Federal Reserve Bank increased due to higher liquidity from deposit growth and proceeds from the sale of our equity investment in BlackRock.
Average interest-bearing deposits grew $40.2 billion, or 20%, and $29.9 billion, or 15%, in the respective quarterly and year-to-date comparisons reflecting pandemic-related accumulation of customer liquidity as well as growth in commercial and consumer deposits and customers. In total, average interest-bearing deposits increased to 82% and 81% of average interest-bearing liabilities for the second quarter and first six months of 2020 compared to 76% for the same periods in 2019.
Average borrowed funds decreased $9.1 billion, or 15%, compared with the second quarter of 2019 and $5.9 billion, or 10%, compared with the first six months of 2019 primarily due to a decline in Federal Home Loan Bank (FHLB) borrowings and federal funds purchased reflecting use of liquidity from deposit growth and proceeds from the sale of our equity investment in BlackRock, partially offset by higher bank notes and senior and subordinated debt.
Further details regarding average loans and deposits are included in the Business Segments Review section of this Financial Review.
Noninterest Income
Table 3: Noninterest Income
Three months ended June 30 |
Six months ended June 30 |
||||||||||||||||||||||||||||||
Change |
Change |
||||||||||||||||||||||||||||||
Dollars in millions |
2020 |
2019 |
$ |
% |
2020 |
2019 |
$ |
% |
|||||||||||||||||||||||
Noninterest income |
|||||||||||||||||||||||||||||||
Asset management |
$ |
199 |
$ |
221 |
$ |
(22 |
) |
(10 |
)% |
$ |
400 |
$ |
433 |
$ |
(33 |
) |
(8 |
)% |
|||||||||||||
Consumer services |
330 |
392 |
(62 |
) |
(16 |
)% |
707 |
763 |
(56 |
) |
(7 |
)% |
|||||||||||||||||||
Corporate services |
512 |
484 |
28 |
6 |
% |
1,038 |
946 |
92 |
10 |
% |
|||||||||||||||||||||
Residential mortgage |
158 |
82 |
76 |
93 |
% |
368 |
147 |
221 |
150 |
% |
|||||||||||||||||||||
Service charges on deposits |
79 |
171 |
(92 |
) |
(54 |
)% |
247 |
339 |
(92 |
) |
(27 |
)% |
|||||||||||||||||||
Other |
271 |
367 |
(96 |
) |
(26 |
)% |
614 |
675 |
(61 |
) |
(9 |
)% |
|||||||||||||||||||
Total noninterest income |
$ |
1,549 |
$ |
1,717 |
$ |
(168 |
) |
(10 |
)% |
$ |
3,374 |
$ |
3,303 |
$ |
71 |
2 |
% |
||||||||||||||
Noninterest income as a percentage of total revenue was 38% and 41% for the second quarter of 2020 and 2019, respectively, and 40% for the first six months of both 2020 and 2019.
Asset management revenue declined due to the impact on fees of PNC's divestiture activity in 2019 of the recordkeeping retirement business and proprietary mutual funds. PNC's discretionary client assets under management decreased to $151 billion at June 30, 2020 from $162 billion at June 30, 2019, primarily as a result of our fourth quarter 2019 sale of PNC's proprietary mutual funds.
Consumer services revenue declined in the quarterly and year-to-date comparisons as a result of lower transaction volumes and activity reflecting lower consumer spending.
Service charges on deposits decreased in both comparisons due to lower transaction volumes and fees waived to assist customers as a result of the pandemic.
8 The PNC Financial Services Group, Inc. – Form 10-Q
Corporate services revenue in the quarterly and year-to-date comparison increased due to higher revenue from commercial mortgage banking activities and asset-backed finance structuring fees and loan syndication fees, partially offset by lower merger and acquisition advisory fees.
Residential mortgage revenue increased in the quarterly comparison due to higher loan sales revenue from higher origination volumes. Revenue increases in the year-to-date comparison were attributable to higher residential mortgage servicing rights (RMSR) hedging gains and loan sales revenue.
The decrease in other noninterest income in the quarterly and year-to-date comparisons was primarily attributable to negative valuation adjustments of private equity investments and the second quarter 2019 gain on the sale of the retirement recordkeeping business, partially offset by higher capital markets-related revenue, and higher net securities gains in the year-to-date comparison.
Noninterest Expense
Table 4: Noninterest Expense
Three months ended June 30 |
Six months ended June 30 |
||||||||||||||||||||||||||||||
Change |
Change |
||||||||||||||||||||||||||||||
Dollars in millions |
2020 |
2019 |
$ |
% |
2020 |
2019 |
$ |
% |
|||||||||||||||||||||||
Noninterest expense |
|||||||||||||||||||||||||||||||
Personnel |
$ |
1,373 |
$ |
1,365 |
$ |
8 |
1 |
% |
$ |
2,742 |
$ |
2,779 |
$ |
(37 |
) |
(1 |
)% |
||||||||||||||
Occupancy |
199 |
212 |
(13 |
) |
(6 |
)% |
406 |
427 |
(21 |
) |
(5 |
)% |
|||||||||||||||||||
Equipment |
301 |
298 |
3 |
1 |
% |
588 |
571 |
17 |
3 |
% |
|||||||||||||||||||||
Marketing |
47 |
83 |
(36 |
) |
(43 |
)% |
105 |
148 |
(43 |
) |
(29 |
)% |
|||||||||||||||||||
Other |
595 |
653 |
(58 |
) |
(9 |
)% |
1,217 |
1,264 |
(47 |
) |
(4 |
)% |
|||||||||||||||||||
Total noninterest expense |
$ |
2,515 |
$ |
2,611 |
$ |
(96 |
) |
(4 |
)% |
$ |
5,058 |
$ |
5,189 |
$ |
(131 |
) |
(3 |
)% |
|||||||||||||
The decrease in noninterest expense in the quarterly and year-to-date comparisons reflected lower business activity related to the economic impact of the pandemic, including lower marketing expense and costs associated with business travel. In the year-to-date comparison, personnel expense declined due to variable costs associated with decreased business activity, partially offset by higher equipment expense related to technology investments.
Effective Income Tax Rate
The effective income tax rate from continuing operations was 17.5% in the second quarter of 2020 compared to 16.8% in the second quarter of 2019 and 165.2% in the first six months of 2019 compared to 16.6% in the same period in 2019.
Provision For Credit Losses
Table 5: Provision for Credit Losses
Three months ended June 30 |
Six months ended June 30 |
||||||||||||||||
Dollars in millions |
2020 |
2019 |
2020 |
2019 |
|||||||||||||
Provision for credit losses |
|||||||||||||||||
Loans and leases |
$ |
2,220 |
$ |
180 |
$ |
3,172 |
$ |
369 |
|||||||||
Unfunded lending related commitments (a) |
212 |
165 |
|||||||||||||||
Investment securities |
30 |
30 |
|||||||||||||||
Other financial assets |
1 |
10 |
|||||||||||||||
Total provision for credit losses |
$ |
2,463 |
$ |
180 |
$ |
3,377 |
$ |
369 |
|||||||||
(a) For the three and six months ended June 30, 2019, the provision for unfunded lending related commitments was included in the provision for loans and leases.
The provision for credit losses increased $2.3 billion and $3.0 billion for the second quarter and first six months of 2020, respectively, compared with the same periods in 2019. The provision in the 2020 periods was calculated under the CECL accounting standard adopted January 1, 2020 and the increase in both the quarterly and year-to-date comparison reflects the change in methodology together with the significantly adverse economic impact of the pandemic and its resulting effects on loan portfolio credit quality and loan growth.
The Credit Risk Management portion of the Risk Management section of this Financial Review includes additional information regarding factors impacting the provision for credit losses.
The PNC Financial Services Group, Inc. – Form 10-Q 9
Net Income from Discontinued Operations
Table 6: Discontinued Operations
The following table summarizes net income from our investment in BlackRock, which is now reported as discontinued operations as a result of the divestiture.
Three months ended June 30 |
Six months ended June 30 |
||||||||||||||||
Dollars in millions |
2020 |
2019 |
2020 |
2019 |
|||||||||||||
Net income from discontinued operations |
$ |
4,399 |
$ |
189 |
$ |
4,555 |
$ |
378 |
|||||||||
For additional details on the divestiture of our equity investment in BlackRock, see the Executive Summary within this Financial Review and Note 2 Discontinued Operations in the Notes To Consolidated Financial Statements of this Report.
CONSOLIDATED BALANCE SHEET REVIEW
Table 7: Summarized Balance Sheet Data
June 30 |
December 31 |
Change |
||||||||||||
Dollars in millions |
2020 |
2019 |
$ |
% |
||||||||||
Assets |
||||||||||||||
Interest-earning deposits with banks |
$ |
50,233 |
$ |
23,413 |
$ |
26,820 |
115 |
% |
||||||
Loans held for sale |
1,443 |
1,083 |
360 |
33 |
% |
|||||||||
Asset held for sale (a) |
8,558 |
(8,558 |
) |
(100 |
)% |
|||||||||
Investment securities |
98,493 |
86,824 |
11,669 |
13 |
% |
|||||||||
Loans |
258,236 |
239,843 |
18,393 |
8 |
% |
|||||||||
Allowance for loan and lease losses (b) |
(5,928 |
) |
(2,742 |
) |
(3,186 |
) |
(116 |
)% |
||||||
Mortgage servicing rights |
1,067 |
1,644 |
(577 |
) |
(35 |
)% |
||||||||
Goodwill |
9,233 |
9,233 |
— |
— |
||||||||||
Other |
46,201 |
42,439 |
3,762 |
9 |
% |
|||||||||
Total assets |
$ |
458,978 |
$ |
410,295 |
$ |
48,683 |
12 |
% |
||||||
Liabilities |
||||||||||||||
Deposits |
$ |
345,997 |
$ |
288,540 |
$ |
57,457 |
20 |
% |
||||||
Borrowed funds |
47,026 |
60,263 |
(13,237 |
) |
(22 |
)% |
||||||||
Allowance for unfunded lending related commitments (b) |
662 |
318 |
344 |
108 |
% |
|||||||||
Other |
12,345 |
11,831 |
514 |
4 |
% |
|||||||||
Total liabilities |
406,030 |
360,952 |
45,078 |
12 |
% |
|||||||||
Equity |
||||||||||||||
Total shareholders’ equity |
52,923 |
49,314 |
3,609 |
7 |
% |
|||||||||
Noncontrolling interests |
25 |
29 |
(4 |
) |
(14 |
)% |
||||||||
Total equity |
52,948 |
49,343 |
3,605 |
7 |
% |
|||||||||
Total liabilities and equity |
$ |
458,978 |
$ |
410,295 |
$ |
48,683 |
12 |
% |
||||||
(a) |
Represents our held for sale investment in BlackRock. In the second quarter of 2020, PNC divested its entire investment in BlackRock. Prior period BlackRock investment balances have been reclassified to the Asset held for sale line in accordance with ASC 205-20, Presentation of Financial Statements - Discontinued Operations. Refer to Note 1 Accounting Policies and Note 2 Discontinued Operations for additional details. |
(b) |
Amounts as of June 30, 2020 reflect the impact of adopting the CECL accounting standard and our transition from an incurred loss methodology for these reserves to an expected credit loss methodology. Prior period amounts represent ALLL under the incurred loss methodology. Refer to Note 1 Accounting Policies in this Report for additional detail on the adoption of this standard. |
The summarized balance sheet data in Table 7 is based upon our Consolidated Balance Sheet in Part I, Item 1 of this Report.
Our balance sheet was strong and well positioned at both June 30, 2020 and December 31, 2019.
• |
Total assets increased as a result of higher interest-earning deposits with banks, primarily the Federal Reserve Bank, loan growth, and higher investment securities; |
• |
Total liabilities increased primarily due to deposit growth reflecting pandemic-related accumulation of liquidity by customers partially offset by lower FHLB borrowings and federal funds purchased; |
• |
Total equity increased as higher retained earnings driven by the gain on sale of our equity investment in BlackRock and higher accumulated other comprehensive income (AOCI) was partially offset by share repurchases, dividends on common and preferred stock, and the day-one effect of adopting the CECL accounting standard. |
10 The PNC Financial Services Group, Inc. – Form 10-Q
The ACL related to loans totaled $6.6 billion at June 30, 2020, an increase of $3.5 billion since December 31, 2019. The increase was attributable to the $.6 billion day-one CECL transition adjustment and a $3.3 billion provision for credit losses, partially offset by net charge-offs of $.4 billion. The provision reflects the significantly adverse economic impact of the pandemic and its resulting effects on loan portfolio credit quality and loan growth. See the following for additional information related to our ACL related to loans:
• |
Allowance for Credit Losses in the Credit Risk Management section of this Financial Review, and |
• |
Note 1 Accounting Policies and Note 4 Loans and Related Allowance for Credit Losses in the Notes To Consolidated Financial Statements included in this Report.
|
The following discussion provides additional information about the major components of our balance sheet. Information regarding our capital and regulatory compliance is included in the Liquidity and Capital Management portion of the Risk Management section in this Financial Review and in Note 18 Regulatory Matters in the Notes To Consolidated Financial Statements included in our 2019 Form 10-K.
Loans
Table 8: Loans
June 30 |
December 31 |
Change |
||||||||||||
Dollars in millions |
2020 |
2019 |
$ |
% |
||||||||||
Commercial |
||||||||||||||
Commercial and industrial |
$ |
144,335 |
$ |
125,337 |
$ |
18,998 |
15 |
% |
||||||
Commercial real estate |
28,763 |
28,110 |
653 |
2 |
% |
|||||||||
Equipment lease financing |
7,097 |
7,155 |
(58 |
) |
(1 |
)% |
||||||||
Total commercial |
180,195 |
160,602 |
19,593 |
12 |
% |
|||||||||
Consumer |
||||||||||||||
Home equity |
24,879 |
25,085 |
(206 |
) |
(1 |
)% |
||||||||
Residential real estate |
22,469 |
21,821 |
648 |
3 |
% |
|||||||||
Automobile |
16,157 |
16,754 |
(597 |
) |
(4 |
)% |
||||||||
Credit card |
6,575 |
7,308 |
(733 |
) |
(10 |
)% |
||||||||
Education |
3,132 |
3,336 |
(204 |
) |
(6 |
)% |
||||||||
Other consumer |
4,829 |
4,937 |
(108 |
) |
(2 |
)% |
||||||||
Total consumer |
78,041 |
79,241 |
(1,200 |
) |
(2 |
)% |
||||||||
Total loans |
$ |
258,236 |
$ |
239,843 |
$ |
18,393 |
8 |
% |
||||||
Commercial loan growth reflected the impact of PPP lending under the CARES Act and higher utilization of loan commitments driven by the economic impact of the pandemic on customer liquidity preferences. PNC funded $13.7 billion of PPP loans during the second quarter of 2020, which benefited over 73,000 of our customers. At June 30, 2020, we had $12.8 billion of PPP loans in our commercial loan balance.
For commercial and industrial loans by industry and commercial real estate loans by geography and property type, see Loan Portfolio Characteristics and Analysis in the Credit Risk Management portion of the Risk Management section of this Financial Review.
Consumer loans declined as new originations decreased due to the economic impact of the pandemic and lower customer spending. Residential mortgage loans increased as the low interest rate environment resulted in an increase in origination volumes primarily of nonconforming loans, which are loans that do not meet agency standards as a result of exceeding agency conforming loan limits.
For information on our home equity and residential real estate portfolios, including loans by geography, and our auto loan portfolio, see Loan Portfolio Characteristics and Analysis in the Credit Risk Management portion of the Risk Management section in this Financial Review.
For additional information regarding our loan portfolio see Note 1 Accounting Policies and Note 4 Loans and Related Allowance for Credit Losses in the Notes To Consolidated Financial Statements included in this Report.
Investment Securities
Investment securities of $98.5 billion at June 30, 2020 increased $11.7 billion, or 13%, compared to December 31, 2019, due primarily to net purchases and an increase in the fair value of agency residential mortgage-backed and U.S. Treasury securities.
The PNC Financial Services Group, Inc. – Form 10-Q 11
The level and composition of the investment securities portfolio fluctuates over time based on many factors including market conditions, loan and deposit growth, and balance sheet management activities. We manage our investment securities portfolio to optimize returns, while providing a reliable source of liquidity for our banking and other activities, considering the Liquidity Coverage Ratio (LCR) and other internal and external guidelines and constraints. During the first half of 2020, $16.2 billion of debt securities were transferred from held to maturity to available for sale, including $49 million in the second quarter of 2020 pursuant to elections made under recently adopted accounting standards. See further discussion in Note 1 Accounting Policies.
Table 9: Investment Securities
June 30, 2020 |
December 31, 2019 |
Ratings (a) as of June 30, 2020 |
|||||||||||||||||||||||||||||
Dollars in millions |
Amortized
Cost (b)
|
Fair
Value
|
Amortized
Cost
|
Fair
Value
|
AAA/
AA
|
A |
BBB |
BB and Lower |
No
Rating
|
||||||||||||||||||||||
U.S. Treasury and government agencies |
$ |
20,040 |
$ |
21,119 |
$ |
16,926 |
$ |
17,348 |
100 |
% |
|||||||||||||||||||||
Agency residential mortgage-backed |
55,630 |
57,480 |
50,266 |
50,984 |
100 |
% |
|||||||||||||||||||||||||
Non-agency residential mortgage-backed |
1,472 |
1,682 |
1,648 |
1,954 |
13 |
% |
1 |
% |
2 |
% |
47 |
% |
37 |
% |
|||||||||||||||||
Agency commercial mortgage-backed |
3,002 |
3,140 |
3,153 |
3,178 |
100 |
% |
|||||||||||||||||||||||||
Non-agency commercial mortgage-backed (c) |
4,134 |
4,039 |
3,782 |
3,806 |
85 |
% |
1 |
% |
5 |
% |
1 |
% |
8 |
% |
|||||||||||||||||
Asset-backed (d) |
5,312 |
5,368 |
5,096 |
5,166 |
91 |
% |
2 |
% |
6 |
% |
1 |
% |
|||||||||||||||||||
Other (e) |
5,512 |
5,839 |
4,580 |
4,771 |
67 |
% |
23 |
% |
8 |
% |
2 |
% |
|||||||||||||||||||
Total investment securities (f) |
$ |
95,102 |
$ |
98,667 |
$ |
85,451 |
$ |
87,207 |
96 |
% |
1 |
% |
1 |
% |
1 |
% |
1 |
% |
|||||||||||||
(a) |
Ratings percentages allocated based on amortized cost, net of allowance for securities. |
(b) |
Amortized cost is presented net of applicable allowance for securities of $32 million at June 30, 2020 in accordance with the adoption of the CECL accounting standard. See the Recently Adopted Accounting Standards portion of Note 1 Accounting Policies for additional detail on the adoption of this ASU.
|
(c) |
Collateralized primarily by retail properties, office buildings, lodging properties and multifamily housing. |
(d) |
Collateralized primarily by corporate debt, government guaranteed education loans and other consumer credit products. |
(e) |
Includes state and municipal securities. |
(f) |
Includes available for sale and held to maturity securities, which are recorded on our balance sheet at fair value and amortized cost, respectively. |
Table 9 presents the distribution of our total investment securities portfolio by amortized cost and fair value, as well as by credit rating. We have included credit ratings information because we believe that the information is an indicator of the degree of credit risk to which we are exposed. Changes in credit ratings classifications could indicate increased or decreased credit risk and could be accompanied by a reduction or increase in the fair value of our investment securities portfolio. We continually monitor the credit risk in our portfolio and maintain the allowance for securities at an appropriate level to absorb expected credit losses on our investment securities portfolio for the remaining contractual term of the securities adjusted for expected prepayments. See Note 1 Accounting Policies and Note 3 Investment Securities in the Notes To Consolidated Financial Statements for additional details regarding the methodology for determining the allowance and the amount of the allowance for investment securities, respectively.
The duration of investment securities was 2 years at June 30, 2020. We estimate that at June 30, 2020 the effective duration of investment securities was 2.5 years for an immediate 50 basis points parallel increase in interest rates and 1.5 years for an immediate 50 basis points parallel decrease in interest rates.
Based on expected prepayment speeds, the weighted-average expected maturity of the investment securities portfolio was 3.3 years at June 30, 2020 compared to 4.1 years at December 31, 2019.
Table 10: Weighted-Average Expected Maturities of Mortgage and Asset-Backed Debt Securities
June 30, 2020 |
Years |
||
Agency residential mortgage-backed |
3.0 |
||
Non-agency residential mortgage-backed |
6.4 |
||
Agency commercial mortgage-backed |
3.5 |
||
Non-agency commercial mortgage-backed |
2.6 |
||
Asset-backed |
2.1 |
||
Additional information regarding our investment securities is included in Note 3 Investment Securities and Note 12 Fair Value in the Notes To Consolidated Financial Statements included in this Report.
12 The PNC Financial Services Group, Inc. – Form 10-Q
Funding Sources
Table 11: Details of Funding Sources
June 30 |
December 31 |
Change |
||||||||||||
Dollars in millions |
2020 |
2019 |
$ |
% |
||||||||||
Deposits |
||||||||||||||
Noninterest-bearing |
$ |
99,458 |
$ |
72,779 |
$ |
26,679 |
37 |
% |
||||||
Interest-bearing |
||||||||||||||
Money market |
62,688 |
54,115 |
8,573 |
16 |
% |
|||||||||
Demand |
85,379 |
71,692 |
13,687 |
19 |
% |
|||||||||
Savings |
77,252 |
68,291 |
8,961 |
13 |
% |
|||||||||
Time deposits |
21,220 |
21,663 |
(443 |
) |
(2 |
)% |
||||||||
Total interest-bearing deposits |
246,539 |
215,761 |
30,778 |
14 |
% |
|||||||||
Total deposits |
345,997 |
288,540 |
57,457 |
20 |
% |
|||||||||
Borrowed funds |
||||||||||||||
FHLB borrowings |
8,500 |
16,341 |
(7,841 |
) |
(48 |
)% |
||||||||
Bank notes and senior debt |
27,704 |
29,010 |
(1,306 |
) |
(5 |
)% |
||||||||
Subordinated debt |
6,500 |
6,134 |
366 |
6 |
% |
|||||||||
Other |
4,322 |
8,778 |
(4,456 |
) |
(51 |
)% |
||||||||
Total borrowed funds |
47,026 |
60,263 |
(13,237 |
) |
(22 |
)% |
||||||||
Total funding sources |
$ |
393,023 |
$ |
348,803 |
$ |
44,220 |
13 |
% |
||||||
Growth in both interest-bearing and noninterest-bearing deposits reflected pandemic-related accumulation of liquidity by commercial and consumer customers, including from government stimulus payments and lower consumer spending. In addition, there was a shift from interest-bearing to noninterest-bearing deposits in the first six months of 2020 that reflected the impact of the current interest rate environment.
Borrowed funds decreased due to lower FHLB borrowings, federal funds purchased included in other borrowed funds and bank notes and senior debt, reflecting the use of liquidity from deposit growth and proceeds from the sale of our equity investment in BlackRock.
The level and composition of borrowed funds fluctuates over time based on many factors including market conditions, loan, investment securities and deposit growth, and capital considerations. We manage our borrowed funds to provide a reliable source of liquidity for our banking and other activities, considering our LCR requirements and other internal and external guidelines and constraints.
See the Liquidity and Capital Management portion of the Risk Management section of this Financial Review for additional information regarding our 2020 liquidity and capital activities. See Note 8 Borrowed Funds in the Notes to Consolidated Financial Statements in Item 1 of this Report for additional information related to our borrowings.
Shareholders’ Equity
Total shareholders’ equity was $52.9 billion at June 30, 2020, an increase of $3.6 billion compared to December 31, 2019. The increase resulted from net income of $4.6 billion driven by the gain on sale of our equity investment in BlackRock and higher AOCI of $2.3 billion, partially offset by common share repurchases of $1.3 billion, common and preferred stock dividends of $1.1 billion, and a day-one transition adjustment of $.7 billion for the adoption of the CECL accounting standard.
PNC announced on March 16, 2020 a temporary suspension of its common stock repurchase program in conjunction with the Federal Reserve's effort to support the U.S. economy during the pandemic, and will continue the suspension through the third quarter of 2020, with the exception of share repurchases to offset the effects of employee benefit plan-related issuances as permitted by recent guidance from the Federal Reserve. The estimated amount of these repurchases in the third quarter of 2020 is $100 million, but the timing and amount of executed repurchases will be based on market conditions and other factors.
The PNC Financial Services Group, Inc. – Form 10-Q 13
BUSINESS SEGMENTS REVIEW
We have three reportable business segments:
• |
Retail Banking |
• |
Corporate & Institutional Banking |
• |
Asset Management Group |
Business segment results and a description of each business are included in Note 15 Segment Reporting in the Notes To Consolidated Financial Statements in this Report. Certain amounts included in this Business Segments Review differ from those amounts shown in Note 15, primarily due to the presentation in this Financial Review of business net interest income on a taxable-equivalent basis.
During the second quarter, we divested our entire 22.4% investment in BlackRock. See Note 2 Discontinued Operations in the Notes To Consolidated Financial Statements in this Report for additional information on the sale and details on our results and cash flows for the three and six months ended June 30, 2020 and 2019. Following the sale and donation, PNC and its affiliates only hold shares of BlackRock stock in a fiduciary capacity for clients of PNC and its affiliates.
Net interest income in business segment results reflects our internal funds transfer pricing methodology. Assets receive a funding charge and liabilities and capital receive a funding credit based on a transfer pricing methodology that incorporates product repricing characteristics, tenor and other factors.
Total business segment financial results differ from total consolidated net income. The impact of these differences is reflected in the “Other” category as shown in Table 81 in Note 15 Segment Reporting in Item 1 of this Report. “Other” includes residual activities that do not meet the criteria for disclosure as a separate reportable business, such as asset and liability management activities including net securities gains or losses, ACL for investment securities, certain trading activities, certain runoff consumer loan portfolios, private equity investments, intercompany eliminations, certain corporate overhead, tax adjustments that are not allocated to business segments, exited businesses, and differences between business segment performance reporting and financial statement reporting (GAAP), including the presentation of net income attributable to noncontrolling interests as the segments’ results exclude their portion of net income attributable to noncontrolling interests.
See the Executive Summary of this Financial Review for our discussion of the impact of COVID-19 related developments on our business and operations, including COVID-19 relief efforts for our customers. We have granted loan modifications through extensions, deferrals, and forbearance to assist our customers in need during the pandemic. See Loan Modifications in the Troubled Debt Restructurings and Loan Modifications section of Credit Risk Management for details on our commercial and consumer loan modifications.
14 The PNC Financial Services Group, Inc. – Form 10-Q
Retail Banking
Retail Banking's core strategy is to acquire and retain customers who maintain their primary checking and transaction relationships with us. We seek to deepen relationships by meeting the broad range of our customers’ financial needs with savings, liquidity, lending, investment and retirement solutions. A strategic priority for us is to differentiate the customer experience and drive transformation and automation. A key element of our strategy is to expand the use of lower-cost alternative distribution channels, with an emphasis on digital capabilities, while continuing to optimize the traditional branch network. In addition, we have a disciplined process to continually improve the engagement of both our employees and customers, which is a strong driver of customer growth, retention and relationship expansion.
Table 12: Retail Banking Table
(Unaudited) |
||||||||||||||
Six months ended June 30 |
Change |
|||||||||||||
Dollars in millions, except as noted |
2020 |
2019 |
$ |
% |
||||||||||
Income Statement |
||||||||||||||
Net interest income |
$ |
2,846 |
$ |
2,725 |
$ |
121 |
4 |
% |
||||||
Noninterest income |
1,373 |
1,252 |
121 |
10 |
% |
|||||||||
Total revenue |
4,219 |
3,977 |
242 |
6 |
% |
|||||||||
Provision for credit losses |
1,206 |
209 |
997 |
477 |
% |
|||||||||
Noninterest expense |
3,036 |
2,995 |
41 |
1 |
% |
|||||||||
Pretax earnings |
(23 |
) |
773 |
(796 |
) |
(103 |
)% |
|||||||
Income taxes (benefit) |
(1 |
) |
184 |
(185 |
) |
(101 |
)% |
|||||||
Earnings |
$ |
(22 |
) |
$ |
589 |
$ |
(611 |
) |
(104 |
)% |
||||
Average Balance Sheet |
||||||||||||||
Loans held for sale |
$ |
804 |
$ |
498 |
$ |
306 |
61 |
% |
||||||
Loans |
||||||||||||||
Consumer |
||||||||||||||
Home equity |
$ |
22,763 |
$ |
22,804 |
$ |
(41 |
) |
— |
% |
|||||
Residential real estate |
18,104 |
15,388 |
2,716 |
18 |
% |
|||||||||
Automobile |
16,892 |
14,917 |
1,975 |
13 |
% |
|||||||||
Credit card |
6,948 |
6,291 |
657 |
10 |
% |
|||||||||
Education |
3,281 |
3,740 |
(459 |
) |
(12 |
)% |
||||||||
Other consumer |
2,494 |
2,123 |
371 |
17 |
% |
|||||||||
Total consumer |
70,482 |
65,263 |
5,219 |
8 |
% |
|||||||||
Commercial |
12,068 |
10,471 |
1,597 |
15 |
% |
|||||||||
Total loans |
$ |
82,550 |
$ |
75,734 |
$ |
6,816 |
9 |
% |
||||||
Total assets |
$ |
99,583 |
$ |
91,805 |
$ |
7,778 |
8 |
% |
||||||
Deposits |
||||||||||||||
Noninterest-bearing demand |
$ |
35,680 |
$ |
30,956 |
$ |
4,724 |
15 |
% |
||||||
Interest-bearing demand |
45,102 |
42,607 |
2,495 |
6 |
% |
|||||||||
Money market |
22,903 |
26,283 |
(3,380 |
) |
(13 |
)% |
||||||||
Savings |
65,364 |
54,596 |
10,768 |
20 |
% |
|||||||||
Certificates of deposit |
11,947 |
12,543 |
(596 |
) |
(5 |
)% |
||||||||
Total deposits |
$ |
180,996 |
$ |
166,985 |
$ |
14,011 |
8 |
% |
||||||
Performance Ratios |
||||||||||||||
Return on average assets |
(.04 |
)% |
1.29 |
% |
||||||||||
Noninterest income to total revenue |
33 |
% |
31 |
% |
||||||||||
Efficiency |
72 |
% |
75 |
% |
||||||||||
The PNC Financial Services Group, Inc. – Form 10-Q 15
Six months ended June 30 |
Change |
|||||||||||||
Dollars in millions, except as noted |
2020 |
2019 |
$ |
% |
||||||||||
Supplemental Noninterest Income Information |
||||||||||||||
Consumer services |
$ |
687 |
$ |
751 |
$ |
(64 |
) |
(9 |
)% |
|||||
Residential mortgage |
$ |
368 |
$ |
147 |
$ |
221 |
150 |
% |
||||||
Service charges on deposits |
$ |
246 |
$ |
326 |
$ |
(80 |
) |
(25 |
)% |
|||||
Residential Mortgage Information |
||||||||||||||
Residential mortgage servicing statistics (in billions, except as noted) (a) |
||||||||||||||
Serviced portfolio balance (b) |
$ |
122 |
$ |
124 |
$ |
(2 |
) |
(2 |
)% |
|||||
Serviced portfolio acquisitions |
$ |
13 |
$ |
6 |
$ |
7 |
117 |
% |
||||||
MSR asset value (b) |
$ |
0.6 |
$ |
1.0 |
$ |
(.4 |
) |
(40 |
)% |
|||||
MSR capitalization value (in basis points) (b) |
47 |
80 |
(33 |
) |
(41 |
)% |
||||||||
Servicing income: (in millions) |
||||||||||||||
Servicing fees, net (c) |
$ |
80 |
$ |
95 |
$ |
(15 |
) |
(16 |
)% |
|||||
Mortgage servicing rights valuation, net of economic hedge |
$ |
121 |
$ |
(2 |
) |
$ |
123 |
* |
||||||
Residential mortgage loan statistics |
||||||||||||||
Loan origination volume (in billions) |
$ |
7.4 |
$ |
4.6 |
$ |
2.8 |
61 |
% |
||||||
Loan sale margin percentage |
3.45 |
% |
2.28 |
% |
||||||||||
Percentage of originations represented by: |
||||||||||||||
Purchase volume (d) |
35 |
% |
55 |
% |
||||||||||
Refinance volume |
65 |
% |
45 |
% |
||||||||||
Other Information (b) |
||||||||||||||
Customer-related statistics (average) |
||||||||||||||
Non-teller deposit transactions (e) |
61 |
% |
56 |
% |
||||||||||
Digital consumer customers (f) |
72 |
% |
69 |
% |
||||||||||
Credit-related statistics |
||||||||||||||
Nonperforming assets (g) |
$ |
1,037 |
$ |
1,074 |
$ |
(37 |
) |
(3 |
)% |
|||||
Net charge-offs - loans and leases |
$ |
308 |
$ |
252 |
$ |
56 |
22 |
% |
||||||
Other statistics |
||||||||||||||
ATMs |
9,058 |
9,072 |
(14 |
) |
— |
% |
||||||||
Branches (h) |
2,256 |
2,321 |
(65 |
) |
(3 |
)% |
||||||||
Brokerage account client assets (in billions) (i) |
$ |
53 |
$ |
52 |
$ |
1 |
2 |
% |
||||||
* - Not Meaningful
(a) |
Represents mortgage loan servicing balances for third parties and the related income. |
(b) |
Presented as of June 30, except for customer-related statistics, which are averages for the six months ended, and net charge-offs, which are for the six months ended.
|
(c) |
Servicing fees net of impact of decrease in MSR value due to passage of time, including the impact from both regularly scheduled loan payments, prepayments, and loans that were paid down or paid off during the period.
|
(d) |
Mortgages with borrowers as part of residential real estate purchase transactions.
|
(e) |
Percentage of total consumer and business banking deposit transactions processed at an ATM or through our mobile banking application.
|
(f) |
Represents consumer checking relationships that process the majority of their transactions through non-teller channels.
|
(g) |
Primarily nonperforming loans of $1.0 billion and $1.1 billion for June 30, 2020 and June 30, 2019, respectively.
|
(h) |
Excludes stand-alone mortgage offices and satellite offices (e.g., drive-ups, electronic branches and retirement centers) that provide limited products and/or services.
|
(i) |
Includes cash and money market balances. |
Retail Banking had a loss of $22 million in the first six months of 2020 compared with earnings of $589 million for the same period in 2019. The decrease in earnings was attributable to higher provision for credit losses and increased noninterest expense partially offset by higher noninterest income and net interest income.
Net interest income increased primarily due to growth in loan and deposit balances and wider interest rate spreads on the value of loans, partially offset by narrower interest rate spreads on the value of deposits.
Noninterest income increased largely due to growth in residential mortgage revenue attributable to higher results from residential mortgage servicing rights valuation, net of economic hedge, and increased loan sales revenue from higher origination volumes partially offset by service charges on deposits and consumer services fees reflecting lower transaction volumes, fees waived to assist customers in the pandemic and lower consumer spending. The increase in noninterest income was also driven by lower negative derivative fair value adjustments related to Visa Class B common shares of $24 million for the first six months of 2020 compared with the negative adjustments of $47 million for the same period in 2019.
16 The PNC Financial Services Group, Inc. – Form 10-Q
Provision for credit losses increased in the first six months of 2020 compared to the same period in 2019 reflecting changes in methodology due to the adoption of the CECL accounting standard, together with the significantly adverse economic impact of the pandemic.
Higher noninterest expense primarily resulted from higher personnel, equipment and branch-related expenses, partially offset by lower advertising and marketing.
The deposit strategy of Retail Banking is to remain disciplined on pricing and focused on growing and retaining relationship-based balances, executing on market-specific deposit growth strategies and providing a source of low-cost funding and liquidity to PNC. In the first six months of 2020, average total deposits increased compared to the same period in 2019 primarily driven by savings deposits which increased due, in part, to a shift from money market deposits to relationship-based savings products as well as growth in demand deposits. Savings and demand deposits also benefited from the impact of government stimulus payments and lower consumer spending due to the pandemic.
Retail Banking average total loans increased in the first six months of 2020 compared with the same period in 2019.
• |
Average residential mortgages increased primarily as a result of growth in nonconforming residential mortgage loans and a robust refinance market driven by historically low interest rates. |
• |
Average auto loans increased primarily due to strong new indirect auto loan volumes, including in our Southeast and expansion markets. |
• |
Average commercial loans increased primarily due to PPP loans. |
• |
Average credit card balances increased as we continued to focus on our long-term objective of deepening penetration within our existing customer base as well as new client acquisition. |
• |
Average unsecured installment loans increased primarily driven by growth in originations through digital channels. |
• |
Average education loans decreased driven by a decline in the runoff portfolio of government guaranteed education loans. |
• |
Average home equity loans decreased as paydowns and payoffs on loans exceeded new originated volume. |
In 2018, we launched our national expansion strategy designed to grow customers with digitally-led banking and an ultra-thin branch network in markets outside of our existing retail branch network and began offering a digital high yield savings deposit product and opened our first solution center in Kansas City. Solution centers are an emerging branch operating model with a distinctive layout, where routine transactions are supported through a combination of technology and skilled banker assistance to create personalized experiences. The primary focus of the solution center is to bring a community element to our digital banking capabilities. The solution center provides a collaborative environment that connects our customers with our digital solutions and banking services, beyond deposits and withdrawals. Deposit products are led by a digital high yield savings account. Following the first solution center opening in 2018, four additional solution centers opened in 2019 with a second in Kansas City and three in the Dallas/Fort Worth market. We also offer digital unsecured installment and small business loans in the expansion markets. We continue to execute our national expansion strategy in 2020 including physical expansion into three new markets, Boston, Houston, and Nashville. The first solution centers in Houston and Nashville were opened successfully in July. The first solution center in Boston is on track to open later in the year.
Retail Banking continues to enhance the customer experience with refinements to product and service offerings that drive value for consumers and small businesses. We are focused on meeting the financial needs of our customers by providing a broad range of liquidity, banking and investment products. Retail Banking also continued to execute on its strategy of transforming the customer experience through transaction channel migration, branch network and home lending process transformations and multi-channel engagement and service strategies. We are also continually assessing our current branch network for optimization opportunities as usage of alternative channels has increased.
• |
Approximately 72% of consumer customers used non-teller channels for the majority of their transactions in the first six months of 2020 compared with 69% for the same period in 2019.
|
• |
Deposit transactions via ATM and mobile channels increased to 61% of total deposit transactions in the first six months of 2020 from 56% for the same period in 2019.
|
Retail Banking continues to make progress on its multi-year initiative to redesign the home lending process, including integrating mortgage and home equity lending into a common platform. Technology enhancements supported increased residential mortgage origination volume. In addition, we enhanced the home equity origination process to make it easier and to reach additional customers by offering the product in new states. The improvements and expansion are planned to continue throughout 2020.
The PNC Financial Services Group, Inc. – Form 10-Q 17
Corporate & Institutional Banking
Corporate & Institutional Banking’s strategy is to be the leading relationship-based provider of traditional banking products and services to its customers through the economic cycles. We aim to grow our market share and drive higher returns by delivering value-added solutions that help our clients better run their organizations, all while maintaining prudent risk and expense management. We continue to focus on building client relationships where the risk-return profile is attractive.
Table 13: Corporate & Institutional Banking Table
(Unaudited) |
||||||||||||||
Six months ended June 30 |
Change |
|||||||||||||
Dollars in millions |
2020 |
2019 |
$ |
% |
||||||||||
Income Statement |
||||||||||||||
Net interest income |
$ |
2,030 |
$ |
1,815 |
$ |
215 |
12 |
% |
||||||
Noninterest income |
1,420 |
1,237 |
183 |
15 |
% |
|||||||||
Total revenue |
3,450 |
3,052 |
398 |
13 |
% |
|||||||||
Provision for credit losses |
2,043 |
171 |
1,872 |
1,095 |
% |
|||||||||
Noninterest expense |
1,395 |
1,384 |
11 |
1 |
% |
|||||||||
Pretax earnings |
12 |
1,497 |
(1,485 |
) |
(99 |
)% |
||||||||
Income taxes |
— |
343 |
(343 |
) |
(100 |
)% |
||||||||
Earnings |
$ |
12 |
$ |
1,154 |
$ |
(1,142 |
) |
(99 |
)% |
|||||
Average Balance Sheet |
||||||||||||||
Loans held for sale |
$ |
550 |
$ |
338 |
$ |
212 |
63 |
% |
||||||
Loans |
||||||||||||||
Commercial |
||||||||||||||
Commercial and industrial |
$ |
128,139 |
$ |
111,186 |
$ |
16,953 |
15 |
% |
||||||
Commercial real estate |
26,848 |
26,098 |
750 |
3 |
% |
|||||||||
Equipment lease financing |
7,051 |
7,274 |
(223 |
) |
(3 |
)% |
||||||||
Total commercial |
162,038 |
144,558 |
17,480 |
12 |
% |
|||||||||
Consumer |
9 |
18 |
(9 |
) |
(50 |
)% |
||||||||
Total loans |
$ |
162,047 |
$ |
144,576 |
$ |
17,471 |
12 |
% |
||||||
Total assets |
$ |
185,878 |
$ |
160,551 |
$ |
25,327 |
16 |
% |
||||||
Deposits |
||||||||||||||
Noninterest-bearing demand |
$ |
46,904 |
$ |
39,156 |
$ |
7,748 |
20 |
% |
||||||
Interest-bearing demand |
24,388 |
18,267 |
$ |
6,121 |
34 |
% |
||||||||
Money market |
32,532 |
26,292 |
6,240 |
24 |
% |
|||||||||
Other |
8,706 |
5,830 |
2,876 |
49 |
% |
|||||||||
Total deposits |
$ |
112,530 |
$ |
89,545 |
$ |
22,985 |
26 |
% |
||||||
Performance Ratios |
||||||||||||||
Return on average assets |
.01 |
% |
1.45 |
% |
||||||||||
Noninterest income to total revenue |
41 |
% |
41 |
% |
||||||||||
Efficiency |
40 |
% |
45 |
% |
||||||||||
Other Information |
||||||||||||||
Consolidated revenue from: (a) |
||||||||||||||
Treasury Management (b) |
$ |
960 |
$ |
912 |
$ |
48 |
5 |
% |
||||||
Capital Markets (b) |
$ |
732 |
$ |
559 |
$ |
173 |
31 |
% |
||||||
Commercial mortgage banking activities: |
||||||||||||||
Commercial mortgage loans held for sale (c) |
$ |
71 |
$ |
35 |
$ |
36 |
103 |
% |
||||||
Commercial mortgage loan servicing income (d) |
136 |
119 |
17 |
14 |
% |
|||||||||
Commercial mortgage servicing rights valuation, net of economic hedge (e) |
42 |
16 |
26 |
163 |
% |
|||||||||
Total |
$ |
249 |
$ |
170 |
$ |
79 |
46 |
% |
||||||
Commercial mortgage servicing rights asset value (f) |
$ |
490 |
$ |
630 |
$ |
(140 |
) |
(22 |
)% |
|||||
Average Loans by C&IB business |
||||||||||||||
Corporate Banking |
$ |
84,846 |
$ |
72,736 |
$ |
12,110 |
17 |
% |
||||||
Real Estate |
39,746 |
36,752 |
2,994 |
8 |
% |
|||||||||
Business Credit |
23,597 |
22,306 |
1,291 |
6 |
% |
|||||||||
Commercial Banking |
9,246 |
8,099 |
1,147 |
14 |
% |
|||||||||
Other |
4,612 |
4,683 |
(71 |
) |
(2 |
)% |
||||||||
Total average loans |
$ |
162,047 |
$ |
144,576 |
$ |
17,471 |
12 |
% |
||||||
Credit-related statistics |
||||||||||||||
Nonperforming assets (f) (g) |
$ |
674 |
$ |
497 |
$ |
177 |
36 |
% |
||||||
Net charge-offs - loans and leases |
$ |
149 |
$ |
28 |
$ |
121 |
432 |
% |
||||||
(a) |
See the additional revenue discussion regarding treasury management, capital markets-related products and services, and commercial mortgage banking activities in the Product Revenue section of this Corporate & Institutional Banking section. |
(b) |
Amounts are reported in net interest income and noninterest income. |
(c) |
Represents other noninterest income for valuations on commercial mortgage loans held for sale and related commitments, derivative valuations, originations fees, gains on sale of loans held for sale and net interest income on loans held for sale. |
(d) |
Represents net interest income and noninterest income (primarily in corporate service fees) from loan servicing net of reduction in commercial mortgage servicing rights due to amortization expense and payoffs. Commercial mortgage servicing rights valuation, net of economic hedge is shown separately. |
(e) |
Amounts are reported in corporate service fees. |
(f) |
As of June 30.
|
(g) |
Primarily nonperforming loans of $.7 billion and $.5 billion at June 30, 2020 and June 30, 2019, respectively.
|
18 The PNC Financial Services Group, Inc. – Form 10-Q
Corporate & Institutional Banking earned $12 million in the first six months of 2020 compared to $1.2 billion for the same period in 2019. Higher provision for credit losses was partially offset by higher revenue.
Net interest income increased in the comparison, primarily due to higher average loan and deposit balances, partially offset by narrower interest rate spreads on the value of deposits.
Growth in noninterest income in the comparison reflected broad-based increases including higher capital markets-related revenue and higher revenue from commercial mortgage banking activities.
Provision for credit losses increased in the first six months of 2020 compared to the same period in 2019 reflecting changes in methodology due to the adoption of the CECL accounting standard, together with the significantly adverse economic impact of the pandemic and its resulting effects on loan portfolio credit quality and loan growth.
The first six months of 2020 experienced an increase in nonperforming assets and net loan and lease charge-offs compared to the same period in 2019 primarily related to industries economically impacted by the pandemic and the energy industry.
Noninterest expense increased in the comparison largely due to investments in strategic initiatives, mostly offset by lower variable costs associated with decreased business activity related to the pandemic.
Average loans increased in the comparison across all businesses primarily due to increased utilization of loan commitments driven by the economic impact of the pandemic on customer liquidity preferences and the impact of PPP loan originations:
• |
Corporate Banking provides lending, treasury management and capital markets-related products and services to mid-sized and large corporations, and government and not-for-profit entities. Average loans for this business grew reflecting increased utilization and new production, including PPP loan originations. |
• |
PNC Real Estate provides banking, financing and servicing solutions for commercial real estate clients across the country. Average loans for this business increased primarily driven by higher commercial mortgage and multifamily agency warehouse lending, partially offset by project loan payoffs. |
• |
Business Credit provides asset-based lending. The loan portfolio is relatively high yielding, with acceptable risk as the loans are mainly secured by short-term assets. Average loans for this business increased primarily due to new originations, partially offset by lower utilization. |
• |
Commercial Banking provides lending, treasury management and capital markets-related products and services to smaller corporations and businesses. Average loans for this business increased primarily driven by PPP loan originations. |
The deposit strategy of Corporate & Institutional Banking is to remain disciplined on pricing and focused on growing and retaining relationship-based balances over time, executing on customer and segment-specific deposit growth strategies and continuing to provide funding and liquidity to PNC. Average total deposits increased in the comparison reflecting customers maintaining liquidity due to the economic impact of the pandemic. We continue to actively monitor the interest rate environment and make adjustments in response to evolving market conditions, bank funding needs and client relationship dynamics.
Corporate & Institutional Banking continues to expand its Corporate Banking business, focused on the middle market and larger sectors. We are continuing to execute on our expansion plans into the Seattle and Portland markets in 2020. This follows offices opened in Boston and Phoenix in 2019, Denver, Houston and Nashville in 2018, and Dallas, Kansas City and Minneapolis in 2017. These locations complement Corporate & Institutional Banking national businesses with a significant presence in these cities, and build on past successes in the markets where PNC’s retail banking presence was limited, such as in the Southeast. Our full suite of commercial products and services is offered in these locations.
Product Revenue
In addition to credit and deposit products for commercial customers, Corporate & Institutional Banking offers other services, including treasury management, capital markets-related products and services, and commercial mortgage banking activities, for customers of all business segments. On a consolidated basis, the revenue from these other services is included in net interest income, corporate service fees and other noninterest income. From a business perspective, the majority of the revenue and expense related to these services is reflected in the Corporate & Institutional Banking segment results and the remainder is reflected in the results of other businesses. The Other Information section in Table 13 includes the consolidated revenue to PNC for these services. A discussion of the consolidated revenue from these services follows.
The Treasury Management business provides payables, receivables, deposit and account services, liquidity and investments, and online and mobile banking products and services to our clients. Treasury management revenue is reported in noninterest income and net interest income. Noninterest income includes treasury management product revenue less earnings credits provided to customers on compensating deposit balances used to pay for products and services. Net interest income primarily includes revenue from all treasury
The PNC Financial Services Group, Inc. – Form 10-Q 19
management customer deposit balances. Compared with the first six months of 2019, treasury management revenue increased primarily due to higher deposit balances, partially offset by narrower interest rate spreads on the value of deposits.
Capital markets-related products and services include foreign exchange, derivatives, securities underwriting, loan syndications, mergers and acquisitions advisory and equity capital markets advisory related services. The increase in capital markets-related revenue in the comparison was broad-based across most products and services and included higher underwriting fees and fees on customer-related derivatives activities.
Commercial mortgage banking activities include revenue derived from commercial mortgage servicing (both net interest income and noninterest income) and revenue derived from commercial mortgage loans held for sale and related hedges. Total revenue from commercial mortgage banking activities increased in the comparison due to higher revenue across all activities.
20 The PNC Financial Services Group, Inc. – Form 10-Q
Asset Management Group
Asset Management Group is focused on being a premier bank-held individual and institutional asset manager in each of the markets it serves. The business seeks to deliver high quality banking, trust and investment management services to our high net worth, ultra high net worth and institutional client sectors through a broad array of products and services. Asset Management Group’s priorities are to serve our clients' financial objectives, grow and deepen customer relationships and deliver solid financial performance with prudent risk and expense management.
Table 14: Asset Management Group Table
(Unaudited) |
||||||||||||||
Six months ended June 30 |
Change |
|||||||||||||
Dollars in millions, except as noted |
2020 |
2019 |
$ |
% |
||||||||||
Income Statement |
||||||||||||||
Net interest income |
$ |
177 |
$ |
138 |
$ |
39 |
28 |
% |
||||||
Noninterest income |
408 |
503 |
(95 |
) |
(19 |
)% |
||||||||
Total revenue |
585 |
641 |
(56 |
) |
(9 |
)% |
||||||||
Provision for credit losses |
42 |
(1 |
) |
43 |
* |
|||||||||
Noninterest expense |
436 |
479 |
(43 |
) |
(9 |
)% |
||||||||
Pretax earnings |
107 |
163 |
(56 |
) |
(34 |
)% |
||||||||
Income taxes |
25 |
38 |
(13 |
) |
(34 |
)% |
||||||||
Earnings |
$ |
82 |
$ |
125 |
$ |
(43 |
) |
(34 |
)% |
|||||
Average Balance Sheet |
||||||||||||||
Loans |
||||||||||||||
Consumer |
||||||||||||||
Residential real estate |
$ |
2,511 |
$ |
1,758 |
$ |
753 |
43 |
% |
||||||
Other consumer |
4,013 |
4,289 |
(276 |
) |
(6 |
)% |
||||||||
Total consumer |
6,524 |
6,047 |
477 |
8 |
% |
|||||||||
Commercial |
869 |
741 |
128 |
17 |
% |
|||||||||
Total loans |
$ |
7,393 |
$ |
6,788 |
$ |
605 |
9 |
% |
||||||
Total assets |
$ |
7,880 |
$ |
7,204 |
$ |
676 |
9 |
% |
||||||
Deposits |
||||||||||||||
Noninterest-bearing demand |
$ |
1,445 |
$ |
1,368 |
$ |
77 |
6 |
% |
||||||
Interest-bearing demand |
7,296 |
2,983 |
4,313 |
145 |
% |
|||||||||
Money market |
1,653 |
1,910 |
(257 |
) |
(13 |
)% |
||||||||
Savings |
7,297 |
5,799 |
1,498 |
26 |
% |
|||||||||
Other |
785 |
747 |
38 |
5 |
% |
|||||||||
Total deposits |
$ |
18,476 |
$ |
12,807 |
$ |
5,669 |
44 |
% |
||||||
Performance Ratios |
||||||||||||||
Return on average assets |
2.10 |
% |
3.50 |
% |
||||||||||
Noninterest income to total revenue |
70 |
% |
78 |
% |
||||||||||
Efficiency |
75 |
% |
75 |
% |
||||||||||
Supplemental Noninterest Income Information |
||||||||||||||
Asset management fees |
$ |
400 |
$ |
433 |
$ |
(33 |
) |
(8 |
)% |
|||||
Other Information |
||||||||||||||
Nonperforming assets (a) (b) |
$ |
38 |
$ |
45 |
$ |
(7 |
) |
(16 |
)% |
|||||
Net charge-offs (recoveries) - loans and leases |
$ |
(1 |
) |
$ |
1 |
$ |
(2 |
) |
(200 |
)% |
||||
Client Assets Under Administration (in billions) (a) (c)
|
||||||||||||||
Discretionary client assets under management |
$ |
151 |
$ |
162 |
$ |
(11 |
) |
(7 |
)% |
|||||
Nondiscretionary client assets under administration |
138 |
132 |
6 |
5 |
% |
|||||||||
Total |
$ |
289 |
$ |
294 |
$ |
(5 |
) |
(2 |
)% |
|||||
Discretionary client assets under management |
||||||||||||||
Personal |
$ |
94 |
$ |
99 |
$ |
(5 |
) |
(5 |
)% |
|||||
Institutional |
57 |
63 |
(6 |
) |
(10 |
)% |
||||||||
Total |
$ |
151 |
$ |
162 |
$ |
(11 |
) |
(7 |
)% |
|||||
* - Not meaningful
(a) |
As of June 30.
|
(b) |
Primarily nonperforming loans of $38 million at June 30, 2020 and $45 million at June 30, 2019.
|
(c) |
Excludes brokerage account client assets. |
Asset Management Group earned $82 million in the first six months of 2020 compared with earnings of $125 million for the same period in 2019. Earnings decreased due to lower revenue and higher provision for credit losses, partially offset by lower noninterest expense.
The PNC Financial Services Group, Inc. – Form 10-Q 21
Net interest income increased due to higher average loan and deposit balances partially offset by narrower interest rate spreads on the value of deposits.
Noninterest income decreased due to lower asset management fees resulting from the impact of 2019 divestiture activities and the 2019 gain on the sale of the retirement recordkeeping business.
Noninterest expense decreased in the comparison and was primarily attributable to the impact of the 2019 divestitures.
Provision for credit losses increased reflecting changes in methodology due to the adoption of the CECL accounting standard, together with the significantly adverse economic impact of the pandemic.
Asset Management Group’s discretionary client assets under management decreased in comparison to the prior year primarily attributable to the sale of components of the PNC Capital Advisors investment management business.
The Asset Management Group strives to be the leading relationship-based provider of investment, planning, banking and fiduciary services to wealthy individuals and institutions by proactively delivering value-added ideas, solutions and exceptional service.
Wealth Management and Hawthorn have nearly 100 offices operating in six out of the ten most affluent states in the U.S. with a majority co-located with retail banking branches. The businesses provide customized investments, planning, trust and estate administration and private banking solutions to affluent individuals and ultra-affluent families.
Institutional Asset Management provides outsourced chief investment officer, custody, private real estate, cash and fixed income client solutions, and fiduciary retirement advisory services to institutional clients including corporations, healthcare systems, insurance companies, unions, municipalities, and non-profits.
RISK MANAGEMENT
The Risk Management section included in Item 7 of our 2019 Form 10-K describes our enterprise risk management framework including risk culture, enterprise strategy, risk governance and framework, risk identification, risk assessment, risk controls and monitoring, and risk aggregation and reporting. Additionally, our 2019 Form 10-K provides an analysis of our key areas of risk, which include but are not limited to credit, liquidity and capital, market, operational, compliance and information security.
Credit Risk Management
Credit risk represents the possibility that a customer, counterparty or issuer may not perform in accordance with contractual terms. Credit risk is inherent in the financial services business and results from extending credit to customers, purchasing securities, and entering into financial derivative transactions and certain guarantee contracts. Credit risk is one of our most significant risks. Our processes for managing credit risk are embedded in our risk culture and in our decision-making processes using a systematic approach whereby credit risks and related exposures are identified and assessed, managed through specific policies and processes, measured and evaluated against our risk appetite and credit concentration limits, and reported, along with specific mitigation activities, to management and the Board of Directors through our governance structure. Our most significant concentration of credit risk is in our loan portfolio.
22 The PNC Financial Services Group, Inc. – Form 10-Q
Loan Portfolio Characteristics and Analysis
Table 15: Details of Loans
In billions
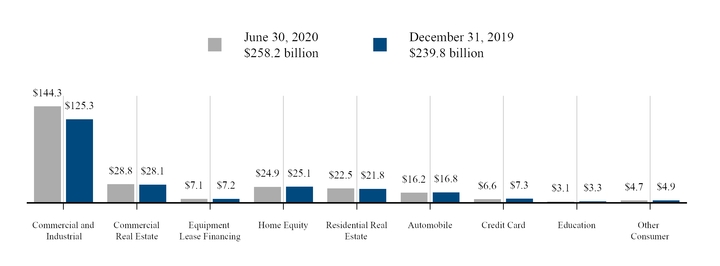
We use several credit quality indicators, as further detailed in Note 4 Loans and Related Allowance for Credit Losses in the Notes To Consolidated Financial Statements in this Report, to monitor and measure our exposure to credit risk within our loan portfolio. The following provides additional information about our significant loan classes.
Commercial
Commercial and Industrial
Commercial and industrial loans comprised 56% and 52% of our total loan portfolio at June 30, 2020 and December 31, 2019, respectively. The majority of our commercial and industrial loans are secured by collateral that provides a secondary source of repayment for the loan should the borrower experience cash generation difficulties. Examples of this collateral include short-term assets, such as accounts receivable, inventory and securities, and long-lived assets, such as equipment, real estate and other business assets.
We actively manage our commercial and industrial loans to assess any changes (both positive and negative) in the level of credit risk at both the borrower and portfolio level. To evaluate the level of credit risk, we assign internal risk ratings reflecting our estimates of the borrower’s probability of default (PD) and loss given default (LGD) for each related credit facility. This two-dimensional credit risk rating methodology provides granularity in the risk monitoring process and is updated on an ongoing basis through our credit risk management processes. In addition to monitoring the level of credit risk, we also monitor concentrations of credit risk pertaining to both specific industries and geography that may exist in our portfolio. Our commercial and industrial portfolio is well-diversified as shown in the following table which provides a breakout by industry classification (classified based on the North American Industry Classification System (NAICS)).
Table 16: Commercial and Industrial Loans by Industry
June 30, 2020 |
December 31, 2019 |
||||||||||||||
Dollars in millions |
Amount |
% of Total |
Amount |
% of Total |
|||||||||||
Commercial and industrial |
|||||||||||||||
Manufacturing |
$ |
25,590 |
18 |
% |
$ |
21,540 |
17 |
% |
|||||||
Retail/wholesale trade |
21,747 |
15 |
21,565 |
17 |
|||||||||||
Service providers |
21,347 |
15 |
16,112 |
13 |
|||||||||||
Real estate related (a) |
14,634 |
10 |
12,346 |
10 |
|||||||||||
Financial services |
13,596 |
9 |
11,318 |
9 |
|||||||||||
Health care |
10,109 |
7 |
8,035 |
6 |
|||||||||||
Transportation and warehousing |
7,771 |
5 |
7,474 |
6 |
|||||||||||
Other industries |
29,541 |
21 |
26,947 |
22 |
|||||||||||
Total commercial and industrial loans |
$ |
144,335 |
100 |
% |
$ |
125,337 |
100 |
% |
|||||||
(a) Represents loans to customers in the real estate and construction industries.
The PNC Financial Services Group, Inc. – Form 10-Q 23
Commercial and industrial loan increases at June 30, 2020 were driven by loan growth, including the impact of PPP lending under the CARES Act and higher utilization of loan commitments driven by the economic impact of the pandemic on customer liquidity preferences. See the Commercial High Impact Industries discussion within this Credit Risk Management for additional discussion of the impact of COVID-19 on our commercial portfolio and how we are evaluating and monitoring the portfolio for elevated levels of credit risk.
Commercial Real Estate
Commercial real estate loans comprised $17.5 billion related to commercial mortgages, $6.4 billion of real estate project loans and $4.9 billion of intermediate term financing loans as of June 30, 2020. Comparable amounts were $17.0 billion, $5.6 billion and $5.5 billion, respectively, as of December 31, 2019.
We monitor credit risk associated with our commercial real estate loans similar to commercial and industrial loans by analyzing PD and LGD. Additionally, risks associated with these types of credit activities tend to be correlated to the loan structure, collateral location, project progress and business environment. These attributes are also monitored and utilized in assessing credit risk. The portfolio is geographically diverse due to the nature of our business involving clients throughout the U.S. The following table presents our commercial real estate loans by geography and property type.
Table 17: Commercial Real Estate Loans by Geography and Property Type
June 30, 2020 |
December 31, 2019 |
||||||||||||||
Dollars in millions |
Amount |
% of Total |
Amount |
% of Total |
|||||||||||
Geography (a) |
|||||||||||||||
California |
$ |
4,524 |
16 |
% |
$ |
4,393 |
16 |
% |
|||||||
Florida |
2,863 |
10 |
2,557 |
9 |
|||||||||||
Texas |
1,847 |
6 |
1,717 |
6 |
|||||||||||
Maryland |
1,771 |
6 |
1,889 |
7 |
|||||||||||
Virginia |
1,577 |
5 |
1,547 |
6 |
|||||||||||
Pennsylvania |
1,351 |
5 |
1,310 |
4 |
|||||||||||
Ohio |
1,280 |
4 |
1,307 |
4 |
|||||||||||
New Jersey |
1,209 |
4 |
1,106 |
4 |
|||||||||||
Illinois |
999 |
4 |
1,001 |
4 |
|||||||||||
North Carolina |
961 |
3 |
1,015 |
4 |
|||||||||||
Other |
10,381 |
37 |
10,268 |
36 |
|||||||||||
Total commercial real estate loans |
$ |
28,763 |
100 |
% |
$ |
28,110 |
100 |
% |
|||||||
Property Type |
|||||||||||||||
Multifamily |
$ |
9,326 |
32 |
% |
$ |
9,003 |
32 |
% |
|||||||
Office |
7,785 |
27 |
7,641 |
27 |
|||||||||||
Retail |
3,615 |
13 |
3,702 |
13 |
|||||||||||
Industrial/Warehouse |
2,069 |
7 |
2,003 |
7 |
|||||||||||
Hotel/Motel |
1,923 |
7 |
1,813 |
7 |
|||||||||||
Senior Housing |
1,309 |
5 |
1,123 |
4 |
|||||||||||
Mixed Use |
905 |
3 |
943 |
3 |
|||||||||||
Other |
1,831 |
6 |
1,882 |
7 |
|||||||||||
Total commercial real estate loans |
$ |
28,763 |
100 |
% |
$ |
28,110 |
100 |
% |
|||||||
(a) |
Presented in descending order based on loan balances at June 30, 2020.
|
Commercial High Impact Industries
In light of the current economic circumstances related to COVID-19, we are evaluating and monitoring our entire commercial portfolio for elevated levels of credit risk; however, we believe the industry sectors most likely to be impacted by the effects of the pandemic are:
• |
Non-real estate related |
• |
Leisure recreation: restaurants, casinos, hotels, convention centers |
• |
Non-essential retail: retail excluding auto, gas, staples |
• |
Healthcare facilities: elective, private practices |
• |
Consumer services: religious organizations, childcare |
• |
Leisure travel: cruise, airlines, other travel/transportation |
• |
Other impacted areas: shipping, senior living, specialty education |
24 The PNC Financial Services Group, Inc. – Form 10-Q
• |
Real estate related |
• |
Non-essential retail and restaurants: malls, lifestyle centers, outlets, restaurants |
• |
Hotel: full service, limited service, extended stay |
• |
Senior housing: assisted living, independent living |
As of June 30, 2020, our outstanding loan balances in these industries totaled $19.6 billion, or approximately 8% of our total loan portfolio, while additional unfunded loan commitments totaled $9.2 billion. We continue to carefully monitor and manage these loans, and while we have not yet experienced material charge-offs in these industries, we expect to see charge-offs increase over time if the current economic trends continue.
In our non-real estate related category we have $11.5 billion in loans outstanding, $2.0 billion of which are funded through the PPP and guaranteed by the Small Business Administration (SBA) under the CARES Act. Nonperforming loans in these industries totaled $.1 billion, or .9% of total loans outstanding in the non-real estate related category, while criticized assets totaled $1.0 billion at June 30, 2020 with the greatest stress seen in the leisure recreation and leisure travel sectors.
Within the commercial real estate related category, we have $8.1 billion in loans outstanding which includes real estate projects of $4.8 billion. Nonperforming loans in this category totaled $.1 billion at June 30, 2020, or 1.2% of total loans outstanding in the commercial real estate related category, driven primarily by one real estate investment trust related loan. In this category, we continue to see substantial stress in the non-essential retail and hotel segments.
Oil and Gas Loan Portfolio
We are also monitoring our oil and gas portfolio closely for elevated levels of credit risk given the continued pressures on the energy industry. As of June 30, 2020, our outstanding loans in the oil and gas sector totaled $4.1 billion or 1.6% of total loans, which includes $.1 billion funded through the PPP and guaranteed by the SBA under the CARES Act. This portfolio comprised approximately $1.9 billion in the midstream and downstream sectors, $1.1 billion of oil services companies and $1.1 billion related to exploration and production companies. Of the oil services category, approximately $.2 billion is not asset-based or investment grade. Nonperforming loans in the oil and gas sector as of June 30, 2020 totaled $.2 billion, or 4.9% of total loans outstanding in this sector. Additional unfunded loan commitments in the oil and gas portfolio totaled $6.9 billion at June 30, 2020.
Consumer
Home Equity
Home equity loans comprised $13.3 billion of primarily variable-rate home equity lines of credit and $11.6 billion of closed-end home equity installment loans at June 30, 2020. Comparable amounts were $13.9 billion and $11.2 billion, respectively, as of December 31, 2019.
We track borrower performance monthly, including obtaining original LTVs, updated FICO scores at least quarterly, updated LTVs at least semi-annually, and other credit metrics at least quarterly, including the historical performance of any related mortgage loans regardless of lien position that we do or do not hold. This information is used for internal reporting and risk management. For internal reporting and risk management we also segment the population into pools based on product type (e.g., home equity loans, brokered home equity loans, home equity lines of credit, brokered home equity lines of credit). As part of our overall risk analysis and monitoring, we also segment the portfolio based upon the loan delinquency, nonperforming status, modification and bankruptcy status, FICO scores, LTV, lien position and geographic concentration.
The credit quality of newly originated loans over the last twelve months was strong overall with a weighted-average LTV on originations of 68% and a weighted-average FICO score of 770.
The credit performance of the majority of the home equity portfolio where we hold the first lien position is superior to the portion of the portfolio where we hold the second lien position, but do not hold the first lien. Lien position information is generally determined at the time of origination and monitored on an ongoing basis for risk management purposes. We use an industry-leading third-party service provider to obtain updated loan information, including lien and collateral data that is aggregated from public and private sources.
The PNC Financial Services Group, Inc. – Form 10-Q 25
The following table presents our home equity loans by geography and lien type.
Table 18: Home Equity Loans by Geography and by Lien Type
June 30, 2020 |
December 31, 2019 |
||||||||||||||
Dollars in millions |
Amount |
% of Total |
Amount |
% of Total |
|||||||||||
Geography (a) |
|||||||||||||||
Pennsylvania |
$ |
5,750 |
23 |
% |
$ |
5,812 |
23 |
% |
|||||||
New Jersey |
3,648 |
15 |
3,728 |
15 |
|||||||||||
Ohio |
2,845 |
11 |
2,899 |
12 |
|||||||||||
Illinois |
1,497 |
6 |
1,544 |
6 |
|||||||||||
Florida |
1,497 |
6 |
1,340 |
5 |
|||||||||||
Michigan |
1,408 |
6 |
1,371 |
5 |
|||||||||||
Maryland |
1,399 |
6 |
1,420 |
6 |
|||||||||||
North Carolina |
1,083 |
4 |
1,092 |
4 |
|||||||||||
Kentucky |
970 |
4 |
990 |
4 |
|||||||||||
Virginia |
827 |
3 |
810 |
3 |
|||||||||||
Other |
3,955 |
16 |
4,079 |
17 |
|||||||||||
Total home equity loans |
$ |
24,879 |
100 |
% |
$ |
25,085 |
100 |
% |
|||||||
Lien type |
|||||||||||||||
1st lien |
61 |
% |
59 |
% |
|||||||||||
2nd lien |
39 |
41 |
|||||||||||||
Total |
100 |
% |
100 |
% |
|||||||||||
(a) |
Presented in descending order based on loan balances at June 30, 2020.
|
Residential Real Estate
Residential real estate loans primarily consisted of residential mortgage loans at both June 30, 2020 and December 31, 2019.
We track borrower performance of this portfolio monthly similarly to home equity loans. This information is used for internal reporting and risk management. For internal reporting and risk management we also segment the mortgage portfolio into pools based on product type (e.g., nonconforming, conforming). As part of our overall risk analysis and monitoring, we also segment the portfolio based upon loan delinquency, nonperforming status, modification and bankruptcy status, FICO scores, LTV and geographic concentrations. Loan performance is evaluated by source originators and loan servicers.
The credit quality of newly originated loans that we retained on our balance sheet over the last twelve months was strong overall as evidenced by a weighted-average LTV on originations of 69% and a weighted-average FICO score of 771.
The following table presents our residential real estate loans by geography.
Table 19: Residential Real Estate Loans by Geography
June 30, 2020 |
December 31, 2019 |
||||||||||||||
Dollars in millions |
Amount |
% of Total |
Amount |
% of Total |
|||||||||||
Geography (a) |
|||||||||||||||
California |
$ |
7,618 |
34 |
% |
$ |
6,800 |
31 |
% |
|||||||
New Jersey |
1,786 |
8 |
1,779 |
8 |
|||||||||||
Florida |
1,567 |
7 |
1,580 |
7 |
|||||||||||
Pennsylvania |
1,096 |
5 |
1,113 |
5 |
|||||||||||
Illinois |
1,068 |
5 |
1,118 |
5 |
|||||||||||
New York |
990 |
4 |
1,008 |
5 |
|||||||||||
Washington |
923 |
4 |
646 |
3 |
|||||||||||
Virginia |
908 |
4 |
868 |
4 |
|||||||||||
Maryland |
895 |
4 |
923 |
4 |
|||||||||||
North Carolina |
848 |
4 |
877 |
4 |
|||||||||||
Other |
4,770 |
21 |
5,109 |
24 |
|||||||||||
Total residential real estate loans |
$ |
22,469 |
100 |
% |
$ |
21,821 |
100 |
% |
|||||||
(a) |
Presented in descending order based on loan balances at June 30, 2020.
|
26 The PNC Financial Services Group, Inc. – Form 10-Q
We originate residential mortgage loans nationwide through our national mortgage business as well as within our branch network. Residential mortgage loans underwritten to agency standards, including conforming loan amount limits, are typically sold with servicing retained by us. We also originate nonconforming residential mortgage loans that do not meet agency standards, which we retain on our balance sheet. The originated nonconforming residential mortgage portfolio had strong credit quality at June 30, 2020 with an average original LTV of 69% and an average original FICO score of 773. Our portfolio of originated nonconforming residential mortgage loans totaled $17.4 billion at June 30, 2020 with 40% located in California.
Automobile
Within auto loans, $14.5 billion resided in the indirect auto portfolio while $1.7 billion were in the direct auto portfolio as of June 30, 2020. Comparable amounts as of December 31, 2019 were $15.1 billion and $1.7 billion, respectively. The indirect auto portfolio pertains to loans originated through franchised dealers, including from expansion into new markets. This business is strategically aligned with our core retail banking business.
We continue to focus on borrowers with strong credit profiles as evidenced by a weighted-average loan origination FICO score over the last twelve months of 765 for indirect auto loans and 769 for direct auto loans. The weighted-average term of loan originations over the last twelve months was 73 months for indirect auto loans and 63 months for direct auto loans. We offer both new and used auto financing to customers through our various channels. At June 30, 2020, the portfolio was composed of 56% new vehicle loans and 44% used vehicle loans. Comparable amounts at December 31, 2019 were 55% and 45%, respectively.
The auto loan portfolio's performance is measured monthly, including updated collateral values that are obtained monthly and updated FICO scores that are obtained at least quarterly. For internal reporting and risk management, we analyze the portfolio by product channel and product type and regularly evaluate default and delinquency experience. As part of our overall risk analysis and monitoring, we segment the portfolio by loan structure, collateral attributes and credit metrics which include FICO score, LTV and term.
Nonperforming Assets and Loan Delinquencies
Nonperforming Assets
Nonperforming assets include nonperforming loans and leases for which ultimate collectability of the full amount of contractual principal and interest is not probable and include nonperforming troubled debt restructurings (TDRs), other real estate owned (OREO) and foreclosed assets. Loans held for sale, certain government insured or guaranteed loans and loans accounted for under the fair value option are excluded from nonperforming loans. Amounts as of December 31, 2019 also excluded purchased impaired loans as we were accreting interest income over the expected life of the loans. In connection with the adoption of the CECL standard, nonperforming loans as of June 30, 2020 include purchased credit deteriorated (PCD) loans which meet the criteria to be classified as nonperforming. See Note 1 Accounting Policies in the Notes To Consolidated Financial Statements in this Report for details on our nonaccrual policies and additional information related to the adoption of the CECL standard, including the discontinuation of purchased impaired loan accounting.
The PNC Financial Services Group, Inc. – Form 10-Q 27
The following table presents a summary of nonperforming assets by major category.
Table 20: Nonperforming Assets by Type
June 30, 2020 |
December 31, 2019 |
Change |
|||||||||||
Dollars in millions |
$ |
% |
|||||||||||
Nonperforming loans |
|||||||||||||
Commercial |
$ |
758 |
$ |
501 |
$ |
257 |
51 |
% |
|||||
Consumer (a) |
1,118 |
1,134 |
(16 |
) |
(1 |
)% |
|||||||
Total nonperforming loans |
1,876 |
1,635 |
241 |
15 |
% |
||||||||
OREO and foreclosed assets |
79 |
117 |
(38 |
) |
(32 |
)% |
|||||||
Total nonperforming assets |
$ |
1,955 |
$ |
1,752 |
$ |
203 |
12 |
% |
|||||
TDRs included in nonperforming loans |
$ |
860 |
$ |
843 |
$ |
17 |
2 |
% |
|||||
Percentage of total nonperforming loans |
46 |
% |
52 |
% |
|||||||||
Nonperforming loans to total loans |
.73 |
% |
.68 |
% |
|||||||||
Nonperforming assets to total loans, OREO and foreclosed assets |
.76 |
% |
.73 |
% |
|||||||||
Nonperforming assets to total assets |
.43 |
% |
.43 |
% |
|||||||||
Allowance for loan and lease losses to nonperforming loans (b) |
316 |
% |
168 |
% |
|||||||||
(a) |
Excludes most unsecured consumer loans and lines of credit, which are charged off after 120 to 180 days past due and are not placed on nonperforming status. |
(b) |
Ratio at June 30, 2020 reflects the changes in ALLL methodology due to the adoption of the CECL accounting standard on January 1, 2020, along with increases in reserves during 2020 due to the significantly adverse economic impact of the pandemic, and its resulting effects on loan portfolio credit quality and loan growth.
|
The increase in nonperforming assets at June 30, 2020 was primarily attributable to higher nonperforming commercial loans in industries economically impacted by the pandemic and the energy industry, partially offset by the decline in OREO and foreclosed assets due to asset sales and the suspension of pandemic-related foreclosures. See the discussions of Commercial High Impact Industries and the Oil and Gas Loan Portfolio within this Credit Risk Management section for further detail on these industries.
The following table provides details on the change in nonperforming assets for the six months ended June 30, 2020 and 2019.
Table 21: Change in Nonperforming Assets
In millions |
2020 |
2019 |
|||||||
January 1 |
$ |
1,752 |
$ |
1,808 |
|||||
New nonperforming assets |
849 |
695 |
|||||||
Charge-offs and valuation adjustments |
(249 |
) |
(334 |
) |
|||||
Principal activity, including paydowns and payoffs |
(243 |
) |
(193 |
) |
|||||
Asset sales and transfers to loans held for sale |
(48 |
) |
(40 |
) |
|||||
Returned to performing status |
(106 |
) |
(86 |
) |
|||||
June 30 |
$ |
1,955 |
$ |
1,850 |
|||||
As of June 30, 2020, approximately 81% of total nonperforming loans were secured by collateral which lessened reserve requirements and is expected to reduce credit losses. As of June 30, 2020, commercial nonperforming loans were carried at approximately 78% of their unpaid principal balance, due to charge-offs recorded to date, before consideration of the ALLL.
Within consumer nonperforming loans, residential real estate TDRs comprised 77% and 79% of total residential real estate nonperforming loans at June 30, 2020 and December 31, 2019, respectively, while home equity TDRs comprised 45% and 49% of home equity nonperforming loans at June 30, 2020 and December 31, 2019, respectively. TDRs generally remain in nonperforming status until a borrower has made at least six consecutive months of both principal and interest payments under the modified terms or ultimate resolution occurs. Loans where borrowers have been discharged from personal liability through Chapter 7 bankruptcy and have not formally reaffirmed their loan obligations to us and loans to borrowers not currently obligated to make both principal and interest payments under the restructured terms are not returned to accrual status. Loans that have been restructured for COVID-19 related hardships and meet certain criteria under the CARES Act are not identified as TDRs. Refer to the Troubled Debt Restructurings and Loan Modifications discussion in this Credit Risk Management section for more information on the treatment of loan modifications under the CARES Act.
At June 30, 2020, our largest nonperforming asset was $99 million in the Real Estate and Rental and Leasing industry and the ten largest individual nonperforming assets represented 18% of total nonperforming assets.
28 The PNC Financial Services Group, Inc. – Form 10-Q
Loan Delinquencies
We regularly monitor the level of loan delinquencies and believe these levels may be a key indicator of credit quality in our loan portfolio. Measurement of delinquency status is based on the contractual terms of each loan. Loans that are 30 days or more past due in terms of payment are considered delinquent. Loan delinquencies include government insured or guaranteed loans, loans accounted for under the fair value option and at June 30, 2020 also include PCD loans. Amounts exclude loans held for sale, while amounts as of December 31, 2019 also excluded purchased impaired loans.
Pursuant to the interagency guidance issued in April 2020 and in connection with the credit reporting rules from the CARES Act, the delinquency status of loans modified due to COVID-19 related hardships are being reported as of June 30, 2020 in alignment with the rules set forth for banks to report delinquency status to the credit agencies. These rules require that COVID-19 related loan modifications be reported as follows: (i) if current at the time of modification, the loan remains current throughout the modification period, (ii) if delinquent at the time of modification and the borrower was not made current as part of the modification, the loan maintains its reported as delinquent status during the modification period, or (iii) if delinquent at the time of modification and the borrower was made current as part of the modification or became current during the modification period, the loan is reported as current. As a result, certain loans modified due to COVID-19 related hardships are not being reported as past due as of June 30, 2020 based on the contractual terms of the loan, even where borrowers may not be making payments on their loans during the modification period. See Recent Regulatory Developments in Item 2 of our first quarter 2020 Form 10-Q for more information on the CARES Act and the related interagency guidance.
Table 22: Accruing Loans Past Due (a)
Amount |
% of Total Loans Outstanding |
|||||||||||||||||||||
June 30 2020 |
December 31 2019 |
Change |
June 30 2020 |
December 31 2019 |
||||||||||||||||||
Dollars in millions |
$ |
% |
||||||||||||||||||||
Early stage loan delinquencies |
||||||||||||||||||||||
Accruing loans past due 30 to 59 days |
$ |
590 |
$ |
661 |
$ |
(71 |
) |
(11 |
)% |
.23 |
% |
.28 |
% |
|||||||||
Accruing loans past due 60 to 89 days |
264 |
258 |
6 |
2 |
% |
.10 |
% |
.11 |
% |
|||||||||||||
Total early stage loan delinquencies |
854 |
919 |
(65 |
) |
(7 |
)% |
.33 |
% |
.38 |
% |
||||||||||||
Late stage loan delinquencies |
||||||||||||||||||||||
Accruing loans past due 90 days or more |
456 |
585 |
(129 |
) |
(22 |
)% |
.18 |
% |
.24 |
% |
||||||||||||
Total accruing loans past due |
$ |
1,310 |
$ |
1,504 |
$ |
(194 |
) |
(13 |
)% |
.51 |
% |
.63 |
% |
|||||||||
(a) |
Past due loan amounts include government insured or guaranteed loans of $.5 billion at June 30, 2020 and $.6 billion at December 31, 2019.
|
Accruing loans past due 90 days or more continue to accrue interest because they are (i) well secured by collateral and are in the process of collection, (ii) managed in homogeneous portfolios with specified charge-off timeframes adhering to regulatory guidelines, or (iii) certain government insured or guaranteed loans. As such, they are excluded from nonperforming loans.
Troubled Debt Restructurings and Loan Modifications
Troubled Debt Restructurings
A TDR is a loan whose terms have been restructured in a manner that grants a concession to a borrower experiencing financial difficulties. TDRs result from our loss mitigation activities and include rate reductions, principal forgiveness, postponement/reduction of scheduled amortization and extensions, which are intended to minimize economic loss and to avoid foreclosure or repossession of collateral. Additionally, TDRs also result from court imposed concessions (e.g., a Chapter 7 bankruptcy where the debtor is discharged from personal liability to us and a court approved Chapter 13 bankruptcy repayment plan). Loans to borrowers experiencing COVID-19 related hardships that meet certain criteria under the CARES Act are not categorized as TDRs.
Table 23: Summary of Troubled Debt Restructurings (a)
June 30 2020 |
December 31 2019 |
Change |
||||||||||||||
Dollars in millions |
$ |
% |
||||||||||||||
Commercial |
$ |
404 |
$ |
361 |
$ |
43 |
12 |
% |
||||||||
Consumer |
1,181 |
1,303 |
(122 |
) |
(9 |
)% |
||||||||||
Total TDRs |
$ |
1,585 |
$ |
1,664 |
$ |
(79 |
) |
(5 |
)% |
|||||||
Nonperforming |
$ |
860 |
$ |
843 |
$ |
17 |
2 |
% |
||||||||
Accruing (b) |
725 |
821 |
(96 |
) |
(12 |
)% |
||||||||||
Total TDRs |
$ |
1,585 |
$ |
1,664 |
$ |
(79 |
) |
(5 |
)% |
|||||||
(a) |
Amounts in table do not include associated valuation allowances. |
(b) |
Accruing loans include consumer credit card loans and loans that have demonstrated a period of at least six months of performance under the restructured terms and are excluded from nonperforming loans. |
The PNC Financial Services Group, Inc. – Form 10-Q 29
Nonperforming TDRs represented approximately 46% and 52% of total nonperforming loans at June 30, 2020 and December 31, 2019, respectively, and 54% and 51% of total TDRs at June 30, 2020 and December 31, 2019, respectively. The remaining portion of TDRs represents TDRs that have been returned to accrual status after performing under the restructured terms for at least six consecutive months.
See Note 1 Accounting Policies and 4 Loans and Related Allowance for Credit Losses in the Notes to Consolidated Financial Statements in this Report for additional information on TDRs. For additional information on the CARES Act, see the Recent Regulatory Developments section in Item 2 of our first quarter 2020 Form 10-Q.
Loan Modifications
PNC is working to provide relief and flexibility to our customers, many of whom are suffering hardships as a result of COVID-19 and the resulting economic downturn, through a variety of solutions, including granting loan and lease modifications. We continue to monitor the success rates and delinquency status of our loan and lease modification programs to assess their effectiveness in serving our borrowers’ and servicing customers’ needs while mitigating credit losses.
Due to the passage of the CARES Act, loan modifications meeting certain criteria qualify the loan for relief from TDR treatment. These criteria include (i) the loan modification results from a COVID-19 related hardship, (ii) the borrower is no more than 30 days past due as of December 31, 2019, and (iii) the loan modification does not result in a permanent reduction of interest or principal. Loans that do not meet the criteria for TDR relief under the CARES Act may be evaluated under interagency guidance, which allows banks to not designate certain short-term modifications as TDRs for borrowers with COVID-19 hardships who were current on their payments prior to the modification. Loans that are permanently modified or receive longer term modifications under programs involving a change to loan terms due to customer financial difficulty and PNC concessions are evaluated for TDR accounting.
Refer to the Loan Delinquencies discussion in this Credit Risk Management section for information on how these hardship related loan modification are reported from a delinquency perspective as of June 30, 2020. For additional information on the CARES Act and interagency guidance, see the Recent Regulatory Developments section in Item 2 of our first quarter 2020 Form 10-Q.
The impact of modifications made through one of the hardship programs was considered within the modified loans’ quarterly reserve determination. See the Allowance for Credit Losses discussion within this Credit Risk Management for additional information.
Commercial Loan and Lease Modifications Under COVID-19 Hardship Relief Programs
PNC is granting temporary loan and lease modifications to our commercial clients in the form of principal and/or interest deferrals, covenant waivers and other types of modifications including term extensions. Initial principal and/or interest deferrals are being offered with terms typically up to 90 days, and we are analyzing and making decisions on these modifications based on each individual borrower’s situation. Modifications made in the form of covenant waivers include modifying financial covenants, waiving covenants currently in default, amending reporting requirements and waiving the receipt of required reporting.
The following table presents a summary as of June 30, 2020 of the principal and/or interest deferral modifications PNC has granted due to COVID-19 related hardships in the commercial portfolio. As of June 30, 2020, the unpaid principal balance on these modifications represented approximately 4% of the total commercial loan portfolio. In some cases, individual loans have been modified more than once. Regardless of the number of modifications granted on a loan, each loan is counted only once in Table 24.
Table 24: Unpaid Principal Balance of Commercial Loans with a COVID-19 Related Principal/Interest Deferral Modification (a)
|
Number of
Accounts
|
Unpaid
Principal
Balance
|
|||||||
As of June 30, 2020 - Dollars in millions |
||||||||
Commercial |
||||||||
Commercial and industrial |
12,534 |
$ |
4,939 |
|||||
Commercial real estate |
407 |
1,544 |
||||||
Equipment lease financing |
2,774 |
285 |
||||||
Total commercial |
15,715 |
$ |
6,768 |
|||||
(a) Amounts include loan modifications that qualify for TDR accounting totaling $40 million.
Consumer Loan Modifications Under Hardship Relief Programs
We are also granting temporary loan and line modifications for our consumer loan customers through extensions, deferrals, partial payments and forbearance. The consumer loan modifications are inclusive of all hardship related modifications granted in 2020. In addition, we have temporarily halted the majority of consumer real estate related foreclosures, while we continue to monitor the situation.
30 The PNC Financial Services Group, Inc. – Form 10-Q
Our consumer loan modification programs are in response to current customer hardships and the primary offerings by loan class in the reported period are described in the following matrix.
Modification Type |
Home Equity |
Residential Real Estate |
Automobile |
Credit Card |
Education |
Other Consumer |
Extensions - Defers current payments and moves them to the end of the loan by extending the loan's maturity or the extension re-amortizes the remaining principal balance. |
a |
a |
a
|
a |
||
Forbearance - Payment is deferred and moved to the end of the forbearance period. Balance is due at the end of the forbearance period, but payment options may be available to repay the forborne amount, including for many borrowers an option to delay payment until the payoff or maturity of the loan. |
a |
|||||
Minimum payment suspension - Reduces required minimum payment to $0 for a period of time. |
a |
|||||
New loan terms - Sets loan terms to a new monthly payment of principal and interest based on customer's financial situation. |
a |
a |
||||
Reduced payments - Allows the customer to make a lower payment for a period of time, with any deferred balance being moved to the end of the loan term or extending the loan's maturity. |
a |
a |
a |
|||
Repayment plan - Allows reduced payment and interest rate for a period of time. |
a |
|||||
Interest continues to accrue during the forbearance, extension or deferral period of the loan modification unless it was designated as a nonperforming TDR or on nonaccrual at the date of modification. The method of collection of the accrued interest is dependent on the product type and modification offered.
The following table presents a summary as of June 30, 2020 of the hardship related loan modifications PNC has granted in our consumer loan portfolio during 2020. As of June 30, 2020, the unpaid principal balance on these modifications represented approximately 8% of the total consumer loan portfolio. In some cases, there have been multiple modifications of individual loans. Regardless of the number of modifications granted on a loan, each loan is counted only once in Table 25.
Table 25: Unpaid Principal Balance of Consumer Loan Modifications Under Hardship Relief Programs (a)
As of June 30, 2020 - Dollars in millions |
Number of
Accounts
|
Unpaid
Principal
Balance
|
||||||
Consumer |
||||||||
Home equity |
14,245 |
$ |
1,403 |
|||||
Residential real estate (b) |
5,619 |
1,620 |
||||||
Automobile |
83,933 |
2,044 |
||||||
Credit card |
39,235 |
266 |
||||||
Education (b) |
84,615 |
579 |
||||||
Other consumer |
14,671 |
204 |
||||||
Total consumer loan modifications |
242,318 |
$ |
6,116 |
|||||
(a) Amounts include loan modifications that qualify for TDR accounting totaling $348 million.
(b) Includes government insured or guaranteed loans totaling $208 million and $433 million in the Residential real estate and Education loan classes, respectively.
The initial consumer loan modifications granted in response to the COVID-19 outbreak and the surrounding economic circumstances were short-term and temporary in nature and generally meet the qualifications for relief from TDR treatment under the CARES Act. However, in response to customers' hardships that have extended beyond the initial relief period, PNC continues to offer options to customers which include both temporary and permanent modifications that may reduce the payment, the interest rate or extend the term and/or defer principal and interest payments. Permanent modifications would not meet the qualifications for relief from TDR treatment under the CARES Act.
The PNC Financial Services Group, Inc. – Form 10-Q 31
Allowance for Credit Losses
On January 1, 2020 we adopted the CECL standard which replaced the incurred loss methodology for our credit related reserves with an expected credit loss methodology for the remaining estimated contractual term of in-scope assets and off-balance sheet exposures. Our ACL is based on historical loss experience, borrower characteristics, current economic conditions, reasonable and supportable forecasts of future conditions and other relevant factors. We maintain the ACL at an appropriate level for expected losses on our existing investment securities, loans, finance leases, trade receivables and other financial assets and off-balance sheet credit exposures and determine this allowance based on quarterly assessments of the remaining estimated contractual term of the assets or exposures as of the balance sheet date.
Expected losses are estimated using a combination of (i) the expected losses over a reasonable and supportable forecast period (RSFP), (ii) a period of reversion to long run average expected losses (reversion period) where applicable, and (iii) long run average (LRA) expected losses for the remaining estimated contractual term.
We use forward-looking information in estimating expected credit losses for the RSFP. For this purpose, we have established a framework which includes a three year reasonable and supportable forecast period and the use of four economic scenarios and associated probability weights, which in combination create a forecast of expected economic outcomes over our RSFP of three years. Forward looking information, such as forecasted relevant macroeconomic variables, is incorporated into the expected credit loss estimates using quantitative techniques, as well as through analysis from PNC's economists and management’s judgment in qualitatively assessing the ACL.
The reversion period is used to bridge RSFP and LRA expected credit losses. We may consider a number of factors in determining the duration of the reversion period, such as contractual maturity of the asset, observed historical patterns and the estimated credit loss rates at the end of RSFP relative to the beginning of the LRA period.
The LRA expected credit losses are derived from our available historical credit information. We use LRA expected loss for the portfolio for the estimated remaining contractual term beyond the RSFP and reversion period.
The following discussion provides additional information related to our reserves under CECL for loans and leases as well as unfunded lending related commitments. See Note 1 Accounting Policies in the Notes To Consolidated Financial Statements in this Report for further discussion on our ACL, including details of our methodologies and discussion of the allowances for investment securities and other financial assets. See also the Critical Accounting Estimates and Judgments section of this Financial Review for further discussion of the assumptions used in the determination of the ACL and the predicted impacts on the ACL of deteriorating economic conditions as a result of COVID-19.
Allowance for Loan and Lease Losses
Our pooled expected loss methodology is based upon the quantification of PD, LGD, exposure at default (EAD) and the remaining estimated contractual term for a loan or loan segment. We also consider the impact of prepayments and amortization on contractual maturity in our expected loss estimates. We use historical data, current borrower characteristics and forecasted economic variables in quantitative methods, including statistical models, to estimate these risk parameters by credit risk characteristics. PDs represent a quantification of risk that a borrower may not be able to pay their contractual obligation over a defined period of time. LGD describes the estimate of potential loss if a borrower were to default, and EAD (or utilization rates for revolving loans) is the estimated balance outstanding at the time of default and loss. These parameters are calculated for each forecasted scenario, and are combined to generate expected loss estimates by scenario in proportion to the scenario weights.
We use a discounted cash flow methodology for our consumer real estate related loan classes and for certain commercial and consumer TDR loans. For non-TDR residential real estate loans and lines, we determine effective interest rates considering contractual cash flows adjusted for prepayments and market interest rates. We then determine the net present value of expected cash flows and ALLL by discounting contractual cash flows adjusted for both prepayments and expected credit losses using the effective interest rates.
We establish individually assessed reserves for loans and leases that do not share similar risk characteristics with a pool of loans using methods prescribed by GAAP. Reserves for individual commercial nonperforming loans and commercial TDRs exceeding a defined dollar threshold are based on an analysis of the present value of the loan’s expected future cash flows or the fair value of the collateral, if appropriate under our policy for collateral dependent loans. Commercial loans that are below the defined threshold and accruing TDRs are collectively reserved for, as we believe these loans continue to share similar risk characteristics. For consumer nonperforming loans classified as collateral dependent, charge-off and ALLL related to recovery of amounts previously charged-off are evaluated through an analysis of the fair value of the collateral less costs to sell.
The PNC Financial Services Group, Inc. – Form 10-Q 32
While our reserve methodologies strive to reflect all relevant credit risk factors, there continues to be uncertainty associated with, but not limited to, potential imprecision in the estimation process due to the inherent time lag of obtaining information and normal variations between expected and actual outcomes. We may hold additional reserves that are designed to provide coverage for losses attributable to such risks. A portion of the allowance is related to qualitative measurement factors. These factors may include, but are not limited to, the following:
• |
Industry concentrations and conditions, |
• |
Changes in market conditions, including regulatory and legal requirements, |
• |
Changes in the nature and volume of our portfolio, |
• |
Recent credit quality trends, including the impact of COVID-19 hardship related loan modifications, |
• |
Recent loss experience in particular portfolios, including specific and unique events, |
• |
Recent macro-economic factors that may not be reflected in the forecast information, |
• |
Limitations of available data, including historical loss information and recent data such as collateral values, |
• |
Model imprecision, |
• |
Changes in lending policies and procedures, including changes in loss recognition and mitigation policies and procedures, |
• |
Timing of available information, including the performance of first lien positions, and |
• |
Other relevant factors. |
Allowance for Unfunded Lending Related Commitments
We maintain the allowance for unfunded lending related commitments on off-balance sheet credit exposures that are not unconditionally cancelable, (e.g., unfunded loan commitments, letters of credit and certain financial guarantees) at a level we believe is appropriate as of the balance sheet date to absorb expected credit losses on these exposures. Other than the estimation of the probability of funding, this reserve is estimated in a manner similar to the methodology used for determining reserves for loans and leases. The allowance for unfunded lending related commitments is recorded as a liability on the Consolidated Balance Sheet. Net adjustments to this reserve are included in the provision for credit losses.
Table 26: Allowance for Credit Losses by Loan Class (a)
June 30, 2020 |
December 31, 2019 |
||||||||||||||||||
Dollars in millions |
Allowance Amount |
Total Loans |
% of Total Loans |
Allowance Amount |
Total Loans |
% of Total Loans |
|||||||||||||
Allowance for loans and lease losses |
|||||||||||||||||||
Commercial |
|||||||||||||||||||
Commercial and industrial |
$ |
2,834 |
$ |
144,335 |
1.96 |
% |
$ |
1,489 |
$ |
125,337 |
1.19 |
% |
|||||||
Commercial real estate |
382 |
28,763 |
1.33 |
% |
278 |
28,110 |
.99 |
% |
|||||||||||
Equipment lease financing |
164 |
7,097 |
2.31 |
% |
45 |
7,155 |
.63 |
% |
|||||||||||
Total commercial |
3,380 |
180,195 |
1.88 |
% |
1,812 |
160,602 |
1.13 |
% |
|||||||||||
Consumer |
|||||||||||||||||||
Home equity |
382 |
24,879 |
1.54 |
% |
87 |
25,085 |
.35 |
% |
|||||||||||
Residential real estate |
50 |
22,469 |
.22 |
% |
258 |
21,821 |
1.18 |
% |
|||||||||||
Automobile |
450 |
16,157 |
2.79 |
% |
160 |
16,754 |
.95 |
% |
|||||||||||
Credit card |
1,010 |
6,575 |
15.36 |
% |
288 |
7,308 |
3.94 |
% |
|||||||||||
Education |
151 |
3,132 |
4.82 |
% |
17 |
3,336 |
.51 |
% |
|||||||||||
Other consumer |
505 |
4,829 |
10.46 |
% |
120 |
4,937 |
2.43 |
% |
|||||||||||
Total consumer |
2,548 |
78,041 |
3.26 |
% |
930 |
79,241 |
1.17 |
% |
|||||||||||
Total |
5,928 |
$ |
258,236 |
2.30 |
% |
2,742 |
$ |
239,843 |
1.14 |
% |
|||||||||
Allowance for unfunded lending related commitments |
662 |
318 |
|||||||||||||||||
Allowance for credit losses |
$ |
6,590 |
$ |
3,060 |
|||||||||||||||
Allowance for credit losses to total loans |
2.55 |
% |
1.28 |
% |
|||||||||||||||
Commercial |
2.18 |
% |
1.33 |
% |
|||||||||||||||
Consumer |
3.41 |
% |
1.18 |
% |
|||||||||||||||
(a) |
Excludes allowances for investment securities and other financial assets. |
The PNC Financial Services Group, Inc. – Form 10-Q 33
The following table summarizes our loan charge-offs and recoveries.
Table 27: Loan Charge-Offs and Recoveries
Six months ended June 30 |
Gross
Charge-offs
|
Recoveries |
Net Charge-offs /
(Recoveries)
|
% of Average
Loans (Annualized)
|
||||||||||||
Dollars in millions | ||||||||||||||||
2020 |
||||||||||||||||
Commercial |
||||||||||||||||
Commercial and industrial |
$ |
190 |
$ |
31 |
$ |
159 |
.23 |
% |
||||||||
Commercial real estate |
— |
4 |
(4 |
) |
(.03 |
)% |
||||||||||
Equipment lease financing |
15 |
4 |
11 |
.31 |
% |
|||||||||||
Total commercial |
205 |
39 |
166 |
.19 |
% |
|||||||||||
Consumer |
||||||||||||||||
Home equity |
19 |
29 |
(10 |
) |
(.08 |
)% |
||||||||||
Residential real estate |
2 |
8 |
(6 |
) |
(.05 |
)% |
||||||||||
Automobile |
153 |
64 |
89 |
1.06 |
% |
|||||||||||
Credit card |
154 |
17 |
137 |
3.96 |
% |
|||||||||||
Education |
10 |
4 |
6 |
.37 |
% |
|||||||||||
Other consumer |
75 |
9 |
66 |
2.69 |
% |
|||||||||||
Total consumer |
413 |
131 |
282 |
.72 |
% |
|||||||||||
Total |
$ |
618 |
$ |
170 |
$ |
448 |
.35 |
% |
||||||||
2019 |
||||||||||||||||
Commercial |
||||||||||||||||
Commercial and industrial |
$ |
75 |
$ |
31 |
$ |
44 |
.07 |
% |
||||||||
Commercial real estate |
5 |
5 |
— |
— |
||||||||||||
Equipment lease financing |
4 |
4 |
— |
— |
||||||||||||
Total commercial |
84 |
40 |
44 |
.06 |
% |
|||||||||||
Consumer |
||||||||||||||||
Home equity |
41 |
36 |
5 |
.04 |
% |
|||||||||||
Residential real estate |
4 |
7 |
(3 |
) |
(.03 |
)% |
||||||||||
Automobile |
112 |
55 |
57 |
.77 |
% |
|||||||||||
Credit card |
132 |
14 |
118 |
3.78 |
% |
|||||||||||
Education |
13 |
4 |
9 |
.49 |
% |
|||||||||||
Other consumer |
56 |
8 |
48 |
2.10 |
% |
|||||||||||
Total consumer |
358 |
124 |
234 |
.64 |
% |
|||||||||||
Total |
$ |
442 |
$ |
164 |
$ |
278 |
.24 |
% |
||||||||
Total net charge-offs increased $170 million, or 61%, for the first six months of 2020 compared to the same period in 2019. The increase in commercial net charge-offs reflected the impact of certain individual credits, while the increases in automobile, credit card and other consumer loan net charge-offs were due in part to loan portfolio growth.
See Note 1 Accounting Policies and Note 4 Loans and Related Allowance for Credit Losses in the Notes To Consolidated Financial Statements in this report for additional information.
Liquidity and Capital Management
Liquidity risk, including our liquidity monitoring measures and tools, is described in further detail in the Liquidity and Capital Management section of our 2019 Form 10-K.
One of the ways we monitor our liquidity is by reference to the Liquidity Coverage Ratio (LCR), a regulatory minimum liquidity requirement designed to ensure that covered banking organizations maintain an adequate level of liquidity to meet net liquidity needs over the course of a hypothetical 30-day stress scenario. The LCR is calculated by dividing the amount of an institution’s high quality, unencumbered liquid assets (HQLA), as defined and calculated in accordance with the LCR rules, by its estimated, weighted net cash outflows, with net cash outflows determined by applying the assumed outflow factors in the LCR rules. The resulting quotient is expressed as a percentage. Effective January 1, 2020, PNC and PNC Bank, as Category III institutions under the Tailoring Rules, were subject to a reduced LCR requirement, with each company's net outflows reduced by 15%, thereby reducing the amount of HQLA each institution must hold to meet the LCR minimum requirement. The minimum LCR that PNC and PNC Bank are required to
34 The PNC Financial Services Group, Inc. – Form 10-Q
maintain continues to be 100%. PNC and PNC Bank calculate the LCR daily, and as of June 30, 2020, the LCR for PNC and PNC Bank exceeded the requirement of 100%.
We provide additional information regarding regulatory liquidity requirements and their potential impact on us in the Supervision and Regulation section of Item 1 Business and Item 1A Risk Factors of our 2019 Form 10-K.
Sources of Liquidity
Our largest source of liquidity on a consolidated basis is the customer deposit base generated by our banking businesses. These deposits provide relatively stable and low-cost funding. Total deposits increased to $346.0 billion at June 30, 2020 from $288.5 billion at December 31, 2019 driven by growth in both interest-bearing and noninterest-bearing deposits. See the Funding Sources portion of the Consolidated Balance Sheet Review section of this Financial Review for additional information related to our deposits. Additionally, certain assets determined by us to be liquid as well as unused borrowing capacity from a number of sources are also available to manage our liquidity position.
At June 30, 2020, our liquid assets consisted of cash and due from banks and short-term investments (federal funds sold, resale agreements, trading securities and interest-earning deposits with banks) totaling $61.6 billion and securities available for sale totaling $97.1 billion. The level of liquid assets fluctuates over time based on many factors, including market conditions, loan and deposit growth and balance sheet management activities. Our liquid assets included $23.4 billion of securities available for sale and trading securities pledged as collateral to secure public and trust deposits, repurchase agreements and for other purposes. In addition, $.1 billion of securities held to maturity were also pledged as collateral for these purposes.
We also obtain liquidity through various forms of funding, including long-term debt (senior notes, subordinated debt and FHLB borrowings) and short-term borrowings (securities sold under repurchase agreements, commercial paper and other short-term borrowings). See Note 8 Borrowed Funds in the Notes To Consolidated Financial Statements and the Funding Sources section of the Consolidated Balance Sheet Review in this Report, and Note 10 Borrowed Funds in Item 8 of our 2019 Form 10-K for additional information related to our borrowings.
Total senior and subordinated debt, on a consolidated basis, increased due to the following activity:
Table 28: Senior and Subordinated Debt
In billions |
2020 |
|||
January 1 |
$ |
35.1 |
||
Issuances |
3.5 |
|||
Calls and maturities |
(5.9 |
) |
||
Other |
1.5 |
|||
June 30 |
$ |
34.2 |
||
Bank Liquidity
Under PNC Bank’s 2014 bank note program, as amended, PNC Bank may from time to time offer up to $40.0 billion aggregate principal amount outstanding at any one time of its unsecured senior and subordinated notes with maturity dates more than nine months (in the case of senior notes) and five years or more (in the case of subordinated notes) from their date of issue. At June 30, 2020, PNC Bank had $21.6 billion of notes outstanding under this program of which $16.6 billion were senior bank notes and $5.0 billion were subordinated bank notes.
PNC Bank maintains additional secured borrowing capacity with the FHLB-Pittsburgh and through the Federal Reserve Bank discount window. The Federal Reserve Bank, however, is not viewed as a primary means of funding our routine business activities, but rather as a potential source of liquidity in a stressed environment or during a market disruption. At June 30, 2020, our unused secured borrowing capacity at the FHLB-Pittsburgh and the Federal Reserve Bank totaled $80.8 billion. The Federal Reserve also has established certain special liquidity facilities under its emergency lending authority in Section 13(3) of the Federal Reserve Act in response to the economic impact of the pandemic. For additional information on these special liquidity facilities see the Recent Regulatory Developments section of the first quarter 2020 Form 10-Q.
PNC Bank has the ability to offer up to $10.0 billion of its commercial paper to provide additional liquidity. As of June 30, 2020, there were no issuances outstanding under this program.
From time to time, the parent company may make capital contributions to PNC Bank. In the second quarter of 2020, a capital contribution to PNC Bank of $2.5 billion was made by the parent company.
The PNC Financial Services Group, Inc. – Form 10-Q 35
Parent Company Liquidity
In addition to managing liquidity risk at the bank level, we monitor the parent company’s liquidity. The parent company’s contractual obligations consist primarily of debt service related to parent company borrowings and funding non-bank affiliates. Additionally, the parent company maintains adequate liquidity to fund discretionary activities such as paying dividends to our shareholders, share repurchases and acquisitions.
As of June 30, 2020, available parent company liquidity totaled $17.7 billion which includes proceeds from our second quarter 2020 sale of our equity investment in BlackRock. See Note 2 Discontinued Operations in the Notes To Consolidated Financial Statements of this Report for additional information.
Parent company liquidity is primarily held in intercompany short-term investments, the terms of which provide for the availability of cash in 31 days or less. Investments with longer durations may also be acquired, but if so, the related maturities are aligned with scheduled cash needs, such as the maturity of parent company debt obligations.
The principal source of parent company liquidity is the dividends it receives from PNC Bank, which may be impacted by the following:
• |
Bank-level capital needs, |
• |
Laws and regulations, |
• |
Corporate policies, |
• |
Contractual restrictions, and |
• |
Other factors. |
There are statutory and regulatory limitations on the ability of a national bank to pay dividends or make other capital distributions or to extend credit to the parent company or its non-bank subsidiaries. The amount available for dividend payments by PNC Bank to the parent company without prior regulatory approval was approximately $1.8 billion at June 30, 2020. See Note 18 Regulatory Matters in the Notes To Consolidated Financial Statements in our 2019 Form 10-K for a further discussion of these limitations.
In addition to dividends from PNC Bank, other sources of parent company liquidity include cash and investments, as well as dividends and loan repayments from other subsidiaries and dividends or distributions from equity investments. We can also generate liquidity for the parent company and PNC’s non-bank subsidiaries through the issuance of debt and equity securities, including certain capital instruments, in public or private markets and commercial paper. The parent company has the ability to offer up to $5.0 billion of commercial paper to provide additional liquidity. As of June 30, 2020, there were no commercial paper issuances outstanding.
The parent company has an effective shelf registration statement pursuant to which we can issue additional debt, equity and other capital instruments.
Parent company senior and subordinated debt outstanding totaled $11.5 billion and $9.8 billion at June 30, 2020 and December 31, 2019, respectively.
Contractual Obligations and Commitments
We have contractual obligations representing required future payments on borrowed funds, time deposits, leases, pension and postretirement benefits and purchase obligations. See the Liquidity and Capital Management portion of the Risk Management section in our 2019 Form 10-K for more information on these future cash outflows. Additionally, in the normal course of business we have various commitments outstanding, certain of which are not included on our Consolidated Balance Sheet. We provide information on our commitments in Note 9 Commitments in the Notes To Consolidated Financial Statements of this Report.
Credit Ratings
PNC’s credit ratings affect the cost and availability of short and long-term funding, collateral requirements for certain derivative instruments and the ability to offer certain products.
In general, rating agencies base their ratings on many quantitative and qualitative factors, including capital adequacy, liquidity, asset quality, business mix, level and quality of earnings, and the current legislative and regulatory environment, including implied government support. A decrease, or potential decrease, in credit ratings could impact access to the capital markets and/or increase the cost of debt, and thereby adversely affect liquidity and financial condition.
36 The PNC Financial Services Group, Inc. – Form 10-Q
Table 29: Credit Ratings for PNC and PNC Bank
June 30, 2020 |
|||
Moody’s |
Standard & Poor’s |
Fitch |
|
PNC |
|||
Senior debt |
A3 |
A- |
A+ |
Subordinated debt |
A3 |
BBB+ |
A- |
Preferred stock |
Baa2 |
BBB- |
BBB |
PNC Bank |
|||
Senior debt |
A2 |
A |
A+ |
Subordinated debt |
A3 |
A- |
A |
Long-term deposits |
Aa2 |
A |
AA- |
Short-term deposits |
P-1 |
A-1 |
F1+ |
Short-term notes |
P-1 |
A-1 |
F1 |
On July 10, 2020, Fitch downgraded PNC's senior debt rating from A+ to A in conjunction with the finalization of ratings methodology changes for Category II and III banking organizations. The ratings downgrade was solely a function of criteria changes and does not reflect a change in Fitch’s current or expected view of PNC’s credit fundamentals. No impact to PNC or its businesses is expected as a result of this downgrade. Additionally, PNC Bank’s senior unsecured and subordinated debt ratings were affirmed at A+ and A, respectively.
Capital Management
Detailed information on our capital management processes and activities, including additional information on our previous CCAR submissions and capital plans, is included in the Capital Management portion of the Risk Management section in our 2019 Form 10-K.
We manage our funding and capital positions by making adjustments to our balance sheet size and composition, issuing or redeeming debt, issuing equity or other capital instruments, executing treasury stock transactions and capital redemptions or repurchases, and managing dividend policies and retaining earnings.
PNC announced on March 16, 2020 a temporary suspension of our common stock repurchase program in conjunction with the Federal Reserve's effort to support the U.S. economy during the pandemic, and will continue the suspension through the third quarter of 2020, with the exception of share repurchases to offset the effects of employee benefit plan-related issuances as permitted by recent guidance from the Federal Reserve. The estimated amount of these repurchases in the third quarter of 2020 is $100 million, but the timing and amount of executed repurchases will be based on market conditions and other factors.
We paid dividends on common stock of $.5 billion, or $1.15 per common share, during the second quarter of 2020. The PNC Board of Directors declared a quarterly cash dividend on common stock payable on August 5, 2020 of $1.15 per share, consistent with the second quarter dividend paid on May 5, 2020. In April 2020, PNC submitted its capital plan to the Federal Reserve and OCC as part of the 2020 annual Comprehensive Capital Analysis and Review (CCAR) and Dodd-Frank Act stress testing (DFAST) process.
On June 25, 2020, the Federal Reserve released the results of its supervisory stress tests conducted as part of the 2020 CCAR/DFAST process, as well as the results of additional sensitivity analysis it conducted to account for the uncertainty presented by the COVID-19 pandemic. Based on the results of the Federal Reserve's supervisory stress tests, PNC's Stress Capital Buffer (SCB), which is scheduled to go into effect on October 1, 2020, was set at 2.5%, the minimum level permitted under applicable rules. For additional information on the SCB and its potential impact on PNC's capital distributions, see the Recent Regulatory Developments section of the Financial Review of our first quarter 2020 Form 10-Q.
Following completion of the 2020 CCAR/DFAST process, the Federal Reserve announced certain limitations on the capital distributions of any CCAR-participating bank holding company (including PNC) during the third quarter of 2020. Under these limitations, PNC and other CCAR-participating firms, absent Federal Reserve approval, are permitted to make only the following capital distributions during the third quarter of 2020:
• |
Pay common dividends at the same per share level as paid during the second quarter of 2020, provided that the amount does not exceed the average of the firm's net income for the four preceding calendar quarters; |
• |
Purchase common shares in an amount that equals the amount of share issuances related to expensed employee compensation; and |
• |
Make scheduled payments on additional Tier 1 and Tier 2 capital instruments. |
The Federal Reserve has indicated that it reserves the right to extend these limitations to additional quarters, potentially in modified form.
The PNC Financial Services Group, Inc. – Form 10-Q 37
In June 2020, the Federal Reserve also announced that all 2020 CCAR-participating firms (including PNC) would be required to conduct an additional round of company and supervisory stress tests in the fourth quarter of 2020 using updated baseline and stressed scenarios that better incorporate the current, expected and potential effects of the COVID-19 pandemic. The Federal Reserve has indicated it will provide updated supervisory scenarios to firms by September 30, 2020, and stress test projections and updated capital plans will be due within 45 days of distribution of the supervisory scenarios. It is unclear at this time how the Federal Reserve expects to utilize the results of this additional 2020 stress test or what, if any, impact this additional round of stress testing may have on the SCB or authorized capital distributions of participating firms.
Table 30: Basel III Capital
Dollars in millions |
Basel III
June 30, 2020 (a)
|
June 30, 2020 (Fully Implemented)
(estimated) (b)
|
||||||
Common equity Tier 1 capital |
||||||||
Common stock plus related surplus, net of treasury stock |
$ |
873 |
$ |
873 |
||||
Retained earnings |
46,381 |
44,986 |
||||||
Goodwill, net of associated deferred tax liabilities |
(9,025 |
) |
(9,025 |
) |
||||
Other disallowed intangibles, net of deferred tax liabilities |
(197 |
) |
(197 |
) |
||||
Other adjustments/(deductions) |
(75 |
) |
(78 |
) |
||||
Common equity Tier 1 capital |
$ |
37,957 |
$ |
36,559 |
||||
Additional Tier 1 capital |
||||||||
Preferred stock plus related surplus |
3,995 |
3,995 |
||||||
Other adjustments/(deductions) |
— |
— |
||||||
Tier 1 capital |
$ |
41,952 |
$ |
40,554 |
||||
Additional Tier 2 capital |
||||||||
Qualifying subordinated debt |
4,100 |
4,100 |
||||||
Trust preferred capital securities |
40 |
— |
||||||
Eligible credit reserves includable in Tier 2 capital |
4,192 |
4,192 |
||||||
Total Basel III capital |
$ |
50,284 |
$ |
48,846 |
||||
Risk-weighted assets |
||||||||
Basel III standardized approach risk-weighted assets (c) |
$ |
336,990 |
$ |
335,615 |
||||
Average quarterly adjusted total assets |
$ |
446,741 |
$ |
445,343 |
||||
Supplementary leverage exposure (d) |
$ |
452,000 |
$ |
522,843 |
||||
Basel III risk-based capital and leverage ratios (a)(e) |
||||||||
Common equity Tier 1 |
11.3 |
% |
10.9 |
% |
||||
Tier 1 |
12.4 |
% |
12.1 |
% |
||||
Total (f) |
14.9 |
% |
14.6 |
% |
||||
Leverage (g) |
9.4 |
% |
9.1 |
% |
||||
Supplementary leverage ratio (d)(h) |
9.3 |
% |
7.8 |
% |
||||
(a) |
The ratios are calculated to reflect PNC's election to adopt the CECL optional five-year transition provision. |
(b) |
The ratios are calculated to reflect the full impact of CECL and excludes the benefits of the optional five-year transition provision. |
(c) |
Basel III standardized approach weighted-assets are based on the Basel III standardized approach rules and include credit and market risk-weighted assets. |
(d) |
As of June 30, 2020 the Supplementary leverage exposure and Supplementary leverage ratio reflects the temporary exclusions of U.S. Treasury securities and deposits at Federal Reserve Banks. |
(e) |
All ratios are calculated using the regulatory capital methodology applicable to PNC and calculated based on the standardized approach. |
(f) |
The Basel III Total risk-based capital ratios include nonqualifying trust preferred capital securities of $40 million that are subject to a phase-out period that runs through 2021. |
(g) |
Leverage ratio is calculated based on Tier 1 capital divided by Average quarterly adjusted total assets. |
(h) |
The Supplementary leverage ratio is calculated based on Tier 1 capital divided by Supplementary leverage exposure, which takes into account both on balance sheet assets as well as certain off-balance sheet items, including loan commitments and potential future exposure under derivative contracts. |
As of January 1, 2020, the 2019 Tailoring Rules became effective for PNC. The most significant changes involve the election to exclude specific AOCI items from common equity Tier 1 (CET1) capital and higher thresholds used to calculate CET1 capital deductions. Effective January 1, 2020, PNC must deduct from CET1 capital (net of associated deferred tax liabilities) investments in unconsolidated financial institutions, mortgage servicing rights and deferred tax assets to the extent such items individually exceed 25% of the institution’s adjusted CET1 capital.
PNC’s regulatory risk-based capital ratios in 2020 are calculated using the standardized approach for determining risk-weighted assets. Under the standardized approach for determining credit risk-weighted assets, exposures are generally assigned a pre-defined risk
38 The PNC Financial Services Group, Inc. – Form 10-Q
weight. Exposures to high volatility commercial real estate, past due exposures and equity exposures are generally subject to higher risk weights than other types of exposures.
On March 27, 2020, the regulatory agencies issued an interim final rule permitting banks to delay the estimated impact on regulatory capital stemming from implementing CECL. CECL’s estimated impact on CET1 capital, as defined by the rule, is the change in retained earnings at adoption plus or minus 25% of the change in CECL ACL at the balance sheet date compared to the CECL ACL at transition. The estimated CECL impact is added to CET1 capital through December 31, 2021, then phased-out over the following three years. PNC elected to adopt this optional transition provision effective March 31, 2020. See additional discussion of this interim final rule in the Recent Regulatory Developments section and Item 2 Risk Management of our first quarter 2020 Form 10-Q.
In April 2020, in response to the economic conditions caused by COVID-19, the Federal Reserve issued an interim final rule that revises, on a temporary basis, the calculation of supplementary leverage exposure (the denominator of the supplementary leverage ratio) by bank holding companies to exclude the on-balance sheet amounts of U.S. Treasury securities and deposits at Federal Reserve Banks. The rule was effective as of April 14, 2020 and will remain in effect through March 31, 2021. See additional discussion of this interim final rule in the Recent Regulatory Developments section of our first quarter 2020 Form 10-Q.
Federal banking regulators have stated that they expect the largest U.S. bank holding companies (BHCs), including PNC, to have a level of regulatory capital well in excess of the regulatory minimum and have required the largest U.S. BHCs, including PNC, to have a capital buffer sufficient to withstand losses and allow them to meet the credit needs of their customers through estimated stress scenarios. We seek to manage our capital consistent with these regulatory principles, and believe that our June 30, 2020 capital levels were aligned with them.
At June 30, 2020, PNC and PNC Bank, our sole bank subsidiary, were both considered “well capitalized,” based on applicable U.S. regulatory capital ratio requirements. To qualify as “well capitalized”, PNC must have Basel III capital ratios of at least 6% for Tier 1 risk-based capital and 10% for Total risk-based capital, and PNC Bank must have Basel III capital ratios of at least 6.5% for Common equity Tier 1 risk-based capital, 8% for Tier 1 risk-based capital, 10% for Total risk-based capital and a Leverage ratio of at least 5%.
See the Recent Regulatory Developments section of our first quarter 2020 Form 10-Q for recent developments that could have a potential impact on our Basel III capital ratios. We provide additional information regarding regulatory capital requirements and some of their potential impacts on us in the Supervision and Regulation section of Item 1 Business, Item 1A Risk Factors and Note 18 Regulatory Matters in our 2019 Form 10-K.
Market Risk Management
See the Market Risk Management portion of the Risk Management Section in our 2019 Form 10-K for additional discussion regarding market risk.
Market Risk Management – Interest Rate Risk
Interest rate risk results primarily from our traditional banking activities of gathering deposits and extending loans. Many factors, including economic and financial conditions, movements in interest rates and consumer preferences, affect the difference between the interest that we earn on assets and the interest that we pay on liabilities and the level of our noninterest-bearing funding sources. Due to the repricing term mismatches and embedded options inherent in certain of these products, changes in market interest rates not only affect expected near-term earnings, but also the economic values of these assets and liabilities.
Our Asset and Liability Management group centrally manages interest rate risk as prescribed in our risk management policies, which are approved by management’s Asset and Liability Committee and the Risk Committee of the Board of Directors.
The PNC Financial Services Group, Inc. – Form 10-Q 39
Sensitivity results and market interest rate benchmarks for the second quarter of 2020 and 2019 follow.
Table 31: Interest Sensitivity Analysis
Second Quarter 2020 |
Second Quarter 2019 |
|||||
Net Interest Income Sensitivity Simulation (a) |
||||||
|
Effect on net interest income in first year from gradual interest rate change over the
following 12 months of:
|
||||||
100 basis point increase |
3.2 |
% |
1.9 |
% |
||
|
Effect on net interest income in second year from gradual interest rate change over the
preceding 12 months of:
|
||||||
100 basis point increase |
11.2 |
% |
4.8 |
% |
||
Duration of Equity Model (a) |
||||||
Base case duration of equity (in years) |
(8.1 |
) |
(4.7 |
) |
||
Key Period-End Interest Rates |
||||||
One-month LIBOR |
.16 |
% |
2.40 |
% |
||
Three-month LIBOR |
.30 |
% |
2.32 |
% |
||
Three-year swap |
.23 |
% |
1.74 |
% |
||
(a) |
Given the inherent limitations in certain of these measurement tools and techniques, results become less meaningful as interest rates approach zero. Senior management approved the suspension of the 100bps decrease in rate change sensitivities considering the current low rate environment. |
In addition to measuring the effect on net interest income assuming parallel changes in current interest rates, we routinely simulate the effects of a number of nonparallel interest rate environments. Table 32 reflects the percentage change in net interest income over the next two 12-month periods assuming (i) the PNC Economist’s most likely rate forecast, (ii) implied market forward rates and (iii) yield curve slope flattening (a 50 basis point yield curve slope flattening between one-month and ten-year rates superimposed on current base rates) scenario.
All changes in forecasted net interest income are relative to results in a base rate scenario where current market rates are assumed to remain unchanged over the forecast horizon.
Table 32: Net Interest Income Sensitivity to Alternative Rate Scenarios
June 30, 2020 |
|||||||
|
PNC
Economist
|
Market
Forward
|
Slope
Flattening
|
|||||
First year sensitivity |
(.5 |
)% |
1.0 |
% |
(1.0 |
)% |
|
Second year sensitivity |
.4 |
% |
1.4 |
% |
(3.1 |
)% |
|
When forecasting net interest income, we make assumptions about interest rates and the shape of the yield curve, the volume and characteristics of new business and the behavior of existing on- and off-balance sheet positions. These assumptions determine the future level of simulated net interest income in the base interest rate scenario and the other interest rate scenarios presented in Tables 31 and 32. These simulations assume that as assets and liabilities mature, they are replaced or repriced at then current market rates.
40 The PNC Financial Services Group, Inc. – Form 10-Q
The following graph presents the LIBOR/Swap yield curves for the base rate scenario and each of the alternate scenarios one year forward.
Table 33: Alternate Interest Rate Scenarios: One Year Forward
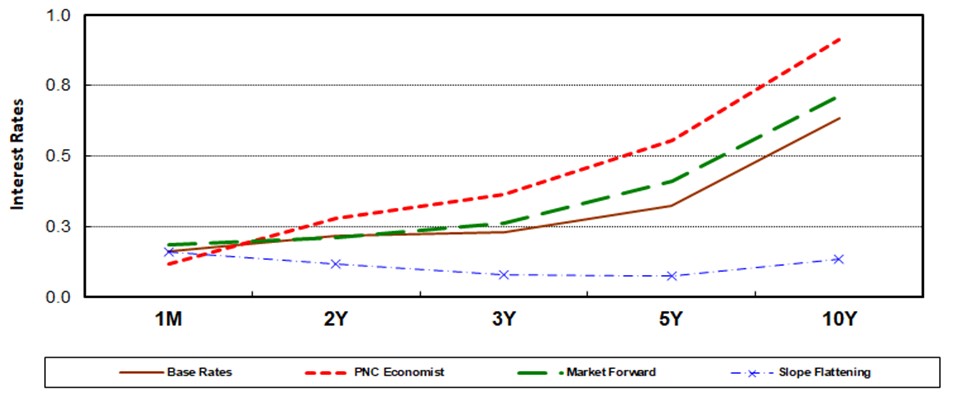
The second quarter 2020 interest sensitivity analyses indicate that our Consolidated Balance Sheet is positioned to benefit from an increase in interest rates and an upward sloping interest rate yield curve. We believe that we have the deposit funding base and balance sheet flexibility to adjust, where appropriate and permissible, to changing interest rates and market conditions.
The planned discontinuance of the requirement that banks submit rates for the calculation of LIBOR after 2021 presents risks to the financial instruments originated, held, or serviced by PNC that use LIBOR as a reference rate. PNC holds instruments and services its instruments and instruments owned by others that may be impacted by the likely discontinuance of LIBOR, including loans, investments, hedging products, floating-rate obligations, and other financial instruments that use LIBOR as a reference rate. The transition from LIBOR as an interest rate benchmark will subject PNC to financial, legal, operational, and reputational risks.
PNC has established a cross functional governance structure to oversee the overall strategy for the transition from LIBOR and mitigate risks associated with the transition. An initial LIBOR impact and risk assessment has been performed, which identified the associated risks across products, systems, models and processes. PNC is actively monitoring its overall firm-wide exposure to LIBOR and using these results to plan transitional strategies and track progress versus these goals.
We also continue to focus our transition efforts on:
• |
enhancing fallback language in new contracts and reviewing existing legal contracts/agreements to assess fallback language impacts; |
• |
making preparations for internal operational readiness; |
• |
making necessary enhancements to our infrastructure including systems, models, valuation tools, and processes; |
• |
developing and delivering on internal and external LIBOR cessation communication plans; |
• |
engaging with our clients, industry working groups, and regulators; and |
• |
monitoring developments associated with LIBOR alternatives and industry practices related to LIBOR-indexed instruments. |
See the Risk Factors section in Item IA and Risk Management Market Rate Management - Interest Rate Risk section in Item 7 disclosed in our 2019 Form 10-K for additional information regarding the planned discontinuance of LIBOR as a reference rate.
Market Risk Management – Customer-Related Trading Risk
We engage in fixed income securities, derivatives and foreign exchange transactions to support our customers’ investing and hedging activities. These transactions, related hedges and the credit valuation adjustment related to our customer derivatives portfolio are marked-to-market daily and reported as customer-related trading activities. We do not engage in proprietary trading of these products.
We use value-at-risk (VaR) as the primary means to measure and monitor market risk in customer-related trading activities. VaR is used to estimate the probability of portfolio losses based on the statistical analysis of historical market risk factors. A diversified VaR reflects empirical correlations across different asset classes. We calculate a diversified VaR at a 95% confidence interval and the results for the first six months of 2020 and 2019 were within our acceptable limits.
See the Market Risk Management – Customer-Related Trading Risk section of our 2019 Form 10-K for more information on our models used to calculate VaR and our backtesting process.
The PNC Financial Services Group, Inc. – Form 10-Q 41
Customer related trading revenue was $185 million for the six months ended June 30, 2020 compared to $135 million for the same period in 2019. For the quarterly period, customer related trading revenue was $114 million for the second quarter of 2020 compared to $87 million in 2019. The increase was primarily due to higher derivative sales to clients mainly due to interest rate and oil price volatility.
Market Risk Management – Equity And Other Investment Risk
Equity investment risk is the risk of potential losses associated with investing in both private and public equity markets. In addition to extending credit, taking deposits, underwriting securities and trading financial instruments, we make and manage direct investments in a variety of transactions, including management buyouts, recapitalizations and growth financings in a variety of industries. We also have investments in affiliated and non-affiliated funds that make similar investments in private equity. The economic and/or book value of these investments and other assets are directly affected by changes in market factors.
Various PNC business units manage our equity and other investment activities. Our businesses are responsible for making investment decisions within the approved policy limits and associated guidelines.
A summary of our equity investments follows:
Table 34: Equity Investments Summary
June 30 2020 |
December 31 2019 |
Change |
|||||||||||||
Dollars in millions |
$ |
% |
|||||||||||||
Tax credit investments |
$ |
2,141 |
$ |
2,218 |
$ |
(77 |
) |
(3 |
)% |
||||||
Private equity and other |
2,802 |
2,958 |
(156 |
) |
(5 |
)% |
|||||||||
Total |
$ |
4,943 |
$ |
5,176 |
$ |
(233 |
) |
(5 |
)% |
||||||
Tax Credit Investments
Included in our equity investments are direct tax credit investments and equity investments held by consolidated entities. These tax credit investment balances included unfunded commitments totaling $.8 billion and $1.0 billion at June 30, 2020 and December 31, 2019, respectively. These unfunded commitments are included in Other liabilities on our Consolidated Balance Sheet.
Note 2 Loan Sale and Servicing Activities and Variable Interest Entities in the Notes To Consolidated Financial Statements in our 2019 Form 10-K has further information on Tax Credit Investments.
Private Equity and Other
The majority of our other equity investments consists of our private equity portfolio. The private equity portfolio is an illiquid portfolio consisting of mezzanine and equity investments that vary by industry, stage and type of investment. Private equity investments carried at estimated fair value totaled $1.4 billion and $1.5 billion at June 30, 2020 and December 31, 2019, respectively. As of June 30, 2020, $1.2 billion was invested directly in a variety of companies and $.2 billion was invested indirectly through various private equity funds. See the Supervision and Regulation section in Item 1 of our 2019 Form 10-K for discussion of the potential impacts of the Volcker Rule provisions of Dodd-Frank on our interests in and other relationships with private funds covered by the Volcker Rule.
Included in our other equity investments are Visa Class B common shares, which are recorded at cost. Visa Class B common shares that we own are transferable only under limited circumstances until they can be converted into shares of the publicly-traded Class A common shares, which cannot happen until the resolution of the pending interchange litigation. Based upon the June 30, 2020 per share closing price of $193.17 for a Visa Class A common share, the estimated value of our total investment in the Class B common shares was approximately $1.1 billion at the current conversion rate of Visa B shares to Visa A shares, while our cost basis was not significant. See Note 6 Fair Value and Note 19 Legal Proceedings in the Notes To Consolidated Financial Statements in Item 8 of our 2019 10-K for additional information regarding our Visa agreements. The estimated value does not represent fair value of the Visa B common shares given the share’s limited transferability and the lack of observable transactions in the marketplace.
We also have certain other equity investments, the majority of which represent investments in affiliated and non-affiliated funds with both traditional and alternative investment strategies. Net gains related to these investments were not significant at June 30, 2020 and June 30, 2019.
Financial Derivatives
We use a variety of financial derivatives as part of the overall asset and liability risk management process to help manage exposure to market (primarily interest rate) and credit risk inherent in our business activities. We also enter into derivatives with customers to facilitate their risk management activities.
42 The PNC Financial Services Group, Inc. – Form 10-Q
Financial derivatives involve, to varying degrees, market and credit risk. Derivatives represent contracts between parties that usually require little or no initial net investment and result in one party delivering cash or another type of asset to the other party based on a notional and an underlying as specified in the contract. Therefore, cash requirements and exposure to credit risk are significantly less than the notional amount on these instruments.
Further information on our financial derivatives is presented in Note 1 Accounting Policies, Note 6 Fair Value and Note 13 Financial Derivatives in our Notes To Consolidated Financial Statements in our 2019 Form 10-K and in Note 12 Fair Value and Note 13 Financial Derivatives in the Notes To Consolidated Financial Statements in this Report.
Not all elements of market and credit risk are addressed through the use of financial derivatives, and such instruments may be ineffective for their intended purposes due to unanticipated market changes, among other reasons.
RECENT REGULATORY DEVELOPMENTS
Since the outbreak of COVID-19, the U.S. Government has taken a wide variety of actions in order to aid businesses and consumers financially impacted by COVID-19, facilitate the orderly functioning of financial markets and assist banking organizations in being able to meet the credit and other banking needs of their customers and communities. The following provides an overview of the most significant recent COVID-related actions affecting U.S. banking organizations, such as PNC. See Item 2 Recent Regulatory Developments and Item 1A Risk Factors in our first quarter 2020 Form 10-Q for a description of the risks presented by COVID-19.
CARES Act Related Developments
In July 2020, President Trump signed an extension of the PPP, which provides forgivable loans to small and medium-sized businesses affected by the pandemic. The extension authorizes the SBA to continue to accept PPP loan applications until August 8, 2020. PNC Bank continues to participate in the PPP with our focus shifting to the loan forgiveness process.
Capital, Capital Planning and Liquidity
In June 2020, the Federal Reserve announced the results of its stress tests for 2020 and additional sensitivity analyses that the agency conducted in light of COVID-19. See the Liquidity and Capital Management portion of the Risk Management section in this Item 2 for a discussion of PNC’s results and capital actions. Concurrently, the Federal Reserve announced that it will, among other actions, require banks like PNC to suspend share repurchases (except those to offset the effects of employee benefit plan-related issuances), resubmit their capital plans, and conduct additional stress analyses later this year as economic conditions evolve. These capital distribution limitations will apply for the third quarter of 2020, and may be extended by the Federal Reserve.
In May 2020, the Federal Reserve, Federal Deposit Insurance Corporation (FDIC), and the Office of the Comptroller of the Currency (OCC) issued an interim final rule that modifies the agencies’ LCR rule to support banking organizations’ participation in the Federal Reserve’s Money Market Mutual Fund Liquidity Facility (MMLF) and the PPP Liquidity Facility (PPPLF). The interim final rule neutralizes the LCR impact associated with the non-recourse funding provided by these facilities. Separately, in June 2020, the FDIC issued a final rule to mitigate the deposit insurance assessment effects of participating in the PPP, the PPPLF, and the MMLF. Among other changes, the final rule removes the effect of participation in the PPP and borrowings under the PPPLF on various risk measures used to calculate the assessment rate of an insured depository institution like PNC Bank, and provides an offset to an insured depository institution’s assessment for the increase to its assessment base attributable to participation in the PPP and MMLF. The final rule will be applied to assessments starting in the second quarter of 2020. Similarly, in June 2020, the OCC issued an interim final rule that will reduce assessments due to be paid to the OCC on September 30, 2020. Under the interim final rule, assessments due will be calculated using the lower of the bank’s assets on December 31, 2019 or June 30, 2020.
In May 2020, the Federal Reserve, FDIC, and OCC issued an interim final rule that permits depository institutions like PNC Bank to elect to exclude, until March 31, 2021, U.S. Treasury securities and deposits at Federal Reserve Banks from its supplementary leverage exposure for purposes of calculating the institution’s supplementary leverage ratio (SLR). If a depository institution elects to exclude these items from its SLR calculation, it must obtain the approval of its primary federal banking regulator before making capital distributions as long as the exclusion is in effect. In light of PNC Bank’s strong SLR, PNC Bank has not elected to take advantage of this interim final rule.
In May 2020, the Federal Reserve and FDIC extended, until September 29, 2021, the submission date for the next resolution plans for Category II and Category III organizations, such as PNC, under section 165(d) of the Dodd-Frank Act.
In April 2020, the Federal Reserve announced temporary actions aimed at increasing the availability of intraday credit extended by Federal Reserve Banks on both a collateralized and uncollateralized basis. Among other actions, the Federal Reserve suspended uncollateralized intraday credit limits (net debit caps), waived overdraft fees for institutions that are eligible for the primary credit program, and suspended two collections of information that are used to calculate net debit caps. These temporary actions are currently scheduled to remain in effect until September 30, 2020.
The PNC Financial Services Group, Inc. – Form 10-Q 43
In April 2020, the Federal Reserve also amended Regulation D (reserve requirements for depository institutions) to eliminate the regulatory six-per-month limit on certain types of transfers from the savings deposits, which may result in certain changes to how depository institutions (such as PNC Bank) classify and report deposit balances.
Other Developments
The regulatory agencies also recently finalized a number of non-COVID-19-related rules. For example, in July 2020, the CFPB issued a final rule rescinding the mandatory underwriting provisions of its 2017 payday lending rule that required lenders to make certain underwriting determinations prior to issuing payday and other covered loans, but leaving intact the payments provisions of the 2017 rule. In connection with issuing this final rule, the CFPB also issued a statement indicating that it did not intend to take supervisory or enforcement action to enforce the application of the final rule to loans with an original principal balance that exceeds $58,300.
In June 2020, the Federal Reserve, FDIC, OCC, SEC, and the Commodity Futures Trading Commission (CFTC) finalized a rule modifying the Volcker rule’s prohibition on banking entities investing in or sponsoring hedge funds or private equity funds (referred to under the rule as covered funds). The final rule streamlines several aspects of the covered funds portion of the rule; allows banking organizations to offer and sponsor venture capital funds and a wider array of loan-related funds; and permits banking entities to offer financial services to, and engage in other activities with, covered funds that do not raise concerns that the Volcker rule was intended to address. The final rule will be effective October 1, 2020.
In June 2020, the Federal Reserve, FDIC, OCC, Farm Credit Administration, and the Federal Housing Finance Agency finalized amendments to the swap margin rule. Under the final rule, entities that are part of the same banking organization-like PNC Bank and its affiliates-generally will no longer be required to hold a specific amount of initial margin for uncleared swaps with each other (known as inter-affiliate swaps), unless the aggregate initial margin calculation amount for such swaps exceeds 15 percent of the covered swap entity’s tier 1 capital. Additionally, among other changes, the final rule allows swap entities to amend legacy swaps to replace references to the London Inter-bank Offered Rate (LIBOR) or other reference rates that are expected to be discontinued without triggering margin exchange requirements. Separately, the agencies issued an interim final rule that extends the compliance date under the swap margin rule for entities like PNC to September 1, 2021.
In June 2020, the OCC released a notice of proposed rulemaking (NPR) to update its rules for national bank and federal savings association activities and operations. Among other significant changes, the NPR would incorporate and streamline interpretations addressing permissible derivatives activities and codify interpretations that permit national banks to engage in certain tax equity finance transactions and participate in payment systems. Separately, the OCC also released an advance notice of proposed rulemaking (ANPR) seeking public comment on how the OCC’s rules could be modified to better facilitate the provision of banking products and services through digital means. Comments for the NPR and ANPR are due on August 3, 2020.
With respect to consumer financial protection matters, in June 2020, the Consumer Financial Protection Bureau (CFPB) issued an
interim final rule amending its Regulation X to facilitate the offering of COVID-19 related loss mitigation options to mortgage
borrowers. The amendments temporarily permit mortgage servicers like PNC Bank to offer certain loss mitigation options without
obtaining a complete loss mitigation application. Mortgage servicers may offer such loss mitigation options to borrowers participating
in COVID-related payment forbearance programs or experiencing financial hardships due to COVID-19.
In June 2020, the U.S. Supreme Court held that the Dodd-Frank Act provision that allows the President to remove the CFPB’s single director only for inefficiency, neglect, or malfeasance violates the separation of powers in the U.S. Constitution, but otherwise left the structure and powers of the CFPB intact. In response, the CFPB in July 2020 issued a ratification through its now removable-at-will director of the large majority of its existing regulations and certain other regulatory actions taken from January 4, 2012 through June 30, 2020.
In May 2020, the CFPB issued a final rule covering remittance transfers, which allows certain banks and credit unions to continue to
provide estimates of the exchange rate and certain remittance fees under certain conditions.
In May 2020, the OCC finalized amendments to its regulations implementing the Community Reinvestment Act (CRA), which requires the agencies to assess a bank’s record of meeting the credit needs of its entire community, including low- and moderate-income neighborhoods. The final rule significantly revamps for national banks like PNC Bank how the OCC defines what qualifies for CRA credit, where such activity must be conducted to receive credit, how CRA performance is measured, and how CRA performance is documented and reported. The final rule is effective October 1, 2020, with a compliance date of January 1, 2023, for PNC Bank. The OCC has indicated it will conduct a future rulemaking to set the quantitative levels of CRA activity that a national bank would have to achieve to receive a Satisfactory or Outstanding CRA rating, either within a particular assessment area or overall.
In May 2020, the OCC finalized a rule to address the legal uncertainty regarding the effect of a transfer on a loan’s permissible interest rate caused by the Second Circuit’s 2015 decision in Madden v. Midland Funding, LLC. The rule clarifies that when a national bank like PNC Bank sells, assigns, or otherwise transfers a loan, interest permissible before the transfer continues to be permissible after the transfer. In June 2020, the FDIC issued a final regulation for state banks that mirrors the OCC’s rule.
44 The PNC Financial Services Group, Inc. – Form 10-Q
CRITICAL ACCOUNTING ESTIMATES AND JUDGMENTS
Note 1 Accounting Policies of our 2019 Form 10-K describes the most significant accounting policies that we use to prepare our consolidated financial statements, including discussion of our policies for the Allowances for Loan and Lease Losses and Unfunded Loan Commitments and Letters of Credit, prior to the adoption of the CECL standard. See Note 1 Accounting Policies in the Notes To Consolidated Financial Statements in this Report regarding the impact of new accounting pronouncements, including CECL, that were adopted in the first and second quarters of 2020.
Certain policies require us to make estimates or economic assumptions that may vary under different assumptions or conditions, and
such variations may significantly affect our reported results and financial position for the period or in future periods.
The following critical accounting policies and judgments are described in more detail in Critical Accounting Estimates and Judgments in Item 7 of our 2019 Form 10-K:
• |
Fair Value Measurements |
• |
Residential and Commercial Mortgage Servicing Rights |
Allowance for Credit Losses
We maintain the ACL at levels that we believe to be appropriate as of the balance sheet date to absorb expected credit losses on our existing investment securities, loans, finance leases (including residual values), other financial assets and unfunded lending related commitments, for the remaining contractual term of the assets taking into consideration expected prepayments. Our determination of the ACL is based on historical loss experience, borrower characteristics, current economic conditions, reasonable and supportable forecasts of future conditions and other relevant factors. We use methods sensitive to changes in economic conditions, to interpret these factors to estimate expected credit losses. We evaluate and, when appropriate, enhance the quality of our data and models and other methods used to estimate ACL on an ongoing basis. We apply qualitative factors to reflect in the ACL our best estimate of amounts that we do not expect to collect because of, among other things, idiosyncratic risk factors, changes in economic conditions that may not be reflected in forecasted results, or other potential methodology weaknesses. The ACL estimates are therefore susceptible to various factors, including, but not limited to, the following major factors:
•Current economic conditions and borrower quality: Our forecast of expected losses depends on conditions and portfolio
quality as of the estimation date. As current conditions evolve, forecasted losses could be materially affected.
• |
Scenario weights and design: Our loss estimates are sensitive to the shape and severity of macroeconomic forecasts and thus |
vary significantly between upside and downside scenarios. Change to probability weights assigned to these scenarios and
timing of peak business cycles reflected by the scenarios could materially affect our loss estimates.
• |
Portfolio volume and mix: Changes to portfolio volume and mix could materially affect our estimates, as CECL reserves |
would be recognized upon origination or acquisition.
For all assets and unfunded lending related commitments within the scope of the CECL standard, the applicable ACL is composed of one or a combination of the following components: (i) collectively assessed or pooled reserves, (ii) individually assessed reserves, and
(iii) qualitative (judgmental) reserves. Our methodologies and key assumptions for each of these components are discussed in Note 1
Accounting Policies in the Notes To Consolidated Financial Statements of this Report.
Reasonable and Supportable Economic Forecast
Under CECL, we are required to consider reasonable and supportable forecasts in estimating expected credit losses. For this purpose,
we have established a framework which includes a three year reasonable and supportable economic forecast period and the use of four
economic scenarios with associated probability weights, which in combination create a forecast of expected economic outcomes over
our reasonable and supportable forecast period (RSFP). Our RSFP credit loss estimates are sensitive to the shape and severity of the scenarios used and weights assigned to them.
To generate the four economic forecast scenarios we use a combination of quantitative macroeconomic models, other measures of economic activity and forward-looking expert judgment to forecast the distribution of economic outcomes over the RSFP. Each scenario is then given an associated probability (weight) in order to represent our current expectation within that distribution over the RSFP. This process is informed by current economic conditions, expected business cycle evolution and the expert judgment of PNC’s CECL Reserve Adequacy Committee (CECL RAC). This approach seeks to provide a reasonable representation of the forecast of expected economic outcomes and is used to estimate expected credit losses across a variety of loans and securities. Each quarter the scenarios are presented for approval to PNC’s CECL RAC and the committee determines and approves CECL scenarios weights for use for the current reporting period.
The scenarios used for the period ended June 30, 2020 were designed to address the impact of the continuing COVID-19 crisis on the macroeconomic environment, based on our best estimate as of June 30, 2020. We used a number of economic variables, with the largest drivers being GDP and the unemployment rate measures. Using a weighted average of our four economic forecast scenarios, we estimated at June 30, 2020 that annualized GDP contracts 6.2% in the third quarter of 2020, finishing the year down 4.9% from
The PNC Financial Services Group, Inc. – Form 10-Q 45
fourth quarter 2019 levels and recovering to pre-recession peak levels by the first quarter of 2022. Additionally, the quarterly unemployment rate falls to 9.5% in the fourth quarter of 2020, from a peak of 13.6% in the second quarter, with the labor market continuing to recover in 2021 and 2022. We believe that the economic assumptions used in the scenarios for the second quarter of 2020 sufficiently reflect the life of loan losses in the current portfolio, and based on these assumptions we do not anticipate any substantial reserve builds related to our current portfolio during the remainder of 2020.
For internal analytical purposes, we considered what our capital ratios would be if we had an ACL at December 31, 2020 equal to the Federal Reserve's estimated nine quarter credit losses for PNC under the 2020 CCAR supervisory severely adverse scenario of $12.1 billion, essentially adding $5.5 billion in reserves over the next two quarters. This analysis resulted in a CET1 ratio of approximately 10.0% at December 31, 2020, a level well above 7.0%, which is our regulatory minimum of 4.5% plus our Stress Capital Buffer of 2.5%. This scenario was not our expectation at June 30, 2020 and does not reflect our current expectation, nor does it capture all the potential unknown variables that would likely arise through the remainder of 2020, but it provides an approximation of a possible outcome under hypothetical severe conditions. The CECL methodology inherently requires a high degree of judgment. As a result, it is possible that we may, at another point in time, reach different conclusions regarding our credit loss estimates.
See the following for additional details on the components of our ACL, as well as the methodologies and related assumptions:
• |
Allowance For Credit Losses in the Credit Risk Management section of this Financial Review, and |
• |
Note 1 Accounting Policies, Note 3 Investment Securities and Note 4 Loans and Related Allowance for Credit Losses in the Notes To Consolidated Financial Statements included in this Report.
|
OFF-BALANCE SHEET ARRANGEMENTS AND VARIABLE INTEREST ENTITIES
We engage in a variety of activities that involve entities that are not consolidated or otherwise reflected in our Consolidated Balance Sheet that are generally referred to as off-balance sheet arrangements. Additional information on these types of activities is included in our 2019 Form 10-K and in Note 5 Loan Sale and Servicing Activities and Variable Interest Entities and Note 9 Commitments in the Notes To Consolidated Financial Statements included in this Report.
A summary and further description of variable interest entities (VIEs) is included in Note 1 Accounting Policies and Note 2 Loan Sale and Servicing Activities and Variable Interest Entities in our 2019 Form 10-K.
Trust Preferred Securities
See Note 10 Borrowed Funds in the Notes To Consolidated Financial Statements in our 2019 Form 10-K for additional information on trust preferred securities issued by PNC Capital Trust C including information on contractual limitations potentially imposed on payments (including dividends) with respect to PNC's equity securities.
INTERNAL CONTROLS AND DISCLOSURE CONTROLS AND PROCEDURES
As of June 30, 2020, we performed an evaluation under the supervision of and with the participation of our management, including the Chairman, President and Chief Executive Officer and the Executive Vice President and Chief Financial Officer, of the effectiveness of the design and operation of our disclosure controls and procedures and of changes in our internal control over financial reporting.
Based on that evaluation, our Chairman, President and Chief Executive Officer and our Executive Vice President and Chief Financial Officer concluded that our disclosure controls and procedures (as defined in Rule 13a-15(e) under the Securities Exchange Act of 1934) were effective as of June 30, 2020, and that there has been no change in PNC’s internal control over financial reporting that occurred during the second quarter of 2020 that has materially affected, or is reasonably likely to materially affect, our internal control over financial reporting.
GLOSSARY OF TERMS
For a glossary of terms commonly used in our filings, please see the glossary of terms updated in our first quarter 2020 Form 10-Q and our 2019 Form 10-K.
46 The PNC Financial Services Group, Inc. – Form 10-Q
CAUTIONARY STATEMENT REGARDING FORWARD-LOOKING INFORMATION
We also make statements in this Report, and we may from time to time make other statements, regarding our outlook for earnings, revenues, expenses, tax rates, capital and liquidity levels and ratios, asset levels, asset quality, financial position, and other matters regarding or affecting us and our future business and operations that are forward-looking statements within the meaning of the Private Securities Litigation Reform Act. Forward-looking statements are typically identified by words such as “believe,” “plan,” “expect,” “anticipate,” “see,” “look,” “intend,” “outlook,” “project,” “forecast,” “estimate,” “goal,” “will,” “should” and other similar words and expressions.
Forward-looking statements are necessarily subject to numerous assumptions, risks and uncertainties, which change over time. Future events or circumstances may change our outlook and may also affect the nature of the assumptions, risks and uncertainties to which our forward-looking statements are subject. Forward-looking statements speak only as of the date made. We do not assume any duty and do not undertake to update forward-looking statements. Actual results or future events could differ, possibly materially, from those anticipated in forward-looking statements, as well as from historical performance. As a result, we caution against placing undue reliance on any forward-looking statements.
Our forward-looking statements are subject to the following principal risks and uncertainties.
• |
Our businesses, financial results and balance sheet values are affected by business and economic conditions, including the following: |
– |
Changes in interest rates and valuations in debt, equity and other financial markets. |
– |
Disruptions in the U.S. and global financial markets. |
– |
Actions by the Federal Reserve Board, U.S. Treasury and other government agencies, including those that impact money supply and market interest rates. |
– |
Changes in customer behavior due to changing business and economic conditions or legislative or regulatory initiatives. |
– |
Changes in customers’, suppliers’ and other counterparties’ performance and creditworthiness. |
– |
Impacts of tariffs and other trade policies of the U.S. and its global trading partners. |
– |
The length and extent of economic contraction as a result of the COVID-19 pandemic. |
– |
Commodity price volatility. |
• |
Our forward-looking financial statements are subject to the risk that economic and financial market conditions will be substantially different than those we are currently expecting and do not take into account potential legal and regulatory contingencies. These statements are based on our view that: |
– |
PNC’s baseline economic forecast is for an economic recovery in the second half of 2020 and into 2021, following a very severe but short recession in the first half of 2020. Consumers are increasing their spending and workers are returning to their job sites as states are gradually lifting restrictions on businesses and activities because of the COVID-19 pandemic; fiscal stimulus from the federal government is also supporting economic growth in mid-2020. After a significant contraction in real GDP, steep job losses, and a large increase in the unemployment rate earlier in the second quarter, economic growth has resumed and the labor market is improving. |
– |
In the baseline forecast, real GDP increases in the third quarter as consumers start to spend again. Fiscal stimulus and extremely low interest rates support the recovery. Real GDP surpasses its pre-recession peak in 2022, and growth is well above its long-term trend through 2023. |
– |
The baseline forecast assumes that the Federal Open Market Committee keeps the federal funds rate in its current range of 0.00% to 0.25% into 2023. |
• |
Given the many unknowns and potential downside risks, including additional COVID-19 outbreaks, our forward-looking statements are subject to the risk that conditions will be substantially different than we are currently expecting. If efforts to contain COVID-19 are unsuccessful and restrictions on businesses and activities are reimposed or expanded, the economy could fall back into recession. The potential expiration of fiscal stimulus is also a major downside risk. The longer the labor market recovery takes, the more it will damage consumer fundamentals and sentiment. This could make the recovery weaker. Similarly, weak near-term growth could damage business fundamentals. And an extended global recession due to COVID-19 would weaken the U.S. recovery. As a result, the outbreak and its consequences, including responsive measures to manage it, have had and are likely to continue to have an adverse effect, possibly materially, on our business and financial performance by adversely affecting, possibly materially, the demand and profitability of our products and services, the valuation of assets and our ability to meet the needs of our customers. |
• |
PNC’s ability to take certain capital actions, including returning capital to shareholders beginning in the fourth quarter of 2020, is subject to PNC meeting or exceeding a stress capital buffer established by the Federal Reserve Board in connection with the Federal Reserve Board's Comprehensive Capital Analysis and Review (CCAR) process. The Federal Reserve also has imposed limitations on capital distributions in the third quarter of 2020 by CCAR-participating bank holding companies and may extend these limitations, potentially in modified form. |
• |
PNC’s regulatory capital ratios in the future will depend on, among other things, the company’s financial performance, the scope and terms of final capital regulations then in effect and management actions affecting the composition of PNC’s |
The PNC Financial Services Group, Inc. – Form 10-Q 47
balance sheet. In addition, PNC’s ability to determine, evaluate and forecast regulatory capital ratios, and to take actions (such as capital distributions) based on actual or forecasted capital ratios, will be dependent at least in part on the development, validation and regulatory review of related models.
• |
Legal and regulatory developments could have an impact on our ability to operate our businesses, financial condition, results of operations, competitive position, reputation, or pursuit of attractive acquisition opportunities. Reputational impacts could affect matters such as business generation and retention, liquidity, funding, and ability to attract and retain management. These developments could include: |
– |
Changes to laws and regulations, including changes affecting oversight of the financial services industry, consumer protection, bank capital and liquidity standards, pension, bankruptcy and other industry aspects, and changes in accounting policies and principles. |
– |
Unfavorable resolution of legal proceedings or other claims and regulatory and other governmental investigations or other inquiries. These matters may result in monetary judgments or settlements or other remedies, including fines, penalties, restitution or alterations in our business practices, and in additional expenses and collateral costs, and may cause reputational harm to PNC. |
– |
Results of the regulatory examination and supervision process, including our failure to satisfy requirements of agreements with governmental agencies. |
– |
Impact on business and operating results of any costs associated with obtaining rights in intellectual property claimed by others and of adequacy of our intellectual property protection in general. |
• |
Business and operating results are affected by our ability to identify and effectively manage risks inherent in our businesses, including, where appropriate, through effective use of systems and controls, third-party insurance, derivatives, and capital management techniques, and to meet evolving regulatory capital and liquidity standards. |
• |
We grow our business in part through acquisitions and new strategic initiatives. Risks and uncertainties include those presented by the nature of the business acquired and strategic initiative, including in some cases those associated with our entry into new businesses or new geographic or other markets and risks resulting from our inexperience in those new areas, as well as risks and uncertainties related to the acquisition transactions themselves, regulatory issues, and the integration of the acquired businesses into PNC after closing. |
• |
Competition can have an impact on customer acquisition, growth and retention and on credit spreads and product pricing, which can affect market share, deposits and revenues. Our ability to anticipate and respond to technological changes can also impact our ability to respond to customer needs and meet competitive demands. |
• |
Business and operating results can also be affected by widespread natural and other disasters, pandemics, dislocations, terrorist activities, system failures, security breaches, cyberattacks or international hostilities through impacts on the economy and financial markets generally or on us or our counterparties specifically. |
We provide greater detail regarding these as well as other factors in our 2019 Form 10-K and first quarter 2020 Form 10-Q and elsewhere in this Report, including in the Risk Factors and Risk Management sections and the Legal Proceedings and Commitments Notes of the Notes To Consolidated Financial Statements in these reports. In particular, our forward-looking statements are subject to risks and uncertainties related to the COVID-19 pandemic and the resulting governmental and societal responses. Our forward-looking statements may also be subject to other risks and uncertainties, including those we may discuss elsewhere in this Report or in our other filings with the SEC.
48 The PNC Financial Services Group, Inc. – Form 10-Q
CONSOLIDATED INCOME STATEMENT
THE PNC FINANCIAL SERVICES GROUP, INC.
Unaudited |
Three months ended June 30 |
Six months ended June 30 |
|||||||||||||
In millions, except per share data |
2020 |
2019 |
2020 |
2019 |
|||||||||||
Interest Income |
|||||||||||||||
Loans |
$ |
$ |
$ |
$ |
|||||||||||
Investment securities |
|||||||||||||||
Other |
|||||||||||||||
Total interest income |
|||||||||||||||
Interest Expense |
|||||||||||||||
Deposits |
|||||||||||||||
Borrowed funds |
|||||||||||||||
Total interest expense |
|||||||||||||||
Net interest income |
|||||||||||||||
Noninterest Income |
|||||||||||||||
Asset management |
|||||||||||||||
Consumer services |
|||||||||||||||
Corporate services |
|||||||||||||||
Residential mortgage |
|||||||||||||||
Service charges on deposits |
|||||||||||||||
Other |
|||||||||||||||
Total noninterest income |
|||||||||||||||
Total revenue |
|||||||||||||||
Provision For Credit Losses |
|||||||||||||||
Noninterest Expense |
|||||||||||||||
Personnel |
|||||||||||||||
Occupancy |
|||||||||||||||
Equipment |
|||||||||||||||
Marketing |
|||||||||||||||
Other |
|||||||||||||||
Total noninterest expense |
|||||||||||||||
Income (loss) from continuing operations before income taxes and noncontrolling interests |
( |
) |
( |
) |
|||||||||||
Income taxes (benefit) from continuing operations |
( |
) |
( |
) |
|||||||||||
Net income (loss) from continuing operations |
( |
) |
|||||||||||||
Income from discontinued operations before taxes |
|||||||||||||||
Income taxes from discontinued operations |
|||||||||||||||
Net income from discontinued operations |
|||||||||||||||
Net income |
|||||||||||||||
Less: Net income attributable to noncontrolling interests |
|||||||||||||||
Preferred stock dividends |
|||||||||||||||
Preferred stock discount accretion and redemptions |
|||||||||||||||
Net income attributable to common shareholders |
$ |
$ |
$ |
$ |
|||||||||||
Earnings Per Common Share |
|||||||||||||||
Basic earnings (loss) from continuing operations |
$ |
( |
) |
$ |
$ |
( |
) |
$ |
|||||||
Basic earnings from discontinued operations |
|||||||||||||||
Total basic earnings |
$ |
$ |
$ |
$ |
|||||||||||
Diluted earnings (loss) from continuing operations |
$ |
( |
) |
$ |
$ |
( |
) |
$ |
|||||||
Diluted earnings from discontinued operations |
|||||||||||||||
Total diluted earnings |
$ |
$ |
$ |
$ |
|||||||||||
Average Common Shares Outstanding |
|||||||||||||||
Basic |
|||||||||||||||
Diluted |
|||||||||||||||
See accompanying Notes To Consolidated Financial Statements.
The PNC Financial Services Group, Inc. – Form 10-Q 49
CONSOLIDATED STATEMENT OF COMPREHENSIVE INCOME
THE PNC FINANCIAL SERVICES GROUP, INC.
|
Unaudited
In millions
|
Three months ended June 30 |
Six months ended June 30 |
|||||||||||||||
2020 |
2019 |
2020 |
2019 |
||||||||||||||
Net income (loss) from continuing operations |
$ |
( |
) |
$ |
$ |
$ |
|||||||||||
Other comprehensive income (loss), before tax and net of reclassifications into Net income: |
|||||||||||||||||
Net unrealized gains (losses) on securities without an allowance for credit losses |
|||||||||||||||||
Net unrealized gains (losses) on securities with an allowance for credit losses |
( |
) |
( |
) |
|||||||||||||
Net unrealized gains (losses) on non-OTTI securities |
|||||||||||||||||
Net unrealized gains (losses) on OTTI securities |
|||||||||||||||||
Net unrealized gains (losses) on cash flow hedge derivatives |
|||||||||||||||||
Pension and other postretirement benefit plan adjustments |
( |
) |
( |
) |
( |
) |
|||||||||||
Other |
|||||||||||||||||
Other comprehensive income (loss) from continuing operations, before tax and net of reclassifications into Net income |
|||||||||||||||||
Income tax benefit (expense) from continuing operations related to items of other comprehensive income |
( |
) |
( |
) |
( |
) |
( |
) |
|||||||||
Other comprehensive income (loss) from continuing operations, after tax and net of reclassifications into Net income |
|||||||||||||||||
Net income from discontinued operations |
|||||||||||||||||
Other comprehensive income (loss) from discontinued operations, before tax and net of reclassifications into Net income |
( |
) |
( |
) |
|||||||||||||
Income tax benefit (expense) from discontinued operations related to items of other comprehensive income |
( |
) |
( |
) |
|||||||||||||
Other comprehensive income (loss) from discontinued operations, after tax and net of reclassifications into Net income |
( |
) |
( |
) |
|||||||||||||
Other comprehensive income (loss), after tax and net of reclassifications into Net income |
|||||||||||||||||
Comprehensive income |
|||||||||||||||||
Less: Comprehensive income attributable to noncontrolling interests |
|||||||||||||||||
Comprehensive income attributable to PNC |
$ |
$ |
$ |
$ |
|||||||||||||
See accompanying Notes To Consolidated Financial Statements.
50 The PNC Financial Services Group, Inc. – Form 10-Q
CONSOLIDATED BALANCE SHEET
THE PNC FINANCIAL SERVICES GROUP, INC.
Unaudited |
June 30 2020 |
December 31 2019 |
|||||
In millions, except par value | |||||||
Assets |
|||||||
Cash and due from banks |
$ |
$ |
|||||
Interest-earning deposits with banks |
|||||||
Loans held for sale (a) |
|||||||
Asset held for sale (b) |
|||||||
Investment securities – available for sale |
|||||||
Investment securities – held to maturity |
|||||||
Loans (a) |
|||||||
Allowance for loan and lease losses (c) |
( |
) |
( |
) |
|||
Net loans |
|||||||
Equity investments |
|||||||
Mortgage servicing rights |
|||||||
Goodwill |
|||||||
Other (a) |
|||||||
Total assets |
$ |
$ |
|||||
Liabilities |
|||||||
Deposits |
|||||||
Noninterest-bearing |
$ |
$ |
|||||
Interest-bearing |
|||||||
Total deposits |
|||||||
Borrowed funds |
|||||||
Federal Home Loan Bank borrowings |
|||||||
Bank notes and senior debt |
|||||||
Subordinated debt |
|||||||
Other (d) |
|||||||
Total borrowed funds |
|||||||
Allowance for unfunded lending related commitments (c) |
|||||||
Accrued expenses and other liabilities |
|||||||
Total liabilities |
|||||||
Equity |
|||||||
Preferred stock (e) |
|||||||
Common stock ($5 par value, Authorized 800 shares, issued 542 shares) |
|||||||
Capital surplus |
|||||||
Retained earnings |
|||||||
Accumulated other comprehensive income |
|||||||
Common stock held in treasury at cost: 117 and 109 shares |
( |
) |
( |
) |
|||
Total shareholders’ equity |
|||||||
Noncontrolling interests |
|||||||
Total equity |
|||||||
Total liabilities and equity |
$ |
$ |
|||||
(a) |
Our consolidated assets included the following for which we have elected the fair value option: Loans held for sale of $ |
(b) |
Represents our held for sale investment in BlackRock. In the second quarter of 2020, PNC divested its entire investment in BlackRock. See Note 2 Discontinued Operations for additional information. Prior period BlackRock investment balances have been reclassified to the Asset held for sale line in accordance with ASC 205-20, Presentation of Financial Statements - Discontinued Operations. Refer to Note 1 Accounting Policies and Note 2 Discontinued Operations for additional details. |
(c) |
(d) |
Our consolidated liabilities at June 30, 2020 and December 31, 2019 included Other borrowed funds of less than $ |
(e) |
Par value less than $ |
See accompanying Notes To Consolidated Financial Statements.
The PNC Financial Services Group, Inc. – Form 10-Q 51
CONSOLIDATED STATEMENT OF CASH FLOWS
THE PNC FINANCIAL SERVICES GROUP, INC.
|
Unaudited
In millions
|
Six months ended June 30 |
||||||||
2020 |
2019 |
||||||||
Operating Activities |
|||||||||
Net income |
$ |
$ |
|||||||
Adjustments to reconcile net income to net cash provided (used) by operating activities |
|||||||||
Provision for credit losses |
|||||||||
Depreciation and amortization |
|||||||||
Deferred income taxes |
( |
) |
|||||||
Net gains on sales of securities |
( |
) |
( |
) |
|||||
Changes in fair value of mortgage servicing rights |
|||||||||
Gain on sale of BlackRock |
( |
) |
|||||||
Undistributed earnings of BlackRock |
( |
) |
( |
) |
|||||
Net change in |
|||||||||
Trading securities and other short-term investments |
( |
) |
|||||||
Loans held for sale |
( |
) |
( |
) |
|||||
Other assets |
( |
) |
( |
) |
|||||
Accrued expenses and other liabilities |
|||||||||
Other |
( |
) |
|||||||
Net cash provided (used) by operating activities |
$ |
$ |
|||||||
Investing Activities |
|||||||||
Sales |
|||||||||
Securities available for sale |
$ |
$ |
|||||||
Net proceeds from sale of BlackRock |
|||||||||
Loans |
|||||||||
Repayments/maturities |
|||||||||
Securities available for sale |
|||||||||
Securities held to maturity |
|||||||||
Purchases |
|||||||||
Securities available for sale |
( |
) |
( |
) |
|||||
Securities held to maturity |
( |
) |
( |
) |
|||||
Loans |
( |
) |
( |
) |
|||||
Net change in |
|||||||||
Federal funds sold and resale agreements |
|||||||||
Interest-earning deposits with banks |
( |
) |
( |
) |
|||||
Loans |
( |
) |
( |
) |
|||||
Other |
( |
) |
( |
) |
|||||
Net cash provided (used) by investing activities |
$ |
( |
) |
$ |
( |
) |
|||
(continued on following page)
52 The PNC Financial Services Group, Inc. – Form 10-Q
CONSOLIDATED STATEMENT OF CASH FLOWS
THE PNC FINANCIAL SERVICES GROUP, INC.
(continued from previous page)
|
Unaudited
In millions
|
Six Months Ended June 30 |
||||||||
2020 |
2019 |
||||||||
Financing Activities |
|||||||||
Net change in |
|||||||||
Noninterest-bearing deposits |
$ |
$ |
( |
) |
|||||
Interest-bearing deposits |
|||||||||
Federal funds purchased and repurchase agreements |
( |
) |
|||||||
Federal Home Loan Bank borrowings |
( |
) |
|||||||
Other borrowed funds |
( |
) |
|||||||
Sales/issuances |
|||||||||
Federal Home Loan Bank borrowings |
|||||||||
Bank notes and senior debt |
|||||||||
Other borrowed funds |
|||||||||
Common and treasury stock |
|||||||||
Repayments/maturities |
|||||||||
Federal Home Loan Bank borrowings |
( |
) |
( |
) |
|||||
Bank notes and senior debt |
( |
) |
( |
) |
|||||
Subordinated debt |
( |
) |
|||||||
Other borrowed funds |
( |
) |
( |
) |
|||||
Acquisition of treasury stock |
( |
) |
( |
) |
|||||
Preferred stock cash dividends paid |
( |
) |
( |
) |
|||||
Common stock cash dividends paid |
( |
) |
( |
) |
|||||
Net cash provided (used) by financing activities |
$ |
$ |
|||||||
Net Increase (Decrease) In Cash And Due From Banks And Restricted Cash |
( |
) |
|||||||
Net cash provided by discontinued operations |
|||||||||
Net cash provided (used) by continuing operations |
( |
) |
( |
) |
|||||
Cash and due from banks and restricted cash at beginning of period |
|||||||||
Cash and due from banks and restricted cash at end of period |
$ |
$ |
|||||||
Cash and due from banks and restricted cash |
|||||||||
Cash and due from banks at end of period (unrestricted cash) |
$ |
$ |
|||||||
Restricted cash |
|||||||||
Cash and due from banks and restricted cash at end of period |
$ |
$ |
|||||||
Supplemental Disclosures |
|||||||||
Interest paid |
$ |
$ |
|||||||
Income taxes paid |
$ |
$ |
|||||||
Income taxes refunded |
$ |
$ |
|||||||
Leased assets obtained in exchange for new operating lease liabilities |
$ |
$ |
|||||||
Right-of-use assets recognized at adoption of ASU 2016-02 |
$ |
||||||||
Non-cash Investing and Financing Items |
|||||||||
Transfer from loans to loans held for sale, net |
$ |
$ |
|||||||
Transfer from trading securities to investment securities |
$ |
||||||||
Transfer from loans to foreclosed assets |
$ |
$ |
|||||||
See accompanying Notes To Consolidated Financial Statements.
The PNC Financial Services Group, Inc. – Form 10-Q 53
NOTES TO CONSOLIDATED FINANCIAL STATEMENTS
THE PNC FINANCIAL SERVICES GROUP, INC.
Unaudited
BUSINESS
The PNC Financial Services Group, Inc. (PNC) is one of the largest diversified financial services companies in the United States (U.S.) and is headquartered in Pittsburgh, Pennsylvania.
NOTE 1 A CCOUNTING POLICIES
Basis of Financial Statement Presentation
Our consolidated financial statements include the accounts of the parent company and its subsidiaries, most of which are wholly-owned, certain partnership interests and variable interest entities.
We prepared these consolidated financial statements in accordance with accounting principles generally accepted in the United States of America (GAAP). We have eliminated intercompany accounts and transactions.
In our opinion, the unaudited interim consolidated financial statements reflect all normal, recurring adjustments needed to present fairly our results for the interim periods. The results of operations for interim periods are not necessarily indicative of the results that may be expected for the full year or any other interim period.
We have also considered the impact of subsequent events on these consolidated financial statements.
When preparing these unaudited interim consolidated financial statements, we have assumed that you have read the audited consolidated financial statements included in our 2019 Form 10-K. These interim consolidated financial statements serve to update our 2019 Form 10-K and may not include all information and Notes necessary to constitute a complete set of financial statements. There have been significant changes to our accounting policies as disclosed in our 2019 Form 10-K due to the adoption of the Current Expected Credit Losses (CECL) standard and our discontinued operation as a result of the disposal of our equity investment in BlackRock. As a result of this disposal, BlackRock’s historical results of operations are reported as discontinued operations in our consolidated financial statements for all periods presented. The updated policies impacted by these changes are included in this Note 1. Reference is made to Note 1 Accounting Policies in our 2019 Form 10-K for a detailed description of all other significant accounting policies.
We prepared these consolidated financial statements using financial information available at the time of preparation, which requires us to make estimates and assumptions that affect the amounts reported. Our most significant estimates pertain to our fair value measurements and allowance for credit losses (ACL). Actual results may differ from the estimates and the differences may be material to the consolidated financial statements.
Discontinued Operations
A disposal of an asset or business that meets the criteria for held for sale classification is reported as discontinued operations when the disposal represents a strategic shift that has had, or will have, a major effect on our operating results. We report an asset as held for sale when management has approved or received approval to sell the asset and is committed to a formal plan, the asset is available for immediate sale, the asset is being actively marketed, the sale is anticipated to occur during the ensuing year and certain other specified criteria are met. An asset classified as held for sale is recorded at the lower of its carrying amount or estimated fair value less cost to sell. If the carrying amount of the asset exceeds its estimated fair value, the asset is written down to its fair value upon the held for sale designation. Our BlackRock held for sale asset is recorded at its carrying amount as we accounted for this investment under the equity method of accounting and the fair value of the asset exceeded the carrying value at each balance sheet date.
When presenting discontinued operations, assets classified as held for sale are segregated in the Consolidated Balance Sheet commencing in the period in which the asset meets all of the held for sale criteria described above and prior periods are recast. The results of discontinued operations are reported in Discontinued Operations in the Consolidated Statement of Income for current and
54 The PNC Financial Services Group, Inc. – Form 10-Q
prior periods commencing in the period in which the asset or business is either disposed of or is classified as held for sale, including any gain or loss recognized on sale or adjustment of the carrying amount to fair value less cost to sell.
Earnings Per Common Share
Basic earnings per common share is calculated using the two-class method to determine income attributable to common shareholders. Unvested share-based payment awards that contain nonforfeitable rights to dividends or dividend equivalents are considered participating securities under the two-class method. Distributed dividends and dividend equivalents related to participating securities and an allocation of undistributed net income to participating securities reduce the amount of income attributable to common shareholders. In a period with a loss, no allocation will be made to the participating securities, as they do not have a contractual obligation to absorb losses. Income attributable to common shareholders is then divided by the weighted-average common shares outstanding for the period.
The PNC Financial Services Group, Inc. – Form 10-Q 55
Recently Adopted Accounting Standards
Accounting Standards Update (ASU) |
Description |
Financial Statement Impact |
|
Credit Losses- ASU 2016-13
Issued June 2016
Codification Improvements - ASU 2019-04
Various improvements related to Credit Losses (Topics 1, 2 and 5)
Issued April 2019
Targeted Transition Relief - Credit Losses - ASU 2019-05
Issued May 2019
Codification Improvements - ASU 2019-11
Issued November 2019
|
• Commonly referred to as the CECL standard.
•Replaces measurement, recognition and disclosure guidance for credit related reserves (i.e., the allowance for loan and lease losses (ALLL) and the allowance for unfunded loan commitments and letters of credit) and Other than Temporary Impairment (OTTI) for debt securities.
•Requires the use of an expected credit loss methodology; specifically, current expected credit losses for the remaining life of the asset will be recognized starting from the time of origination or acquisition.
•Methodology applies to loans, net investment in leases, debt securities and certain financial assets not accounted for at fair value through net income. It also applies to unfunded lending related commitments except for unconditionally cancellable commitments.
•In-scope assets are presented at the net amount expected to be collected after the deduction or addition of the ACL from the amortized cost basis of the assets.
• Requires inclusion of expected recoveries of previously charged-off amounts for in-scope assets.
• Requires enhanced credit quality disclosures including disaggregation of credit quality indicators by vintage.
• Requires a modified retrospective approach through a cumulative-effect adjustment to retained earnings at adoption.
|
• Adopted January 1, 2020 under the modified retrospective approach. The cumulative-effect adjustment to retained earnings totaled $671 million at adoption.
• Amended presentation and disclosures are required prospectively. Refer to the disclosures in this Note 1, Note 3 Investment Securities, Note 4 Loans and Related Allowance for Credit Losses and Note 10 Total Equity and Other Comprehensive Income for additional information.
• With the adoption of CECL, we discontinued the accounting for purchased impaired loans and elected the one-time fair value option election for some of these loans and certain residential real estate collateral dependent loans. Loans that were previously accounted for as purchased impaired where the fair value option election was not made are now accounted for as purchased credit deteriorated (PCD) loans.
• There was no impact to the recorded investment of our investment securities or loans, except for our PCD loan portfolio. Accounting for these loans as PCD required an adjustment to the remaining accretable discount and recorded investment in addition to the impact on ACL due to the adoption of CECL methodology.
• Refer to Table 35 for a summary of the impact of the CECL standard adoption.
|
Accounting Standards Update (ASU) |
Description |
Financial Statement Impact |
|
Codification Improvements - ASU 2019-04
Topic 3: Codification Improvements to ASU 2017-12 and Other Hedging Items
Issued April 2019
|
• Targeted improvements related to:
- Partial-term fair value hedges of interest rate risk
- Amortization of fair value hedge basis adjustments
- Disclosure of fair value hedge basis adjustments
- Consideration of the hedged contractually specified interest rate under the hypothetical derivative method
- Application of a first-payments-received cash flow hedging technique to overall cash flows on a group of variable interest payments
- Update to transition guidance for ASU 2017-12
• This ASU permits a one-time transfer out of held to maturity securities to provide entities the opportunity to hedge fixed rate, prepayable securities under a last of layer hedging strategy (although an entity is not required to hedge such securities subsequent to transfer).
|
• Adopted January 1, 2020.
• As permitted by the eligibility requirements in this guidance, at adoption we elected to transfer debt securities with an amortized cost of $16.2 billion (fair value of $16.5 billion) from held to maturity to the available for sale portfolio. The transfer resulted in a pretax increase to AOCI of $306 million. There were no other impacts to PNC's consolidated financial statements from the adoption of this guidance.
|
Accounting Standards Update (ASU) |
Description |
Financial Statement Impact |
|
Goodwill -
ASU 2017-04
Issued January 2017
|
• Eliminates Step 2 from the goodwill impairment test to simplify the subsequent measurement of goodwill under which a loss was recognized only if the estimated implied fair value of the goodwill is below its carrying value.
• Requires impairment to be recognized if the reporting unit's carrying value exceeds the fair value.
|
• Adopted January 1, 2020.
• The adoption of this standard did not impact our consolidated results of operations or our consolidated financial position.
|
56 The PNC Financial Services Group, Inc. – Form 10-Q
Accounting Standards Update (ASU) |
Description |
Financial Statement Impact |
|
Reference Rate Reform - ASU 2020-04
Issued March 2020
|
• Provides optional expedients and exceptions for applying generally accepted accounting principles to contracts, hedging relationships, and other transactions that reference LIBOR or another reference rate expected to be discontinued because of reference rate reform.
• Includes optional expedients related to contract modifications that allow an entity to account for modifications (if certain criteria are met) as if the modifications were only minor (assets within the scope of ASC 310, Receivables), were not substantial (assets within the scope of ASC 470, Debt), and/or did not result in remeasurements or reclassifications (assets within the scope of ASC 842, Leases, and other Topics) of the existing contract.
• Includes optional expedients related to hedging relationships within the scope of ASC 815, Derivatives & Hedging, whereby changes to the critical terms of a hedging relationship do not require dedesignation if certain criteria are met. In addition, potential sources of ineffectiveness as a result of reference rate reform may be disregarded when performing some effectiveness assessments.
• Allows for a one-time election to sell, transfer, or both sell and transfer debt securities classified as held to maturity that reference a rate affected by reference rate reform and that are classified as held to maturity before January 1, 2020.
• Guidance in this ASU is effective as of March 12, 2020 through December 31, 2022.
|
• Adopted March 12, 2020, will apply prospectively.
• As of June 30, 2020, we have not yet elected any optional expedients related to contract modifications or hedging relationships as outlined in this ASU. However, we plan to elect these optional expedients in the future.
• During the second quarter of 2020, we elected to transfer all debt securities classified as held to maturity that are indexed to LIBOR to the available for sale portfolio. All securities were classified as held to maturity prior to January 1, 2020. These securities had an amortized cost and fair value of $49 million and $48 million, respectively, as of the transfer date. See Note 3 Investment Securities for more information.
|
The following table presents the impact of adopting the CECL standard on January 1, 2020 on our allowance and retained earnings.
Table 35: Impact of the CECL Standard Adoption
In millions |
December 31, 2019 |
Transition Adjustment |
January 1, 2020 |
|||||||
Allowance for credit losses |
||||||||||
Allowance for loan and lease losses |
||||||||||
Commercial |
$ |
$ |
( |
) |
$ |
|||||
Consumer |
||||||||||
Total allowance for loan and lease losses |
||||||||||
Unfunded lending related commitments |
||||||||||
Other |
||||||||||
Total allowance for credit losses |
$ |
$ |
$ |
|||||||
In millions |
December 31, 2019 |
Transition Adjustment |
January 1, 2020 |
|||||||
Impact to retained earnings (a) |
$ |
$ |
( |
) |
$ |
|||||
(a) Transition adjustment includes the increase in the total ACL of $.7 billion and the impact of the fair value option election of $.2 billion, offset by the tax impact of $.2 billion.
Cash, Cash Equivalents and Restricted Cash
Cash and due from banks are considered cash and cash equivalents for financial reporting purposes because they represent a primary source of liquidity. Certain cash balances within Cash and due from banks on our Consolidated Balance Sheet are restricted as to withdrawal or usage by legally binding contractual agreements or regulatory requirements.
Investments
We hold interests in various types of investments. The accounting for these investments is dependent on a number of factors including,
but not limited to, items such as:
• Ownership interest,
• Our plans for the investment, and
• The nature of the investment.
The PNC Financial Services Group, Inc. – Form 10-Q 57
Debt Securities
Debt securities are recorded on a trade-date basis. We classify debt securities as either trading, held to maturity, or available for sale. Debt securities that we purchase for certain risk management activities or customer-related trading activities are classified as trading securities, are reported in the Other assets line item on our Consolidated Balance Sheet, and are carried at fair value. Realized and unrealized gains and losses on trading securities are included in Other noninterest income. We classify debt securities as held to maturity when we have the positive intent and ability to hold the securities to maturity, and carry them at amortized cost, less any allowance. Debt securities not classified as held to maturity or trading are classified as securities available for sale, and are carried at fair value. Unrealized gains and losses on available for sale securities are included in Accumulated other comprehensive income (AOCI) net of income taxes.
We include all interest on debt securities, including amortization of premiums and accretion of discounts on investment securities, in
net interest income using the constant effective yield method generally calculated over the contractual lives of the securities. Effective
yields reflect either the effective interest rate implicit in the security at the date of acquisition or, for debt securities where an other-than-temporary impairment was recorded, the effective interest rate determined based on improved cash flows subsequent to an
impairment. We compute gains and losses realized on the sale of available for sale debt securities on a specific security basis. These
securities gains/(losses) are included in Other noninterest income on the Consolidated Income Statement.
As discussed in the Recently Adopted Accounting Standards section of this Note 1, we adopted the CECL standard as of January 1,
2020, which requires expected credit losses on both held to maturity and available for sale securities to be recognized through a
valuation allowance, ACL, instead of as a direct write-down to the amortized cost basis of the security. An available for sale security is considered impaired if the fair value is less than amortized cost basis. If any portion of the decline in fair value is related to credit, the amount of allowance is determined as the portion related to credit, limited to the difference between the amortized cost basis and the fair value of the security. If we have the intent to sell or believe it is more likely than not we will be required to sell an impaired available for sale security before recovery of the amortized cost basis, the credit loss is recorded as a direct write-down of the amortized cost basis. Credit losses on investment securities are recognized through the Provision for credit losses on our Consolidated Income Statement. Declines in the fair value of available for sale securities that are not considered credit related are recognized in AOCI on our Consolidated Balance Sheet. The CECL standard is applied prospectively to debt securities and, as a result, the amortized cost basis of investment securities for which OTTI had previously been recorded did not change upon adoption. For information on the policies previously applied to determine OTTI, see the Debt Securities section of Note 1 Accounting Policies in our 2019 Form 10-K.
We consider a security to be past due in terms of payment based on its contractual terms. A security may be placed on nonaccrual, with interest no longer recognized until received, when collectability of principal or interest is doubtful. As of June 30, 2020, nonaccrual or past due held-to-maturity securities were immaterial.
A security may be partially or fully charged off against the allowance if it is determined to be uncollectible, including, for an available for sale security, if we have the intent to sell or believe it is more likely than not we will be required to sell the security before recovery of the amortized cost basis. Recoveries of previously charged-off available for sale securities are recognized when received, while recoveries on held to maturity securities are recognized when expected.
See the Allowance for Credit Loss section of this Note 1 for further discussion regarding the methodologies used to determine the
allowance for investment securities. See Note 3 Investment Securities for additional information about the investment securities portfolio and the related ACL.
Loans
Loans are classified as held for investment when management has both the intent and ability to hold the loan for the foreseeable
future, or until maturity or payoff. Management’s intent and view of the foreseeable future may change based on changes in business
strategies, the economic environment, market conditions and the availability of government programs.
Measurement of delinquency status is based on the contractual terms of each loan. Loans that are 30 days or more past due in terms of
payment are considered delinquent. See Note 4 Loans and Related Allowance for Credit Losses for additional information on how COVID-19 hardship related loan modifications are reported from a delinquency perspective as of June 30, 2020.
Loans held for investment, excluding PCD loans, are recorded at amortized cost basis unless we elect to measure these under the fair value option. Amortized cost basis represents principal amounts outstanding, net of unearned income, unamortized deferred fees, costs on originated loans, and premiums or discounts on purchased loans, and charge-offs. Amortized cost basis does not include accrued interest, as we include accrued interest in Other assets on our Consolidated Balance Sheet. Interest on performing loans is accrued based on the principal amount outstanding and recorded in Interest income as earned using the constant effective yield method. Loan origination fees, direct loan origination costs, and loan premiums and discounts are deferred and accreted or amortized into Net
58 The PNC Financial Services Group, Inc. – Form 10-Q
interest income using the constant effective yield method, over the contractual life of the loan. The processing fee received for loans originated under the Paycheck Protection Program (PPP) is deferred and accreted into Net interest income using the effective yield method, over the contractual life of the loan. Loans under the fair value option are reported at their fair value, with any changes to fair value reported as Noninterest income on the Consolidated Income Statement, and are excluded from measurement of ALLL.
In addition to originating loans, we also acquire loans through the secondary loan market, portfolio purchases or acquisitions of other
financial services companies. Certain acquired loans that have experienced a more than significant deterioration of credit quality since origination (i.e., PCD) are recognized at an amortized cost basis equal to their purchase price plus an ALLL measured at the acquisition date. Subsequent decreases in expected cash flows that are attributable, at least in part, to credit quality are recognized through a charge to the provision for credit losses resulting in an increase in the ALLL. Subsequent increases in expected cash flows are recognized as a provision recapture of previously recorded ALLL.
We consider a loan to be collateral dependent when we determine that substantially all of the expected cash flows will be generated
from the operation or sale of the collateral underlying the loan, the borrower is experiencing financial difficulty and we have elected to
measure the loan at the estimated fair value of collateral (less costs to sell if sale or foreclosure of the property is expected).
Additionally, we consider a loan to be collateral dependent when foreclosure or liquidation of the underlying collateral is probable.
A troubled debt restructuring (TDR) is a loan whose terms have been restructured in a manner that grants a concession to a borrower experiencing financial difficulty. A concession has been granted when we do not expect to collect all amounts due, including original interest accrued at the original contract rate, as a result of the restructuring, or there is a delay in payment that is more than insignificant. TDRs result from our loss mitigation activities, and include rate reductions, principal forgiveness, postponement/reduction of scheduled amortization, and extensions, which are intended to minimize economic loss and to avoid foreclosure or repossession of collateral. Additionally, TDRs also result from borrowers that have been discharged from personal liability through Chapter 7 bankruptcy and have not formally reaffirmed their loan obligations to us. In those situations where principal is forgiven, the amount of such principal forgiveness is immediately charged off.
Potential incremental losses or recoveries on TDRs have been factored into the ALLL estimates for each loan class under the methodologies described in this Note. Once a loan becomes a TDR, it will continue to be reported as a TDR until it is ultimately repaid in full, the collateral is foreclosed upon, or it is fully charged off.
PNC excludes consumer loans held for sale, loans accounted for under the fair value option and certain government insured or guaranteed loans from our TDR population. PCD loans that do not meet the criteria to be classified as TDRs are also excluded. In addition, PNC has elected not to apply a TDR designation to loans that have been restructured due to a COVID-19 hardship pursuant to specific criteria under the CARES Act. Since loans restructured due to a COVID-19 related hardship were not identified as TDRs, they are not placed on nonaccrual at the time of modification. However, these loans will be subject to our existing nonaccrual policy subsequent to the modification.
See the following for additional information related to loans, including further discussion regarding our policies, the methodologies and significant inputs used to determine the ALLL, and additional details on the composition of our loan portfolio:
• |
Nonperforming Loans and Leases section of this Note 1, |
• |
Allowance for Credit Losses section of this Note 1, and
|
• |
Note 4 Loans and Related Allowance for Credit Losses.
|
Loans Held for Sale
We designate loans as held for sale when we have the intent to sell them. At the time of designation to held for sale, any allowance is
reversed, and a valuation allowance for the shortfall between the amortized cost basis and the net realizable value is recognized, excluding the amounts already charged off. Similarly, when loans are no longer considered held for sale, the valuation allowance (net of writedowns) is reversed, and an allowance for credit losses is established, excluding the amounts already charged-off. Write-downs on these loans (if required) are recorded as charge-offs through the valuation allowance. Adjustments to the valuation allowance on held for sale loans are recognized in Other noninterest income.
We have elected to account for certain commercial and residential mortgage loans held for sale at fair value. The changes in the fair
value of the commercial mortgage loans are measured and recorded in Other noninterest income while such changes for the residential
mortgage loans are measured and recorded in Residential mortgage noninterest income each period. See Note 12 Fair Value for
additional information.
Interest income with respect to loans held for sale is accrued based on the principal amount outstanding and the loan’s contractual
interest rate.
The PNC Financial Services Group, Inc. – Form 10-Q 59
In certain circumstances, loans designated as held for sale may be transferred to held for investment based on a change in strategy. We
transfer these loans at the lower of cost or estimated fair value; however, any loans originated or purchased as held for sale for which the fair value option has been elected remain at fair value for the life of the loan.
Nonperforming Loans and Leases
The matrix that follows summarizes our policies for classifying certain loans as nonperforming loans and/or discontinuing the accrual of loan interest income.
Commercial | ||
Loans Classified as Nonperforming and Accounted for as Nonaccrual |
• Loans accounted for at amortized cost where:
– The loan is 90 days or more past due.
– The loan is rated substandard or worse due to the determination that full collection of
principal and interest is not probable as demonstrated by the following conditions:
• The collection of principal or interest is 90 days or more past due;
• Reasonable doubt exists as to the certainty of the borrower’s future debt service
ability, according to the terms of the credit arrangement, regardless of whether 90
days have passed or not;
• The borrower has filed or will likely file for bankruptcy;
• The bank advances additional funds to cover principal or interest;
• We are in the process of liquidating a commercial borrower; or
• We are pursuing remedies under a guarantee.
|
|
Loans Excluded from Nonperforming Classification but Accounted for as Nonaccrual |
• Loans accounted for under the fair value option and full collection of principal and interest
is not probable.
• Loans accounted for at the lower of cost or market less costs to sell (held for sale) and full
collection of principal and interest is not probable.
|
|
|
Loans Excluded from Nonperforming Classification and Nonaccrual Accounting
|
• Loans that are well secured and in the process of collection.
• Certain government insured loans where substantially all principal and interest is insured.
• Commercial purchasing card assets which do not accrue interest.
|
|
Consumer | ||
Loans Classified as Nonperforming and Accounted for as Nonaccrual |
• Loans accounted for at amortized cost where full collection of contractual principal and
interest is not deemed probable as demonstrated in the policies below:
– The loan is 90 days past due for home equity and installment loans, and 180 days past
due for well secured residential real estate loans;
– The loan has been modified and classified as a troubled debt restructuring (TDR);
– Notification of bankruptcy has been received;
– The bank holds a subordinate lien position in the loan and the first lien mortgage loan is
seriously stressed (i.e., 90 days or more past due);
– Other loans within the same borrower relationship have been placed on nonaccrual or
charge-offs have been taken on them;
– The bank has ordered the repossession of non-real estate collateral securing the loan; or
– The bank has charged-off the loan to the value of the collateral.
|
|
Loans Excluded from Nonperforming Classification but Accounted for as Nonaccrual |
• Loans accounted for under the fair value option and full collection of principal and interest
is not probable.
• Loans accounted for at the lower of cost or market less costs to sell (held for sale) and full
collection of principal and interest is not probable.
|
|
Loans Excluded from Nonperforming Classification and Nonaccrual Accounting |
• Certain government insured loans where substantially all principal and interest is insured.
• Residential real estate loans that are well secured and in the process of collection.
• Consumer loans and lines of credit, not secured by residential real estate or automobiles, as
permitted by regulatory guidance.
|
|
Commercial
We generally charge off commercial (commercial and industrial, commercial real estate, and equipment lease financing)
nonperforming loans when we determine that a specific loan, or portion thereof, is uncollectible. This determination is based on the
specific facts and circumstances of the individual loans. In making this determination, we consider the viability of the business or
project as a going concern, the past due status when the asset is not well-secured, the expected cash flows to repay the loan, the
value of the collateral, and the ability and willingness of any guarantors to perform.
Additionally, in general, for smaller commercial loans of $1 million or less, a partial or full charge-off occurs at 120 days past due
60 The PNC Financial Services Group, Inc. – Form 10-Q
for term loans and 180 days past due for revolvers. Certain small business credit card balances that are placed on nonaccrual status
when they become 90 days or more past due are charged-off at 180 days past due.
Consumer
We generally charge off secured consumer (home equity, residential real estate and automobile) nonperforming loans to the fair
value of collateral less costs to sell, if lower than the amortized cost basis of the loan outstanding, when delinquency of the loan, combined with other risk factors (e.g., bankruptcy, lien position, or troubled debt restructuring), indicates that the loan, or some portion thereof, is uncollectible as per our historical experience, or the collateral has been repossessed. We charge-off secured
consumer loans no later than 180 days past due. Most consumer loans and lines of credit, not secured by residential real estate, are
charged off once they have reached 120-180 days past due.
For secured collateral dependent loans, collateral values are updated at least annually and subsequent declines in collateral values are charged-off resulting in incremental provision for credit loss. Subsequent increases in collateral values may be reflected as an adjustment to the ALLL to reflect the expectation of recoveries in an amount greater than previously expected.
Accounting for Nonperforming Assets and Leases and Other Nonaccrual Loans
For nonaccrual loans, interest income accrual and deferred fee/cost recognition is discontinued. Additionally, the current year accrued and uncollected interest is reversed through Net interest income and prior year accrued and uncollected interest is charged-off, except for credit cards, where we reverse any accrued interest through Net interest income at the time of charge-off, as per industry standard practice. Nonaccrual loans that are also collateral dependent may be charged-off to reduce the basis to the fair value of collateral less costs to sell.
If payment is received on a nonaccrual loan, generally the payment is first applied to the remaining principal balance; payments are then applied to recover any charged-off amounts related to the loan. Finally, if both principal balance and any charge-offs have been recovered, then the payment will be recorded as fee and interest income. For certain consumer loans, the receipt of interest payments is recognized as interest income on a cash basis. Cash basis income recognition is applied if a loan’s amortized cost basis is deemed fully collectible and the loan has performed for at least six months.
For TDRs, payments are applied based upon their contractual terms unless the related loan is deemed non-performing. TDRs are
generally included in nonperforming and nonaccrual loans. However, after a reasonable period of time, generally six months, in which the loan performs under restructured terms and meets other performance indicators, it is returned to performing/accruing status. This return to performing/accruing status demonstrates that the bank expects to collect all of the loan’s remaining contractual principal and interest. TDRs resulting from (i) borrowers that have been discharged from personal liability through Chapter 7 bankruptcy and have not formally reaffirmed their loan obligations to us, and (ii) borrowers that are not currently obligated to make both principal and interest payments under the restructured terms are not returned to accrual status.
Other nonaccrual loans are generally not returned to accrual status until the borrower has performed in accordance with the
contractual terms and other performance indicators for at least six months, the period of time which was determined to demonstrate
the expected collection of the loan’s remaining contractual principal and interest. Nonaccrual loans with partially charged-off principal are not returned to accrual. When a nonperforming loan is returned to accrual status, it is then considered a performing loan.
Foreclosed assets consist of any asset seized or property acquired through a foreclosure proceeding or acceptance of a deed-in-lieu
of foreclosure. Other real estate owned (OREO) comprises principally commercial and residential real estate properties obtained in
partial or total satisfaction of loan obligations. After obtaining a foreclosure judgment, or in some jurisdictions the initiation of
proceedings under a power of sale in the loan instruments, the property will be sold. When we are awarded title or completion of
deed-in-lieu of foreclosure, we transfer the loan to foreclosed assets included in Other assets on our Consolidated Balance Sheet.
Property obtained in satisfaction of a loan is initially recorded at estimated fair value less cost to sell. Based upon the estimated fair
value less cost to sell, the amortized cost basis of the loan is adjusted and a charge-off/recovery is recognized to the ALLL. We
estimate fair values primarily based on appraisals, or sales agreements with third parties. Subsequently, foreclosed assets are
valued at the lower of the amount recorded at acquisition date or estimated fair value less cost to sell. Valuation adjustments on
these assets and gains or losses realized from disposition of such property are reflected in Other noninterest expense.
For certain mortgage loans that have a government guarantee, we establish a separate other receivable upon foreclosure. The
receivable is measured based on the loan balance (inclusive of principal and interest) that is expected to be recovered from the
guarantor.
See Note 4 Loans and Related Allowance for Credit Losses in this Report for additional information on nonperforming assets, TDRs and credit quality indicators related to our loan portfolio.
The PNC Financial Services Group, Inc. – Form 10-Q 61
Allowance for Credit Losses
Our ACL, in accordance with the CECL standard, is based on historical loss experience, borrower risk characteristics, current economic conditions, reasonable and supportable forecasts of future conditions and other relevant factors. We maintain the ACL at an
appropriate level for expected losses on our existing investment securities, loans, finance leases (including residual values), other financial assets and unfunded lending related commitments, for the estimated contractual term of the assets or exposures as of the balance sheet date. We estimate the estimated contractual term of assets in scope of CECL considering contractual maturity dates, prepayment expectations, utilization or draw expectations and any embedded extension options that do not allow us to unilaterally cancel the extension options. For products without a fixed contractual maturity date (e.g., credit cards), we rely on historical payment behavior to determine the length of the pay down or default time period.
We estimate expected losses on a pooled basis using a combination of (i) the expected losses over a reasonable and supportable
forecast period (RSFP), (ii) a period of reversion to long run average (LRA) expected losses (reversion period) where applicable, and (iii) the LRA expected losses for the remaining estimated contractual term. For all assets and unfunded lending related commitments in the scope of CECL, the ACL also includes individually assessed reserves and qualitative reserves, as applicable.
We use forward-looking information in estimating expected credit losses for the RSFP. For this purpose, we use the forecasted
scenarios produced by PNC's Economics Team, which are designed to reflect business cycles and their related estimated probabilities. The forecast length that we have determined to be reasonable and supportable is three years. As noted in the methodology discussions that follow, forward looking information is incorporated into the expected credit loss estimates. Such forward looking information includes forecasted relevant macroeconomic variables, which are estimated using qualitative techniques, analysis from PNC economists and management judgment.
The reversion period is used to bridge RSFP and LRA expected credit losses. We may consider a number of factors in determining the duration of the reversion period, such as contractual maturity of the asset, observed historical patterns and the estimated credit loss rates at the end of RSFP relative to the beginning of the LRA period.
The LRA expected credit losses are derived from long run historical credit loss information adjusted for the credit quality of the current portfolio, and therefore do not consider current and forecasted economic conditions.
See the following sections related to investment securities, loans, trade receivables, other financial assets and unfunded lending related commitments for details about specific methodologies.
Allowance for Investment Securities
A significant portion of our investment securities are issued or guaranteed by either the U.S. government (U.S. Treasury or Government National Mortgage Association (GNMA)) or a government-sponsored agency (Federal National Mortgage Association (FNMA) or Federal Home Loan Mortgage Corporation (FHLMC)). Taking into consideration historical information and current and forecasted conditions, we do not expect to incur any credit losses on these securities.
Investment securities that are not issued or guaranteed by the U.S. government or a government-sponsored agency consist of both securitized products, such as non-agency mortgage and asset-backed securities, as well as non-securitized products, such as corporate and municipal debt securities. A discounted cash flow approach is primarily used to determine the amount of the allowance required. The estimates of expected cash flows are determined using macroeconomic sensitive models taking into consideration the RSFP and scenarios discussed above. Additional factors unique to a specific security may also be taken into consideration when estimating expected cash flows. The cash flows expected to be collected, after considering expected prepayments, are discounted at the effective interest rate. For an available-for-sale security, the amount of the allowance is limited to the difference between the amortized cost basis of the security and its estimated fair value.
See Note 3 Investment Securities in this Report for additional information about the investment securities portfolio.
Allowance for Loan and Lease Losses
Our pooled expected loss methodology is based upon the quantification of risk parameters, such as probability of default (PD), loss
given default (LGD) and exposure at default (EAD) for a loan or loan segment. We also consider the impact of prepayments and
amortization on contractual maturity in our expected loss estimates. We use historical credit loss information, current borrower risk
characteristics and forecasted economic variables for the RSFP, coupled with analytical methods, to estimate these risk parameters
by loan or loan segments. PD, LGD and EAD parameters are calculated for each forecasted scenario and the LRA period, and
combined to generate expected loss estimates by scenario. The following matrix provides key credit risk characteristics that we use to
estimate these risk parameters.
62 The PNC Financial Services Group, Inc. – Form 10-Q
Loan Class |
Probability of Default (PD) |
Loss Given Default (LGD) |
Exposure at Default (EAD) |
|
Commercial | ||||
Commercial and industrial / Equipment lease financing |
• For wholesale obligors: internal risk ratings based on borrower characteristics and industry
• For retail small balance obligors: credit score, delinquency status, and product type
|
• Collateral type, collateral value, industry, size and outstanding exposure for secured loans
• Capital structure, industry and size for unsecured loans
• Product type and credit scores
|
• Outstanding balances, contractual maturities and historical prepayment experience for loans
• Current utilization and historical pre-default draw experience for lines
|
|
Commercial real estate |
• Property performance metrics and capitalization rates for RSFP
• Internal risk ratings based on borrower characteristics for LRA
|
• Property values and anticipated liquidation costs |
• Commitment and historical prepayment experience |
|
Consumer | ||||
Home equity / Residential real estate |
• Borrower credit scores, delinquency rates, origination vintage, loan-to-value (LTV) ratios and contractual maturity |
• Collateral characteristics, LTV and costs to sell |
• Outstanding balances, contractual maturities and historical prepayment experience for loans
• Current utilization and historical pre-default draw experience for lines
|
|
Automobile |
• Borrower credit scores, borrower income, LTV and contractual maturity |
• New vs. used, LTV and borrower credit scores |
• Outstanding balances, contractual maturities and historical prepayment experience |
|
Credit card |
• Borrower credit scores, delinquency status, utilization, payment behavior and months on book |
• Borrower credit scores and credit line amount |
• Pay-down curves are developed using a pro-rata method and estimated using borrower behavior segments, payment ratios and borrower credit scores |
|
Education / Other consumer |
• Net charge-off and pay-down rates by vintage are used to estimate expected losses in lieu of discrete risk parameters |
|||
The PNC Financial Services Group, Inc. – Form 10-Q 63
The following matrix describes the key economic variables that are consumed during the RSFP by loan class, as well as other
assumptions that are used for our reversion and LRA approaches.
Loan Class |
RSFP - Key Economic Variables |
Reversion Method |
LRA Approach |
|
|
Commercial
| ||||
Commercial and industrial / Equipment lease financing |
• Gross Domestic Product and Gross Domestic Income measures, imports, employment related variables, House Price Index (HPI), credit spreads, personal income and consumption measures and stock market indices
|
• Immediate reversion
|
• Average parameters determined based on internal and external historical data
• Modeled parameters using long run economic conditions for retail small business obligors
|
|
Commercial real estate |
• Unemployment rates, Commercial Property Price Index, GDP, corporate bond yield and interest rates |
• Immediate reversion |
• Average parameters determined based on internal and external historical data |
|
Consumer | ||||
Home equity / Residential real estate |
• Unemployment rates, HPI and interest rates |
• Straight-line over 3 years |
• Modeled parameters using long run economic conditions |
|
Automobile |
• Unemployment rates, HPI, personal consumption expenditure, interest rates, Manheim used car index and domestic oil prices
|
• Straight-line over 1 year
|
• Average parameters determined based on internal and external historical data
|
|
Credit card |
• Unemployment rate, personal consumption expenditure, and HPI
|
• Straight-line over 2 years
|
• Modeled parameters using long run economic conditions
|
|
Education / Other consumer |
• Net charge-off and pay-down rates by vintage are used to estimate expected losses in lieu of discrete risk parameters |
|||
After the RSFP, we revert to the LRA over the reversion period noted above, which is the period between the end of the RSFP and
when losses are estimated to have completely reverted to the LRA.
Once we have developed a combined estimate of credit losses (i.e., for the RSFP, reversion period and LRA) under each of the forecasted scenarios, we produce a probability-weighted credit loss estimate by loan class. We then add or deduct any qualitative components and other adjustments, such as individually assessed loans, to produce the ALLL. See the Individually Assessed Component and Qualitative Component sections of this Note 1 for additional information about those adjustments.
Discounted Cash Flow
In addition to TDRs, we also use a discounted cash flow methodology for our home equity and residential real estate loan classes. We determine effective interest rates considering contractual cash flows adjusted for estimated prepayments. Changes in the ALLL due to the impact of the passage of time under the discounted cash flow estimate are recognized through the provision for credit losses.
Individually Assessed Component
Loans and leases that do not share similar risk characteristics with a pool of loans are individually assessed as follows:
• |
For commercial nonperforming loans greater than or equal to a defined dollar threshold, reserves are based on an analysis of the present value of the loan’s expected future cash flows or the fair value of the collateral, if appropriate under our policy for collateral dependent loans. Nonperforming commercial loans below the defined threshold and accruing TDRs are reserved for under a pooled basis. |
• |
For consumer nonperforming loans classified as collateral dependent, charge-off and ALLL related to recovery of amounts previously charged-off are evaluated through an analysis of the fair value of the collateral less costs to sell. |
Qualitative Component
While our reserve methodologies strive to reflect all relevant credit risk factors, there continues to be uncertainty associated with,
but not limited to, potential imprecision in the estimation process due to the inherent time lag of obtaining information and normal
variations between expected and actual outcomes. We may hold additional reserves that are designed to provide coverage for losses
64 The PNC Financial Services Group, Inc. – Form 10-Q
attributable to such risks. The ACL also takes into account factors that may not be directly measured in the determination of
individually assessed or pooled reserves. Such qualitative factors may include, but are not limited to:
• |
Industry concentrations and conditions, |
• |
Changes in market conditions, including regulatory and legal requirements, |
• |
Changes in the nature and volume of our portfolio, |
• |
Recent credit quality trends, including the impact of COVID-19 hardship related loan modifications, |
• |
Recent loss experience in particular portfolios, including specific and unique events, |
• |
Recent macro-economic factors that may not be reflected in the forecast information, |
• |
Limitations of available data, including historical loss information and recent data such as collateral values, |
• |
Model imprecision, |
• |
Changes in lending policies and procedures, including changes in loss recognition and mitigation policies and procedures, |
• |
Timing of available information, including the performance of first lien positions, and |
• |
Other relevant factors |
See Note 4 Loans and Related Allowance for Credit Losses for additional information about our loan portfolio and the related allowance.
Accrued Interest
When accrued interest is reversed or charged-off in a timely manner the CECL standard provides a practical expedient to exclude
accrued interest from ACL measurement. We consider our nonaccrual and charge-off policies to be timely for all of our investment
securities, loans and leases, with the exception of consumer credit cards, education loans and certain unsecured consumer lines of credit. We consider the length of time before nonaccrual/charge-off and the use of appropriate other triggering events for nonaccrual and charge-offs in making this determination. Pursuant to these policy elections, we calculate reserves for accrued interest on credit cards, education loans and certain consumer lines of credit, which are then included within the ALLL. See the Debt Securities and Nonperforming Loans and Leases sections of this Note 1 for additional information on our nonaccrual and charge-off policies.
Additionally, pursuant to our use of a discounted cash flow methodology in estimating credit losses for our home equity and residential real estate loan classes, applicable reserves for accrued interest are also included within the ALLL for these loan classes.
Purchased Credit Deteriorated Loans or Securities
The allowance for PCD loans or securities is determined at the time of acquisition, as the estimated expected credit loss of the outstanding balance or par value, based on the methodologies described previously for loans and securities. In accordance with CECL, the allowance recognized at acquisition is added to the acquisition date purchase price to determine the asset’s amortized cost basis.
Allowance for Unfunded Lending Related Commitments
We maintain the allowance for unfunded lending related commitments on off-balance sheet credit exposures that are not unconditionally cancelable (e.g., unfunded loan commitments, letters of credit and certain financial guarantees), at a level we believe is appropriate as of the balance sheet date to absorb expected credit losses on these exposures. Other than the estimation of the probability of funding, this reserve is estimated in a manner similar to the methodology used for determining reserves for loans and leases. The allowance for unfunded lending related commitments is recorded as a liability on the Consolidated Balance Sheet. Net adjustments to this reserve are included in the provision for credit losses.
See Note 4 Loans and Related Allowance for Credit Losses for additional information about this allowance.
Allowance for Other Financial Assets
We determine the allowance for other financial assets (e.g., trade receivables, servicing advances on PNC-owned loans, balances with banks) considering historical loss information and other available indicators. In certain cases where there are no historical, current or forecast indicators of an expected credit loss, we may estimate the reserve to be close to zero. As of June 30, 2020, the allowance for other financial assets was immaterial.
Goodwill
Goodwill arising from business acquisitions represents the value attributable to unidentifiable intangible elements in the business acquired. At least annually, in the fourth quarter, or more frequently if events occur or circumstances have changed significantly from the annual test date, management performs our goodwill impairment test at a reporting unit level.
PNC has the ability to first perform a qualitative analysis to evaluate whether it is more-likely-than-not that the fair value of a reporting unit is less than its carrying amount. If, after considering all relevant events and circumstances, PNC determines it is not more-likely-than-not that the fair value of a reporting unit is less than its carrying amount, then performing a quantitative impairment test is not necessary. If PNC elects to bypass the qualitative analysis, or concludes via qualitative analysis that it is more-likely-than-
The PNC Financial Services Group, Inc. – Form 10-Q 65
not that the fair value of a reporting unit is less than its carrying amount, a quantitative goodwill impairment test is performed. Inputs are generated and used in calculating the fair value of the reporting unit, which is compared to its carrying amount. The fair value of our reporting units is determined by using discounted cash flows and/or market comparability methodologies. If the fair value is greater than the carrying amount, then the reporting unit's goodwill is deemed not to be impaired. If the fair value is less than the carrying amount, an entity should recognize an impairment charge for the amount by which the carrying amount of goodwill exceeds the reporting unit’s fair value. The loss recognized should not exceed the total amount of goodwill allocated to that reporting unit.
NOTE 2 D ISCONTINUED OPERATIONS
On May 15, 2020, PNC completed the sale of its 31.6 million shares of BlackRock, Inc., common and preferred stock through a registered secondary offering at a price of $420 per share. In addition, BlackRock repurchased 2.65 million shares from PNC at a price of $414.96 per share. The total proceeds from the sale were $14.2 billion in cash, net of $.2 billion in expenses, and resulted in a gain on sale of $4.3 billion. Additionally, PNC contributed 500,000 BlackRock shares to the PNC Foundation on May 18, 2020.
Following the sale and donation, PNC has divested its entire investment in BlackRock. PNC and its affiliates only hold shares of BlackRock stock in a fiduciary capacity for clients of PNC and its affiliates.
The following table summarizes the results from the discontinued operations of BlackRock included in the Consolidated Income Statement:
Table 36: Consolidated Income Statement - Discontinued Operations
Three months ended June 30 |
Six months ended June 30 |
||||||||||||||
In millions |
2020 |
2019 |
2020 |
2019 |
|||||||||||
Noninterest income |
$ |
$ |
$ |
$ |
|||||||||||
Total revenue |
|||||||||||||||
Income from discontinued operations before income taxes and noncontrolling interests |
|||||||||||||||
Income taxes |
|||||||||||||||
Net income from discontinued operations |
$ |
$ |
$ |
$ |
|||||||||||
The following table summarizes the cash flows of discontinued operations of BlackRock included in the Consolidated Statement of Cash Flows:
Table 37: Consolidated Statement of Cash Flows - Discontinued Operations
Six months ended June 30 |
||||||||
In millions |
2020 |
2019 |
||||||
Cash flows from discontinued operations |
||||||||
Net cash provided (used) by operating activities of discontinued operations |
$ |
$ |
||||||
Net cash provided by investing activities of discontinued operations |
$ |
|||||||
NOTE 3 I NVESTMENT SECURITIES
With the adoption of the CECL standard on January 1, 2020, credit losses on investment securities are required to be recognized through an allowance, instead of as a direct write-down to the amortized cost basis of the security. The amortized cost basis of investment securities for which impairment had previously been recorded did not change upon adoption.
We maintain the allowance for investment securities at levels that we believe to be appropriate as of the balance sheet date to absorb expected credit losses on our portfolio. As of June 30, 2020, the allowance for investment securities was $32 million and related to non-agency commercial mortgage-backed securities and other debt securities. The provision for credit losses on investment securities totaled $30 million for both the three and six months ended June 30, 2020.
In the first quarter of 2020, upon the adoption of ASU 2019-04, we elected to transfer debt securities with an amortized cost of $16.2 billion and a fair value of $16.5 billion from held to maturity to the available for sale portfolio. During the second quarter of 2020, pursuant to the guidance in ASU 2020-04, we elected to transfer debt securities with an amortized cost of $49 million and a fair value of $48 million from the held to maturity to the available for sale portfolio.
66 The PNC Financial Services Group, Inc. – Form 10-Q
See Note 1 Accounting Policies for additional information related to the adoption of the CECL standard, including the methodologies used to determine the allowance for investment securities, and the adoption of ASU 2019-04 and ASU 2020-04.
The following table summarizes our available for sale and held to maturity portfolios by major security type.
Table 38: Investment Securities Summary
June 30, 2020 (a) |
December 31, 2019 |
||||||||||||||||||||||||||||||||
In millions |
Amortized
Cost (b)
|
Unrealized |
Fair
Value
|
Amortized
Cost
|
Unrealized |
Fair
Value
|
|||||||||||||||||||||||||||
Gains |
Losses |
Gains |
Losses |
||||||||||||||||||||||||||||||
Securities Available for Sale |
|||||||||||||||||||||||||||||||||
U.S. Treasury and government agencies |
$ |
$ |
$ |
$ |
$ |
$ |
( |
) |
$ |
||||||||||||||||||||||||
Residential mortgage-backed |
|||||||||||||||||||||||||||||||||
Agency |
$ |
( |
) |
( |
) |
||||||||||||||||||||||||||||
Non-agency |
( |
) |
( |
) |
|||||||||||||||||||||||||||||
Commercial mortgage-backed |
|||||||||||||||||||||||||||||||||
Agency |
( |
) |
( |
) |
|||||||||||||||||||||||||||||
Non-agency |
( |
) |
( |
) |
|||||||||||||||||||||||||||||
Asset-backed |
( |
) |
( |
) |
|||||||||||||||||||||||||||||
Other |
( |
) |
( |
) |
|||||||||||||||||||||||||||||
Total securities available for sale (b) |
$ |
$ |
$ |
( |
) |
$ |
$ |
$ |
$ |
( |
) |
$ |
|||||||||||||||||||||
Securities Held to Maturity |
|||||||||||||||||||||||||||||||||
U.S. Treasury and government agencies |
$ |
$ |
$ |
$ |
$ |
$ |
|||||||||||||||||||||||||||
Residential mortgage-backed |
|||||||||||||||||||||||||||||||||
Agency |
$ |
( |
) |
||||||||||||||||||||||||||||||
Non-agency |
|||||||||||||||||||||||||||||||||
Commercial mortgage-backed |
|||||||||||||||||||||||||||||||||
Agency |
|||||||||||||||||||||||||||||||||
Non-agency |
|||||||||||||||||||||||||||||||||
Asset-backed |
|||||||||||||||||||||||||||||||||
Other |
$ |
( |
) |
( |
) |
||||||||||||||||||||||||||||
Total securities held to maturity (b) (c) |
$ |
$ |
$ |
( |
) |
$ |
$ |
$ |
$ |
( |
) |
$ |
|||||||||||||||||||||
(a) The accrued interest associated with our available for sale and held to maturity portfolios totaled $270 million and $5 million at June 30, 2020, respectively. These amounts are included in Other assets on the Consolidated Balance Sheet.
(b) Amortized cost is presented net of allowance of $30 million for securities available for sale and $2 million for securities held to maturity at June 30, 2020 in accordance with the adoption of the CECL accounting standard. See the Recently Adopted Accounting Standards portion of Note 1 Accounting Policies for additional detail on the adoption of this ASU.
(c) Credit ratings represent a primary credit quality indicator used to monitor and manage credit risk. As of June 30, 2020, 84 % of our securities held to maturity were rated AAA/AA.
The fair value of investment securities is impacted by interest rates, credit spreads, market volatility and liquidity conditions. Securities available for sale are carried at fair value with net unrealized gains and losses included in Shareholders’ equity as AOCI, unless credit related. Net unrealized gains and losses are determined by taking the difference between the fair value of a security and its amortized cost, net of any allowance. Securities held to maturity are carried at amortized cost less any allowance. Investment securities at June 30, 2020 included $347 million of net unsettled purchases which represent non-cash investing activity, and accordingly, are not reflected on the Consolidated Statement of Cash Flows. The comparable amount for June 30, 2019 was $2.0 billion.
Table 39 presents the gross unrealized losses and fair value of securities available for sale that do not have an associated allowance for investment securities as of June 30, 2020. These securities are segregated between investments that had been in a continuous unrealized loss position for less than twelve months and twelve months or more, based on the point in time that the fair value declined below the amortized cost basis. All securities included in the table have been evaluated to determine if a credit loss exists. As part of that assessment, as of June 30, 2020, we concluded that we do not intend to sell and believe we will not be required to sell these securities prior to recovery of the amortized cost basis.
The PNC Financial Services Group, Inc. – Form 10-Q 67
Table 39: Gross Unrealized Loss and Fair Value of Securities Available for Sale Without an Allowance for Credit Losses
|
Unrealized loss position
less than 12 months
|
Unrealized loss position
12 months or more
|
Total |
||||||||||||||||||||||
In millions |
Unrealized
Loss
|
Fair
Value
|
Unrealized
Loss
|
Fair
Value
|
Unrealized
Loss
|
Fair
Value
|
||||||||||||||||||
June 30, 2020 |
||||||||||||||||||||||||
Residential mortgage-backed |
||||||||||||||||||||||||
Agency |
$ |
( |
) |
$ |
$ |
( |
) |
$ |
$ |
( |
) |
$ |
||||||||||||
Non-agency |
( |
) |
( |
) |
( |
) |
||||||||||||||||||
Commercial mortgage-backed |
||||||||||||||||||||||||
Agency |
( |
) |
( |
) |
||||||||||||||||||||
Non-agency |
( |
) |
( |
) |
( |
) |
||||||||||||||||||
Asset-backed |
( |
) |
( |
) |
( |
) |
||||||||||||||||||
Other |
( |
) |
( |
) |
( |
) |
||||||||||||||||||
Total securities available for sale |
$ |
( |
) |
$ |
$ |
( |
) |
$ |
$ |
( |
) |
$ |
||||||||||||
Table 40 presents the gross unrealized losses and fair value of debt securities at December 31, 2019, prior to the adoption of the CECL standard. These securities are segregated between investments that had been in a continuous unrealized loss position for less than twelve months and twelve months or more, based on the point in time that the fair value declined below the amortized cost basis.
Table 40: Gross Unrealized Loss and Fair Value of Debt Securities
Unrealized loss position less than 12 months |
Unrealized loss position 12 months or more |
Total |
|||||||||||||||||||||||
In millions |
Unrealized
Loss
|
Fair
Value
|
Unrealized
Loss
|
Fair
Value
|
Unrealized
Loss
|
Fair
Value
|
|||||||||||||||||||
December 31, 2019 |
|||||||||||||||||||||||||
Securities Available for Sale |
|||||||||||||||||||||||||
U.S. Treasury and government agencies |
$ |
( |
) |
$ |
$ |
( |
) |
$ |
$ |
( |
) |
$ |
|||||||||||||
Residential mortgage-backed |
|||||||||||||||||||||||||
Agency |
( |
) |
( |
) |
( |
) |
|||||||||||||||||||
Non-agency |
( |
) |
( |
) |
|||||||||||||||||||||
Commercial mortgage-backed |
|||||||||||||||||||||||||
Agency |
( |
) |
( |
) |
( |
) |
|||||||||||||||||||
Non-agency |
( |
) |
( |
) |
( |
) |
|||||||||||||||||||
Asset-backed |
( |
) |
( |
) |
( |
) |
|||||||||||||||||||
Other |
( |
) |
( |
) |
|||||||||||||||||||||
Total securities available for sale |
$ |
( |
) |
$ |
$ |
( |
) |
$ |
$ |
( |
) |
$ |
|||||||||||||
Securities Held to Maturity |
|||||||||||||||||||||||||
Residential mortgage-backed - Agency |
$ |
( |
) |
$ |
$ |
( |
) |
$ |
|||||||||||||||||
Other |
$ |
( |
) |
$ |
( |
) |
( |
) |
|||||||||||||||||
Total securities held to maturity |
$ |
( |
) |
$ |
$ |
( |
) |
$ |
$ |
( |
) |
$ |
|||||||||||||
Information relating to gross realized securities gains and losses from the sales of securities is set forth in the following table.
Table 41: Gains (Losses) on Sales of Securities Available for Sale
Six months ended June 30 In millions |
Gross Gains |
Gross Losses |
Net Gains (Losses) |
Tax Expense (Benefit) |
|||||||||
2020 |
$ |
$ |
( |
) |
$ |
$ |
|||||||
2019 |
$ |
$ |
( |
) |
$ |
$ |
|||||||
68 The PNC Financial Services Group, Inc. – Form 10-Q
The following table presents, by remaining contractual maturity, the amortized cost, fair value and weighted-average yield of debt securities at June 30, 2020.
Table 42: Contractual Maturity of Debt Securities
June 30, 2020 Dollars in millions |
1 Year or Less |
After 1 Year
through 5 Years
|
After 5 Years
through 10 Years
|
After 10
Years
|
Total |
||||||||||||||||
Securities Available for Sale |
|||||||||||||||||||||
U.S. Treasury and government agencies |
$ |
$ |
$ |
$ |
$ |
||||||||||||||||
Residential mortgage-backed |
|||||||||||||||||||||
Agency |
|||||||||||||||||||||
Non-agency |
|||||||||||||||||||||
Commercial mortgage-backed |
|||||||||||||||||||||
Agency |
|||||||||||||||||||||
Non-agency |
|||||||||||||||||||||
Asset-backed |
|||||||||||||||||||||
Other |
|||||||||||||||||||||
Total securities available for sale at amortized cost |
$ |
$ |
$ |
$ |
$ |
||||||||||||||||
Fair value |
$ |
$ |
$ |
$ |
$ |
||||||||||||||||
Weighted-average yield, GAAP basis (a) |
% |
% |
% |
% |
% |
||||||||||||||||
Securities Held to Maturity |
|||||||||||||||||||||
U.S. Treasury and government agencies |
$ |
$ |
$ |
$ |
|||||||||||||||||
Other |
$ |
||||||||||||||||||||
Total securities held to maturity at amortized cost |
$ |
$ |
$ |
$ |
$ |
||||||||||||||||
Fair value |
$ |
$ |
$ |
$ |
$ |
||||||||||||||||
Weighted-average yield, GAAP basis (a) |
% |
% |
% |
% |
% |
||||||||||||||||
(a) Weighted-average yields are based on amortized cost with effective yields weighted for the contractual maturity of each security.
At June 30, 2020, there were no securities of a single issuer, other than FNMA and FHLMC, that exceeded 10% of total shareholders’ equity. The FNMA and FHLMC investments had a total amortized cost of $39.6 billion and $10.6 billion and fair value of $41.1 billion and $10.9 billion, respectively.
The following table presents the fair value of securities that have been either pledged to or accepted from others to collateralize outstanding borrowings.
Table 43: Fair Value of Securities Pledged and Accepted as Collateral
In millions |
June 30 2020 |
December 31 2019 |
||||
Pledged to others |
$ |
$ |
||||
Accepted from others: |
||||||
Permitted by contract or custom to sell or repledge (a) |
$ |
$ |
||||
Permitted amount repledged to others |
$ |
$ |
||||
(a) |
Balances at December 31, 2019 include $ |
The securities pledged to others include positions held in our portfolio of investment securities, trading securities and securities accepted as collateral from others that we are permitted by contract or custom to sell or repledge, and were used to secure public and trust deposits, repurchase agreements and for other purposes.
The PNC Financial Services Group, Inc. – Form 10-Q 69
NOTE 4 Loans and Related Allowance for Credit Losses
Loan Portfolio
Our loan portfolio consists of two portfolio segments – Commercial and Consumer. Each of these segments comprises multiple loan classes. Classes are characterized by similarities in risk attributes and the manner in which we monitor and assess credit risk.
Commercial |
Consumer |
|
• Commercial and industrial
|
• Home equity
|
|
• Commercial real estate
|
• Residential real estate
|
|
• Equipment lease financing
|
• Automobile
|
|
• Credit card
|
||
• Education
|
||
• Other consumer
|
||
See Note 1 Accounting Policies for additional information on our loan related policies.
Credit Quality
We closely monitor economic conditions and loan performance trends to manage and evaluate our exposure to credit risk within the loan portfolio based on our defined loan classes. In doing so, we use several credit quality indicators, including trends in delinquency rates, nonperforming status, analysis of PD and LGD ratings, updated credit scores, and originated and updated LTV ratios.
The measurement of delinquency status is based on the contractual terms of each loan. Loans that are 30 days or more past due in terms of payment are considered delinquent. With the adoption of the CECL standard, accruing loans past due as of June 30, 2020 include PCD loans, while amounts as of December 31, 2019 excluded purchased impaired loans. See Note 1 Accounting Policies for additional information related to the adoption of this standard, including the discontinuation of purchased impaired loan accounting.
The following table presents the composition and delinquency status of our loan portfolio at June 30, 2020 and December 31, 2019. Pursuant to the interagency guidance issued in April 2020 and in connection with the credit reporting rules from the CARES Act, the delinquency status of loans modified due to COVID-19 related hardships are being reported as of June 30, 2020 in alignment with the rules set forth for banks to report delinquency status to the credit agencies. These rules require that COVID-19 related loan modifications be reported as follows: (i) if current at the time of modification, the loan remains current throughout the modification period, (ii) if delinquent at the time of modification and the borrower was not made current as part of the modification, the loan maintains its reported as delinquent status during the modification period, or (iii) if delinquent at the time of modification and the borrower was made current as part of the modification or became current during the modification period, the loan is reported as current. As a result, certain loans modified due to COVID-19 related hardships are not being reported as past due as of June 30, 2020 based on the contractual terms of the loan, even where borrowers may not be making payments on their loans during the modification period.
70 The PNC Financial Services Group, Inc. – Form 10-Q
Table 44: Analysis of Loan Portfolio
Accruing |
||||||||||||||||||||||||||
Dollars in millions |
Current or Less
Than 30 Days
Past Due
|
30-59
Days
Past Due
|
60-89
Days
Past Due
|
90 Days
Or More
Past Due
|
Total
Past
Due (c)
|
Nonperforming
Loans
|
Fair Value
Option
Nonaccrual
Loans (d)
|
Total Loans
(e)(f)
|
||||||||||||||||||
June 30, 2020 (a) (b) |
||||||||||||||||||||||||||
Commercial |
||||||||||||||||||||||||||
Commercial and industrial |
$ |
$ |
$ |
$ |
$ |
$ |
$ |
|||||||||||||||||||
Commercial real estate |
||||||||||||||||||||||||||
Equipment lease financing |
||||||||||||||||||||||||||
Total commercial |
||||||||||||||||||||||||||
Consumer |
||||||||||||||||||||||||||
Home equity |
$ |
|||||||||||||||||||||||||
Residential real estate |
(c) |
|||||||||||||||||||||||||
Automobile |
||||||||||||||||||||||||||
Credit card |
||||||||||||||||||||||||||
Education |
(c) |
|||||||||||||||||||||||||
Other consumer |
||||||||||||||||||||||||||
Total consumer |
||||||||||||||||||||||||||
Total |
$ |
$ |
$ |
$ |
$ |
$ |
$ |
$ |
||||||||||||||||||
Percentage of total loans |
% |
% |
% |
% |
% |
% |
% |
% |
||||||||||||||||||
(a) |
Amounts in table represent loans held for investment and do not include any associated valuation allowance. |
(b) |
The accrued interest associated with our loan portfolio at June 30, 2020 totaled $ |
(c) |
Past due loan amounts include government insured or guaranteed Residential real estate loans and Education loans totaling $ |
(d) |
Consumer loans accounted for under the fair value option for which we do not expect to collect substantially all principal and interest are subject to nonaccrual accounting and classification upon meeting any of our nonaccrual policies. Given that these loans are not accounted for at amortized cost, these loans have been excluded from the nonperforming loan population. |
(e) |
Net of unearned income, unamortized deferred fees and costs on originated loans, and premiums or discounts on purchased loans totaling $ |
(f) |
Collateral dependent loans totaled $ |
Accruing |
|||||||||||||||||||||||||||||
Dollars in millions |
Current or Less
Than 30 Days
Past Due
|
30-59 Days
Past Due
|
60-89 Days
Past Due
|
90 Days
Or More
Past Due
|
Total Past
Due (h)
|
Nonperforming
Loans
|
Fair Value
Option
Nonaccrual
Loans (i)
|
Purchased
Impaired
Loans
|
Total
Loans (j)
|
||||||||||||||||||||
December 31, 2019 (g) |
|||||||||||||||||||||||||||||
Commercial |
|||||||||||||||||||||||||||||
Commercial and industrial |
$ |
$ |
$ |
$ |
$ |
$ |
$ |
||||||||||||||||||||||
Commercial real estate |
|||||||||||||||||||||||||||||
Equipment lease financing |
|||||||||||||||||||||||||||||
Total commercial |
|||||||||||||||||||||||||||||
Consumer |
|||||||||||||||||||||||||||||
Home equity |
$ |
||||||||||||||||||||||||||||
Residential real estate |
(h) |
$ |
|||||||||||||||||||||||||||
Automobile |
|||||||||||||||||||||||||||||
Credit card |
|||||||||||||||||||||||||||||
Education |
(h) |
||||||||||||||||||||||||||||
Other consumer |
|||||||||||||||||||||||||||||
Total consumer |
|||||||||||||||||||||||||||||
Total |
$ |
$ |
$ |
$ |
$ |
$ |
$ |
$ |
$ |
||||||||||||||||||||
Percentage of total loans |
% |
% |
% |
% |
% |
% |
% |
% |
% |
||||||||||||||||||||
(g) |
Amounts in table represent recorded investment and exclude loans held for sale. Recorded investment does not include any associated valuation allowance. |
(h) |
Past due loan amounts exclude purchased impaired loans, even if contractually past due (or if we do not expect to receive payment in full based on the original contractual terms), as we accreted interest income over the expected life of the loans. Past due loan amounts include government insured or guaranteed Residential real estate loans totaling $ |
(i) |
Consumer loans accounted for under the fair value option for which we do not expect to collect substantially all principal and interest are subject to nonaccrual accounting and classification upon meeting any of our nonaccrual policies. Given that these loans are not accounted for at amortized cost, these loans have been excluded from the nonperforming loan population. |
(j) |
Net of unearned income, unamortized deferred fees and costs on originated loans, and premiums or discounts on purchased loans totaling $ |
The PNC Financial Services Group, Inc. – Form 10-Q 71
At June 30, 2020, we pledged $34.3 billion of commercial loans to the Federal Reserve Bank and $70.2 billion of residential real estate and other loans to the Federal Home Loan Bank as collateral for the ability to borrow, if necessary. The comparable amounts at December 31, 2019 were $16.9 billion and $68.0 billion, respectively. Amounts pledged reflect the unpaid principal balances.
Nonperforming Assets
Nonperforming assets include nonperforming loans and leases, OREO and foreclosed assets. Nonperforming loans are those loans accounted for at amortized cost whose credit quality has deteriorated to the extent that full collection of contractual principal and interest is not probable. Interest income is not recognized on these loans. Loans accounted for under the fair value option are reported as performing loans, however, when nonaccrual criteria is met interest income is not recognized on these loans. Additionally, certain government insured or guaranteed loans for which we expect to collect substantially all principal and interest are not reported as nonperforming loans and continue to accrue interest.
With the adoption of the CECL standard, nonperforming loans as of June 30, 2020 include PCD loans. Amounts as of December 31, 2019 excluded purchased impaired loans as we were accreting interest income over the expected life of the loans. See Note 1 Accounting Policies for additional information related to the adoption of this standard and our nonperforming loan and lease policies.
The following table presents our nonperforming assets as of June 30, 2020 and December 31, 2019, respectively.
Table 45: Nonperforming Assets
Dollars in millions |
June 30 2020 |
December 31 2019 |
|||||||
Nonperforming loans |
|||||||||
Commercial |
$ |
$ |
|||||||
Consumer (a) |
|||||||||
Total nonperforming loans (b) |
|||||||||
OREO and foreclosed assets |
|||||||||
Total nonperforming assets |
$ |
$ |
|||||||
Nonperforming loans to total loans |
% |
% |
|||||||
Nonperforming assets to total loans, OREO and foreclosed assets |
% |
% |
|||||||
Nonperforming assets to total assets |
% |
% |
|||||||
(a) |
Excludes most unsecured consumer loans and lines of credit, which are charged off after 120 to 180 days past due and are not placed on nonperforming status. |
(b) |
Nonperforming loans for which there is no related ALLL totaled $ |
Nonperforming loans also include certain loans whose terms have been restructured in a manner that grants a concession to a borrower experiencing financial difficulties. In accordance with applicable accounting guidance, these loans are considered TDRs. See Note 1 Accounting Policies and the TDR section of this Note 4 for additional information on TDRs.
Total nonperforming loans in Table 45 include TDRs of $.9 billion at both June 30, 2020 and December 31, 2019. TDRs that are performing, including consumer credit card TDR loans, totaled $.7 billion and $.8 billion at June 30, 2020 and December 31, 2019, respectively, and are excluded from nonperforming loans.
Additional Credit Quality Indicators by Loan Class
Commercial and Industrial
For commercial and industrial loans, we monitor the performance of the borrower in a disciplined and regular manner based upon the level of credit risk inherent in the loan. To evaluate the level of credit risk, we assign an internal risk rating reflecting the borrower’s PD and LGD. This two-dimensional credit risk rating methodology provides granularity in the risk monitoring process. These ratings are reviewed and updated, generally at least once per year. For small balance homogeneous pools of commercial and industrial loans, mortgages and leases, we apply scoring techniques to assist in determining the PD. Further, on a periodic basis, we update our LGD estimates associated with each rating grade based upon historical data. The combination of the PD and LGD ratings assigned to commercial and industrial loans, capturing both the combination of expectations of default and loss severity in event of default, reflects credit quality characteristics as of the reporting date and are used as inputs into our loss forecasting process.
Based upon the amount of the lending arrangement and our risk rating assessment, we follow a formal schedule of written periodic review. Quarterly, we conduct formal reviews of a market’s or business unit’s loan portfolio, focusing on those loans which we perceive to be of higher risk, based upon PDs and LGDs, or loans for which credit quality is weakening. If circumstances warrant, it is our practice to review any customer obligation and its level of credit risk more frequently. We attempt to proactively manage our loans by using various procedures that are customized to the risk of a given loan, including ongoing outreach, contact, and assessment of obligor financial conditions, collateral inspection and appraisal.
72 The PNC Financial Services Group, Inc. – Form 10-Q
Commercial Real Estate
We manage credit risk associated with our commercial real estate projects and commercial mortgages similar to commercial and industrial loans by evaluating PD and LGD. Risks associated with commercial real estate projects and commercial mortgage activities tend to be correlated to the loan structure and collateral location, project progress and business environment. As a result, these attributes are also monitored and utilized in assessing credit risk.
As with the commercial and industrial loan class, a formal schedule of periodic review is also performed to assess market/geographic risk and business unit/industry risk. Often as a result of these overviews, more in-depth reviews and increased scrutiny are placed on areas of higher risk, such as adverse changes in risk ratings, deteriorating operating trends, and/or areas that concern management. These reviews are designed to assess risk and facilitate actions to mitigate such risks.
Equipment Lease Financing
We manage credit risk associated with our equipment lease financing loan class similar to commercial and industrial loans by analyzing PD and LGD.
Based upon the dollar amount of the lease and the level of credit risk, we follow a formal schedule of periodic review. Generally, this occurs quarterly, although we have established practices to review such credit risk more frequently if circumstances warrant. Our review process entails analysis of the following factors: equipment value/residual value, exposure levels, jurisdiction risk, industry risk, guarantor requirements, and regulatory compliance as applicable.
Table 46: Commercial Credit Quality Indicators (a)
Term Loans by Origination Year |
|||||||||||||||||||||||||||
June 30, 2020 - In millions |
2020 |
2019 |
2018 |
2017 |
2016 |
Prior |
Revolving Loans |
Revolving Loans Converted to Term |
Total
Loans
|
||||||||||||||||||
Commercial and industrial |
|||||||||||||||||||||||||||
Pass Rated |
$ |
$ |
$ |
$ |
$ |
$ |
$ |
$ |
$ |
||||||||||||||||||
Criticized |
|||||||||||||||||||||||||||
Total commercial and industrial |
|||||||||||||||||||||||||||
Commercial real estate |
|||||||||||||||||||||||||||
Pass Rated |
|||||||||||||||||||||||||||
Criticized |
|||||||||||||||||||||||||||
Total commercial real estate |
|||||||||||||||||||||||||||
Equipment lease financing |
|||||||||||||||||||||||||||
Pass Rated |
|||||||||||||||||||||||||||
Criticized |
|||||||||||||||||||||||||||
Total equipment lease financing |
|||||||||||||||||||||||||||
Total commercial |
$ |
$ |
$ |
$ |
$ |
$ |
$ |
$ |
$ |
||||||||||||||||||
December 31, 2019 - In millions |
Pass Rated |
Criticized |
Total Loans |
||||||||||
Commercial and industrial |
$ |
$ |
$ |
||||||||||
Commercial real estate |
|||||||||||||
Equipment lease financing |
|||||||||||||
Total commercial |
$ |
$ |
$ |
||||||||||
(a) |
Loans in our commercial portfolio are classified as Pass Rated or Criticized based on the regulatory definitions, which are driven by the PD and LGD ratings that we assign. The Criticized classification includes loans that were rated special mention, substandard or doubtful as of June 30, 2020 and December 31, 2019.
|
Home Equity and Residential Real Estate
We use several credit quality indicators, including delinquency information, nonperforming loan information, updated credit scores, originated and updated LTV ratios to monitor and manage credit risk within the home equity and residential real estate loan classes. A summary of credit quality indicators follows:
Delinquency/Delinquency Rates: We monitor trending of delinquency/delinquency rates for home equity and residential real estate loans. See Table 44 for additional information.
Nonperforming Loans: We monitor trending of nonperforming loans for home equity and residential real estate loans. See Table 44 for additional information.
The PNC Financial Services Group, Inc. – Form 10-Q 73
Credit Scores: We use a national third-party provider to update FICO credit scores for home equity and residential real estate loans at least quarterly. The updated scores are incorporated into a series of credit management reports, which are utilized to monitor the risk in the loan classes.
LTV (inclusive of combined loan-to-value (CLTV) for first and subordinate lien positions): At least annually, we update the property values of real estate collateral and calculate an updated LTV ratio. For open-end credit lines secured by real estate in regions experiencing significant declines in property values, more frequent valuations may occur. We examine LTV migration and stratify LTV into categories to monitor the risk in the loan classes.
We use a combination of original LTV and updated LTV for internal risk management and reporting purposes (e.g., line management, loss mitigation strategies). In addition to the fact that estimated property values by their nature are estimates, given certain data limitations it is important to note that updated LTVs may be based upon management’s assumptions (i.e., if an updated LTV is not provided by the third-party service provider, HPI changes will be incorporated in arriving at management’s estimate of updated LTV).
Updated LTV is estimated using modeled property values. The related estimates and inputs are based upon an approach that uses a combination of third-party automated valuation models, broker price opinions, HPI indices, property location, internal and external balance information, origination data and management assumptions. We generally utilize origination lien balances provided by a third-party, where applicable, which do not include an amortization assumption when calculating updated LTV. Accordingly, the results of the calculations do not represent actual appraised loan level collateral or updated LTV based upon lien balances held by others, and as such, are necessarily imprecise and subject to change as we refine our methodology.
The following table presents credit quality indicators for the home equity and residential real estate loan classes.
Table 47: Home Equity and Residential Real Estate Credit Quality Indicators
Term Loans by Origination Year |
|||||||||||||||||||||||||||
June 30, 2020 – In millions |
2020 |
2019 |
2018 |
2017 |
2016 |
Prior |
Revolving Loans |
Revolving Loans Converted to Term |
Total Loans |
||||||||||||||||||
Home equity |
|||||||||||||||||||||||||||
Current estimated LTV ratios |
. |
||||||||||||||||||||||||||
Greater than or equal to 100% |
$ |
$ |
$ |
$ |
$ |
$ |
$ |
$ |
|||||||||||||||||||
Greater than or equal to 90% to less than 100% |
$ |
||||||||||||||||||||||||||
Less than 90% |
|||||||||||||||||||||||||||
Total home equity |
$ |
$ |
$ |
$ |
$ |
$ |
$ |
$ |
$ |
||||||||||||||||||
Updated FICO scores |
|||||||||||||||||||||||||||
Greater than 660 |
$ |
$ |
$ |
$ |
$ |
$ |
$ |
$ |
$ |
||||||||||||||||||
Less than or equal to 660 |
|||||||||||||||||||||||||||
No FICO score available |
|||||||||||||||||||||||||||
Total home equity |
$ |
$ |
$ |
$ |
$ |
$ |
$ |
$ |
$ |
||||||||||||||||||
Residential real estate |
|||||||||||||||||||||||||||
Current estimated LTV ratios |
|||||||||||||||||||||||||||
Greater than or equal to 100% |
$ |
$ |
$ |
$ |
$ |
$ |
|||||||||||||||||||||
Greater than or equal to 90% to less than 100% |
$ |
||||||||||||||||||||||||||
Less than 90% |
|||||||||||||||||||||||||||
Government insured or guaranteed loans |
|||||||||||||||||||||||||||
Total residential real estate |
$ |
$ |
$ |
$ |
$ |
$ |
$ |
||||||||||||||||||||
Updated FICO scores |
|||||||||||||||||||||||||||
Greater than 660 |
$ |
$ |
$ |
$ |
$ |
$ |
$ |
||||||||||||||||||||
Less than or equal to 660 |
|||||||||||||||||||||||||||
No FICO score available |
|||||||||||||||||||||||||||
Government insured or guaranteed loans |
|||||||||||||||||||||||||||
Total residential real estate |
$ |
$ |
$ |
$ |
$ |
$ |
$ |
||||||||||||||||||||
74 The PNC Financial Services Group, Inc. – Form 10-Q
Home equity |
Residential real estate |
|||||
December 31, 2019 - In millions | ||||||
Current estimated LTV ratios |
||||||
Greater than or equal to 100% |
$ |
$ |
||||
Greater than or equal to 90% to less than 100% |
||||||
Less than 90% |
||||||
No LTV ratio available |
||||||
Government insured or guaranteed loans |
||||||
Purchased impaired loans |
||||||
Total loans |
$ |
$ |
||||
Updated FICO Scores |
||||||
Greater than 660 |
$ |
$ |
||||
Less than or equal to 660 |
||||||
No FICO score available |
||||||
Government insured or guaranteed loans |
||||||
Purchased impaired loans |
||||||
Total loans |
$ |
$ |
||||
Automobile, Credit Card, Education and Other Consumer
We monitor a variety of credit quality information in the management of these consumer loan classes. For all loan types, we generally use a combination of internal loan parameters as well as an updated FICO score. We use FICO scores as a primary credit quality indicator for automobile and credit card loans, as well as non-government guaranteed or non-insured education loans and other secured and unsecured lines and loans. Internal credit metrics, such as delinquency status, are heavily relied upon as credit quality indicators for government guaranteed or insured education loans and consumer loans to high net worth individuals, as internal credit metrics are more relevant than FICO scores for these types of loans.
Along with the monitoring of delinquency trends and losses for each class, FICO credit score updates are obtained at least quarterly along with a variety of credit bureau attributes. Loans with high FICO scores tend to have a lower likelihood of loss. Conversely, loans with low FICO scores tend to have a higher likelihood of loss.
The PNC Financial Services Group, Inc. – Form 10-Q 75
The following table presents credit quality indicators for the automobile, credit card, education and other consumer loan classes.
Table 48: Credit Quality Indicators for Automobile, Credit Card, Education and Other Consumer Loan Classes
Term Loans by Origination Year |
|||||||||||||||||||||||||||
June 30, 2020 - In millions |
2020 |
2019 |
2018 |
2017 |
2016 |
Prior |
Revolving Loans |
Revolving Loans Converted to Term |
Total Loans |
||||||||||||||||||
Automobile |
|||||||||||||||||||||||||||
FICO score greater than 719 |
$ |
$ |
$ |
$ |
$ |
$ |
$ |
||||||||||||||||||||
650 to 719 |
|||||||||||||||||||||||||||
620 to 649 |
|||||||||||||||||||||||||||
Less than 620 |
|||||||||||||||||||||||||||
Total automobile |
$ |
$ |
$ |
$ |
$ |
$ |
$ |
||||||||||||||||||||
Credit card |
|||||||||||||||||||||||||||
FICO score greater than 719 |
$ |
$ |
$ |
||||||||||||||||||||||||
650 to 719 |
|||||||||||||||||||||||||||
620 to 649 |
|||||||||||||||||||||||||||
Less than 620 |
|||||||||||||||||||||||||||
No FICO score available or required (a) |
|||||||||||||||||||||||||||
Total credit card |
$ |
$ |
$ |
||||||||||||||||||||||||
Education |
|||||||||||||||||||||||||||
FICO score greater than 719 |
$ |
$ |
$ |
$ |
$ |
$ |
$ |
||||||||||||||||||||
650 to 719 |
|||||||||||||||||||||||||||
620 to 649 |
|||||||||||||||||||||||||||
Less than 620 |
|||||||||||||||||||||||||||
No FICO score available or required (a) |
|||||||||||||||||||||||||||
Total loans using FICO credit metric |
|||||||||||||||||||||||||||
Other internal credit metrics |
|||||||||||||||||||||||||||
Total education |
$ |
$ |
$ |
$ |
$ |
$ |
$ |
||||||||||||||||||||
Other consumer |
|||||||||||||||||||||||||||
FICO score greater than 719 |
$ |
$ |
$ |
$ |
$ |
$ |
$ |
$ |
$ |
||||||||||||||||||
650 to 719 |
|||||||||||||||||||||||||||
620 to 649 |
|||||||||||||||||||||||||||
Less than 620 |
|||||||||||||||||||||||||||
No FICO score available or required (a) |
|||||||||||||||||||||||||||
Total loans using FICO credit metric |
|||||||||||||||||||||||||||
Other internal credit metrics |
|||||||||||||||||||||||||||
Total other consumer |
$ |
$ |
$ |
$ |
$ |
$ |
$ |
$ |
$ |
||||||||||||||||||
December 31, 2019 - In millions |
Automobile |
Credit Card |
Education |
Other Consumer |
|||||||||
FICO score greater than 719 |
$ |
$ |
$ |
$ |
|||||||||
650 to 719 |
|||||||||||||
620 to 649 |
|||||||||||||
Less than 620 |
|||||||||||||
No FICO score available or required (a) |
|||||||||||||
Total loans using FICO credit metric |
|||||||||||||
Consumer loans using other internal credit metrics |
|||||||||||||
Total loans |
$ |
$ |
$ |
$ |
|||||||||
Weighted-average updated FICO score (b) |
|||||||||||||
(a) |
Loans with no FICO score available or required generally refers to new accounts issued to borrowers with limited credit history, accounts for which we cannot obtain an updated FICO score (e.g., recent profile changes), cards issued with a business name and/or cards secured by collateral. Management proactively assesses the risk and size of this loan category and, when necessary, takes actions to mitigate the credit risk. |
(b) |
Weighted-average updated FICO score excludes accounts with no FICO score available or required. |
Troubled Debt Restructurings (TDRs)
76 The PNC Financial Services Group, Inc. – Form 10-Q
Table 49 quantifies the number of loans that were classified as TDRs as well as the change in the loans’ balance as a result of becoming a TDR during the three and six months ended June 30, 2020 and June 30, 2019. Additionally, the table provides information about the types of TDR concessions. See Note 3 Asset Quality in our 2019 Form 10-K for additional details on these TDR concessions.
Table 49: Financial Impact and TDRs by Concession Type
|
Pre-TDR
Amortized Cost Basis (b)
|
Post-TDR Amortized Cost Basis (c) |
|||||||||||||||||||||||
|
During the three months ended June 30, 2020 (a)
Dollars in millions
|
Number of Loans |
Principal
Forgiveness
|
Rate
Reduction
|
Other |
Total |
|||||||||||||||||||
Commercial |
$ |
$ |
$ |
$ |
||||||||||||||||||||
Consumer |
$ |
|||||||||||||||||||||||
Total TDRs |
$ |
$ |
$ |
$ |
$ |
|||||||||||||||||||
During the six months ended June 30, 2020 Dollars in millions |
||||||||||||||||||||||||
Commercial |
$ |
$ |
$ |
$ |
||||||||||||||||||||
Consumer |
$ |
|||||||||||||||||||||||
Total TDRs |
$ |
$ |
$ |
$ |
$ |
|||||||||||||||||||
(a) Impact of partial charge-offs at TDR date are included in this table.
(b) Represents the amortized cost basis of the loans as of the quarter end prior to TDR designation.
(c) Represents the amortized cost basis of the TDRs as of the end of the quarter in which the TDR occurs.
|
Pre-TDR
Recorded
Investment (e)
|
Post-TDR Recorded Investment (f) |
|||||||||||||||||||||
|
During the three months ended June 30, 2019 (d)
Dollars in millions
|
Number of Loans |
Principal
Forgiveness
|
Rate
Reduction
|
Other |
Total |
|||||||||||||||||
Commercial |
$ |
$ |
$ |
$ |
||||||||||||||||||
Consumer |
||||||||||||||||||||||
Total TDRs |
$ |
$ |
$ |
$ |
||||||||||||||||||
During the six months ended June 30, 2019 Dollars in millions |
||||||||||||||||||||||
Commercial |
$ |
$ |
$ |
$ |
||||||||||||||||||
Consumer |
||||||||||||||||||||||
Total TDRs |
$ |
$ |
$ |
$ |
||||||||||||||||||
(d) Impact of partial charge-offs at TDR date are included in this table.
(e) Represents the recorded investment of the loans as of the quarter end prior to TDR designation, and excludes immaterial amounts of accrued interest receivable.
After a loan is determined to be a TDR, we continue to track its performance under its most recent restructured terms. We consider a TDR to have subsequently defaulted when it becomes 60 days past due after the most recent date the loan was restructured. The following table provides a summary of TDRs that subsequently defaulted during the periods presented and were classified as
TDRs during the applicable 12-month period preceding June 30, 2020 and June 30, 2019.
Table 50: Subsequently Defaulted TDRs
In millions |
2020 |
2019 |
||||||
Three months ended June 30 |
$ |
$ |
||||||
Six months ended June 30 |
$ |
$ |
||||||
The PNC Financial Services Group, Inc. – Form 10-Q 77
Allowance for Credit Losses
We maintain the ACL related to loans at levels that we believe to be appropriate to absorb expected credit losses in the portfolios as of the balance sheet date. See Note 1 Accounting Policies for a discussion of the methodologies used to determine this allowance. A rollforward of the ACL related to loans follows.
Table 51: Rollforward of Allowance for Credit Losses
Six months ended June 30, 2020 |
|||||||||
In millions |
Commercial |
Consumer |
Total |
||||||
Allowance for loan and lease losses |
|||||||||
December 31, 2019 |
$ |
$ |
$ |
||||||
Adoption of ASU 2016-13 (a) |
( |
) |
|||||||
January 1, 2020 |
|||||||||
Charge-offs |
( |
) |
( |
) |
( |
) |
|||
Recoveries |
|||||||||
Net (charge-offs) |
( |
) |
( |
) |
( |
) |
|||
Provision for credit losses |
|||||||||
Other |
( |
) |
( |
) |
|||||
June 30, 2020 |
$ |
$ |
$ |
||||||
Allowance for unfunded lending related commitments (b) |
|||||||||
December 31, 2019 |
$ |
$ |
$ |
||||||
Adoption of ASU 2016-13 (a) |
|||||||||
January 1, 2020 |
|||||||||
Provision for (recapture of) credit losses |
( |
) |
|||||||
June 30, 2020 |
$ |
$ |
$ |
||||||
Allowance for credit losses at June 30 |
$ |
$ |
$ |
||||||
(a) |
Represents the impact of adopting ASU 2016-13, Financial Instruments - Credit Losses on January 1, 2020 and our transition from an incurred loss methodology for our reserves to an expected credit loss methodology.
|
(b) |
The following presents an analysis of changes impacting the ACL related to loans for the six months ended June 30, 2020.
Table 52: Analysis of Changes in the Allowance for Credit Losses (a)
In millions
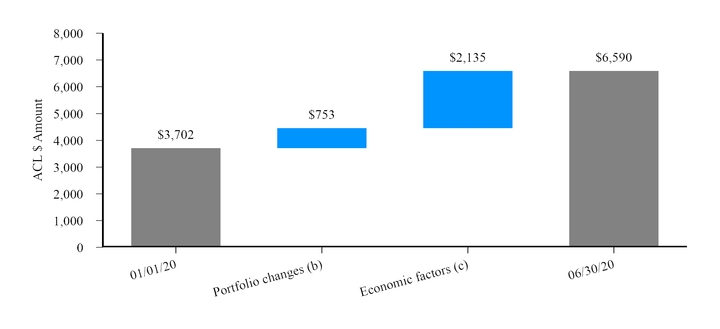 (a) Excludes allowances for investment securities and other financial assets.
(b) Represents changes in the portfolio such as the impact of increases/decreases in loan balances, age and mix due to new originations/purchases, as well as credit quality and net charge-off activity.
(c) Economic factors represent our evaluation and determination of an economic forecast applied to our loan portfolio.
78 The PNC Financial Services Group, Inc. – Form 10-Q
The $2.9 billion increase in the ACL since January 1, 2020 was driven by the following factors in the commercial and consumer portfolios:
• |
Commercial reserves increased $ |
• |
Consumer reserves increased $ |
Allowance for Loan and Lease Losses
A rollforward of the ALLL and associated loan data follows:
Table 53: Rollforward of Allowance for Loan and Lease Losses and Associated Loan Data
At or for the six months ended June 30, 2019 Dollars in millions |
Commercial |
Consumer |
Total |
||||||
Allowance for loan and lease losses |
|||||||||
January 1, 2019 |
$ |
$ |
$ |
||||||
Charge-offs |
( |
) |
( |
) |
( |
) |
|||
Recoveries |
|||||||||
Net (charge-offs) |
( |
) |
( |
) |
( |
) |
|||
Provision for credit losses |
|||||||||
|
Net decrease in allowance for unfunded loan commitments and letters
of credit
|
( |
) |
( |
) |
|||||
Other |
|||||||||
June 30, 2019 |
$ |
$ |
$ |
||||||
TDRs individually evaluated for impairment |
$ |
$ |
$ |
||||||
Other loans individually evaluated for impairment |
|||||||||
Loans collectively evaluated for impairment |
|||||||||
Purchased impaired loans |
|||||||||
June 30, 2019 |
$ |
$ |
$ |
||||||
Loan portfolio |
|||||||||
TDRs individually evaluated for impairment |
$ |
$ |
$ |
||||||
Other loans individually evaluated for impairment |
|||||||||
Loans collectively evaluated for impairment |
|||||||||
Fair value option loans (a) |
|||||||||
Purchased impaired loans |
|||||||||
June 30, 2019 |
$ |
$ |
$ |
||||||
NOTE 5 L OAN SALE AND SERVICING ACTIVITIES AND VARIABLE INTEREST ENTITIES
Loan Sale and Servicing Activities
As more fully described in Note 2 Loan Sale and Servicing Activities and Variable Interest Entities in our 2019 Form 10-K, we have transferred residential and commercial mortgage loans in securitization or sales transactions in which we have continuing involvement. Our continuing involvement generally consists of servicing, repurchasing previously transferred loans under certain conditions and loss share arrangements, and, in limited circumstances, holding of mortgage-backed securities issued by the securitization special purpose entities (SPEs).
We earn servicing and other ancillary fees for our role as servicer and, depending on the contractual terms of the servicing arrangement, we can be terminated as servicer with or without cause. At the consummation date of each type of loan transfer where we retain the servicing, we recognize a servicing right at fair value. See Note 9 Commitments and Note 12 Fair Value for information on our servicing rights, including the carrying value of servicing assets.
The PNC Financial Services Group, Inc. – Form 10-Q 79
The following table provides cash flows associated with our loan sale and servicing activities:
Table 54: Cash Flows Associated with Loan Sale and Servicing Activities
In millions |
Residential Mortgages |
Commercial Mortgages (a) |
|||||||
Cash Flows - Three months ended June 30, 2020 |
|||||||||
Sales of loans (b) |
$ |
$ |
|||||||
Repurchases of previously transferred loans (c) |
$ |
$ |
|||||||
Servicing fees (d) |
$ |
$ |
|||||||
Servicing advances recovered/(funded), net |
$ |
$ |
( |
) |
|||||
Cash flows on mortgage-backed securities held (e) |
$ |
$ |
|||||||
Cash Flows - Three months ended June 30, 2019 |
|||||||||
Sales of loans (b) |
$ |
$ |
|||||||
Repurchases of previously transferred loans (c) |
$ |
||||||||
Servicing fees (d) |
$ |
$ |
|||||||
Servicing advances recovered/(funded), net |
$ |
$ |
|||||||
Cash flows on mortgage-backed securities held (e) |
$ |
$ |
|||||||
Cash Flows - Six months ended June 30, 2020 |
|||||||||
Sales of loans (b) |
$ |
$ |
|||||||
Repurchases of previously transferred loans (c) |
$ |
$ |
|||||||
Servicing fees (d) |
$ |
$ |
|||||||
Servicing advances recovered/(funded), net |
$ |
$ |
( |
) |
|||||
Cash flows on mortgage-backed securities held (e) |
$ |
$ |
|||||||
Cash Flows - Six months ended June 30, 2019 |
|||||||||
Sales of loans (b) |
$ |
$ |
|||||||
Repurchases of previously transferred loans (c) |
$ |
$ |
|||||||
Servicing fees (d) |
$ |
$ |
|||||||
Servicing advances recovered/(funded), net |
$ |
$ |
|||||||
Cash flows on mortgage-backed securities held (e) |
$ |
$ |
|||||||
(a) |
Represents cash flow information associated with both commercial mortgage loan transfers and servicing activities. |
(b) |
Gains/losses recognized on sales of loans were insignificant for the periods presented. |
(c) |
Includes both residential and commercial mortgage government insured or guaranteed loans eligible for repurchase through the exercise of our removal of account provision option, as well as residential mortgage loans repurchased due to alleged breaches of origination covenants or representations and warranties made to purchasers. |
(d) |
Includes contractually specified servicing fees, late charges and ancillary fees. |
(e) |
Represents cash flows on securities where we transferred to and/or service loans for a securitization SPE and we hold securities issued by that SPE. The carrying values of such securities held were $ |
Table 55 presents information about the principal balances of transferred loans that we service and are not recorded on our Consolidated Balance Sheet. We would only experience a loss on these transferred loans if we were required to repurchase a loan, where the repurchase price exceeded the loan's fair value, due to a breach in representations and warranties or a loss sharing arrangement associated with our continuing involvement with these loans. The estimate of losses related to breaches in representations and warranties was insignificant at June 30, 2020.
80 The PNC Financial Services Group, Inc. – Form 10-Q
Table 55: Principal Balance, Delinquent Loans and Net Charge-offs Related to Serviced Loans For Others
In millions |
Residential Mortgages |
Commercial Mortgages (a) |
|||||||
June 30, 2020 |
|||||||||
Total principal balance |
$ |
$ |
|||||||
Delinquent loans (b) |
$ |
$ |
|||||||
December 31, 2019 |
|||||||||
Total principal balance |
$ |
$ |
|||||||
Delinquent loans (b) |
$ |
$ |
|||||||
Three months ended June 30, 2020 |
|||||||||
Net charge-offs (c) |
$ |
||||||||
Three months ended June 30, 2019 |
|||||||||
Net charge-offs (c) |
$ |
$ |
|||||||
Six months ended June 30, 2020 |
|||||||||
Net charge-offs (c) |
$ |
$ |
|||||||
Six months ended June 30, 2019 |
|||||||||
Net charge-offs (c) |
$ |
$ |
|||||||
(a) |
Represents information at the securitization level in which we have sold loans and we are the servicer for the securitization. |
(b) |
Serviced delinquent loans are 90 days or more past due or are in process of foreclosure. |
(c) |
Net charge-offs for Residential mortgages represent credit losses less recoveries distributed and as reported to investors during the period. Net charge-offs for Commercial mortgages represent credit losses less recoveries distributed and as reported by the trustee for commercial mortgage-backed securitizations. Realized losses for Agency securitizations are not reflected as we do not manage the underlying real estate upon foreclosure and, as such, do not have access to loss information. |
Variable Interest Entities (VIEs)
As discussed in Note 2 Loan Sale and Servicing Activities and Variable Interest Entities in our 2019 Form 10-K, we are involved with various entities in the normal course of business that are deemed to be VIEs.
The following table provides a summary of non-consolidated VIEs with which we have significant continuing involvement but are not the primary beneficiary. We have excluded certain transactions with non-consolidated VIEs from the balances presented in Table 56 where we have determined that our continuing involvement is not significant. We do not consider our continuing involvement to be significant when it relates to a VIE where we only invest in securities issued by the VIE and were not involved in the design of the VIE or where no transfers have occurred between us and the VIE. In addition, where we only have lending arrangements in the normal course of business with entities that could be VIEs, we have excluded these transactions with non-consolidated entities from the balances presented in Table 56. These loans are included as part of the asset quality disclosures that we make in Note 4 Loans and Related Allowance for Credit Losses.
Table 56: Non-Consolidated VIEs
In millions |
PNC Risk of Loss (a) |
Carrying Value of Assets Owned by PNC |
Carrying Value of Liabilities Owned by PNC |
||||||||||||
June 30, 2020 |
|||||||||||||||
Mortgage-backed securitizations (b) |
$ |
$ |
(c) |
$ |
1 |
||||||||||
Tax credit investments and other |
(d) |
$ |
(e) |
||||||||||||
Total |
$ |
$ |
$ |
||||||||||||
December 31, 2019 |
|||||||||||||||
Mortgage-backed securitizations (b) |
$ |
$ |
(c) |
||||||||||||
Tax credit investments and other |
(d) |
$ |
(e) |
||||||||||||
Total |
$ |
$ |
$ |
||||||||||||
(a) |
Represents loans, investments and other assets related to non-consolidated VIEs, net of collateral (if applicable). The risk of loss excludes any potential tax recapture associated with tax credits investments. |
(b) |
Amounts reflect involvement with securitization SPEs where we transferred to and/or service loans for an SPE and we hold securities issued by that SPE. Values disclosed in the PNC Risk of Loss column represent our maximum exposure to loss for those securities’ holdings. |
(c) |
Included in Investment securities, Mortgage servicing rights and Other assets on our Consolidated Balance Sheet. |
(d) |
Included in Investment securities, Loans, Equity investments and Other assets on our Consolidated Balance Sheet. |
(e) |
Included in Deposits and Other liabilities on our Consolidated Balance Sheet. |
We make certain equity investments in various tax credit limited partnerships or limited liability companies (LLCs). The purpose of these investments is to achieve a satisfactory return on capital and to assist us in achieving goals associated with the Community Reinvestment Act. Within Income taxes, during the six months ended June 30, 2020, we recognized $96 million of amortization, $98
The PNC Financial Services Group, Inc. – Form 10-Q 81
NOTE 6 G OODWILL AND MORTGAGE SERVICING RIGHTS
Goodwill
See Note 1 Accounting Policies in this Report and Note 7 Goodwill and Mortgage Servicing Rights in our 2019 Form 10-K for more information regarding our goodwill.
Mortgage Servicing Rights
We recognize the right to service mortgage loans for others as an intangible asset when the servicing income we receive is more than adequate compensation. MSRs totaled $1.1 billion and $1.6 billion at June 30, 2020 and December 31, 2019, respectively, and consisted of loan servicing contracts for commercial and residential mortgages measured at fair value.
MSRs are subject to declines in value from actual or expected prepayment of the underlying loans and defaults as well as market driven changes in interest rates. We manage this risk by economically hedging the fair value of MSRs with securities and derivative instruments which are expected to increase (or decrease) in value when the value of MSRs decreases (or increases).
See the Sensitivity Analysis section of this Note 6, as well as Note 6 Fair Value in our 2019 Form 10-K for more detail on our fair value measurement of MSRs. Refer to Note 7 Goodwill and Mortgage Servicing Rights in our 2019 Form 10-K for more information on our accounting and measurement of MSRs.
Changes in the commercial and residential MSRs follow:
Table 57: Mortgage Servicing Rights
Commercial MSRs |
Residential MSRs |
|||||||||||||
In millions |
2020 |
2019 |
2020 |
2019 |
||||||||||
January 1 |
$ |
$ |
$ |
$ |
||||||||||
Additions: |
||||||||||||||
From loans sold with servicing retained |
||||||||||||||
Purchases |
||||||||||||||
Changes in fair value due to: |
||||||||||||||
Time and payoffs (a) |
( |
) |
( |
) |
( |
) |
( |
) |
||||||
Other (b) |
( |
) |
( |
) |
( |
) |
( |
) |
||||||
June 30 |
$ |
$ |
$ |
$ |
||||||||||
Related unpaid principal balance at June 30 |
$ |
$ |
$ |
$ |
||||||||||
Servicing advances at June 30 |
$ |
$ |
$ |
$ |
||||||||||
(a) |
Represents decrease in MSR value due to passage of time, including the impact from both regularly scheduled loan principal payments and loans that were paid down or paid off during the period. |
(b) |
Represents MSR value changes resulting primarily from market-driven changes in interest rates. |
Sensitivity Analysis
The fair value of commercial and residential MSRs and significant inputs to the valuation models as of June 30, 2020 are shown in Tables 58 and 59. The expected and actual rates of mortgage loan prepayments are significant factors driving the fair value. Management uses both internal proprietary models and a third-party model to estimate future commercial mortgage loan prepayments and a third-party model to estimate future residential mortgage loan prepayments. These models have been refined based on current market conditions and management judgment. Future interest rates are another important factor in the valuation of MSRs. Management utilizes market implied forward interest rates to estimate the future direction of mortgage and discount rates. The forward rates utilized are derived from the current yield curve for U.S. dollar interest rate swaps and are consistent with pricing of capital markets instruments. Changes in the shape and slope of the forward curve in future periods may result in volatility in the fair value estimate.
A sensitivity analysis of the hypothetical effect on the fair value of MSRs to adverse changes in key assumptions is presented in Tables 58 and 59. These sensitivities do not include the impact of the related hedging activities. Changes in fair value generally cannot be extrapolated because the relationship of the change in the assumption to the change in fair value may not be linear. Also, the effect of a variation in a particular assumption on the fair value of the MSRs is calculated independently without changing any other assumption. In reality, changes in one factor may result in changes in another (e.g., changes in mortgage interest rates, which drive changes in
82 The PNC Financial Services Group, Inc. – Form 10-Q
prepayment rate estimates, could result in changes in the interest rate spread), which could either magnify or counteract the sensitivities.
The following tables set forth the fair value of commercial and residential MSRs and the sensitivity analysis of the hypothetical effect on the fair value of MSRs to immediate adverse changes of 10% and 20% in those assumptions.
Table 58: Commercial Mortgage Servicing Rights – Key Valuation Assumptions
Dollars in millions |
June 30 2020 |
December 31 2019 |
||||||
Fair value |
$ |
$ |
||||||
Weighted-average life (years) |
4.3 |
4.1 |
||||||
Weighted-average constant prepayment rate |
% |
% |
||||||
Decline in fair value from 10% adverse change |
$ |
$ |
||||||
Decline in fair value from 20% adverse change |
$ |
$ |
||||||
Effective discount rate |
% |
% |
||||||
Decline in fair value from 10% adverse change |
$ |
$ |
||||||
Decline in fair value from 20% adverse change |
$ |
$ |
||||||
Table 59: Residential Mortgage Servicing Rights – Key Valuation Assumptions
Dollars in millions |
June 30 2020 |
December 31 2019 |
||||||
Fair value |
$ |
$ |
||||||
Weighted-average life (years) |
2.9 |
5.2 |
||||||
Weighted-average constant prepayment rate |
% |
% |
||||||
Decline in fair value from 10% adverse change |
$ |
$ |
||||||
Decline in fair value from 20% adverse change |
$ |
$ |
||||||
Weighted-average option adjusted spread |
912 |
bps |
769 |
bps |
||||
Decline in fair value from 10% adverse change |
$ |
$ |
||||||
Decline in fair value from 20% adverse change |
$ |
$ |
||||||
Fees from mortgage loan servicing, which includes contractually specified servicing fees, late fees and ancillary fees were $.1 billion for the three months ended June 30, 2020 and 2019 and $.2 billion for the six months ended June 30, 2020 and 2019. We also generate servicing fees from fee-based activities provided to others for which we do not have an associated servicing asset. Fees from commercial and residential MSRs are reported within Noninterest income on our Consolidated Income Statement in Corporate services and Residential mortgage, respectively.
NOTE 7 LEASES
PNC's lessor arrangements primarily consist of operating, sales-type and direct financing leases for equipment. Lease agreements may include options to renew and for the lessee to purchase the leased equipment at the end of the lease term. Lease income from sales-type and direct financing leases is included in Loan interest income and operating lease income is included in Corporate services on our Consolidated Income Statement. For more information on lease accounting see Note 1 Accounting Policies and Note 24 Leases in our 2019 Form 10-K.
Table 60: Lessor Income
Three months ended June 30 |
Six months ended June 30 |
||||||||||||
In millions |
2020 |
2019 |
2020 |
2019 |
|||||||||
Product |
|||||||||||||
Sales-type leases and direct financing leases |
$ |
$ |
$ |
$ |
|||||||||
Operating leases |
|||||||||||||
Lessor Income |
$ |
$ |
$ |
$ |
|||||||||
The PNC Financial Services Group, Inc. – Form 10-Q 83
NOTE 8 B ORROWED FUNDS
The following table shows the carrying value of total borrowed funds of $47.0 billion at June 30, 2020 (including adjustments related to purchase accounting, accounting hedges and unamortized original issuance discounts) by remaining contractual maturity:
Table 61: Borrowed Funds
In billions |
||||
Less than 1 year |
$ |
|||
1 to 2 years |
$ |
|||
2 to 3 years |
$ |
|||
3 to 4 years |
$ |
|||
4 to 5 years |
$ |
|||
Over 5 years |
$ |
|||
The following table presents the contractual rates and maturity dates of our FHLB borrowings, senior debt and subordinated debt as of June 30, 2020, and the carrying values as of June 30, 2020 and December 31, 2019.
Table 62: FHLB Borrowings, Senior Debt and Subordinated Debt
Stated Rate |
Maturity |
Carrying Value |
||||||||||
Dollars in millions |
2020 |
2020 |
2020 |
2019 |
||||||||
Parent Company |
||||||||||||
Senior debt |
2.20%-4.38% |
2020-2030 |
$ |
$ |
||||||||
Subordinated debt |
3.90% |
2024 |
||||||||||
Junior subordinated debt |
0.92% |
2028 |
||||||||||
Subtotal |
||||||||||||
Bank |
||||||||||||
FHLB (a) |
0.43%-0.73% |
2020-2021 |
||||||||||
Senior debt |
0%-3.50% |
2020-2043 |
||||||||||
Subordinated debt |
2.70%-4.20% |
2022-2029 |
||||||||||
Subtotal |
||||||||||||
Total |
$ |
$ |
||||||||||
(a) |
FHLB borrowings are generally collateralized by residential mortgage loans, other mortgage-related loans and investment securities. |
In Table 62, the carrying values for Parent Company senior and subordinated debt include basis adjustments of $820 million and $67 million, respectively, whereas Bank senior and subordinated debt include basis adjustments of $608 million and $496 million, respectively, related to fair value accounting hedges as of June 30, 2020.
Certain borrowings are reported at fair value. Refer to Note 12 Fair Value for more information on those borrowings.
84 The PNC Financial Services Group, Inc. – Form 10-Q
NOTE 9 C OMMITMENTS
In the normal course of business, we have various commitments outstanding, certain of which are not included on our Consolidated Balance Sheet. The following table presents our outstanding commitments to extend credit along with significant other commitments as of June 30, 2020 and December 31, 2019, respectively.
In millions |
June 30 2020 |
December 31 2019 |
||||||
Commitments to extend credit |
||||||||
Total commercial lending |
$ |
$ |
||||||
Home equity lines of credit |
||||||||
Credit card |
||||||||
Other |
||||||||
Total commitments to extend credit |
||||||||
Net outstanding standby letters of credit (a) |
||||||||
Reinsurance agreements (b) |
||||||||
Standby bond purchase agreements (c) |
||||||||
Other commitments (d) |
||||||||
Total commitments to extend credit and other commitments |
$ |
$ |
||||||
(a) |
Net outstanding standby letters of credit include $ |
(b) |
Represents aggregate maximum exposure up to the specified limits of the reinsurance contracts provided by our wholly-owned captive insurance subsidiary. These amounts reflect estimates based on availability of financial information from insurance carriers. As of June 30, 2020, the aggregate maximum exposure amount was zero for accidental death and dismemberment contracts, and $ |
(c) |
We enter into standby bond purchase agreements to support municipal bond obligations. |
(d) |
Includes $ |
Commitments to Extend Credit
Commitments to extend credit, or net unfunded loan commitments, represent arrangements to lend funds or provide liquidity subject to specified contractual conditions. These commitments generally have fixed expiration dates, may require payment of a fee, and generally contain termination clauses in the event the customer’s credit quality deteriorates.
Net Outstanding Standby Letters of Credit
We issue standby letters of credit and share in the risk of standby letters of credit issued by other financial institutions, in each case to support obligations of our customers to third parties, such as insurance requirements and the facilitation of transactions involving capital markets product execution. Approximately 96 % of our net outstanding standby letters of credit were rated as Pass as of June 30, 2020, with the remainder rated as Criticized. An internal credit rating of Pass indicates the expected risk of loss is currently low, while a rating of Criticized indicates a higher degree of risk.
If the customer fails to meet its financial or performance obligation to the third party under the terms of the contract or there is a need to support a remarketing program, then upon a draw by a beneficiary, subject to the terms of the letter of credit, we would be obligated to make payment to them. The standby letters of credit outstanding on June 30, 2020 had terms ranging from less than one year to six years.
As of June 30, 2020, assets of $1.1 billion secured certain specifically identified standby letters of credit. In addition, a portion of the remaining standby letters of credit issued on behalf of specific customers is also secured by collateral or guarantees that secure the customers’ other obligations to us. The carrying amount of the liability for our obligations related to standby letters of credit and participations in standby letters of credit was $.2 billion at June 30, 2020 and is included in Other liabilities on our Consolidated Balance Sheet.
The PNC Financial Services Group, Inc. – Form 10-Q 85
NOTE 10 T OTAL EQUITY AND OTHER COMPREHENSIVE INCOME
Activity in total equity for the six months ended June 30, 2020 and 2019 is as follows.
Table 64: Rollforward of Total Equity
Shareholders’ Equity |
|||||||||||||||||||||||||||||
In millions |
Shares
Outstanding
Common
Stock
|
Common
Stock
|
Capital
Surplus -
Preferred
Stock
|
Capital
Surplus -
Common
Stock and
Other
|
Retained
Earnings
|
Accumulated
Other
Comprehensive
Income (Loss)
|
Treasury
Stock
|
Non-
controlling
Interests
|
Total Equity |
||||||||||||||||||||
Three months ended |
|||||||||||||||||||||||||||||
Balance at March 31, 2019 (a) |
$ |
$ |
$ |
$ |
$ |
( |
) |
$ |
( |
) |
$ |
$ |
|||||||||||||||||
Net income |
|||||||||||||||||||||||||||||
Other comprehensive income (loss), net of tax |
|||||||||||||||||||||||||||||
Cash dividends declared - Common |
( |
) |
( |
) |
|||||||||||||||||||||||||
Cash dividends declared - Preferred |
( |
) |
( |
) |
|||||||||||||||||||||||||
Preferred stock discount accretion |
( |
) |
|||||||||||||||||||||||||||
Common stock activity |
|||||||||||||||||||||||||||||
Treasury stock activity |
( |
) |
( |
) |
( |
) |
( |
) |
|||||||||||||||||||||
Other |
( |
) |
|||||||||||||||||||||||||||
Balance at June 30, 2019 (a) |
$ |
$ |
$ |
$ |
$ |
$ |
( |
) |
$ |
$ |
|||||||||||||||||||
Balance at March 31, 2020 (a) |
$ |
$ |
$ |
$ |
$ |
$ |
( |
) |
$ |
$ |
|||||||||||||||||||
Net income |
|||||||||||||||||||||||||||||
Other comprehensive income, net of tax |
|||||||||||||||||||||||||||||
Cash dividends declared - Common |
( |
) |
( |
) |
|||||||||||||||||||||||||
Cash dividends declared - Preferred |
( |
) |
( |
) |
|||||||||||||||||||||||||
Preferred stock discount accretion |
( |
) |
|||||||||||||||||||||||||||
Common stock activity |
|||||||||||||||||||||||||||||
Treasury stock activity |
|||||||||||||||||||||||||||||
Other |
( |
) |
( |
) |
( |
) |
|||||||||||||||||||||||
Balance at June 30, 2020 (a) |
$ |
$ |
$ |
$ |
$ |
$ |
( |
) |
$ |
$ |
|||||||||||||||||||
Six months ended |
|||||||||||||||||||||||||||||
Balance at December 31, 2018 (a) |
$ |
$ |
$ |
$ |
$ |
( |
) |
$ |
( |
) |
$ |
$ |
|||||||||||||||||
Cumulative effect of ASU 2016-02 adoption (b) |
|||||||||||||||||||||||||||||
Balance at January 1, 2019 (a) |
$ |
$ |
$ |
$ |
$ |
( |
) |
$ |
( |
) |
$ |
$ |
|||||||||||||||||
Net income |
|||||||||||||||||||||||||||||
Other comprehensive income (loss), net of tax |
|||||||||||||||||||||||||||||
Cash dividends declared - Common |
( |
) |
( |
) |
|||||||||||||||||||||||||
Cash dividends declared - Preferred |
( |
) |
( |
) |
|||||||||||||||||||||||||
Preferred stock discount accretion |
( |
) |
|||||||||||||||||||||||||||
Common stock activity |
|||||||||||||||||||||||||||||
Treasury stock activity |
( |
) |
( |
) |
( |
) |
|||||||||||||||||||||||
Other |
( |
) |
( |
) |
( |
) |
|||||||||||||||||||||||
Balance at June 30, 2019 (a) |
$ |
$ |
$ |
$ |
$ |
$ |
( |
) |
$ |
$ |
|||||||||||||||||||
Balance at December 31, 2019 (a) |
$ |
$ |
$ |
$ |
$ |
$ |
( |
) |
$ |
$ |
|||||||||||||||||||
Cumulative effect of ASU 2016-13 adoption (c) |
( |
) |
( |
) |
|||||||||||||||||||||||||
Balance at January 1, 2020 (a) |
$ |
$ |
$ |
$ |
$ |
$ |
( |
) |
$ |
$ |
|||||||||||||||||||
Net income |
|||||||||||||||||||||||||||||
Other comprehensive income, net of tax |
|||||||||||||||||||||||||||||
Cash dividends declared - Common |
( |
) |
( |
) |
|||||||||||||||||||||||||
Cash dividends declared - Preferred |
( |
) |
( |
) |
|||||||||||||||||||||||||
Preferred stock discount accretion |
( |
) |
|||||||||||||||||||||||||||
Common stock activity |
|||||||||||||||||||||||||||||
Treasury stock activity |
( |
) |
( |
) |
( |
) |
|||||||||||||||||||||||
Other |
( |
) |
( |
) |
( |
) |
|||||||||||||||||||||||
Balance at June 30, 2020 (a) |
$ |
$ |
$ |
$ |
$ |
$ |
( |
) |
$ |
$ |
|||||||||||||||||||
(a) |
The par value of our preferred stock outstanding was less than $ |
(b) |
Represents the cumulative effect of adopting ASU 2016-02 - Leases related primarily to deferred gains on previous sale-leaseback transactions. See the Recently Adopted Accounting Standards portion of Note 1 Accounting Policies in our 2019 Form 10-K for additional detail.
|
(c) |
86 The PNC Financial Services Group, Inc. – Form 10-Q
Other Comprehensive Income
Details of other comprehensive income (loss) are as follows:
Table 65: Other Comprehensive Income (Loss)
Three months ended June 30 |
Six months ended June 30 |
||||||||||||||
In millions |
2020 |
2019 |
2020 |
2019 |
|||||||||||
Net unrealized gains (losses) on securities without an allowance for credit losses |
|||||||||||||||
Increase in net unrealized gains (losses) on securities |
$ |
$ |
|||||||||||||
Less: Net gains (losses) realized as a yield adjustment reclassified to investment securities interest income |
|||||||||||||||
Less: Net gains (losses) realized on sales of securities reclassified to noninterest income |
|||||||||||||||
Net increase (decrease), pre-tax |
|||||||||||||||
Effect of income taxes |
( |
) |
( |
) |
|||||||||||
Net increase (decrease), after-tax |
|||||||||||||||
Net unrealized gains (losses) on securities with an allowance for credit losses |
|||||||||||||||
Increase in net unrealized gains (losses) on securities |
( |
) |
( |
) |
|||||||||||
Net increase (decrease), pre-tax |
( |
) |
( |
) |
|||||||||||
Effect of income taxes |
|||||||||||||||
Net increase (decrease), after-tax |
( |
) |
( |
) |
|||||||||||
Net unrealized gains (losses) on non-OTTI securities |
|||||||||||||||
Increase in net unrealized gains (losses) on non-OTTI securities |
$ |
$ |
|||||||||||||
Less: Net gains (losses) realized as a yield adjustment reclassified to investment securities interest income |
|||||||||||||||
Less: Net gains (losses) realized on sales of securities reclassified to noninterest income |
|||||||||||||||
Net increase (decrease), pre-tax |
|||||||||||||||
Effect of income taxes |
( |
) |
( |
) |
|||||||||||
Net increase (decrease), after-tax |
|||||||||||||||
Net unrealized gains (losses) on OTTI securities |
|||||||||||||||
Increase in net unrealized gains (losses) on OTTI securities |
|||||||||||||||
Net increase (decrease), pre-tax |
|||||||||||||||
Effect of income taxes |
( |
) |
|||||||||||||
Net increase (decrease), after-tax |
|||||||||||||||
Net unrealized gains (losses) on cash flow hedge derivatives |
|||||||||||||||
Increase in net unrealized gains (losses) on cash flow hedge derivatives |
|||||||||||||||
Less: Net gains (losses) realized as a yield adjustment reclassified to loan interest income |
( |
) |
( |
) |
|||||||||||
Less: Net gains (losses) realized as a yield adjustment reclassified to investment securities interest income |
|||||||||||||||
Less: Net gains (losses) realized on sales of securities reclassified to noninterest income |
|||||||||||||||
Net increase (decrease), pre-tax |
|||||||||||||||
Effect of income taxes |
( |
) |
( |
) |
( |
) |
( |
) |
|||||||
Net increase (decrease), after-tax |
|||||||||||||||
Pension and other postretirement benefit plan adjustments |
|||||||||||||||
Net pension and other postretirement benefit activity |
( |
) |
( |
) |
( |
) |
|||||||||
Amortization of actuarial loss (gain) reclassified to other noninterest expense |
|||||||||||||||
Amortization of prior service cost (credit) reclassified to other noninterest expense |
|||||||||||||||
Net increase (decrease), pre-tax |
( |
) |
( |
) |
( |
) |
|||||||||
Effect of income taxes |
( |
) |
|||||||||||||
Net increase (decrease), after-tax |
( |
) |
( |
) |
( |
) |
|||||||||
Other |
|||||||||||||||
Net investment hedge derivatives |
|||||||||||||||
Foreign currency translation adjustments and other |
( |
) |
( |
) |
( |
) |
( |
) |
|||||||
Net increase (decrease), pre-tax |
|||||||||||||||
Effect of income taxes |
( |
) |
( |
) |
( |
) |
( |
) |
|||||||
Net increase (decrease), after-tax |
( |
) |
( |
) |
|||||||||||
Total other comprehensive income (loss) from continuing operations, pre-tax |
|||||||||||||||
Total other comprehensive income (loss) from continuing operations, tax effect |
( |
) |
( |
) |
( |
) |
( |
) |
|||||||
Total other comprehensive income (loss) from continuing operations, after-tax |
$ |
$ |
$ |
$ |
|||||||||||
Total other comprehensive income (loss) from discontinued operations, after-tax |
( |
) |
( |
) |
|||||||||||
Total other comprehensive income (loss), after-tax |
$ |
$ |
$ |
$ |
|||||||||||
The PNC Financial Services Group, Inc. – Form 10-Q 87
Table 66: Accumulated Other Comprehensive Income (Loss) Components
In millions, after-tax |
Net unrealized gains (losses) on non-OTTI securities |
Net unrealized gains (losses) on OTTI securities |
Net unrealized gains (losses) on cash flow hedge derivatives |
Pension and other postretirement benefit plan adjustments |
Other |
Accumulated other Comprehensive Income from Continuing Operations |
Accumulated other Comprehensive Income from Discontinued Operations |
Total |
|||||||||||||||||||||||
Three months ended |
|||||||||||||||||||||||||||||||
Balance at March 31, 2019 |
$ |
$ |
$ |
$ |
( |
) |
$ |
( |
) |
$ |
$ |
( |
) |
$ |
( |
) |
|||||||||||||||
Net activity |
( |
) |
( |
) |
( |
) |
|||||||||||||||||||||||||
Balance at June 30, 2019 |
$ |
$ |
$ |
$ |
( |
) |
$ |
( |
) |
$ |
$ |
( |
) |
$ |
|||||||||||||||||
Six months ended |
|||||||||||||||||||||||||||||||
Balance at December 31, 2018 |
$ |
( |
) |
$ |
$ |
$ |
( |
) |
$ |
( |
) |
$ |
( |
) |
$ |
( |
) |
$ |
( |
) |
|||||||||||
Net activity |
( |
) |
|||||||||||||||||||||||||||||
Balance at June 30, 2019 |
$ |
$ |
$ |
$ |
( |
) |
$ |
( |
) |
$ |
$ |
( |
) |
$ |
|||||||||||||||||
In millions, after-tax |
Net unrealized gains (losses) on securities without an Allowance |
Net unrealized gains (losses) on securities with an Allowance |
Net unrealized gains (losses) on cash flow hedge derivatives |
Pension and other postretirement benefit plan adjustments |
Other |
Accumulated other Comprehensive Income from Continuing Operations |
Accumulated other Comprehensive Income from Discontinued Operations |
Total |
|||||||||||||||||||||||
Three months ended |
|||||||||||||||||||||||||||||||
Balance at March 31, 2020 |
$ |
$ |
( |
) |
$ |
$ |
( |
) |
$ |
( |
) |
$ |
$ |
( |
) |
$ |
|||||||||||||||
Net activity |
( |
) |
( |
) |
|||||||||||||||||||||||||||
Balance at June 30, 2020 |
$ |
$ |
( |
) |
$ |
$ |
( |
) |
$ |
( |
) |
$ |
$ |
||||||||||||||||||
Six months ended |
|||||||||||||||||||||||||||||||
Balance at December 31, 2019 |
$ |
$ |
$ |
$ |
( |
) |
$ |
( |
) |
$ |
$ |
( |
) |
$ |
|||||||||||||||||
Cumulative effect of ASU 2016-03 adoption (a) |
( |
) |
|||||||||||||||||||||||||||||
Balance at January 1, 2020 |
$ |
$ |
$ |
( |
) |
$ |
( |
) |
$ |
$ |
( |
) |
$ |
||||||||||||||||||
Net activity |
$ |
( |
) |
( |
) |
( |
) |
||||||||||||||||||||||||
Balance at June 30, 2020 |
$ |
$ |
( |
) |
$ |
$ |
( |
) |
$ |
( |
) |
$ |
$ |
||||||||||||||||||
(a) |
The following table provides the dividends per share for PNC's common and preferred stock.
Table 67: Dividends Per Share (a)
Three months ended June 30 |
Six months ended June 30 |
|||||||||||
2020 |
2019 |
2020 |
2019 |
|||||||||
Common Stock |
$ |
$ |
$ |
$ |
||||||||
Preferred Stock |
||||||||||||
Series B |
$ |
$ |
$ |
$ |
||||||||
Series O |
$ |
$ |
||||||||||
Series P |
$ |
$ |
$ |
$ |
||||||||
Series Q |
$ |
$ |
$ |
$ |
||||||||
Series R |
$ |
$ |
$ |
$ |
||||||||
Series S |
$ |
$ |
$ |
$ |
||||||||
(a) Dividends are payable quarterly other than Series O, Series R, and Series S preferred stock, which are payable semiannually, with the Series O payable in different quarters
from the Series R and Series S preferred stock
The PNC board of directors declared a quarterly cash dividend on common stock payable on August 5, 2020 of $1.15 per share, consistent with the second quarter dividend paid on May 5, 2020.
88 The PNC Financial Services Group, Inc. – Form 10-Q
NOTE 11 E ARNINGS PER SHARE
Table 68: Basic and Diluted Earnings Per Common Share
Three months ended June 30 |
Six months ended June 30 |
||||||||||||||||
In millions, except per share data |
2020 |
2019 |
2020 |
2019 |
|||||||||||||
Basic |
|||||||||||||||||
Net income (loss) from continuing operations |
$ |
( |
) |
$ |
$ |
$ |
|||||||||||
Less: |
|||||||||||||||||
Net income attributable to noncontrolling interests |
|||||||||||||||||
Preferred stock dividends |
|||||||||||||||||
Preferred stock discount accretion and redemptions |
|||||||||||||||||
Net income (loss) from continuing operations attributable to common shareholders |
( |
) |
( |
) |
|||||||||||||
Less: Dividends and undistributed earnings allocated to nonvested restricted shares |
|||||||||||||||||
Net income (loss) from continuing operations attributable to basic common shareholders |
$ |
( |
) |
$ |
$ |
( |
) |
$ |
|||||||||
Net income from discontinued operations attributable to common shareholders |
|||||||||||||||||
Less: Undistributed earnings allocated to nonvested restricted shares |
$ |
$ |
$ |
$ |
|||||||||||||
Net income from discontinued operations attributable to basic common shareholders |
|||||||||||||||||
Basic weighted-average common shares outstanding |
|||||||||||||||||
Basic earnings (loss) per common share from continuing operations (a) |
$ |
( |
) |
$ |
$ |
( |
) |
$ |
|||||||||
Basic earnings per common share from discontinued operations (a) |
$ |
$ |
$ |
$ |
|||||||||||||
Basic earnings per common share (b) |
$ |
$ |
$ |
$ |
|||||||||||||
Diluted |
|||||||||||||||||
Net income (loss) from continuing operations attributable to diluted common shareholders |
$ |
( |
) |
$ |
$ |
( |
) |
$ |
|||||||||
Net income from discontinued operations attributable to basic common shareholders |
|||||||||||||||||
Less: Impact of earnings per share dilution from discontinued operations |
|||||||||||||||||
Net income from discontinued operations attributable to diluted common shareholders |
$ |
$ |
$ |
$ |
|||||||||||||
Basic weighted-average common shares outstanding |
|||||||||||||||||
Dilutive potential common shares (c) |
|||||||||||||||||
Diluted weighted-average common shares outstanding |
|||||||||||||||||
Diluted earnings (loss) per common share from continuing operations (a) |
$ |
( |
) |
$ |
$ |
( |
) |
$ |
|||||||||
Diluted earnings per common share from discontinued operations (a) |
$ |
$ |
$ |
$ |
|||||||||||||
Diluted earnings per common share (b) |
$ |
$ |
$ |
$ |
|||||||||||||
(a) |
Basic and diluted earnings per share under the two-class method are determined on net income reported on the income statement less earnings allocated to nonvested restricted shares and restricted share units with nonforfeitable dividends and dividend rights (participating securities). |
(b) |
See Note 1 Accounting Policies in the Notes to Consolidated Financial Statements of this Report for additional information on our policy for not allocating losses to participating securities. |
(c) |
See Note 1 Accounting Policies in the Notes to Consolidated Financial Statements of this Report for additional information on our policy for not including potential dilutive shares in the diluted EPS calculations when a loss from continuing operations exists. |
NOTE 12 F AIR VALUE
Fair Value Measurement
We measure certain financial assets and liabilities at fair value. Fair value is defined as the price that would be received to sell an asset or the price that would be paid to transfer a liability on the measurement date, and is determined using an exit price in the principal or most advantageous market for the asset or liability in an orderly transaction between market participants. The fair value hierarchy established by GAAP requires us to maximize the use of observable inputs when measuring fair value. For more information regarding the fair value hierarchy, see Note 6 Fair Value in our 2019 Form 10-K.
The PNC Financial Services Group, Inc. – Form 10-Q 89
Assets and Liabilities Measured at Fair Value on a Recurring Basis
For more information on the valuation methodologies used to measure assets and liabilities at fair value on a recurring basis, see Note 6 Fair Value in our 2019 Form 10-K. The following table summarizes our assets and liabilities measured at fair value on a recurring basis, including instruments for which we have elected the fair value option.
Table 69: Fair Value Measurements – Recurring Basis Summary
June 30, 2020 |
December 31, 2019 |
||||||||||||||||||||||||||||||||
In millions |
Level 1 |
Level 2 |
Level 3 |
Total
Fair Value
|
Level 1 |
Level 2 |
Level 3 |
Total
Fair Value
|
|||||||||||||||||||||||||
Assets |
|||||||||||||||||||||||||||||||||
Residential mortgage loans held for sale |
$ |
$ |
$ |
$ |
$ |
$ |
|||||||||||||||||||||||||||
Commercial mortgage loans held for sale |
|||||||||||||||||||||||||||||||||
Securities available for sale |
|||||||||||||||||||||||||||||||||
U.S. Treasury and government agencies |
$ |
$ |
|||||||||||||||||||||||||||||||
Residential mortgage-backed |
|||||||||||||||||||||||||||||||||
Agency |
|||||||||||||||||||||||||||||||||
Non-agency |
|||||||||||||||||||||||||||||||||
Commercial mortgage-backed |
|||||||||||||||||||||||||||||||||
Agency |
|||||||||||||||||||||||||||||||||
Non-agency |
|||||||||||||||||||||||||||||||||
Asset-backed |
|||||||||||||||||||||||||||||||||
Other |
|||||||||||||||||||||||||||||||||
Total securities available for sale |
|||||||||||||||||||||||||||||||||
Loans |
|||||||||||||||||||||||||||||||||
Equity investments (a) |
|||||||||||||||||||||||||||||||||
Residential mortgage servicing rights |
|||||||||||||||||||||||||||||||||
Commercial mortgage servicing rights |
|||||||||||||||||||||||||||||||||
Trading securities (b) |
|||||||||||||||||||||||||||||||||
Financial derivatives (b) (c) |
|||||||||||||||||||||||||||||||||
Other assets |
|||||||||||||||||||||||||||||||||
Total assets (d) |
$ |
$ |
$ |
$ |
$ |
$ |
$ |
$ |
|||||||||||||||||||||||||
Liabilities |
|||||||||||||||||||||||||||||||||
Other borrowed funds |
$ |
$ |
$ |
$ |
$ |
$ |
$ |
$ |
|||||||||||||||||||||||||
Financial derivatives (c) (e) |
|||||||||||||||||||||||||||||||||
Other liabilities |
|||||||||||||||||||||||||||||||||
Total liabilities (f) |
$ |
$ |
$ |
$ |
$ |
$ |
$ |
$ |
|||||||||||||||||||||||||
(a) |
Certain investments that are measured at fair value using the net asset value (NAV) per share (or its equivalent) practical expedient have not been classified in the fair value hierarchy. |
(b) |
Included in Other assets on the Consolidated Balance Sheet. |
(c) |
Amounts at June 30, 2020 and December 31, 2019 are presented gross and are not reduced by the impact of legally enforceable master netting agreements that allow us to net positive and negative positions and cash collateral held or placed with the same counterparty. See Note 13 Financial Derivatives for additional information related to derivative offsetting.
|
(d) |
Total assets at fair value as a percentage of total consolidated assets was |
(e) |
Included in Other liabilities on the Consolidated Balance Sheet. |
(f) |
Total liabilities at fair value as a percentage of total consolidated liabilities was |
90 The PNC Financial Services Group, Inc. – Form 10-Q
Reconciliations of assets and liabilities measured at fair value on a recurring basis using Level 3 inputs for the three and six months ended June 30, 2020 and 2019 follow:
Table 70: Reconciliation of Level 3 Assets and Liabilities
Three Months Ended June 30, 2020
Total realized / unrealized gains or losses for the period (a) |
Unrealized gains / losses on assets and liabilities held on Consolidated Balance Sheet at June 30, 2020 (a) (c) |
||||||||||||||||||||||||||||||||||||
Level 3 Instruments Only In millions |
Fair Value Mar. 31, 2020 |
Included in Earnings |
Included in Other comprehensive income (b) |
Purchases |
Sales |
Issuances |
Settlements |
Transfers into Level 3 |
Transfers out of Level 3 |
Fair Value June 30, 2020 |
|||||||||||||||||||||||||||
Assets |
|||||||||||||||||||||||||||||||||||||
Residential mortgage loans held for sale |
$ |
$ |
$ |
( |
) |
$ |
( |
) |
$ |
$ |
|||||||||||||||||||||||||||
Commercial mortgage loans held for sale |
|||||||||||||||||||||||||||||||||||||
Securities available for sale |
|||||||||||||||||||||||||||||||||||||
Residential mortgage- backed non-agency |
$ |
$ |
( |
) |
|||||||||||||||||||||||||||||||||
Commercial mortgage- backed non-agency |
|||||||||||||||||||||||||||||||||||||
Asset-backed |
( |
) |
|||||||||||||||||||||||||||||||||||
Other |
( |
) |
|||||||||||||||||||||||||||||||||||
Total securities available for sale |
( |
) |
|||||||||||||||||||||||||||||||||||
Loans |
( |
) |
( |
) |
( |
) |
(e) |
$ |
|||||||||||||||||||||||||||||
Equity investments |
( |
) |
( |
) |
( |
) |
|||||||||||||||||||||||||||||||
Residential mortgage servicing rights |
( |
) |
$ |
( |
) |
( |
) |
||||||||||||||||||||||||||||||
Commercial mortgage servicing rights |
( |
) |
|||||||||||||||||||||||||||||||||||
Trading securities |
|||||||||||||||||||||||||||||||||||||
Financial derivatives |
( |
) |
|||||||||||||||||||||||||||||||||||
Other assets |
|||||||||||||||||||||||||||||||||||||
Total assets |
$ |
$ |
( |
) |
$ |
$ |
$ |
( |
) |
$ |
$ |
( |
) |
$ |
$ |
( |
) |
$ |
$ |
( |
) |
||||||||||||||||
Liabilities |
|||||||||||||||||||||||||||||||||||||
Other borrowed funds |
$ |
$ |
$ |
( |
) |
$ |
|||||||||||||||||||||||||||||||
Financial derivatives |
$ |
$ |
( |
) |
$ |
||||||||||||||||||||||||||||||||
Other liabilities |
( |
) |
$ |
( |
) |
||||||||||||||||||||||||||||||||
Total liabilities |
$ |
$ |
$ |
$ |
$ |
( |
) |
$ |
$ |
$ |
|||||||||||||||||||||||||||
Net gains (losses) |
$ |
( |
) |
(f) |
$ |
( |
) |
(g) |
|||||||||||||||||||||||||||||
The PNC Financial Services Group, Inc. – Form 10-Q 91
Three Months Ended June 30, 2019
Total realized / unrealized gains or losses for the period (a) |
Unrealized gains/losses on assets and liabilities held on Consolidated Balance Sheet at June 30, 2019 (a) (c) |
|||||||||||||||||||||||||||||||||||
Level 3 Instruments Only In millions |
Fair Value Mar. 31, 2019 |
Included in Earnings |
Included in Other comprehensive income (b) |
Purchases |
Sales |
Issuances |
Settlements |
Transfers into Level 3 |
Transfers out of Level 3 |
Fair Value June 30, 2019 |
||||||||||||||||||||||||||
Assets |
||||||||||||||||||||||||||||||||||||
Residential mortgage loans held for sale |
$ |
$ |
$ |
$ |
( |
) |
(e) |
$ |
||||||||||||||||||||||||||||
Commercial mortgage loans held for sale |
$ |
$ |
( |
) |
$ |
|||||||||||||||||||||||||||||||
Securities available for sale |
||||||||||||||||||||||||||||||||||||
Residential mortgage- backed non-agency |
$ |
( |
) |
|||||||||||||||||||||||||||||||||
Asset-backed |
( |
) |
||||||||||||||||||||||||||||||||||
Other |
( |
) |
$ |
( |
) |
( |
) |
|||||||||||||||||||||||||||||
Total securities available for sale |
( |
) |
( |
) |
||||||||||||||||||||||||||||||||
Loans |
( |
) |
$ |
( |
) |
( |
) |
( |
) |
(e) |
||||||||||||||||||||||||||
Equity investments |
( |
) |
||||||||||||||||||||||||||||||||||
Residential mortgage servicing rights |
( |
) |
( |
) |
( |
) |
||||||||||||||||||||||||||||||
Commercial mortgage servicing rights |
( |
) |
( |
) |
( |
) |
||||||||||||||||||||||||||||||
Trading securities |
( |
) |
||||||||||||||||||||||||||||||||||
Financial derivatives |
( |
) |
( |
) |
||||||||||||||||||||||||||||||||
Other assets |
||||||||||||||||||||||||||||||||||||
Total assets |
$ |
$ |
( |
) |
$ |
$ |
$ |
( |
) |
$ |
$ |
( |
) |
$ |
$ |
( |
) |
$ |
$ |
( |
) |
|||||||||||||||
Liabilities |
||||||||||||||||||||||||||||||||||||
Other borrowed funds |
$ |
$ |
$ |
( |
) |
$ |
||||||||||||||||||||||||||||||
Financial derivatives |
$ |
$ |
( |
) |
( |
) |
$ |
|||||||||||||||||||||||||||||
Other liabilities |
( |
) |
||||||||||||||||||||||||||||||||||
Total liabilities |
$ |
$ |
$ |
$ |
$ |
( |
) |
$ |
$ |
|||||||||||||||||||||||||||
Net gains (losses) |
$ |
( |
) |
(f) |
$ |
( |
) |
(g) |
||||||||||||||||||||||||||||
92 The PNC Financial Services Group, Inc. – Form 10-Q
(continued from previous page)
Six Months Ended June 30, 2020
Total realized / unrealized gains or losses for the period (a) |
Unrealized gains / losses on assets and liabilities held on Consolidated Balance Sheet at June 30, 2020 (a) (c) |
||||||||||||||||||||||||||||||||||||
|
Level 3 Instruments Only
In millions
|
Fair Value Dec. 31, 2019 |
Included in Earnings |
Included in Other comprehensive income (b) |
Purchases |
Sales |
Issuances |
Settlements |
Transfers into Level 3 |
Transfers out of Level 3 |
Fair Value June 30, 2020 |
|||||||||||||||||||||||||||
Assets |
|||||||||||||||||||||||||||||||||||||
Residential mortgage loans held for sale |
$ |
$ |
$ |
( |
) |
$ |
( |
) |
$ |
$ |
( |
) |
(e) |
$ |
|||||||||||||||||||||||
Commercial mortgage loans held for sale |
$ |
( |
) |
( |
) |
$ |
( |
) |
|||||||||||||||||||||||||||||
Securities available for sale |
|||||||||||||||||||||||||||||||||||||
Residential mortgage- backed non-agency |
$ |
( |
) |
( |
) |
||||||||||||||||||||||||||||||||
Commercial mortgage- backed non-agency |
|||||||||||||||||||||||||||||||||||||
Asset-backed |
( |
) |
( |
) |
|||||||||||||||||||||||||||||||||
Other |
( |
) |
( |
) |
|||||||||||||||||||||||||||||||||
Total securities available for sale |
( |
) |
( |
) |
|||||||||||||||||||||||||||||||||
Loans |
( |
) |
(d) |
( |
) |
(e) |
|||||||||||||||||||||||||||||||
Equity investments |
( |
) |
( |
) |
( |
) |
|||||||||||||||||||||||||||||||
Residential mortgage servicing rights |
( |
) |
$ |
( |
) |
( |
) |
||||||||||||||||||||||||||||||
Commercial mortgage servicing rights |
( |
) |
( |
) |
( |
) |
|||||||||||||||||||||||||||||||
Trading securities |
|||||||||||||||||||||||||||||||||||||
Financial derivatives |
( |
) |
|||||||||||||||||||||||||||||||||||
Other assets |
|||||||||||||||||||||||||||||||||||||
Total assets |
$ |
$ |
( |
) |
$ |
( |
) |
$ |
$ |
( |
) |
$ |
$ |
( |
) |
$ |
$ |
( |
) |
$ |
$ |
( |
) |
||||||||||||||
Liabilities |
|||||||||||||||||||||||||||||||||||||
Other borrowed funds |
$ |
$ |
$ |
( |
) |
$ |
|||||||||||||||||||||||||||||||
Financial derivatives |
$ |
$ |
( |
) |
$ |
||||||||||||||||||||||||||||||||
Other liabilities |
( |
) |
$ |
( |
) |
||||||||||||||||||||||||||||||||
Total liabilities |
$ |
$ |
$ |
$ |
$ |
( |
) |
$ |
$ |
$ |
|||||||||||||||||||||||||||
Net gains (losses) |
$ |
( |
) |
(f) |
$ |
( |
) |
(g) |
|||||||||||||||||||||||||||||
The PNC Financial Services Group, Inc. – Form 10-Q 93
Six Months Ended June 30, 2019
Total realized / unrealized gains or losses for the period (a) |
Unrealized gains/losses on assets and liabilities held on Consolidated Balance Sheet at June 30, 2019 (a) (c) |
|||||||||||||||||||||||||||||||||||
|
Level 3 Instruments Only
In millions
|
Fair Value Dec. 31, 2018 |
Included in Earnings |
Included in Other comprehensive income (b) |
Purchases |
Sales |
Issuances |
Settlements |
Transfers into Level 3 |
Transfers out of Level 3 |
Fair Value June 30, 2019 |
||||||||||||||||||||||||||
Assets |
||||||||||||||||||||||||||||||||||||
Residential mortgage loans held for sale |
$ |
$ |
$ |
( |
) |
$ |
$ |
( |
) |
(e) |
$ |
|||||||||||||||||||||||||
Commercial mortgage loans held for sale |
$ |
$ |
( |
) |
$ |
|||||||||||||||||||||||||||||||
Securities available for sale |
||||||||||||||||||||||||||||||||||||
Residential mortgage- backed non-agency |
$ |
( |
) |
|||||||||||||||||||||||||||||||||
Asset-backed |
( |
) |
||||||||||||||||||||||||||||||||||
Other |
( |
) |
( |
) |
( |
) |
||||||||||||||||||||||||||||||
Total securities available for sale |
( |
) |
( |
) |
||||||||||||||||||||||||||||||||
Loans |
( |
) |
$ |
( |
) |
( |
) |
( |
) |
(e) |
||||||||||||||||||||||||||
Equity investments |
( |
) |
||||||||||||||||||||||||||||||||||
Residential mortgage servicing rights |
( |
) |
( |
) |
( |
) |
||||||||||||||||||||||||||||||
Commercial mortgage servicing rights |
( |
) |
( |
) |
( |
) |
||||||||||||||||||||||||||||||
Trading securities |
( |
) |
||||||||||||||||||||||||||||||||||
Financial derivatives |
( |
) |
( |
) |
||||||||||||||||||||||||||||||||
Other assets |
( |
) |
||||||||||||||||||||||||||||||||||
Total assets |
$ |
$ |
( |
) |
$ |
$ |
$ |
( |
) |
$ |
$ |
( |
) |
$ |
$ |
( |
) |
$ |
$ |
( |
) |
|||||||||||||||
Liabilities |
||||||||||||||||||||||||||||||||||||
Other borrowed funds |
$ |
$ |
$ |
( |
) |
$ |
||||||||||||||||||||||||||||||
Financial derivatives |
$ |
$ |
( |
) |
$ |
|||||||||||||||||||||||||||||||
Other liabilities |
( |
) |
||||||||||||||||||||||||||||||||||
Total liabilities |
$ |
$ |
$ |
$ |
$ |
( |
) |
$ |
$ |
|||||||||||||||||||||||||||
Net gains (losses) |
$ |
( |
) |
(f) |
$ |
( |
) |
(g) |
||||||||||||||||||||||||||||
(a) |
Losses for assets are bracketed while losses for liabilities are not. |
(b) |
The difference in unrealized gains and losses for the period included in Other comprehensive income and changes in unrealized gains and losses for the period included in Other comprehensive income for securities available for sale held at the end of the reporting period were not significant. |
(c) |
The amount of the total gains or losses for the period included in earnings that is attributable to the change in unrealized gains or losses related to those assets and liabilities held at the end of the reporting period. |
(d) |
Upon adoption of ASU 2016-13 - Credit Losses, we discontinued the accounting for purchased impaired loans and elected the one-time fair value option election for some of these loans and certain nonperforming loans.
|
(e) |
Residential mortgage loan transfers out of Level 3 are primarily driven by residential mortgage loans transferring to OREO as well as reclassification of mortgage loans held for sale to held for investment. |
(f) |
Net gains (losses) realized and unrealized included in earnings related to Level 3 assets and liabilities included amortization and accretion. The amortization and accretion amounts were included in Interest income on the Consolidated Income Statement and the remaining net gains (losses) realized and unrealized were included in Noninterest income on the Consolidated Income Statement. |
(g) |
Net unrealized gains (losses) related to assets and liabilities held at the end of the reporting period were included in Noninterest income on the Consolidated Income Statement. |
An instrument’s categorization within the hierarchy is based on the lowest level of input that is significant to the fair value measurement. Changes from one quarter to the next related to the observability of inputs to a fair value measurement may result in a reclassification (transfer) of assets or liabilities between hierarchy levels.
94 The PNC Financial Services Group, Inc. – Form 10-Q
Quantitative information about the significant unobservable inputs within Level 3 recurring assets and liabilities follows:
Table 71: Fair Value Measurements – Recurring Quantitative Information
June 30, 2020
|
Level 3 Instruments Only
Dollars in millions
|
Fair Value |
Valuation Techniques |
Unobservable Inputs |
Range (Weighted-Average) (a) |
||
Commercial mortgage loans held for sale |
$ |
Discounted cash flow |
Spread over the benchmark curve (b) |
630bps - 3,870bps (2,444bps) |
||
Residential mortgage-backed non-agency securities |
Priced by a third-party vendor using a discounted cash flow pricing model |
Constant prepayment rate |
1.0% - 37.6% (8.6%) |
|||
Constant default rate |
0.0% - 15.9% (4.7%) |
|||||
Loss severity |
25.0% - 95.7% (48.6%) |
|||||
Spread over the benchmark curve (b) |
327bps weighted-average |
|||||
Asset-backed securities |
Priced by a third-party vendor using a discounted cash flow pricing model |
Constant prepayment rate |
1.0% - 22.0% (7.5%) |
|||
Constant default rate |
1.0% - 7.2% (3.3%) |
|||||
Loss severity |
30.0% - 100.0% (58.9%) |
|||||
Spread over the benchmark curve (b) |
433bps weighted-average |
|||||
Loans - Residential real estate |
Consensus pricing (c) |
Cumulative default rate |
3.6% - 100.0% (78.4%) |
|||
Loss severity |
0.0% - 100.0% (12.7%) |
|||||
Discount rate |
4.8% - 6.8% (5.3%) |
|||||
Discounted cash flow |
Loss severity |
8.0% weighted-average |
||||
Discount rate |
3.3% weighted-average |
|||||
Loans - Home equity |
Consensus pricing (c) |
Cumulative default rate |
3.6% - 100.0% (91.4%) |
|||
Loss severity |
0.0% - 99.4% (37.1%) |
|||||
Discount rate |
4.8% - 6.8% (6.3%) |
|||||
Consensus pricing (c) |
Credit and liquidity discount |
17.1% - 97.0% (57.4%) |
||||
Equity investments |
Multiple of adjusted earnings |
Multiple of earnings |
5.0x - 16.5x (8.5x) |
|||
Residential mortgage servicing rights |
Discounted cash flow |
Constant prepayment rate |
0.0% - 65.2% (27.6%) |
|||
Spread over the benchmark curve (b) |
331bps - 3,793bps (912bps) |
|||||
Commercial mortgage servicing rights |
Discounted cash flow |
Constant prepayment rate |
3.8% - 22.1% (4.8%) |
|||
Discount rate |
4.0% - 8.0% (7.4%) |
|||||
Financial derivatives - Swaps related to sales of certain Visa Class B common shares |
( |
) |
Discounted cash flow |
Estimated conversion factor of Visa Class B shares into Class A shares |
162.3% weighted-average |
|
Estimated annual growth rate of Visa Class A share price |
16.0% |
|||||
Estimated length of litigation resolution date |
Q2 2021 |
|||||
Insignificant Level 3 assets, net of liabilities (d) |
||||||
Total Level 3 assets, net of liabilities (e) |
$ |
|||||
The PNC Financial Services Group, Inc. – Form 10-Q 95
December 31, 2019
|
Level 3 Instruments Only
Dollars in millions
|
Fair Value |
Valuation Techniques |
Unobservable Inputs |
Range (Weighted-Average) (a) |
||
Commercial mortgage loans held for sale |
$ |
Discounted cash flow |
Spread over the benchmark curve (b) |
530bps - 2,935bps (1,889bps) |
||
Residential mortgage-backed non-agency securities |
Priced by a third-party vendor using a discounted cash flow pricing model |
Constant prepayment rate |
1.0% - 36.2% (9.9%) |
|||
Constant default rate |
0.0% - 14.1% (4.3%) |
|||||
Loss severity |
26.6% - 95.7% (51.9%) |
|||||
Spread over the benchmark curve (b) |
188bps weighted-average |
|||||
Asset-backed securities |
Priced by a third-party vendor using a discounted cash flow pricing model |
Constant prepayment rate |
1.0% - 22.0% (7.5%) |
|||
Constant default rate |
1.0% - 7.2% (3.4%) |
|||||
Loss severity |
30.0% - 100.0% (57.6%) |
|||||
Spread over the benchmark curve (b) |
215bps weighted-average |
|||||
Loans |
Consensus pricing (c) |
Cumulative default rate |
3.6% - 100.0% (76.7%) |
|||
Loss severity |
0.0% - 100.0% (14.5%) |
|||||
Discount rate |
5.0% - 8.0% (5.2%) |
|||||
Discounted cash flow |
Loss severity |
8.0% weighted-average |
||||
Discount rate |
4.8% weighted-average |
|||||
Consensus pricing (c) |
Credit and Liquidity discount |
0.0% - 99.0% (63.4%) |
||||
Equity investments |
Multiple of adjusted earnings |
Multiple of earnings |
5.0x - 16.5x (8.5x) |
|||
Residential mortgage servicing rights |
Discounted cash flow |
Constant prepayment rate |
0.0% - 53.8% (13.5%) |
|||
Spread over the benchmark curve (b) |
320bps - 1,435bps (769bps) |
|||||
Commercial mortgage servicing rights |
Discounted cash flow |
Constant prepayment rate |
3.5% - 18.1% (4.6%) |
|||
Discount rate |
5.6% - 8.1% (7.9%) |
|||||
Financial derivatives - Swaps related to sales of certain Visa Class B common shares |
( |
) |
Discounted cash flow |
Estimated conversion factor of Visa Class B shares into Class A shares |
162.3% weighted-average |
|
Estimated annual growth rate of Visa Class A share price |
16.0% |
|||||
Estimated length of litigation resolution date |
Q1 2021 |
|||||
Insignificant Level 3 assets, net of liabilities (d) |
( |
) |
||||
Total Level 3 assets, net of liabilities (e) |
$ |
|||||
(a) |
Unobservable inputs were weighted by the relative fair value of the instruments. |
(b) |
The assumed yield spread over the benchmark curve for each instrument is generally intended to incorporate non-interest rate risks, such as credit and liquidity risks. |
(c) |
Consensus pricing refers to fair value estimates that are generally internally developed using information such as dealer quotes or other third-party provided valuations or comparable asset prices. |
(d) |
Represents the aggregate amount of Level 3 assets and liabilities measured at fair value on a recurring basis that are individually and in the aggregate insignificant. The amount includes certain financial derivative assets and liabilities, trading securities, other securities, residential mortgage loans held for sale, other assets, other borrowed funds and other liabilities. |
(e) |
Consisted of total Level 3 assets of $ |
Financial Assets Accounted for at Fair Value on a Nonrecurring Basis
We may be required to measure certain financial assets at fair value on a nonrecurring basis. These adjustments to fair value usually result from the application of lower of amortized cost or fair value accounting or write-downs of individual assets due to impairment and are included in Table 72. For more information regarding the valuation methodologies of our financial assets measured at fair value on a nonrecurring basis, see Note 6 Fair Value in our 2019 Form 10-K.
Table 72: Fair Value Measurements – Nonrecurring (a) (b) (c)
Fair Value |
Gains (Losses)
Three months ended
|
Gains (Losses) Six months ended |
||||||||||||||||||||||
In millions |
June 30 2020 |
December 31 2019 |
June 30 2020 |
June 30 2019 |
June 30 2020 |
June 30 2019 |
||||||||||||||||||
Assets |
||||||||||||||||||||||||
Nonaccrual loans |
$ |
$ |
$ |
( |
) |
$ |
( |
) |
$ |
( |
) |
$ |
( |
) |
||||||||||
OREO and foreclosed assets |
( |
) |
( |
) |
( |
) |
( |
) |
||||||||||||||||
Long-lived assets |
( |
) |
( |
) |
( |
) |
( |
) |
||||||||||||||||
Total assets |
$ |
$ |
$ |
( |
) |
$ |
( |
) |
$ |
( |
) |
$ |
( |
) |
||||||||||
(a) |
All Level 3 for the periods presented. |
(b) |
Valuation techniques applied were fair value of property or collateral. |
(c) |
Unobservable inputs used were appraised value/sales price, broker opinions or projected income/required improvement costs. Additional quantitative information was not meaningful for the periods presented. |
96 The PNC Financial Services Group, Inc. – Form 10-Q
Financial Instruments Accounted for under Fair Value Option
We elect the fair value option to account for certain financial instruments. For more information on these financial instruments for which the fair value option election has been made, see Note 6 Fair Value in our 2019 Form 10-K.
Fair values and aggregate unpaid principal balances of certain items for which we elected the fair value option follow:
Table 73: Fair Value Option – Fair Value and Principal Balances
June 30, 2020 |
December 31, 2019 |
|||||||||||||||||||||||
In millions |
Fair Value |
Aggregate Unpaid
Principal Balance
|
Difference |
Fair Value |
Aggregate Unpaid
Principal Balance
|
Difference |
||||||||||||||||||
Assets |
||||||||||||||||||||||||
Residential mortgage loans held for sale |
||||||||||||||||||||||||
Accruing loans less than 90 days past due |
$ |
$ |
$ |
$ |
$ |
$ |
||||||||||||||||||
Accruing loans 90 days or more past due |
||||||||||||||||||||||||
Nonaccrual loans |
( |
) |
||||||||||||||||||||||
Total |
$ |
$ |
$ |
$ |
$ |
$ |
||||||||||||||||||
Commercial mortgage loans held for sale (a) |
||||||||||||||||||||||||
Accruing loans less than 90 days past due |
$ |
$ |
$ |
( |
) |
$ |
$ |
$ |
( |
) |
||||||||||||||
Nonaccrual loans |
( |
) |
||||||||||||||||||||||
Total |
$ |
$ |
$ |
( |
) |
$ |
$ |
$ |
( |
) |
||||||||||||||
Loans |
||||||||||||||||||||||||
Accruing loans less than 90 days past due |
$ |
$ |
$ |
( |
) |
$ |
$ |
$ |
( |
) |
||||||||||||||
Accruing loans 90 days or more past due |
( |
) |
( |
) |
||||||||||||||||||||
Nonaccrual loans |
( |
) |
( |
) |
||||||||||||||||||||
Total |
$ |
$ |
$ |
( |
) |
$ |
$ |
$ |
( |
) |
||||||||||||||
Other assets |
$ |
$ |
$ |
$ |
$ |
$ |
||||||||||||||||||
Liabilities |
||||||||||||||||||||||||
Other borrowed funds |
$ |
$ |
$ |
$ |
$ |
( |
) |
|||||||||||||||||
(a) |
There were no accruing loans 90 days or more past due within this category at June 30, 2020 or December 31, 2019.
|
The changes in fair value for items for which we elected the fair value option are as follows:
Table 74: Fair Value Option – Changes in Fair Value (a)
Gains (Losses) |
Gains (Losses) |
|||||||||||||||
Three months ended |
Six months ended |
|||||||||||||||
June 30 |
June 30 |
June 30 |
June 30 |
|||||||||||||
In millions |
2020 |
2019 |
2020 |
2019 |
||||||||||||
Assets |
||||||||||||||||
Residential mortgage loans held for sale |
$ |
$ |
$ |
$ |
||||||||||||
Commercial mortgage loans held for sale |
$ |
$ |
$ |
$ |
||||||||||||
Loans |
$ |
$ |
$ |
$ |
||||||||||||
Other assets |
$ |
$ |
$ |
( |
) |
$ |
||||||||||
(a) |
The impact on earnings of offsetting hedged items or hedging instruments is not reflected in these amounts. |
Additional Fair Value Information Related to Financial Instruments Not Recorded at Fair Value
The following table presents the carrying amounts and estimated fair values, as well as the level within the fair value hierarchy, of all other financial instruments that are not recorded on our Consolidated Balance Sheet at fair value as of June 30, 2020 and December 31, 2019. For more information regarding the methods and assumptions used to estimate the fair values of financial instruments included in Table 75, see Note 6 Fair Value in our 2019 Form 10-K.
The PNC Financial Services Group, Inc. – Form 10-Q 97
Table 75: Additional Fair Value Information Related to Other Financial Instruments
Carrying |
Fair Value |
|||||||||||||||||||
In millions |
Amount |
Total |
Level 1 |
Level 2 |
Level 3 |
|||||||||||||||
June 30, 2020 |
||||||||||||||||||||
Assets |
||||||||||||||||||||
Cash and due from banks |
$ |
$ |
$ |
|||||||||||||||||
Interest-earning deposits with banks |
$ |
|||||||||||||||||||
Securities held to maturity |
$ |
|||||||||||||||||||
Net loans (excludes leases) |
||||||||||||||||||||
Other assets |
||||||||||||||||||||
Total assets |
$ |
$ |
$ |
$ |
$ |
|||||||||||||||
Liabilities |
||||||||||||||||||||
Time deposits |
$ |
$ |
$ |
|||||||||||||||||
Borrowed funds |
$ |
|||||||||||||||||||
Unfunded lending related commitments |
||||||||||||||||||||
Other liabilities |
||||||||||||||||||||
Total liabilities |
$ |
$ |
$ |
$ |
||||||||||||||||
December 31, 2019 |
||||||||||||||||||||
Assets |
||||||||||||||||||||
Cash and due from banks |
$ |
$ |
$ |
|||||||||||||||||
Interest-earning deposits with banks |
$ |
|||||||||||||||||||
Securities held to maturity |
$ |
|||||||||||||||||||
Net loans (excludes leases) |
||||||||||||||||||||
Other assets |
||||||||||||||||||||
Total assets |
$ |
$ |
$ |
$ |
$ |
|||||||||||||||
Liabilities |
||||||||||||||||||||
Time deposits |
$ |
$ |
$ |
|||||||||||||||||
Borrowed funds |
$ |
|||||||||||||||||||
Unfunded lending related commitments |
||||||||||||||||||||
Other liabilities |
||||||||||||||||||||
Total liabilities |
$ |
$ |
$ |
$ |
||||||||||||||||
The aggregate fair values in Table 75 represent only a portion of the total market value of our assets and liabilities as, in accordance with the guidance related to fair values about financial instruments, we exclude the following:
• |
financial instruments recorded at fair value on a recurring basis (as they are disclosed in Table 69);
|
• |
investments accounted for under the equity method; |
• |
equity securities without a readily determinable fair value that apply for the alternative measurement approach to fair value under ASU 2016-01; |
• |
real and personal property; |
• |
lease financing; |
• |
loan customer relationships; |
• |
deposit customer intangibles; |
• |
mortgage servicing rights (MSRs); |
• |
retail branch networks; |
• |
fee-based businesses, such as asset management and brokerage; |
• |
trademarks and brand names; |
• |
trade receivables and payables due in one year or less; and |
• |
deposit liabilities with no defined or contractual maturities under ASU 2016-01. |
98 The PNC Financial Services Group, Inc. – Form 10-Q
NOTE 13 F INANCIAL DERIVATIVES
We use a variety of financial derivatives to both mitigate exposure to market (primarily interest rate) and credit risk inherent in our business activities, as well as, to facilitate customer risk management activities. We manage these risks as part of our overall asset and liability management process and through our credit policies and procedures. Derivatives represent contracts between parties that usually require little or no initial net investment and result in one party delivering cash or another type of asset to the other party based on a notional amount and an underlying as specified in the contract.
Derivative transactions are often measured in terms of notional amount, but this amount is generally not exchanged and it is not recorded on the balance sheet. The notional amount is the basis to which the underlying is applied to determine required payments under the derivative contract. The underlying is a referenced interest rate (commonly LIBOR), security price, credit spread or other index. Residential and commercial real estate loan commitments associated with loans to be sold also qualify as derivative instruments.
For more information regarding derivatives see Note 1 Accounting Policies and Note 13 Financial Derivatives in our 2019 Form 10-K.
The PNC Financial Services Group, Inc. – Form 10-Q 99
The following table presents the notional amounts and gross fair values of all derivative assets and liabilities held by us.
Table 76: Total Gross Derivatives (a)
June 30, 2020 |
December 31, 2019 |
|||||||||||||||||
In millions |
Notional /
Contract Amount
|
Asset Fair
Value (b)
|
Liability Fair
Value (c)
|
Notional /
Contract Amount
|
Asset Fair
Value (b)
|
Liability Fair
Value (c)
|
||||||||||||
Derivatives used for hedging |
||||||||||||||||||
Interest rate contracts (d): |
||||||||||||||||||
Fair value hedges |
$ |
$ |
||||||||||||||||
Cash flow hedges |
$ |
$ |
||||||||||||||||
Foreign exchange contracts: |
||||||||||||||||||
Net investment hedges |
$ |
|||||||||||||||||
Total derivatives designated for hedging |
$ |
$ |
$ |
$ |
$ |
|||||||||||||
Derivatives not used for hedging |
||||||||||||||||||
Derivatives used for mortgage banking activities (e): |
||||||||||||||||||
Interest rate contracts: |
||||||||||||||||||
Swaps |
$ |
$ |
$ |
|||||||||||||||
Futures (f) |
||||||||||||||||||
Mortgage-backed commitments |
$ |
$ |
$ |
|||||||||||||||
Other |
||||||||||||||||||
Total interest rate contracts |
||||||||||||||||||
Derivatives used for customer-related activities: |
||||||||||||||||||
Interest rate contracts: |
||||||||||||||||||
Swaps |
||||||||||||||||||
Futures (f) |
||||||||||||||||||
Mortgage-backed commitments |
||||||||||||||||||
Other |
||||||||||||||||||
Total interest rate contracts |
||||||||||||||||||
Commodity contracts: |
||||||||||||||||||
Swaps |
||||||||||||||||||
Other |
||||||||||||||||||
Total commodity contracts |
||||||||||||||||||
Foreign exchange contracts and other |
||||||||||||||||||
Total derivatives for customer-related activities |
||||||||||||||||||
Derivatives used for other risk management activities: |
||||||||||||||||||
Foreign exchange contracts and other |
||||||||||||||||||
Total derivatives not designated for hedging |
$ |
$ |
$ |
$ |
$ |
$ |
||||||||||||
Total gross derivatives |
$ |
$ |
$ |
$ |
$ |
$ |
||||||||||||
Less: Impact of legally enforceable master netting agreements |
||||||||||||||||||
Less: Cash collateral received/paid |
||||||||||||||||||
Total derivatives |
$ |
$ |
$ |
$ |
||||||||||||||
(a) |
Centrally cleared derivatives are settled in cash daily and result in no derivative asset or derivative liability being recognized on our Consolidated Balance Sheet.
|
(b) |
Included in Other assets on our Consolidated Balance Sheet. |
(c) |
Included in Other liabilities on our Consolidated Balance Sheet. |
(d) |
Represents primarily swaps. |
(e) |
Includes both residential and commercial mortgage banking activities. |
(f) |
Futures contracts settle in cash daily and, therefore, no derivative asset or derivative liability is recognized on our Consolidated Balance Sheet. |
All derivatives are carried on our Consolidated Balance Sheet at fair value. Derivative balances are presented on the Consolidated Balance Sheet on a net basis taking into consideration the effects of legally enforceable master netting agreements and, when appropriate, any related cash collateral exchanged with counterparties. Further discussion regarding the offsetting rights associated with these legally enforceable master netting agreements is included in the Offsetting, Counterparty Credit Risk and Contingent Features section of this Note 13. Any nonperformance risk, including credit risk, is included in the determination of the estimated net fair value of the derivatives.
100 The PNC Financial Services Group, Inc. – Form 10-Q
Derivatives Designated As Hedging Instruments
Certain derivatives used to manage interest rate and foreign exchange risk as part of our asset and liability risk management activities are designated as accounting hedges. Derivatives hedging the risks associated with changes in the fair value of assets or liabilities are considered fair value hedges, derivatives hedging the variability of expected future cash flows are considered cash flow hedges, and derivatives hedging a net investment in a foreign subsidiary are considered net investment hedges. Designating derivatives as accounting hedges allows for gains and losses on those derivatives to be recognized in the same period and in the same income statement line item as the earnings impact of the hedged items.
Fair Value Hedges
We enter into receive-fixed, pay-variable interest rate swaps to hedge changes in the fair value of outstanding fixed-rate debt caused by fluctuations in market interest rates. We also enter into pay-fixed, receive-variable interest rate swaps and zero-coupon swaps to hedge changes in the fair value of fixed rate and zero-coupon investment securities caused by fluctuations in market interest rates. Gains and losses on the interest rate swaps designated in these hedge relationships, along with the offsetting gains and losses on the hedged items attributable to the hedged risk, are recognized in current earnings within the same income statement line item.
Cash Flow Hedges
We enter into receive-fixed, pay-variable interest rate swaps to modify the interest rate characteristics of designated commercial loans from variable to fixed in order to reduce the impact of changes in future cash flows due to market interest rate changes. We also periodically enter into forward purchase and sale contracts to hedge the variability of the consideration that will be paid or received related to the purchase or sale of investment securities. The forecasted purchase or sale is consummated upon gross settlement of the forward contract itself. For these cash flow hedges, gains and losses on the interest rate swaps and forward contracts are recorded in AOCI and are then reclassified into earnings in the same period the hedged cash flows affect earnings and within the same income statement line as the hedged cash flows.
In the 12 months that follow June 30, 2020, we expect to reclassify net derivative gains of $471 million pretax, or $372 million after-tax, from AOCI to interest income for both cash flow hedge strategies. This reclassified amount could differ from amounts actually recognized due to changes in interest rates, hedge de-designations and the addition of other hedges subsequent to June 30, 2020. As of June 30, 2020, the maximum length of time over which forecasted transactions are hedged is ten years.
The PNC Financial Services Group, Inc. – Form 10-Q 101
Further detail regarding gains (losses) related to our fair value and cash flow hedge derivatives is presented in the following table.
Table 77: Gains (Losses) Recognized on Fair Value and Cash Flow Hedges in the Consolidated Income Statement (a) (b)
Location and Amount of Gains (Losses) Recognized in Income |
||||||||||||
Interest Income |
Interest Expense |
Noninterest Income |
||||||||||
In millions |
Loans |
Investment Securities |
Borrowed Funds |
Other |
||||||||
For the three months ended June 30, 2020 |
||||||||||||
Total amounts on the Consolidated Income Statement |
$ |
$ |
$ |
$ |
||||||||
Gains (losses) on fair value hedges recognized on: |
||||||||||||
Hedged items (c) |
$ |
$ |
( |
) |
||||||||
Derivatives |
$ |
( |
) |
$ |
||||||||
Amounts related to interest settlements on derivatives |
$ |
( |
) |
$ |
||||||||
Gains (losses) on cash flow hedges (d): |
||||||||||||
Amount of derivative gains (losses) reclassified from AOCI |
$ |
$ |
||||||||||
For the three months ended June 30, 2019 |
||||||||||||
Total amounts on the Consolidated Income Statement |
$ |
$ |
$ |
$ |
||||||||
Gains (losses) on fair value hedges recognized on: |
||||||||||||
Hedged items (c) |
$ |
$ |
( |
) |
||||||||
Derivatives |
$ |
( |
) |
$ |
||||||||
Amounts related to interest settlements on derivatives |
$ |
$ |
||||||||||
Gains (losses) on cash flow hedges (d): |
||||||||||||
Amount of derivative gains (losses) reclassified from AOCI |
$ |
( |
) |
$ |
$ |
|||||||
For the six months ended June 30, 2020 |
||||||||||||
Total amounts on the Consolidated Income Statement |
$ |
$ |
$ |
$ |
||||||||
Gains (losses) on fair value hedges recognized on: |
||||||||||||
Hedged items (c) |
$ |
$ |
( |
) |
||||||||
Derivatives |
$ |
( |
) |
$ |
||||||||
Amounts related to interest settlements on derivatives |
$ |
( |
) |
$ |
||||||||
Gains (losses) on cash flow hedges (d): |
||||||||||||
Amount of derivative gains (losses) reclassified from AOCI |
$ |
$ |
$ |
|||||||||
For the six months ended June 30, 2019 |
||||||||||||
Total amounts on the Consolidated Income Statement |
$ |
$ |
$ |
$ |
||||||||
Gains (losses) on fair value hedges recognized on: |
||||||||||||
Hedged items (c) |
$ |
$ |
( |
) |
||||||||
Derivatives |
$ |
( |
) |
$ |
||||||||
Amounts related to interest settlements on derivatives |
$ |
$ |
||||||||||
Gains (losses) on cash flow hedges (d): |
||||||||||||
Amount of derivative gains (losses) reclassified from AOCI |
$ |
( |
) |
$ |
$ |
|||||||
(a) |
For all periods presented, there were no components of derivative gains or losses excluded from the assessment of hedge effectiveness for any of the fair value or cash flow hedge strategies. |
(b) |
All cash flow and fair value hedge derivatives were interest rate contracts for the periods presented. |
(c) |
Includes an insignificant amount of fair value hedge adjustments related to discontinued hedge relationships. |
(d) |
Detail regarding the impact of fair value hedge accounting on the carrying value of the hedged items is presented in the following table.
Table 78: Hedged Items - Fair Value Hedges
June 30, 2020 |
December 31, 2019 |
|||||||||||||||
In millions |
Carrying Value of the Hedged Items |
Cumulative Fair Value Hedge Adjustment included in the Carrying Value of Hedged Items (a) |
Carrying Value of the Hedged Items |
Cumulative Fair Value Hedge Adjustment included in the Carrying Value of Hedged Items (a) |
||||||||||||
Investment securities - available for sale (b) |
$ |
$ |
$ |
$ |
||||||||||||
Borrowed funds |
$ |
$ |
$ |
$ |
||||||||||||
(a) |
Includes $( |
(b) |
Carrying value shown represents amortized cost. |
102 The PNC Financial Services Group, Inc. – Form 10-Q
Net Investment Hedges
We enter into foreign currency forward contracts to hedge non-U.S. dollar net investments in foreign subsidiaries against adverse changes in foreign exchange rates. We assess whether the hedging relationship is highly effective in achieving offsetting changes in the value of the hedge and hedged item by qualitatively verifying that the critical terms of the hedge and hedged item match at the inception of the hedging relationship and on an ongoing basis. Net investment hedge derivatives are classified as foreign exchange contracts. There were no components of derivative gains or losses excluded from the assessment of the hedge effectiveness for all periods presented. Gains on net investment hedge derivatives recognized in OCI were $5 million and $80 million for the three and six months ended June 30, 2020, respectively, compared with $32 million and $14 million for the three and six months ended June 30, 2019, respectively.
Derivatives Not Designated As Hedging Instruments
For additional information on derivatives not designated as hedging instruments under GAAP, see Note 13 Financial Derivatives in our 2019 Form 10-K.
Further detail regarding the gains (losses) on derivatives not designated in hedging relationships is presented in the following table.
Table 79: Gains (Losses) on Derivatives Not Designated for Hedging
Three months ended June 30 |
Six months ended June 30 |
||||||||||||
In millions |
2020 |
2019 |
2020 |
2019 |
|||||||||
Derivatives used for mortgage banking activities: |
|||||||||||||
Interest rate contracts (a) |
$ |
$ |
$ |
$ |
|||||||||
Derivatives used for customer-related activities: |
|||||||||||||
Interest rate contracts |
|||||||||||||
Foreign exchange contracts and other (b) |
|||||||||||||
Gains (losses) from customer-related activities (c) |
|||||||||||||
Derivatives used for other risk management activities: |
|||||||||||||
Foreign exchange contracts and other (c) |
( |
) |
( |
) |
( |
) |
|||||||
Total gains (losses) from derivatives not designated as hedging instruments |
$ |
$ |
$ |
$ |
|||||||||
(a) |
Included in Residential mortgage, Corporate services and Other noninterest income on our Consolidated Income Statement. |
(b) |
Includes an insignificant amount of gains (losses) on commodity contracts for all periods presented. |
(c) |
Included in Other noninterest income on our Consolidated Income Statement. |
Offsetting, Counterparty Credit Risk and Contingent Features
We generally utilize a net presentation on the Consolidated Balance Sheet for those derivative financial instruments entered into with counterparties under legally enforceable master netting agreements. The master netting agreements reduce credit risk by permitting the closeout netting of all outstanding derivative instruments under the master netting agreement with the same counterparty upon the occurrence of an event of default. The master netting agreement also may require the exchange of cash or marketable securities to collateralize either party’s net position. For additional information on derivative offsetting, counterparty credit risk and contingent features, see Note 13 Financial Derivatives in our 2019 Form 10-K.
Table 80 shows the impact legally enforceable master netting agreements had on our derivative assets and derivative liabilities as of June 30, 2020 and December 31, 2019. The table includes cash collateral held or pledged under legally enforceable master netting agreements. The table also includes the fair value of any securities collateral held or pledged under legally enforceable master netting agreements. Cash and securities collateral amounts are included in the table only to the extent of the related net derivative fair values.
The PNC Financial Services Group, Inc. – Form 10-Q 103
Table 80: Derivative Assets and Liabilities Offsetting
In millions |
Amounts Offset on the
Consolidated Balance Sheet
|
Securities Collateral Held/Pledged Under Master Netting Agreements |
|||||||||||||||||||||||||
|
Gross
Fair Value
|
Fair Value
Offset Amount
|
Cash
Collateral
|
Net
Fair Value
|
Net Amounts |
|||||||||||||||||||||||
June 30, 2020 |
|||||||||||||||||||||||||||
Derivative assets |
|||||||||||||||||||||||||||
Interest rate contracts: |
|||||||||||||||||||||||||||
Over-the-counter cleared |
$ |
$ |
$ |
||||||||||||||||||||||||
Over-the-counter |
$ |
$ |
$ |
||||||||||||||||||||||||
Commodity contracts |
|||||||||||||||||||||||||||
Foreign exchange and other contracts |
|||||||||||||||||||||||||||
Total derivative assets |
$ |
$ |
$ |
$ |
(a) |
$ |
$ |
||||||||||||||||||||
Derivative liabilities |
|||||||||||||||||||||||||||
Interest rate contracts: |
|||||||||||||||||||||||||||
Over-the-counter cleared |
$ |
$ |
$ |
||||||||||||||||||||||||
Over-the-counter |
$ |
$ |
|||||||||||||||||||||||||
Commodity contracts |
|||||||||||||||||||||||||||
Foreign exchange and other contracts |
|||||||||||||||||||||||||||
Total derivative liabilities |
$ |
$ |
$ |
$ |
(b) |
$ |
|||||||||||||||||||||
December 31, 2019 |
|||||||||||||||||||||||||||
Derivative assets |
|||||||||||||||||||||||||||
Interest rate contracts: |
|||||||||||||||||||||||||||
Over-the-counter cleared |
$ |
$ |
$ |
||||||||||||||||||||||||
Over-the-counter |
$ |
$ |
$ |
||||||||||||||||||||||||
Commodity contracts |
|||||||||||||||||||||||||||
Foreign exchange and other contracts |
|||||||||||||||||||||||||||
Total derivative assets |
$ |
$ |
$ |
$ |
(a) |
$ |
$ |
||||||||||||||||||||
Derivative liabilities |
|||||||||||||||||||||||||||
Interest rate contracts: |
|||||||||||||||||||||||||||
Over-the-counter cleared |
$ |
$ |
$ |
||||||||||||||||||||||||
Over-the-counter |
$ |
$ |
|||||||||||||||||||||||||
Commodity contracts |
|||||||||||||||||||||||||||
Foreign exchange and other contracts |
|||||||||||||||||||||||||||
Total derivative liabilities |
$ |
$ |
$ |
$ |
(b) |
$ |
|||||||||||||||||||||
(a) |
Represents the net amount of derivative assets included in Other assets on our Consolidated Balance Sheet. |
(b) |
Represents the net amount of derivative liabilities included in Other liabilities on our Consolidated Balance Sheet. |
In addition to using master netting agreements and other collateral agreements to reduce credit risk associated with derivative instruments, we also seek to manage credit risk by evaluating credit ratings of counterparties and by using internal credit analysis, limits and monitoring procedures.
At June 30, 2020, we held cash, U.S. government securities and mortgage-backed securities totaling $2.7 billion under master netting agreements and other collateral agreements to collateralize net derivative assets due from counterparties, and we pledged cash totaling $2.0 billion under these agreements to collateralize net derivative liabilities owed to counterparties and to meet initial margin requirements. These totals may differ from the amounts presented in the preceding offsetting table because these totals may include collateral exchanged under an agreement that does not qualify as a master netting agreement or because the total amount of collateral held or pledged exceeds the net derivative fair values with the counterparty as of the balance sheet date due to timing or other factors, such as initial margin. To the extent not netted against the derivative fair values under a master netting agreement, the receivable for cash pledged is included in Other assets and the obligation for cash held is included in Other liabilities on our Consolidated Balance Sheet. Securities held from counterparties are not recognized on our balance sheet. Likewise securities we have pledged to counterparties remain on our balance sheet.
104 The PNC Financial Services Group, Inc. – Form 10-Q
Certain derivative agreements contain various credit-risk related contingent provisions, such as those that require our debt to maintain a specified credit rating from one or more of the major credit rating agencies. If our debt ratings were to fall below such specified ratings, the counterparties to the derivative instruments could request immediate payment or demand immediate and ongoing full collateralization on derivative instruments in net liability positions. The aggregate fair value of all derivative instruments with credit-risk-related contingent features that were in a net liability position on June 30, 2020 was $3.1 billion for which we had posted collateral of $2.5 billion in the normal course of business. The maximum additional amount of collateral we would have been required to post if the credit-risk-related contingent features underlying these agreements had been triggered on June 30, 2020 would be $.6 billion.
NOTE 14 L EGAL PROCEEDINGS
We establish accruals for legal proceedings, including litigation and regulatory and governmental investigations and inquiries, when information related to the loss contingencies represented by those matters indicates both that a loss is probable and that the amount of loss can be reasonably estimated. Any such accruals are adjusted thereafter as appropriate to reflect changed circumstances. When we are able to do so, we also determine estimates of possible losses or ranges of possible losses, whether in excess of any related accrued liability or where there is no accrued liability, for disclosed legal proceedings (“Disclosed Matters,” which are those matters disclosed in Note 19 Legal Proceedings in Part II, Item 8 of our 2019 Form 10-K and in Note 13 Legal Proceedings in Part I, Item 1 of our first quarter 2020 Form 10-Q (such prior disclosure referred to as “Prior Disclosure”)). For Disclosed Matters where we are able to estimate such possible losses or ranges of possible losses, as of June 30, 2020, we estimate that it is reasonably possible that we could incur losses in excess of related accrued liabilities, if any, in an aggregate amount less than $100 million. The estimates included in this amount are based on our analysis of currently available information and are subject to significant judgment and a variety of assumptions and uncertainties. As new information is obtained we may change our estimates. Due to the inherent subjectivity of the assessments and unpredictability of outcomes of legal proceedings, any amounts accrued or included in this aggregate amount may not represent the ultimate loss to us from the legal proceedings in question. Thus, our exposure and ultimate losses may be higher, and possibly significantly so, than the amounts accrued or this aggregate amount.
As a result of the types of factors described in Note 19 in our 2019 Form 10-K, we are unable, at this time, to estimate the losses that are reasonably possible to be incurred or ranges of such losses with respect to some of the matters disclosed, and the aggregate estimated amount provided above does not include an estimate for every Disclosed Matter. Therefore, as the estimated aggregate amount disclosed above does not include all of the Disclosed Matters, the amount disclosed above does not represent our maximum reasonably possible loss exposure for all of the Disclosed Matters. The estimated aggregate amount also does not reflect any of our exposure to matters not so disclosed, as discussed below under “Other.”
We include in some of the descriptions of individual Disclosed Matters certain quantitative information related to the plaintiff’s claim against us as alleged in the plaintiff’s pleadings or other public filings or otherwise publicly available information. While information of this type may provide insight into the potential magnitude of a matter, it does not necessarily represent our estimate of reasonably possible loss or our judgment as to any currently appropriate accrual.
Some of our exposure in Disclosed Matters may be offset by applicable insurance coverage. We do not consider the possible availability of insurance coverage in determining the amounts of any accruals (although we record the amount of related insurance recoveries that are deemed probable up to the amount of the accrual) or in determining any estimates of possible losses or ranges of possible losses.
Other Regulatory and Governmental Inquiries
We are the subject of investigations, audits, examinations and other forms of regulatory and governmental inquiry covering a broad range of issues in our consumer, mortgage, brokerage, securities and other financial services businesses, as well as other aspects of our operations. In some cases, these inquiries are part of reviews of specified activities at multiple industry participants; in others, they are directed at PNC individually. From time to time, these inquiries, including those described in Prior Disclosure, may involve or lead to regulatory enforcement actions and other administrative proceedings, and may lead to civil or criminal judicial proceedings. Some of these inquiries result in remedies including fines, penalties, restitution, or alterations in our business practices, and in additional expenses and collateral costs and other consequences. Such remedies and other consequences typically have not been material to us from a financial standpoint, but could be in the future. Even if not financially material, they may result in significant reputational harm or other adverse consequences.
Our practice is to cooperate fully with regulatory and governmental investigations, audits and other inquiries, including those described in Prior Disclosure.
Other
In addition to the proceedings or other matters described in Prior Disclosure, PNC and persons to whom we may have indemnification obligations, in the normal course of business, are subject to various other pending and threatened legal proceedings in which claims for
The PNC Financial Services Group, Inc. – Form 10-Q 105
monetary damages and other relief are asserted. We do not anticipate, at the present time, that the ultimate aggregate liability, if any, arising out of such other legal proceedings will have a material adverse effect on our financial position. However, we cannot now determine whether or not any claims asserted against us or others to whom we may have indemnification obligations, whether in the proceedings or other matters described above or otherwise, will have a material adverse effect on our results of operations in any future reporting period, which will depend on, among other things, the amount of the loss resulting from the claim and the amount of income otherwise reported for the reporting period.
NOTE 15 S EGMENT REPORTING
We have three reportable business segments:
• |
Retail Banking |
• |
Corporate & Institutional Banking |
• |
Asset Management Group |
Results of individual businesses are presented based on our internal management reporting practices. There is no comprehensive, authoritative body of guidance for management accounting equivalent to GAAP; therefore, the financial results of our individual businesses are not necessarily comparable with similar information for any other company. We periodically refine our internal methodologies as management reporting practices are enhanced. To the extent significant and practicable, retrospective application of new methodologies is made to prior period reportable business segment results and disclosures to create comparability with the current period.
During the second quarter, we divested our entire 22.4% investment in BlackRock. See Note 2 Discontinued Operations for additional information on the sale and details on our results and cash flows for the three and six months ended June 30, 2020 and 2019. Following the sale and donation, PNC and its affiliates only hold shares of BlackRock stock in a fiduciary capacity for clients of PNC and its affiliates.
Total business segment financial results differ from total consolidated net income. These differences are reflected in the “Other” category in the business segment tables. “Other” includes residual activities that do not meet the criteria for disclosure as a separate reportable business, such as asset and liability management activities including net securities gains or losses, other-than-temporary impairment of investment securities, certain trading activities, certain runoff consumer loan portfolios, private equity investments, intercompany eliminations, certain corporate overhead, tax adjustments that are not allocated to business segments, exited businesses and differences between business segment performance reporting and financial statement reporting (GAAP), including the presentation of net income attributable to noncontrolling interests as the segments’ results exclude their portion of net income attributable to noncontrolling interests. The “Other” category also includes our BlackRock held for sale asset. Assets, revenue and earnings attributable to foreign activities were not material in the period presented for comparison.
Financial results are presented, to the extent practicable, as if each business operated on a stand-alone basis. Additionally, we have aggregated the results for corporate support functions within “Other” for financial reporting purposes.
Net interest income in business segment results reflects our internal funds transfer pricing methodology. Assets receive a funding charge and liabilities and capital receive a funding credit based on a transfer pricing methodology that incorporates product repricing characteristics, tenor and other factors.
We have allocated the ALLL and the allowance for unfunded lending related commitments based on the loan exposures within each business segment’s portfolio. Key reserve assumptions and estimation processes react to and are influenced by observed changes in loan portfolio performance experience, the financial strength of the borrower and economic conditions. Key reserve assumptions are periodically updated.
106 The PNC Financial Services Group, Inc. – Form 10-Q
Business Segment Results
Table 81: Results of Businesses
Three months ended June 30 In millions |
Retail Banking |
Corporate & Institutional Banking |
Asset Management Group |
Other |
Consolidated (a) |
|||||||||||||||
2020 |
||||||||||||||||||||
Income Statement |
||||||||||||||||||||
Net interest income |
$ |
$ |
$ |
$ |
( |
) |
$ |
|||||||||||||
Noninterest income |
||||||||||||||||||||
Total revenue |
||||||||||||||||||||
Provision for credit losses |
||||||||||||||||||||
Depreciation and amortization |
||||||||||||||||||||
Other noninterest expense |
||||||||||||||||||||
|
Income (loss) from continuing operations before income taxes (benefit) and
noncontrolling interests
|
( |
) |
( |
) |
( |
) |
( |
) |
||||||||||||
Income taxes (benefit) |
( |
) |
( |
) |
( |
) |
||||||||||||||
Net income (loss) from continuing operations |
$ |
( |
) |
$ |
( |
) |
$ |
$ |
( |
) |
$ |
( |
) |
|||||||
Average Assets |
$ |
$ |
$ |
$ |
$ |
|||||||||||||||
2019 |
||||||||||||||||||||
Income Statement |
||||||||||||||||||||
Net interest income |
$ |
$ |
$ |
$ |
$ |
|||||||||||||||
Noninterest income |
||||||||||||||||||||
Total revenue |
||||||||||||||||||||
Provision for credit losses (benefit)
|
( |
) |
||||||||||||||||||
Depreciation and amortization |
||||||||||||||||||||
Other noninterest expense |
||||||||||||||||||||
Income from continuing operations before income taxes (benefit) and noncontrolling interests |
||||||||||||||||||||
Income taxes (benefit) |
( |
) |
||||||||||||||||||
Net income from continuing operations |
$ |
$ |
$ |
$ |
$ |
|||||||||||||||
Average Assets |
$ |
$ |
$ |
$ |
$ |
|||||||||||||||
Six months ended June 30 In millions |
Retail Banking |
Corporate & Institutional Banking |
Asset Management Group |
Other |
Consolidated (a) |
|||||||||||||||
2020 |
||||||||||||||||||||
Income Statement |
||||||||||||||||||||
Net interest income |
$ |
$ |
$ |
$ |
$ |
|||||||||||||||
Noninterest income |
||||||||||||||||||||
Total revenue |
||||||||||||||||||||
Provision for credit losses |
||||||||||||||||||||
Depreciation and amortization |
||||||||||||||||||||
Other noninterest expense |
( |
) |
||||||||||||||||||
Income (loss) from continuing operations before income taxes (benefit) and noncontrolling interests |
( |
) |
( |
) |
( |
) |
( |
) |
||||||||||||
Income taxes (benefit) |
( |
) |
( |
) |
( |
) |
( |
) |
||||||||||||
Net income (loss) from continuing operations |
$ |
( |
) |
$ |
$ |
$ |
( |
) |
$ |
|||||||||||
Average Assets |
$ |
$ |
$ |
$ |
$ |
|||||||||||||||
2019 |
||||||||||||||||||||
Income Statement |
||||||||||||||||||||
Net interest income |
$ |
$ |
$ |
$ |
$ |
|||||||||||||||
Noninterest income |
||||||||||||||||||||
Total revenue |
||||||||||||||||||||
Provision for credit losses (benefit) |
( |
) |
( |
) |
||||||||||||||||
Depreciation and amortization |
||||||||||||||||||||
Other noninterest expense |
||||||||||||||||||||
Income from continuing operations before income taxes (benefit) and noncontrolling interests |
||||||||||||||||||||
Income taxes (benefit) |
( |
) |
||||||||||||||||||
Net income from continuing operations |
$ |
$ |
$ |
$ |
$ |
|||||||||||||||
Average Assets |
$ |
$ |
$ |
$ |
$ |
|||||||||||||||
(a) |
There were no material intersegment revenues for the three and six months ended June 30, 2020 and 2019.
|
The PNC Financial Services Group, Inc. – Form 10-Q 107
Retail Banking provides deposit, lending, brokerage, insurance services, investment management and cash management products and services to consumer and small business customers. Our customers are serviced through our branch network, ATMs, call centers, online banking and mobile channels. The branch network is located primarily in markets across the Mid-Atlantic, Midwest and Southeast. In 2018, Retail Banking launched its national expansion strategy designed to grow customers with digitally-led banking and an ultra-thin branch network in markets outside of our existing retail branch network. Deposit products include checking, savings and money market accounts and certificates of deposit. Lending products include residential mortgages, home equity loans and lines of credit, auto loans, credit cards, education loans and personal and small business loans and lines of credit. The residential mortgage loans are directly originated within our branch network and nationwide, and are typically underwritten to agency and/or third-party standards, and either sold, servicing retained, or held on our balance sheet. Brokerage, investment management and cash management products and services include managed, education, retirement and trust accounts.
Corporate & Institutional Banking provides lending, treasury management and capital markets-related products and services to mid-sized and large corporations, and government and not-for-profit entities. Lending products include secured and unsecured loans, letters of credit and equipment leases. The Treasury Management business provides payables, receivables, deposit and account services, liquidity and investments, and online and mobile banking products and services to our clients. Capital markets-related products and services include foreign exchange, derivatives, securities underwriting, loan syndications, mergers and acquisitions advisory and equity capital markets advisory related services. We also provide commercial loan servicing and technology solutions for the commercial real estate finance industry. Products and services are provided nationally.
Asset Management Group provides personal wealth management for high net worth and ultra high net worth clients and institutional asset management. The Asset Management group is composed of three distinct operating units:
• |
Wealth Management provides products and services to individuals and their families including investment and retirement planning, customized investment management, private banking, and trust management and administration for individuals and their families. |
• |
Our Hawthorn unit provides multi-generational family planning including estate, financial, tax planning, fiduciary, investment management and consulting, private banking, personal administrative services, asset custody and customized performance reporting to ultra high net worth clients. |
• |
Institutional asset management provides outsourced chief investment officer, custody, private real estate, cash and fixed income client solutions, and fiduciary retirement advisory services to institutional clients including corporations, healthcare systems, insurance companies, unions, municipalities and non-profits. |
NOTE 16 F EE-BASED REVENUE FROM CONTRACTS WITH CUSTOMERS
As more fully described in Note 23 Fee-based Revenue from Contracts with Customers in our 2019 Form 10-K, a subset of our noninterest income relates to certain fee-based revenue within the scope of ASC Topic 606 - Revenue from Contracts with Customers (Topic 606).
Fee-based revenue within the scope of Topic 606 is recognized within three of our reportable business segments, Retail Banking, Corporate & Institutional Banking and Asset Management Group. Topic 606 also excludes interest income, income from lease contracts, fair value gains from financial instruments (including derivatives), income from mortgage servicing rights and guarantee products, letter of credit fees, non-refundable fees associated with acquiring or originating a loan and gains from the sale of financial assets.
108 The PNC Financial Services Group, Inc. – Form 10-Q
The following tables present noninterest income within the scope of Topic 606 disaggregated by segment. A description of the fee-based revenue and how it is recognized for each segment’s principal services and products is included in our 2019 Form 10-K.
Retail Banking
Table 82: Retail Banking Noninterest Income Disaggregation
Three months ended June 30 |
Six months ended June 30 |
|||||||||||
In millions |
2020 |
2019 |
2020 |
2019 |
||||||||
Product |
||||||||||||
Deposit account fees |
$ |
$ |
$ |
$ |
||||||||
Debit card fees |
||||||||||||
Brokerage fees |
||||||||||||
Merchant services |
||||||||||||
Net credit card fees (a) |
||||||||||||
Other |
||||||||||||
Total in-scope noninterest income by product |
$ |
$ |
$ |
$ |
||||||||
Reconciliation to total Retail Banking noninterest income |
||||||||||||
Total in-scope noninterest income |
$ |
$ |
$ |
$ |
||||||||
Total out-of-scope noninterest income (b) |
||||||||||||
Total Retail Banking noninterest income |
$ |
$ |
$ |
$ |
||||||||
(a) |
Net credit card fees consists of interchange fees of $ |
(b) |
Out-of-scope noninterest income includes revenue streams that fall under the scope of other accounting and disclosure requirements outside of Topic 606. |
Corporate & Institutional Banking
Table 83: Corporate & Institutional Banking Noninterest Income Disaggregation
Three months ended June 30 |
Six months ended June 30 |
|||||||||||
In millions |
2020 |
2019 |
2020 |
2019 |
||||||||
Product |
||||||||||||
Treasury management fees |
$ |
$ |
$ |
$ |
||||||||
Capital markets fees |
||||||||||||
Commercial mortgage banking activities |
||||||||||||
Other |
||||||||||||
Total in-scope noninterest income by product |
$ |
$ |
$ |
$ |
||||||||
Reconciliation to total Corporate & Institutional Banking noninterest income |
||||||||||||
Total in-scope noninterest income |
$ |
$ |
$ |
$ |
||||||||
Total out-of-scope noninterest income (a) |
||||||||||||
Total Corporate & Institutional Banking noninterest income |
$ |
$ |
$ |
$ |
||||||||
(a) |
Out-of-scope noninterest income includes revenue streams that fall under the scope of other accounting and disclosure requirements outside of Topic 606. |
The PNC Financial Services Group, Inc. – Form 10-Q 109
Asset Management Group
Table 84: Asset Management Group Noninterest Income Disaggregation
Three months ended June 30 |
Six months ended June 30 |
|||||||||||
In millions |
2020 |
2019 |
2020 |
2019 |
||||||||
Customer Type |
||||||||||||
Personal |
$ |
$ |
$ |
$ |
||||||||
Institutional |
||||||||||||
Total in-scope noninterest income by customer type |
$ |
$ |
$ |
$ |
||||||||
Reconciliation to Asset Management Group noninterest income |
||||||||||||
Total in-scope noninterest income |
$ |
$ |
$ |
$ |
||||||||
Total out-of-scope noninterest income (a) |
||||||||||||
Total Asset Management Group noninterest income |
$ |
$ |
$ |
$ |
||||||||
(a) |
Out-of-scope noninterest income includes revenue streams that fall under the scope of other accounting and disclosure requirements outside of Topic 606. |
NOTE 17 S UBSEQUENT EVENTS
On July 31, 2020, PNC announced its upcoming redemption on September 1, 2020 of $480 million of Depositary Shares representing interests in PNC’s 5.375 % Non-Cumulative Perpetual Preferred Stock, Series Q (the “Series Q Preferred Stock”). Each Depositary Share represents a 1/4,000th interest in a share of the Series Q Preferred Stock. The Depositary Shares will be redeemed at a redemption price of $25.00 per Depositary Share plus declared and unpaid dividends of $0.3359375 per Depositary Share, representing the dividend for the period from June 1, 2020 to, but excluding, September 1, 2020. All 19.2 million Depositary Shares currently outstanding will be redeemed.
110 The PNC Financial Services Group, Inc. – Form 10-Q
STATISTICAL INFORMATION (UNAUDITED)
THE PNC FINANCIAL SERVICES GROUP, INC.
Average Consolidated Balance Sheet And Net Interest Analysis (a) (b) (c)
Six months ended June 30 |
||||||||||||||||||||||
2020 |
2019 |
|||||||||||||||||||||
|
Taxable-equivalent basis
Dollars in millions
|
Average
Balances
|
Interest Income/Expense |
Average Yields/Rates |
Average Balances |
Interest Income/ Expense |
Average Yields/ Rates |
||||||||||||||||
Assets |
||||||||||||||||||||||
Interest-earning assets: |
||||||||||||||||||||||
Investment securities |
||||||||||||||||||||||
Securities available for sale |
||||||||||||||||||||||
Residential mortgage-backed |
||||||||||||||||||||||
Agency |
$ |
51,068 |
$ |
626 |
2.45 |
% |
$ |
29,589 |
$ |
434 |
2.93 |
% |
||||||||||
Non-agency |
1,573 |
59 |
7.51 |
% |
1,845 |
71 |
7.64 |
% |
||||||||||||||
Commercial mortgage-backed |
6,983 |
96 |
2.76 |
% |
5,457 |
84 |
3.09 |
% |
||||||||||||||
Asset-backed |
5,156 |
73 |
2.82 |
% |
5,266 |
88 |
3.35 |
% |
||||||||||||||
U.S. Treasury and government agencies |
15,697 |
161 |
2.03 |
% |
18,529 |
232 |
2.49 |
% |
||||||||||||||
Other |
4,488 |
81 |
3.57 |
% |
3,453 |
57 |
3.34 |
% |
||||||||||||||
Total securities available for sale |
84,965 |
1,096 |
2.58 |
% |
64,139 |
966 |
3.01 |
% |
||||||||||||||
Securities held to maturity |
||||||||||||||||||||||
Residential mortgage-backed |
— |
— |
— |
15,487 |
230 |
2.97 |
% |
|||||||||||||||
Commercial mortgage-backed |
— |
— |
— |
585 |
10 |
3.55 |
% |
|||||||||||||||
Asset-backed |
37 |
— |
2.65 |
% |
175 |
3 |
3.88 |
% |
||||||||||||||
U.S. Treasury and government agencies |
781 |
11 |
2.84 |
% |
763 |
11 |
2.83 |
% |
||||||||||||||
Other |
643 |
14 |
4.38 |
% |
1,834 |
42 |
4.42 |
% |
||||||||||||||
Total securities held to maturity |
1,461 |
25 |
3.51 |
% |
18,844 |
296 |
3.13 |
% |
||||||||||||||
Total investment securities |
86,426 |
1,121 |
2.59 |
% |
82,983 |
1,262 |
3.04 |
% |
||||||||||||||
Loans |
||||||||||||||||||||||
Commercial and industrial |
141,159 |
2,278 |
3.19 |
% |
121,907 |
2,619 |
4.27 |
% |
||||||||||||||
Commercial real estate |
28,491 |
466 |
3.23 |
% |
28,285 |
625 |
4.40 |
% |
||||||||||||||
Equipment lease financing |
7,051 |
137 |
3.88 |
% |
7,274 |
145 |
4.00 |
% |
||||||||||||||
Consumer |
57,082 |
1,454 |
5.12 |
% |
55,099 |
1,517 |
5.55 |
% |
||||||||||||||
Residential real estate |
22,060 |
431 |
3.91 |
% |
19,147 |
409 |
4.28 |
% |
||||||||||||||
Total loans |
255,843 |
4,766 |
3.71 |
% |
231,712 |
5,315 |
4.58 |
% |
||||||||||||||
Interest-earning deposits with banks |
26,085 |
65 |
.50 |
% |
14,238 |
171 |
2.41 |
% |
||||||||||||||
Other interest-earning assets |
10,167 |
144 |
2.84 |
% |
12,113 |
231 |
3.82 |
% |
||||||||||||||
Total interest-earning assets/interest income |
378,521 |
6,096 |
3.21 |
% |
341,046 |
6,979 |
4.09 |
% |
||||||||||||||
Noninterest-earning assets |
56,353 |
50,415 |
||||||||||||||||||||
Total assets |
$ |
434,874 |
$ |
391,461 |
||||||||||||||||||
Liabilities and Equity |
||||||||||||||||||||||
Interest-bearing liabilities: |
||||||||||||||||||||||
Interest-bearing deposits |
||||||||||||||||||||||
Money market |
$ |
57,317 |
$ |
118 |
.41 |
% |
$ |
54,758 |
$ |
315 |
1.16 |
% |
||||||||||
Demand |
76,906 |
88 |
.23 |
% |
63,958 |
170 |
.53 |
% |
||||||||||||||
Savings |
72,661 |
195 |
.54 |
% |
60,394 |
347 |
1.16 |
% |
||||||||||||||
Time deposits |
21,506 |
115 |
1.06 |
% |
19,430 |
155 |
1.61 |
% |
||||||||||||||
Total interest-bearing deposits |
228,390 |
516 |
.45 |
% |
198,540 |
987 |
1.00 |
% |
||||||||||||||
Borrowed funds |
||||||||||||||||||||||
Federal Home Loan Bank borrowings |
13,000 |
89 |
1.36 |
% |
22,089 |
303 |
2.73 |
% |
||||||||||||||
Bank notes and senior debt |
29,143 |
295 |
2.00 |
% |
26,145 |
451 |
3.43 |
% |
||||||||||||||
Subordinated debt |
5,935 |
69 |
2.32 |
% |
5,704 |
124 |
4.34 |
% |
||||||||||||||
Other |
7,131 |
48 |
1.34 |
% |
7,128 |
87 |
2.44 |
% |
||||||||||||||
Total borrowed funds |
55,209 |
501 |
1.80 |
% |
61,066 |
965 |
3.14 |
% |
||||||||||||||
Total interest-bearing liabilities/interest expense |
283,599 |
1,017 |
.71 |
% |
259,606 |
1,952 |
1.50 |
% |
||||||||||||||
Noninterest-bearing liabilities and equity: |
||||||||||||||||||||||
Noninterest-bearing deposits |
84,086 |
71,526 |
||||||||||||||||||||
Accrued expenses and other liabilities |
16,712 |
12,187 |
||||||||||||||||||||
Equity |
50,477 |
48,142 |
||||||||||||||||||||
Total liabilities and equity |
$ |
434,874 |
$ |
391,461 |
||||||||||||||||||
Interest rate spread |
2.50 |
% |
2.59 |
% |
||||||||||||||||||
Impact of noninterest-bearing sources |
.17 |
.35 |
||||||||||||||||||||
Net interest income/margin |
$ |
5,079 |
2.67 |
% |
$ |
5,027 |
2.94 |
% |
||||||||||||||
(continued on following page)
The PNC Financial Services Group, Inc. – Form 10-Q 111
Average Consolidated Balance Sheet And Net Interest Analysis (a) (b) (c) (Continued)
Three months ended June 30 |
||||||||||||||||||||||
2020 |
2019 |
|||||||||||||||||||||
|
Taxable-equivalent basis
Dollars in millions
|
Average
Balances
|
Interest Income/Expense |
Average Yields/Rates |
Average Balances |
Interest Income/ Expense |
Average Yields/ Rates |
||||||||||||||||
Assets |
||||||||||||||||||||||
Interest-earning assets: |
||||||||||||||||||||||
Investment securities |
||||||||||||||||||||||
Securities available for sale |
||||||||||||||||||||||
Residential mortgage-backed |
||||||||||||||||||||||
Agency |
$ |
52,500 |
$ |
300 |
2.29 |
% |
$ |
30,169 |
$ |
221 |
2.93 |
% |
||||||||||
Non-agency |
1,529 |
27 |
7.13 |
% |
1,801 |
36 |
7.99 |
% |
||||||||||||||
Commercial mortgage-backed |
7,232 |
46 |
2.59 |
% |
5,545 |
42 |
3.06 |
% |
||||||||||||||
Asset-backed |
5,309 |
35 |
2.60 |
% |
5,395 |
45 |
3.34 |
% |
||||||||||||||
U.S. Treasury and government agencies |
15,457 |
69 |
1.77 |
% |
18,815 |
118 |
2.48 |
% |
||||||||||||||
Other |
4,952 |
44 |
3.47 |
% |
3,237 |
27 |
3.33 |
% |
||||||||||||||
Total securities available for sale |
86,979 |
521 |
2.39 |
% |
64,962 |
489 |
3.01 |
% |
||||||||||||||
Securities held to maturity |
||||||||||||||||||||||
Residential mortgage-backed |
— |
— |
— |
15,350 |
112 |
2.93 |
% |
|||||||||||||||
Commercial mortgage-backed |
— |
— |
— |
570 |
5 |
3.57 |
% |
|||||||||||||||
Asset-backed |
22 |
— |
2.38 |
% |
172 |
1 |
3.92 |
% |
||||||||||||||
U.S. Treasury and government agencies |
783 |
5 |
2.84 |
% |
765 |
6 |
2.84 |
% |
||||||||||||||
Other |
646 |
7 |
4.27 |
% |
1,822 |
22 |
4.44 |
% |
||||||||||||||
Total securities held to maturity |
1,451 |
12 |
3.47 |
% |
18,679 |
146 |
3.10 |
% |
||||||||||||||
Total investment securities |
88,430 |
533 |
2.41 |
% |
83,641 |
635 |
3.03 |
% |
||||||||||||||
Loans |
||||||||||||||||||||||
Commercial and industrial |
153,595 |
1,098 |
2.83 |
% |
124,441 |
1,328 |
4.22 |
% |
||||||||||||||
Commercial real estate |
28,707 |
206 |
2.84 |
% |
28,423 |
318 |
4.43 |
% |
||||||||||||||
Equipment lease financing |
7,035 |
68 |
3.82 |
% |
7,283 |
74 |
4.06 |
% |
||||||||||||||
Consumer |
56,485 |
683 |
4.86 |
% |
55,202 |
766 |
5.56 |
% |
||||||||||||||
Residential real estate |
22,292 |
215 |
3.86 |
% |
19,496 |
207 |
4.27 |
% |
||||||||||||||
Total loans |
268,114 |
2,270 |
3.37 |
% |
234,845 |
2,693 |
4.56 |
% |
||||||||||||||
Interest-earning deposits with banks |
34,600 |
9 |
.10 |
% |
13,469 |
80 |
2.38 |
% |
||||||||||||||
Other interest-earning assets |
10,867 |
62 |
2.26 |
% |
13,145 |
116 |
3.55 |
% |
||||||||||||||
Total interest-earning assets/interest income |
402,011 |
2,874 |
2.85 |
% |
345,100 |
3,524 |
4.06 |
% |
||||||||||||||
Noninterest-earning assets |
55,302 |
51,862 |
||||||||||||||||||||
Total assets |
$ |
457,313 |
$ |
396,962 |
||||||||||||||||||
Liabilities and Equity |
||||||||||||||||||||||
Interest-bearing liabilities: |
||||||||||||||||||||||
Interest-bearing deposits |
||||||||||||||||||||||
Money market |
$ |
61,346 |
$ |
23 |
.15 |
% |
$ |
54,814 |
$ |
160 |
1.17 |
% |
||||||||||
Demand |
82,881 |
16 |
.08 |
% |
64,431 |
89 |
.55 |
% |
||||||||||||||
Savings |
75,345 |
57 |
.31 |
% |
61,949 |
183 |
1.19 |
% |
||||||||||||||
Time deposits |
21,873 |
45 |
.80 |
% |
20,040 |
83 |
1.67 |
% |
||||||||||||||
Total interest-bearing deposits |
241,445 |
141 |
.23 |
% |
201,234 |
515 |
1.03 |
% |
||||||||||||||
Borrowed funds |
||||||||||||||||||||||
Federal Home Loan Bank borrowings |
12,559 |
31 |
1.00 |
% |
22,681 |
154 |
2.69 |
% |
||||||||||||||
Bank notes and senior debt |
28,298 |
112 |
1.56 |
% |
26,865 |
228 |
3.36 |
% |
||||||||||||||
Subordinated debt |
5,937 |
29 |
1.91 |
% |
5,526 |
58 |
4.17 |
% |
||||||||||||||
Other |
6,435 |
15 |
.92 |
% |
7,263 |
44 |
2.44 |
% |
||||||||||||||
Total borrowed funds |
53,229 |
187 |
1.39 |
% |
62,335 |
484 |
3.08 |
% |
||||||||||||||
Total interest-bearing liabilities/interest expense |
294,674 |
328 |
.44 |
% |
263,569 |
999 |
1.51 |
% |
||||||||||||||
Noninterest-bearing liabilities and equity: |
||||||||||||||||||||||
Noninterest-bearing deposits |
93,776 |
71,648 |
||||||||||||||||||||
Accrued expenses and other liabilities |
16,989 |
13,122 |
||||||||||||||||||||
Equity |
51,874 |
48,623 |
||||||||||||||||||||
Total liabilities and equity |
$ |
457,313 |
$ |
396,962 |
||||||||||||||||||
Interest rate spread |
2.41 |
% |
2.55 |
% |
||||||||||||||||||
Impact of noninterest-bearing sources |
.11 |
.36 |
||||||||||||||||||||
Net interest income/margin |
$ |
2,546 |
2.52 |
% |
$ |
2,525 |
2.91 |
% |
||||||||||||||
(a) |
Nonaccrual loans are included in loans, net of unearned income. The impact of financial derivatives used in interest rate risk management is included in the interest income/expense and average yields/rates of the related assets and liabilities. Basis adjustments related to hedged items are included in noninterest-earning assets and noninterest-bearing liabilities. Average balances of securities are based on amortized historical cost (excluding adjustments to fair value, which are included in other assets). Average balances for certain loans and borrowed funds accounted for at fair value are included in noninterest-earning assets and noninterest-bearing liabilities, with changes in fair value recorded in Noninterest income. |
(b) |
Loan fees for the three months ended June 30, 2020 and June 30, 2019 were $35 million and $43 million, respectively. Loan fees for the six months ended June 30, 2020 and June 30, 2019 were $79 million and $71 million, respectively.
|
(c) |
Interest income calculated as taxable-equivalent interest income. To provide more meaningful comparisons of interest income and yields for all interest-earning assets, as well as net interest margins, we use interest income on a taxable-equivalent basis in calculating average yields and net interest margin by increasing the interest income earned on tax-exempt assets to make it fully equivalent to interest income earned on taxable investments. This adjustment is not permitted under GAAP. See Reconciliation of Taxable-Equivalent Net Interest Income in this Statistical Information section for more information. |
112 The PNC Financial Services Group, Inc. – Form 10-Q
RECONCILIATION OF TAXABLE-EQUIVALENT NET INTEREST INCOME (NON-GAAP) (a)
Six months ended |
Three months ended |
|||||||||||||
In millions |
June 30, 2020 |
June 30, 2019 |
June 30, 2020 |
June 30, 2019 |
||||||||||
Net interest income (GAAP) |
$ |
5,038 |
$ |
4,973 |
$ |
2,527 |
$ |
2,498 |
||||||
Taxable-equivalent adjustments |
41 |
54 |
19 |
27 |
||||||||||
Net interest income (Non-GAAP) |
$ |
5,079 |
$ |
5,027 |
$ |
2,546 |
$ |
2,525 |
||||||
(a) |
The interest income earned on certain interest-earning assets is completely or partially exempt from federal income tax. As such, these tax-exempt instruments typically yield lower returns than taxable investments. To provide more meaningful comparisons of net interest income, we use interest income on a taxable-equivalent basis by increasing the interest income earned on tax-exempt assets to make it fully equivalent to interest income earned on taxable investments. |
PART II – OTHER INFORMATION
ITEM 1. LEGAL PROCEEDINGS
See the information set forth in Note 14 Legal Proceedings in the Notes To Consolidated Financial Statements under Part I, Item 1 of this Report, which is incorporated by reference in response to this item.
ITEM 1A. RISK FACTORS
There are no material changes from any of the risk factors previously disclosed in our first quarter 2020 Form 10-Q and 2019 Form 10-K in response to Part II, Item 1A and Part I, Item 1A, respectively.
ITEM 2. UNREGISTERED SALES OF EQUITY SECURITIES AND USE OF PROCEEDS
Unregistered Sales of Equity Securities
None.
Equity Security Repurchases
Details of our repurchases of PNC common stock during the second quarter of 2020 are included in the following table.
2020 period In thousands, except per share data |
Total shares purchased (a) |
Average price paid per share |
Total shares purchased as part of publicly announced programs (b) |
Maximum number of shares that may yet be purchased under the programs (b) |
|||||
April 1 - 30 |
16 |
$ |
101.50 |
— |
76,028 |
||||
May 1 - 31 (c) |
— |
$ |
105.99 |
— |
76,028 |
||||
June 1 - 30 |
— |
$ |
— |
— |
76,028 |
||||
Total |
16 |
$ |
101.50 |
||||||
(a) |
Includes PNC common stock purchased in connection with our various employee benefit plans generally related to shares used to cover employee payroll tax withholding requirements. Note 11 Employee Benefit Plans and Note 12 Stock Based Compensation Plans in the Notes To Consolidated Financial Statements of our 2019 Annual Report on Form 10-K include additional information regarding our employee benefit and equity compensation plans that use PNC common stock. |
(b) |
On April 4, 2019, our Board of Directors approved the establishment of a new stock repurchase program authorization in the amount of 100 million shares of PNC common stock, effective July 1, 2019. Under this authorization, repurchases may be made in the open market or privately negotiated transactions, with the timing and exact amount of common stock repurchases depending on a number of factors including, among others, market and general economic conditions, regulatory capital considerations, alternative uses of capital, the potential impact on our credit ratings, and contractual and regulatory limitations, including the results of the supervisory assessment of capital adequacy and capital planning processes undertaken by the Federal Reserve as part of the CCAR process. In June 2019, we announced share repurchase programs of up to $4.3 billion for the four quarter period beginning with the third quarter of 2019, in accordance with PNC's 2019 capital plan. In January 2020, we announced an increase to these programs to repurchase up to an additional $1.0 billion in common shares through the end of the second quarter of 2020. We announced on March 16, 2020 a temporary suspension of our common stock repurchase program in conjunction with the Federal Reserve's effort to support the U.S. economy during the pandemic, and will continue the suspension through the third quarter of 2020, with the exception of share repurchases to offset the effects of employee benefit plan-related issuances as permitted by recent guidance from the Federal Reserve. The estimated amount is $100 million in the third quarter of 2020, but the timing and amount of executed repurchases will be based on market conditions and other factors. |
(c) |
Average price paid for immaterial amounts of PNC common stock purchased in connection with our various employee benefit plans generally related to shares used to cover employee payroll tax withholding requirements. |
The PNC Financial Services Group, Inc. – Form 10-Q 113
ITEM 6. EXHIBITS
The following exhibit index lists Exhibits filed, or in the case of Exhibits 32.1 and 32.2 furnished, with this Quarterly Report on Form 10-Q:
EXHIBIT INDEX
| ||
10.39 |
||
10.40 |
||
10.41 |
||
31.1 |
||
31.2 |
||
32.1 |
||
32.2 |
||
101.INS |
Inline XBRL Instance Document * |
|
101.SCH |
Inline XBRL Taxonomy Extension Schema Document |
|
101.CAL |
Inline XBRL Taxonomy Extension Calculation Linkbase Document |
|
101.LAB |
Inline XBRL Taxonomy Extension Label Linkbase Document |
|
101.PRE |
Inline XBRL Taxonomy Extension Presentation Linkbase Document |
|
101.DEF |
Inline XBRL Taxonomy Extension Definition Linkbase Document |
|
104 |
Cover Page Interactive Data File (formatted as inline XBRL and contained in Exhibit 101) |
|
* The instance document does not appear in the interactive data file because its XBRL tags are embedded within the inline XBRL.
You can obtain copies of these Exhibits electronically at the SEC’s website at www.sec.gov. The Exhibits are also available as part of this Form 10-Q on PNC’s corporate website at www.pnc.com/secfilings. Shareholders and bondholders may also obtain copies of Exhibits, without charge, by contacting Shareholder Relations at 800-843-2206 or via e-mail at investor.relations@pnc.com.
CORPORATE INFORMATION
The PNC Financial Services Group, Inc.
Corporate Headquarters
The PNC Financial Services Group, Inc.
The Tower at PNC Plaza
300 Fifth Avenue
Pittsburgh, Pennsylvania 15222-2401
888-762-2265
Internet Information
The PNC Financial Services Group, Inc.'s financial reports and information about products and services are available on the internet at www.pnc.com. We provide information for investors on our corporate website under “About Us – Investor Relations.” We use our Twitter account, @pncnews, as an additional way of disseminating to the public information that may be relevant to investors.
We generally post the following under “About Us – Investor Relations” shortly before or promptly following its first use or release: financially-related press releases, including earnings releases and supplemental financial information, various SEC filings, including annual, quarterly and current reports and proxy statements, presentation materials associated with earnings and other investor conference calls or events, and access to live and recorded audio from earnings and other investor conference calls or events. In some cases, we may post the presentation materials for other investor conference calls or events several days prior to the call or event. For earnings and other conference calls or events, we generally include in our posted materials a cautionary statement regarding forward-looking and non-GAAP financial information, and we provide GAAP reconciliations when we include non-GAAP financial information. Such GAAP reconciliations may be in materials for the applicable presentation, in materials for prior presentations or in our annual, quarterly or current reports.
When warranted, we will also use our website to expedite public access to time-critical information regarding PNC instead of using a press release or a filing with the SEC for first disclosure of the information. In some circumstances, the information may be relevant to
114 The PNC Financial Services Group, Inc. – Form 10-Q
investors but directed at customers, in which case it may be accessed directly through the home page rather than “About Us – Investor Relations.”
We are required to provide additional public disclosure regarding estimated income, losses and pro forma regulatory capital ratios under supervisory and PNC-developed hypothetical severely adverse economic scenarios, as well as information concerning our capital stress testing processes, pursuant to the stress testing regulations adopted by the Federal Reserve and the OCC. We are also required to make certain additional regulatory capital-related public disclosures about our capital structure, risk exposures, risk assessment processes, risk-weighted assets and overall capital adequacy, including market risk-related disclosures, under rules adopted by the Federal banking agencies. Under these regulations, we may satisfy these requirements through postings on our website, and we have done so and expect to continue to do so without also providing disclosure of this information through filings with the SEC.
Other information posted on our corporate website that may not be available in our filings with the SEC includes information relating to our corporate governance and annual communications from our chairman to shareholders.
Where we have included internet addresses in this Report, such as our internet address and the internet address of the SEC, we have included those internet addresses as inactive textual references only. Except as specifically incorporated by reference into this Report, information on those websites is not part hereof.
Financial Information
We are subject to the informational requirements of the Securities Exchange Act of 1934 (Exchange Act) and, in accordance with the Exchange Act, we file annual, quarterly and current reports, proxy statements and other information with the SEC. Our SEC File Number is 001-09718. You can obtain copies of these and other filings, including exhibits, electronically at the SEC’s internet website at www.sec.gov or on our corporate internet website at www.pnc.com/secfilings. Shareholders and bond holders may also obtain copies of these filings without charge by contacting Shareholder Services at 800-982-7652 or via the online contact form at www.computershare.com/contactus for copies without exhibits, or via email to investor.relations@pnc.com for copies of exhibits, including financial statement and schedule exhibits where applicable.
Corporate Governance at PNC
Information about our Board of Directors and its committees and corporate governance, including our PNC Code of Business Conduct and Ethics (as amended from time to time), is available on our corporate website at www.pnc.com/corporategovernance. In addition, any future amendments to, or waivers from, a provision of the PNC Code of Business Conduct and Ethics covering any directors or executive officers (including our principal executive officer, principal financial officer and principal accounting officer or controller) will be posted at this internet address.
Shareholders who would like to request printed copies of the PNC Code of Business Conduct and Ethics or our Corporate Governance Guidelines or the charters of our Board’s Audit, Nominating and Governance, Personnel and Compensation, or Risk Committees (all of which are posted on the PNC corporate website) may do so by sending their requests to our Corporate Secretary at corporate headquarters at the above address. Copies will be provided without charge to shareholders.
Inquiries
For financial services call 888-762-2265.
Registered shareholders should contact Shareholder Services at 800-982-7652.
Analysts and institutional investors should contact Bryan Gill, Executive Vice President, Director of Investor Relations, at 412-768-4143 or via email at investor.relations@pnc.com.
News media representatives should contact PNC Media Relations at 412-762-4550 or via email at media.relations@pnc.com.
Dividend Policy
Holders of PNC common stock are entitled to receive dividends when declared by the Board of Directors out of funds legally available for this purpose. Our Board of Directors may not pay or set apart dividends on the common stock until dividends for all past dividend periods on any series of outstanding preferred stock have been paid or declared and set apart for payment. The Board presently intends to continue the policy of paying quarterly cash dividends. The amount of any future dividends will depend on economic and market conditions, our financial condition and operating results, and other factors, including contractual restrictions and applicable government regulations and policies (such as those relating to the ability of bank and non-bank subsidiaries to pay dividends to the parent company and regulatory capital limitations). The amount of our dividend is also currently subject to the results of the supervisory assessment of capital adequacy and capital planning processes undertaken by the Federal Reserve as part of the CCAR process as described in the Capital Management portion of the Risk Management section of the Financial Review of this Report and in the Supervision and Regulation section in Item 1 of our 2019 Form 10-K.
The PNC Financial Services Group, Inc. – Form 10-Q 115
Dividend Reinvestment and Stock Purchase Plan
The PNC Financial Services Group, Inc. Dividend Reinvestment and Stock Purchase Plan enables holders of our common stock to conveniently purchase additional shares of common stock. You can obtain a prospectus and enrollment form by contacting Shareholder Services at 800-982-7652. Registered shareholders may also contact this phone number regarding dividends and other shareholder services.
Stock Transfer Agent and Registrar
Computershare
462 South 4th Street, Suite 1600
Louisville, KY 40202
800-982-7652
www.computershare.com/pnc
SIGNATURE
Pursuant to the requirements of the Securities Exchange Act of 1934, the registrant has duly caused this report to be signed on August 4, 2020 on its behalf by the undersigned thereunto duly authorized.
/s/ Robert Q. Reilly |
Robert Q. Reilly |
Executive Vice President and Chief Financial Officer |
(Principal Financial Officer) |
116 The PNC Financial Services Group, Inc. – Form 10-Q