EX-99.2
Published on April 14, 2016
Exhibit 99.2
|
|

First Quarter 2016 Earnings Conference Call April 14, 2016 Exhibit 99.2
|
|
Cautionary Statement Regarding Forward-Looking and Adjusted Information Our earnings conference call presentation is not intended as a full business or financial review and should be viewed in the context of all of the information made available by PNC in its SEC filings and on its corporate website. The presentation contains forward-looking statements regarding our outlook for earnings, revenues, expenses, capital and liquidity levels and ratios, asset levels, asset quality, financial position, and other matters regarding or affecting PNC and its future business and operations. Forward-looking statements are necessarily subject to numerous assumptions, risks and uncertainties, which change over time. The forward-looking statements in this presentation are qualified by the factors affecting forward-looking statements identified in the more detailed Cautionary Statement in the Appendix, which is included in the version of the presentation materials posted on our corporate website, and in our SEC filings. We provide greater detail regarding these as well as other factors in our 2015 Form 10-K and in our subsequent SEC filings. Our forward-looking statements may also be subject to other risks and uncertainties, including those we may discuss in this presentation or in our SEC filings. Future events or circumstances may change our outlook and may also affect the nature of the assumptions, risks and uncertainties to which our forward-looking statements are subject. Forward-looking statements in this presentation speak only as of the date of this presentation. We do not assume any duty and do not undertake to update those statements. Actual results or future events could differ, possibly materially, from those anticipated in forward-looking statements, as well as from historical performance. In this presentation, we may sometimes include non-GAAP financial information. Non-GAAP financial information includes metrics such as pretax, pre-provision earnings, tangible book value, and taxable-equivalent net interest income, as well as adjusted results and certain information used to review components of reported information. When we do so, we provide GAAP reconciliations for such information. Such reconciliations may be found in our presentation, in these slides, including the Appendix, in other materials on our corporate website, and in our SEC filings. This information supplements our results as reported in accordance with GAAP and should not be viewed in isolation from, or as a substitute for, our GAAP results. We believe that this information and the related reconciliations may be useful to investors, analysts, regulators and others to help understand and evaluate our financial results. We may also use annualized, pro forma, estimated or third party numbers for illustrative or comparative purposes only. These may not reflect actual results. References to our corporate website are to www.pnc.com under About Us Investor Relations. Our SEC filings are available both on our corporate website and on the SECs website at www.sec.gov. We include web addresses here as inactive textual references only. Information on these websites is not part of this presentation.
|
|
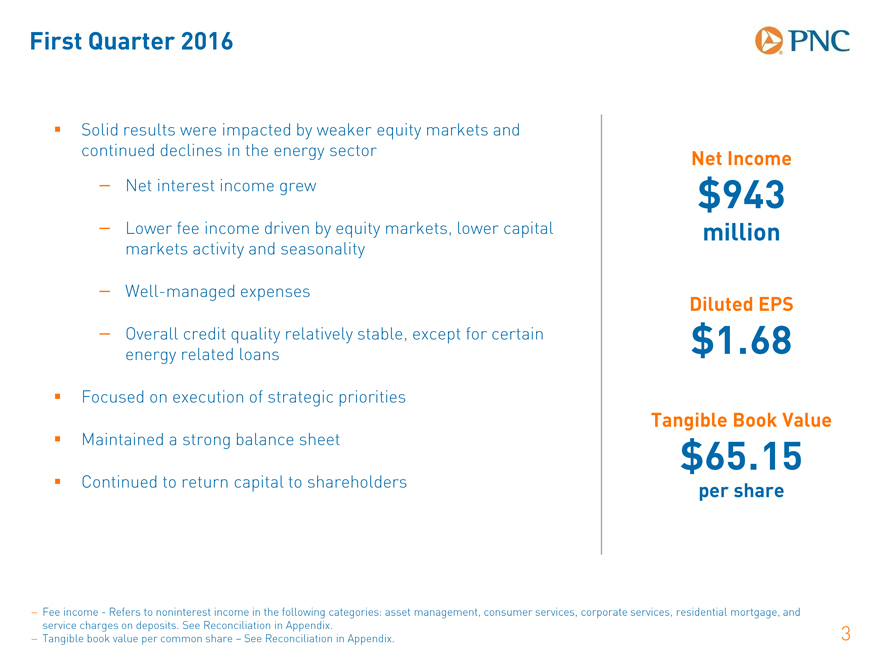
First Quarter 2016 Solid results were impacted by weaker equity markets and continued declines in the energy sector Net interest income grew Lower fee income driven by equity markets, lower capital markets activity and seasonality Well-managed expenses Overall credit quality relatively stable, except for certain energy related loans Focused on execution of strategic priorities Maintained a strong balance sheet Continued to return capital to shareholders Net Income $943 million Diluted EPS $1.68 Tangible Book Value $65.15 per share Fee incomeRefers to noninterest income in the following categories: asset management, consumer services, corporate services, residential mortgage, and service charges on deposits. See Reconciliation in Appendix. Tangible book value per common share See Reconciliation in Appendix.
|
|
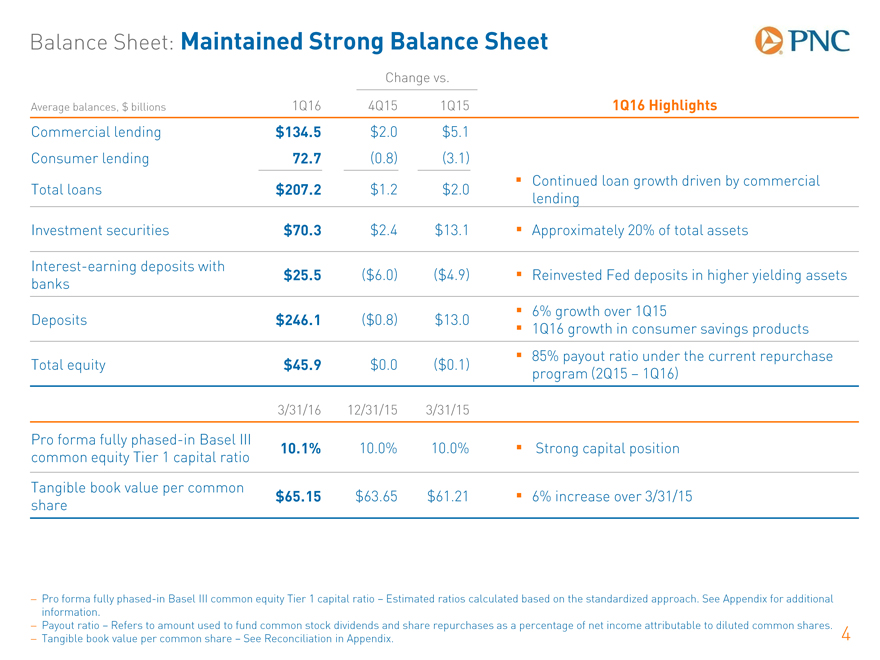
Average balances, $ billions 1Q16 4Q15 1Q15 1Q16 Highlights Commercial lending $134.5 $2.0 $5.1 Consumer lending 72.7 (0.8) (3.1) Total loans $207.2 $1.2 $2.0 Continued loan growth driven by commercial lending Investment securities $70.3 $2.4 $13.1 Approximately 20% of total assets Interest-earning deposits with banks $25.5 ($6.0) ($4.9) Reinvested Fed deposits in higher yielding assets Deposits $246.1 ($0.8) $13.0 6% growth over 1Q15 1Q16 growth in consumer savings products Total equity $45.9 $0.0 ($0.1) 85% payout ratio under the current repurchase program (2Q15 1Q16) 3/31/16 12/31/15 3/31/15 Pro forma fully phased-in Basel III common equity Tier 1 capital ratio 10.1% 10.0% 10.0% Strong capital position Tangible book value per common share $65.15 $63.65 $61.21 6% increase over 3/31/15 Balance Sheet: Maintained Strong Balance Sheet Pro forma fully phased-in Basel III common equity Tier 1 capital ratio Estimated ratios calculated based on the standardized approach. See Appendix for additional information. Payout ratio Refers to amount used to fund common stock dividends and share repurchases as a percentage of net income attributable to diluted common shares. Tangible book value per common share See Reconciliation in Appendix. Change vs.
|
|
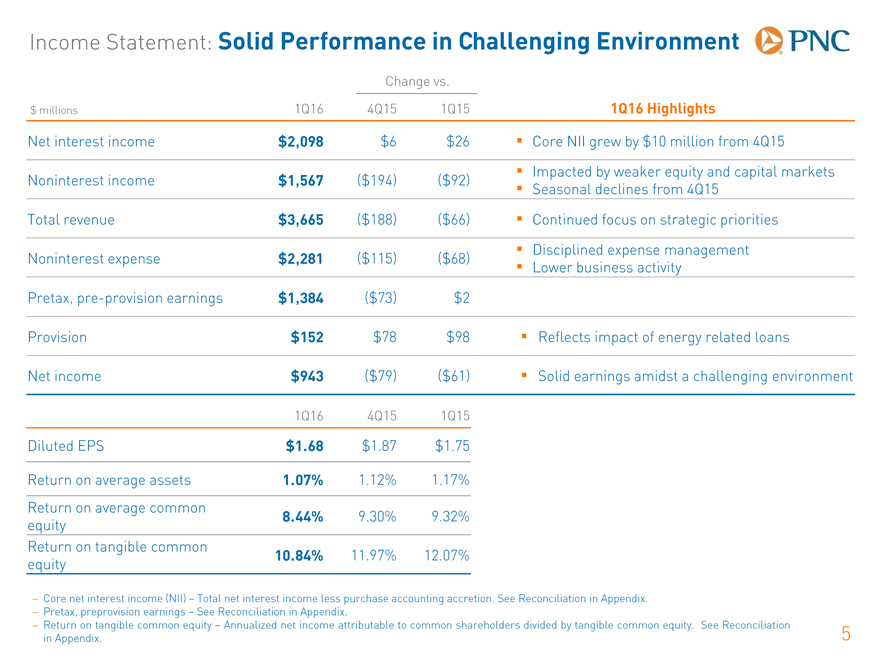
Income Statement: Solid Performance in Challenging Environment Core net interest income (NII) Total net interest income less purchase accounting accretion. See Reconciliation in Appendix. Pretax, preprovision earnings See Reconciliation in Appendix. Return on tangible common equity Annualized net income attributable to common shareholders divided by tangible common equity. See Reconciliation in Appendix. $ millions 1Q16 4Q15 1Q15 1Q16 Highlights Net interest income $2,098 $6 $26 Core NII grew by $10 million from 4Q15 Noninterest income $1,567 ($194) ($92) Impacted by weaker equity and capital markets Seasonal declines from 4Q15 Total revenue $3,665 ($188) ($66) Continued focus on strategic priorities Noninterest expense $2,281 ($115) ($68) Disciplined expense management Lower business activity Pretax, pre-provision earnings $1,384 ($73) $2 Provision $152 $78 $98 Reflects impact of energy related loans Net income $943 ($79) ($61) Solid earnings amidst a challenging environment 1Q16 4Q15 1Q15 Diluted EPS $1.68 $1.87 $1.75 Return on average assets 1.07% 1.12% 1.17% Return on average common equity 8.44% 9.30% 9.32% Return on tangible common equity 10.84% 11.97% 12.07% Change vs.
|
|
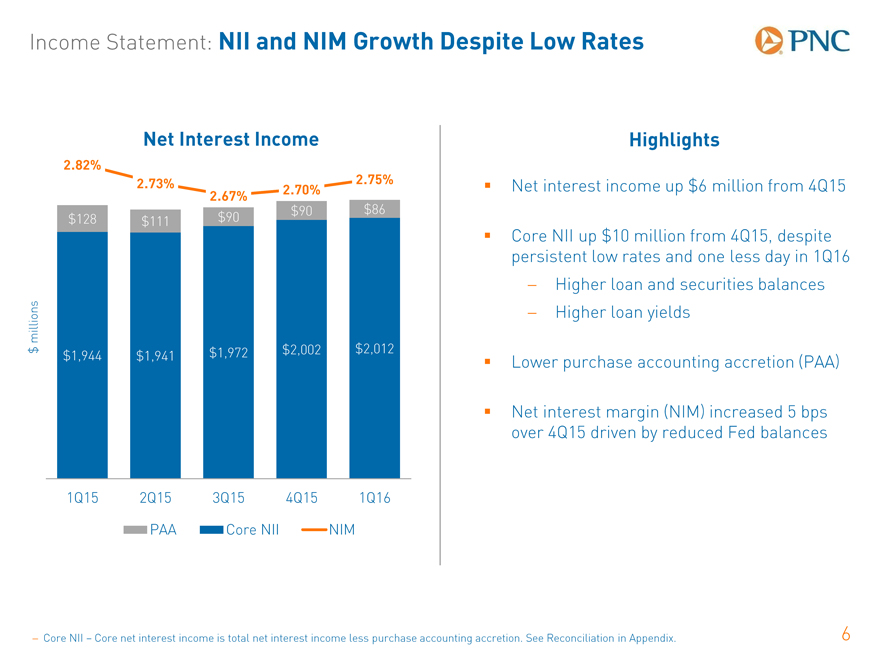
Income Statement: NII and NIM Growth Despite Low Rates Net Interest Income Highlights $ millions Net interest income up $6 million from 4Q15 Core NII up $10 million from 4Q15, despite persistent low rates and one less day in 1Q16 Higher loan and securities balances Higher loan yields Lower purchase accounting accretion (PAA) Net interest margin (NIM) increased 5 bps over 4Q15 driven by reduced Fed balances Core NII Core net interest income is total net interest income less purchase accounting accretion. See Reconciliation in Appendix.
|
|
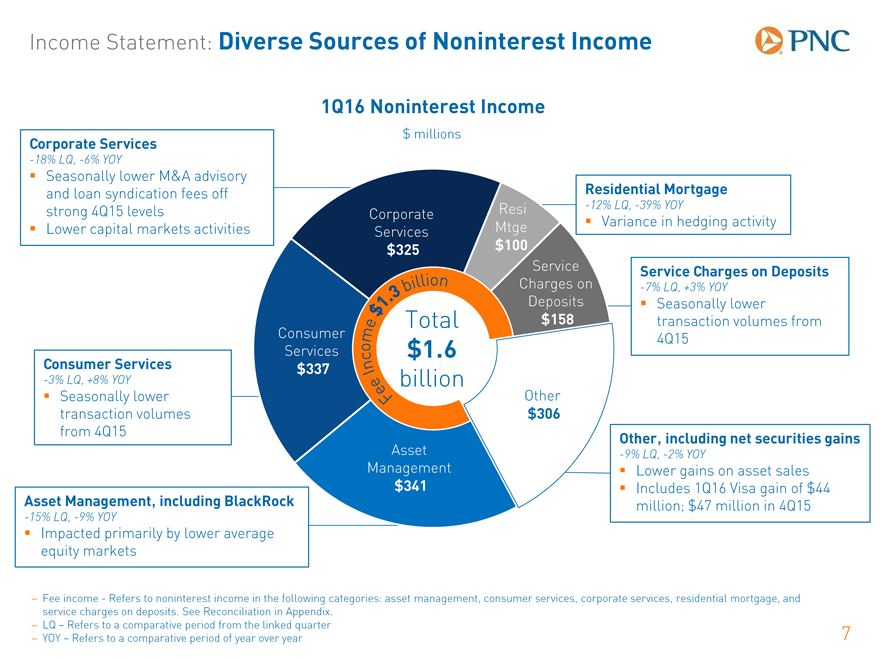
Income Statement: Diverse Sources of Noninterest Income
Corporate Services
-18% LQ, -6% YOY
? Seasonally lower M&A advisory and loan syndication fees off strong 4Q15 levels? Lower capital markets activities
Consumer Services
-3% LQ, +8% YOY
? Seasonally lower transaction volumes from 4Q15
Asset Management, including BlackRock
-15% LQ, -9% YOY
? Impacted primarily by lower average equity markets
Residential Mortgage
-12% LQ, -39% YOY
? Variance in hedging activity
Service Charges on Deposits
-7% LQ, +3% YOY
? Seasonally lower transaction volumes from 4Q15
Other, including net securities gains
-9% LQ, -2% YOY
? Lower gains on asset sales? Includes 1Q16 Visa gain of $44 million; $47 million in 4Q15
- Fee incomeRefers to noninterest income in the following categories: asset management, consumer services, corporate services, residential mortgage, and service charges on deposits. See Reconciliation in Appendix.
- LQ Refers to a comparative period from the linked quarter
- YOY Refers to a comparative period of year over year
7
Corporate Resi
Mtge? Services $325 $100
Service Charges on Deposits
Total $158
Consumer
Services $1.6
$337 billion
Other $306
Asset Management $341
|
|
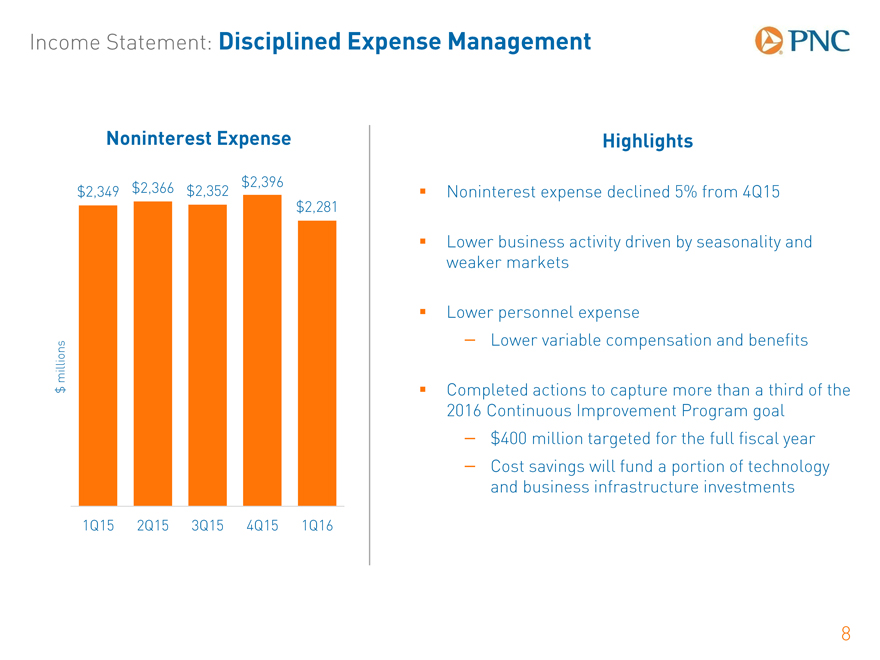
Income Statement: Disciplined Expense Management Noninterest Expense Highlights $ millions Noninterest expense declined 5% from 4Q15 Lower business activity driven by seasonality and weaker markets Lower personnel expense Lower variable compensation and benefits Completed actions to capture more than a third of the 2016 Continuous Improvement Program goal $400 million targeted for the full fiscal year Cost savings will fund a portion of technology and business infrastructure investments
|
|
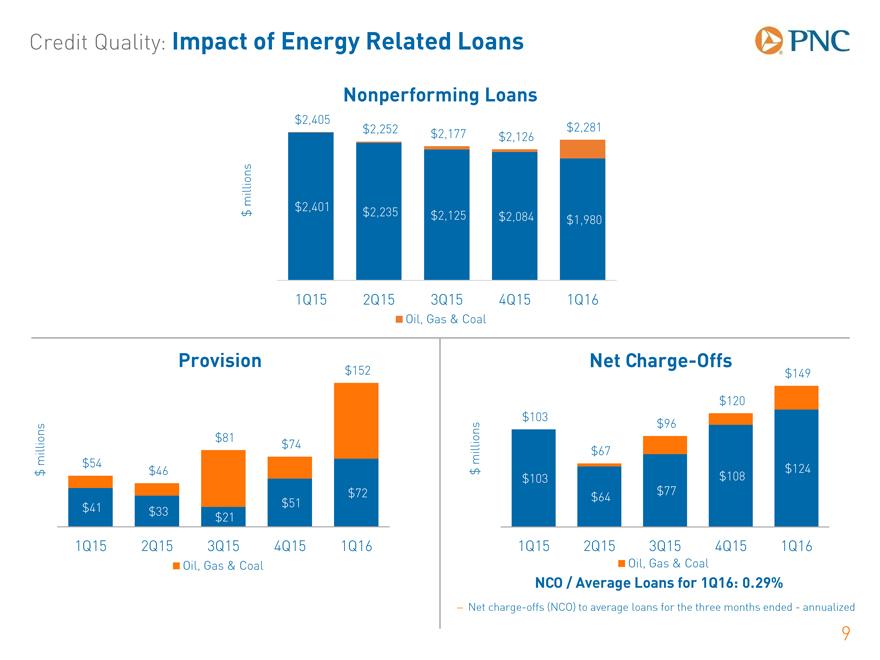
Credit Quality: Impact of Energy Related Loans $ millions Provision Net Charge-Offs $ millions NCO / Average Loans for 1Q16: 0.29% Nonperforming Loans $ millions Net charge-offs (NCO) to average loans for the three months endedannualized
|
|
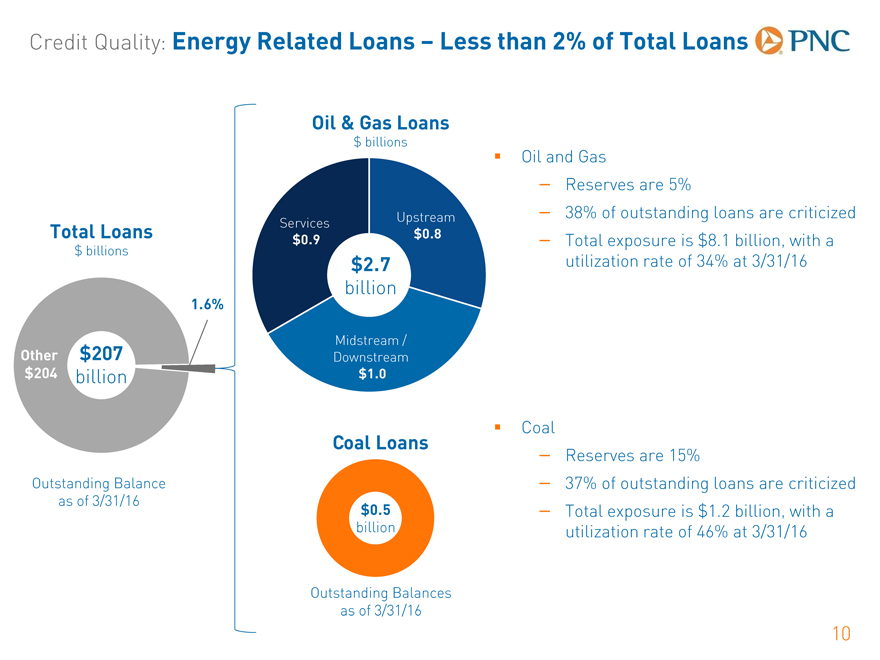
Credit Quality: Energy Related Loans Less than 2% of Total Loans Oil & Gas Loans $ billions Total Loans $ billions Oil and Gas Reserves are 5% 38% of outstanding loans are criticized Total exposure is $8.1 billion, with a utilization rate of 34% at 3/31/16 Coal Reserves are 15% 37% of outstanding loans are criticized Total exposure is $1.2 billion, with a utilization rate of 46% at 3/31/16 Outstanding Balance as of 3/31/16 Outstanding Balances as of 3/31/16 $207 billion $2.7 billion $0.5 billion Coal Loans
|
|
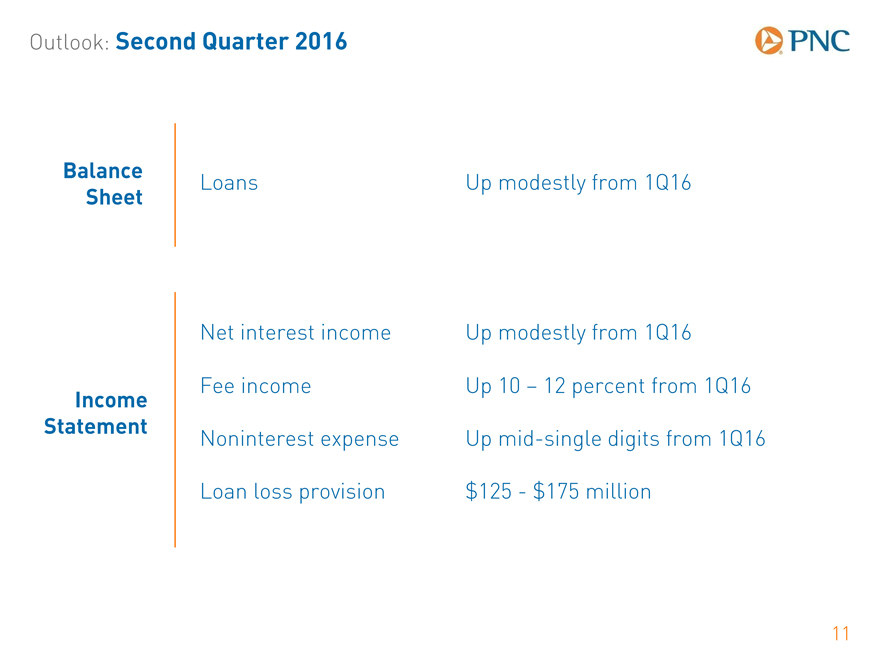
Outlook: Second Quarter 2016 Balance Sheet Income Statement Net interest income Up modestly from 1Q16 Fee income Up 10 12 percent from 1Q16 Noninterest expense Up mid-single digits from 1Q16 Loan loss provision $125$175 million Loans Up modestly from 1Q16
|
|
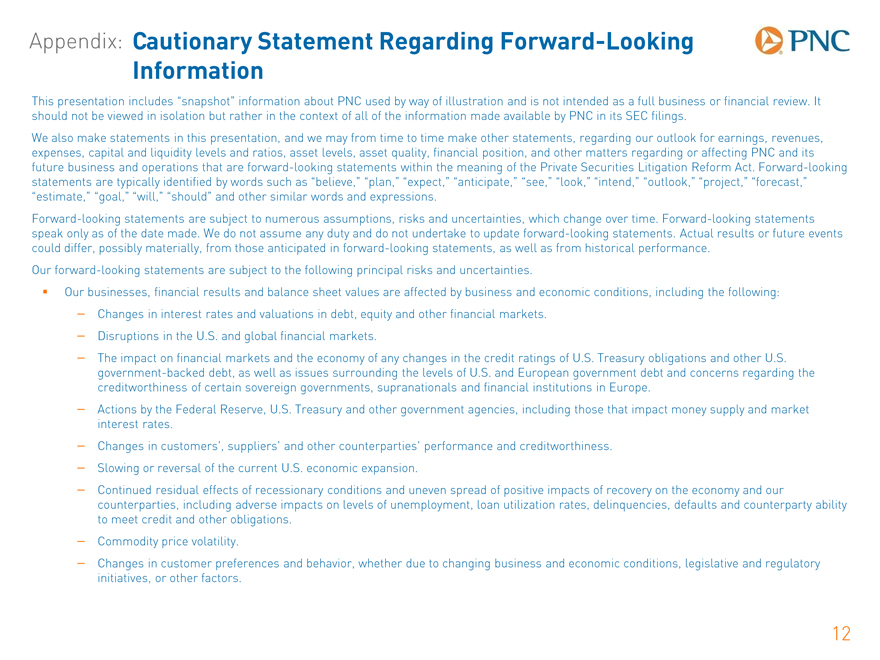
Appendix: Cautionary Statement Regarding Forward-Looking Information This presentation includes snapshot information about PNC used by way of illustration and is not intended as a full business or financial review. It should not be viewed in isolation but rather in the context of all of the information made available by PNC in its SEC filings. We also make statements in this presentation, and we may from time to time make other statements, regarding our outlook for earnings, revenues, expenses, capital and liquidity levels and ratios, asset levels, asset quality, financial position, and other matters regarding or affecting PNC and its future business and operations that are forward-looking statements within the meaning of the Private Securities Litigation Reform Act. Forward-looking statements are typically identified by words such as believe, plan, expect, anticipate, see, look, intend, outlook, project, forecast, estimate, goal, will, should and other similar words and expressions. Forward-looking statements are subject to numerous assumptions, risks and uncertainties, which change over time. Forward-looking statements speak only as of the date made. We do not assume any duty and do not undertake to update forward-looking statements. Actual results or future events could differ, possibly materially, from those anticipated in forward-looking statements, as well as from historical performance. Our forward-looking statements are subject to the following principal risks and uncertainties. Our businesses, financial results and balance sheet values are affected by business and economic conditions, including the following: Changes in interest rates and valuations in debt, equity and other financial markets. Disruptions in the U.S. and global financial markets. The impact on financial markets and the economy of any changes in the credit ratings of U.S. Treasury obligations and other U.S. government-backed debt, as well as issues surrounding the levels of U.S. and European government debt and concerns regarding the creditworthiness of certain sovereign governments, supranationals and financial institutions in Europe. Actions by the Federal Reserve, U.S. Treasury and other government agencies, including those that impact money supply and market interest rates. Changes in customers, suppliers and other counterparties performance and creditworthiness. Slowing or reversal of the current U.S. economic expansion. Continued residual effects of recessionary conditions and uneven spread of positive impacts of recovery on the economy and our counterparties, including adverse impacts on levels of unemployment, loan utilization rates, delinquencies, defaults and counterparty ability to meet credit and other obligations. Commodity price volatility. Changes in customer preferences and behavior, whether due to changing business and economic conditions, legislative and regulatory initiatives, or other factors.
|
|
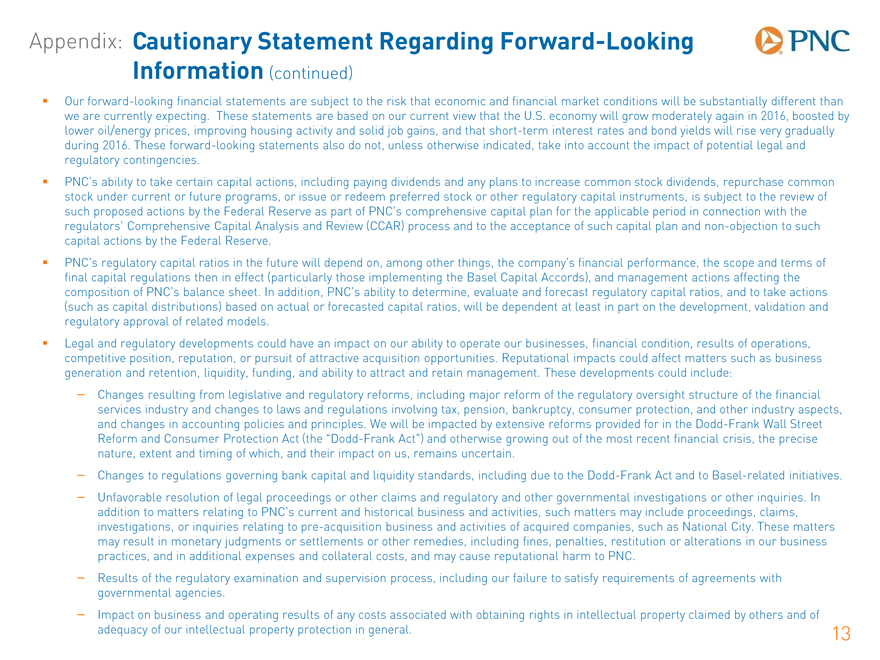
Appendix: Cautionary Statement Regarding Forward-Looking Information (continued) Our forward-looking financial statements are subject to the risk that economic and financial market conditions will be substantially different than we are currently expecting. These statements are based on our current view that the U.S. economy will grow moderately again in 2016, boosted by lower oil/energy prices, improving housing activity and solid job gains, and that short-term interest rates and bond yields will rise very gradually during 2016. These forward-looking statements also do not, unless otherwise indicated, take into account the impact of potential legal and regulatory contingencies. PNCs ability to take certain capital actions, including paying dividends and any plans to increase common stock dividends, repurchase common stock under current or future programs, or issue or redeem preferred stock or other regulatory capital instruments, is subject to the review of such proposed actions by the Federal Reserve as part of PNCs comprehensive capital plan for the applicable period in connection with the regulators Comprehensive Capital Analysis and Review (CCAR) process and to the acceptance of such capital plan and non-objection to such capital actions by the Federal Reserve. PNCs regulatory capital ratios in the future will depend on, among other things, the companys financial performance, the scope and terms of final capital regulations then in effect (particularly those implementing the Basel Capital Accords), and management actions affecting the composition of PNCs balance sheet. In addition, PNCs ability to determine, evaluate and forecast regulatory capital ratios, and to take actions (such as capital distributions) based on actual or forecasted capital ratios, will be dependent at least in part on the development, validation and regulatory approval of related models. Legal and regulatory developments could have an impact on our ability to operate our businesses, financial condition, results of operations, competitive position, reputation, or pursuit of attractive acquisition opportunities. Reputational impacts could affect matters such as business generation and retention, liquidity, funding, and ability to attract and retain management. These developments could include: Changes resulting from legislative and regulatory reforms, including major reform of the regulatory oversight structure of the financial services industry and changes to laws and regulations involving tax, pension, bankruptcy, consumer protection, and other industry aspects, and changes in accounting policies and principles. We will be impacted by extensive reforms provided for in the Dodd-Frank Wall Street Reform and Consumer Protection Act (the Dodd-Frank Act) and otherwise growing out of the most recent financial crisis, the precise nature, extent and timing of which, and their impact on us, remains uncertain. Changes to regulations governing bank capital and liquidity standards, including due to the Dodd-Frank Act and to Basel-related initiatives. Unfavorable resolution of legal proceedings or other claims and regulatory and other governmental investigations or other inquiries. In addition to matters relating to PNCs current and historical business and activities, such matters may include proceedings, claims, investigations, or inquiries relating to pre-acquisition business and activities of acquired companies, such as National City. These matters may result in monetary judgments or settlements or other remedies, including fines, penalties, restitution or alterations in our business practices, and in additional expenses and collateral costs, and may cause reputational harm to PNC. Results of the regulatory examination and supervision process, including our failure to satisfy requirements of agreements with governmental agencies. Impact on business and operating results of any costs associated with obtaining rights in intellectual property claimed by others and of adequacy of our intellectual property protection in general.
|
|
Appendix: Cautionary Statement Regarding Forward-Looking Information (continued) Business and operating results are affected by our ability to identify and effectively manage risks inherent in our businesses, including, where appropriate, through effective use of third-party insurance, derivatives, and capital management techniques, and to meet evolving regulatory capital and liquidity standards. In particular, our results currently depend on our ability to manage elevated levels of impaired assets. Business and operating results also include impacts relating to our equity interest in BlackRock, Inc. and rely to a significant extent on information provided to us by BlackRock. Risks and uncertainties that could affect BlackRock are discussed in more detail by BlackRock in its SEC filings. We grow our business in part by acquiring from time to time other financial services companies, financial services assets and related deposits and other liabilities. Acquisition risks and uncertainties include those presented by the nature of the business acquired, including in some cases those associated with our entry into new businesses or new geographic or other markets and risks resulting from our inexperience in those new areas, as well as risks and uncertainties related to the acquisition transactions themselves, regulatory issues, and the integration of the acquired businesses into PNC after closing. Competition can have an impact on customer acquisition, growth and retention and on credit spreads and product pricing, which can affect market share, deposits and revenues. Industry restructuring in the current environment could also impact our business and financial performance through changes in counterparty creditworthiness and performance and in the competitive and regulatory landscape. Our ability to anticipate and respond to technological changes can also impact our ability to respond to customer needs and meet competitive demands. Business and operating results can also be affected by widespread natural and other disasters, pandemics, dislocations, terrorist activities, cyberattacks or international hostilities through impacts on the economy and financial markets generally or on us or our counterparties specifically. We provide greater detail regarding these as well as other factors in our 2015 Form 10-K, including in the Risk Factors and Risk Management sections and the Legal Proceedings and Commitments and Guarantees Notes of the Notes To Consolidated Financial Statements in that report, and in our subsequent SEC filings. Our forward-looking statements may also be subject to other risks and uncertainties, including those we may discuss elsewhere in this presentation or in our SEC filings, accessible on the SECs website at www.sec.gov and on our corporate website at www.pnc.com/secfilings. We have included these web addresses as inactive textual references only. Information on these websites is not part of this document. Any annualized, pro forma, estimated, third party or consensus numbers in this presentation are used for illustrative or comparative purposes only and may not reflect actual results. Any consensus earnings estimates are calculated based on the earnings projections made by analysts who cover that company. The analysts opinions, estimates or forecasts (and therefore the consensus earnings estimates) are theirs alone, are not those of PNC or its management, and may not reflect PNCs or other companys actual or anticipated results.
|
|
Appendix: Basel III Regulatory Capital Ratios As a result of the staggered effective dates of the final U.S. Basel III regulatory capital rules (Basel III rules), as well as the fact that PNC remains in the parallel run qualification phase for the advanced approaches, PNCs regulatory risk-based capital ratios in 2016 and 2015 are calculated using the standardized approach for determining risk-weighted assets, and the definitions of, and deductions from, regulatory capital under the Basel III rules (as such definitions and deductions are phased-in for 2016 and 2015, respectively). We refer to the capital ratios calculated using the phased-in Basel III provisions in effect for each year and, for the risk-based ratios, standardized approach risk-weighted assets, as Transitional Basel III ratios. Under the standardized approach for determining credit risk-weighted assets, exposures are generally assigned a pre-defined risk weight. Exposures to high volatility commercial real estate, past due exposures, equity exposures and securitization exposures are generally subject to higher risk weights than other types of exposures. We provide information on the following page regarding PNCs estimated 2016 and actual 2015 Transitional Basel III common equity Tier 1 ratios and PNCs estimated pro forma fully phased-in Basel III common equity Tier 1 ratio. Under the Basel III rules adopted by the U.S. banking agencies, significant common stock investments in unconsolidated financial institutions, mortgage servicing rights and deferred tax assets must be deducted from capital (subject to a phase-in schedule and net of associated deferred tax liabilities) to the extent they individually exceed 10%, or in the aggregate exceed 15%, of the institutions adjusted common equity Tier 1 capital. Also, Basel III regulatory capital includes (subject to a phase-in schedule) accumulated other comprehensive income related to securities currently and previously held as available for sale, as well as to pension and other postretirement plans.
|
|
Appendix: Basel III Regulatory Capital Ratios
2016 Transitional 2015 Transitional Pro forma Fully Phased-In Basel III
Basel III (estimated) Basel III(estimated)
$ in millions Mar. 31, Dec. 31, Mar. 31, Mar. 31, Dec. 31, Mar. 31,
2016 2015 2015 2016 2015 2015
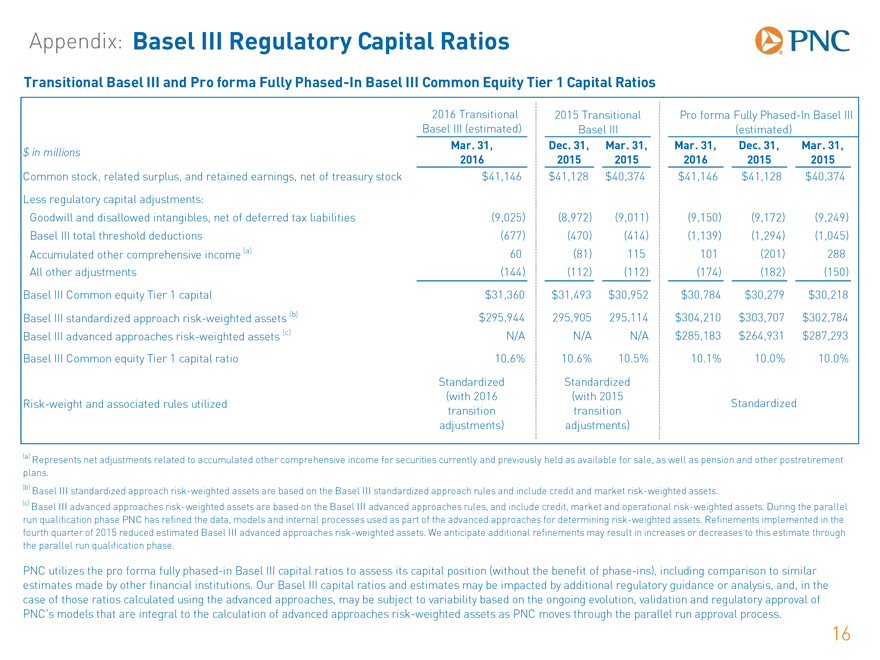
Common stock, related surplus, and retained earnings, net of treasury stock $41,146 $41,128 $40,374 $41,146 $41,128 $40,374
Less regulatory capital adjustments:
Goodwill and disallowed intangibles, net of deferred tax liabilities(9,025)(8,972)(9,011)(9,150)(9,172)(9,249)
Basel III total threshold deductions(677)(470)(414)(1,139)(1,294)(1,045)
Accumulated other comprehensive income (a) 60(81) 115 101(201) 288
All other adjustments(144)(112)(112)(174)(182)(150)
Basel III Common equity Tier 1 capital $31,360 $31,493 $30,952 $30,784 $30,279 $30,218
Basel III standardized approach risk-weighted assets (b) $295,944 295,905 295,114 $304,210 $303,707 $302,784
Basel III advanced approaches risk-weighted assets (c) N/A N/A N/A $285,183 $264,931 $287,293
Basel III Common equity Tier 1 capital ratio 10.6% 10.6% 10.5% 10.1% 10.0% 10.0%
Standardized Standardized
(with 2016(with 2015
Risk-weight and associated rules utilized Standardized
transition transition
adjustments) adjustments)
(a) Represents net adjustments related to accumulated other comprehensive income for securities currently and previously held as available for sale, as well as pension and other postretirement plans.
(b) Basel III standardized approach risk-weighted assets are based on the Basel III standardized approach rules and include credit and market risk-weighted assets.
(c) Basel III advanced approaches risk-weighted assets are based on the Basel III advanced approaches rules, and include credit, market and operational risk-weighted assets. During the parallel run qualification phase PNC has refined the data, models and internal processes used as part of the advanced approaches for determining risk-weighted assets. Refinements implemented in the fourth quarter of 2015 reduced estimated Basel III advanced approaches risk-weighted assets. We anticipate additional refinements may result in increases or decreases to this estimate through the parallel run qualification phase.
PNC utilizes the pro forma fully phased-in Basel III capital ratios to assess its capital position (without the benefit of phase-ins), including comparison to similar estimates made by other financial institutions. Our Basel III capital ratios and estimates may be impacted by additional regulatory guidance or analysis, and, in the case of those ratios calculated using the advanced approaches, may be subject to variability based on the ongoing evolution, validation and regulatory approval of PNCs models that are integral to the calculation of advanced approaches risk-weighted assets as PNC moves through the parallel run approval process.
16
|
|
Appendix: Non-GAAP to GAAP Reconciliation
Tangible Book Value per Common Share Ratio
% Change
3/31/16 3/31/16
$ in millions, except per share data Mar. 31, Dec. 31, Mar. 31, vs. vs.
2016 2015 2015 12/31/15 3/31/15
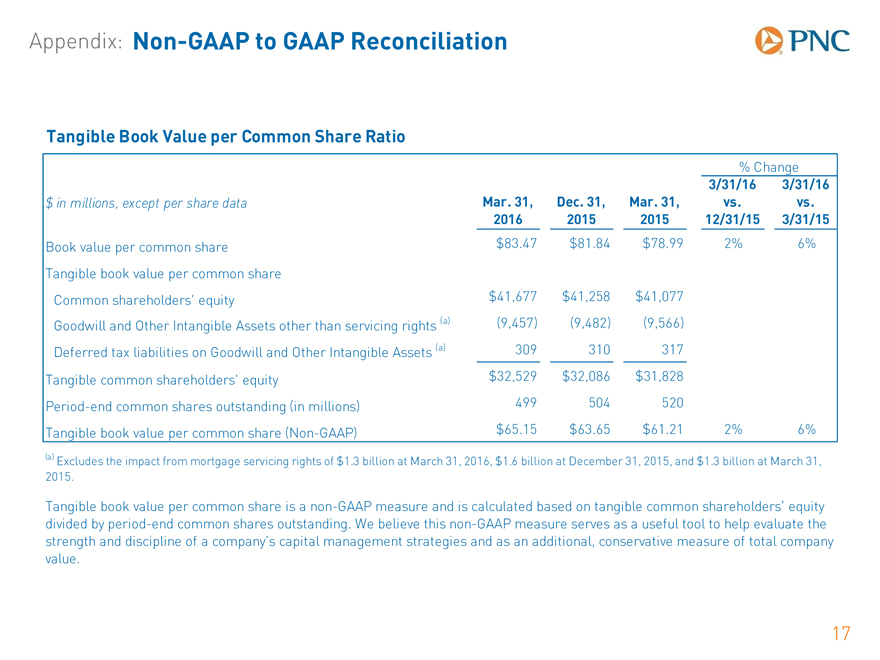
Book value per common share $83.47 $81.84 $78.99 2% 6%
Tangible book value per common share
Common shareholders equity $41,677 $41,258 $41,077
Goodwill and Other Intangible Assets other than servicing rights (a)(9,457)(9,482)(9,566)
Deferred tax liabilities on Goodwill and Other Intangible Assets (a) 309 310 317
Tangible common shareholders equity $32,529 $32,086 $31,828
Period-end common shares outstanding (in millions) 499 504 520
Tangible book value per common share (Non-GAAP) $65.15 $63.65 $61.21 2% 6%
(a) Excludes the impact from mortgage servicing rights of $1.3 billion at March 31, 2016, $1.6 billion at December 31, 2015, and $1.3 billion at March 31,
2015.
Tangible book value per common share is a non-GAAP measure and is calculated based on tangible common shareholders equity
divided by period-end common shares outstanding. We believe this non-GAAP measure serves as a useful tool to help evaluate the
strength and discipline of a companys capital management strategies and as an additional, conservative measure of total company
value.
17
|
|
Appendix: Non-GAAP to GAAP Reconciliation
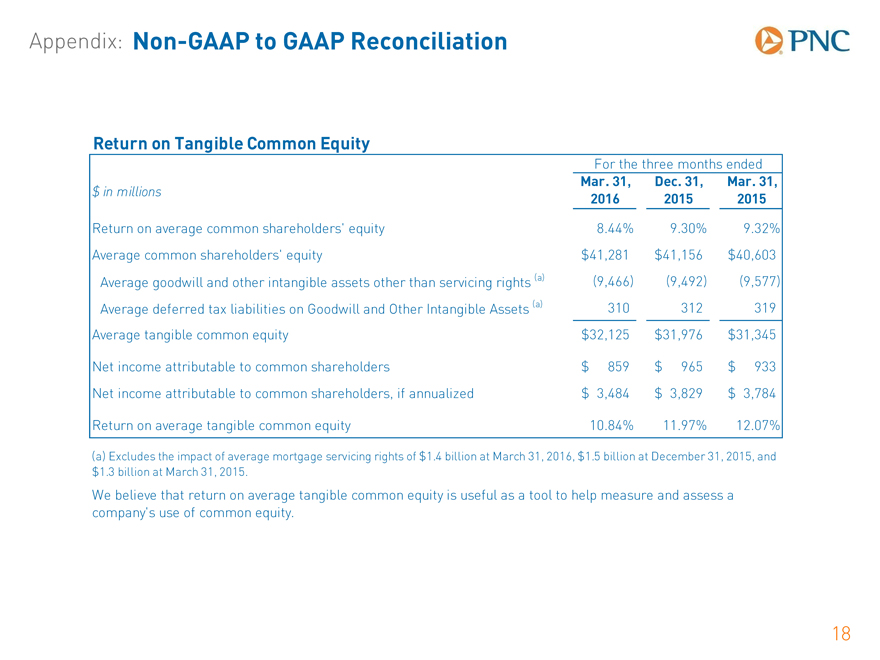
Return on Tangible Common Equity
For the three months ended
Mar. 31, Dec. 31, Mar. 31, $ in millions
2016 2015 2015
Return on average common shareholders equity 8.44% 9.30% 9.32% Average common shareholders equity $41,281 $ 41,156 $40,603 Average goodwill and other intangible assets other than servicing rights (a) (9,466) (9,492) (9,577) Average deferred tax liabilities on Goodwill and Other Intangible Assets (a) 310 312 319 Average tangible common equity $32,125 $ 31,976 $31,345
Net income attributable to common shareholders $ 859 $ 965 $ 933 Net income attributable to common shareholders, if annualized $ 3,484 $ 3,829 $ 3,784
Return on average tangible common equity 10.84% 11.97% 12.07%
(a) Excludes the impact of average mortgage servicing rights of $1.4 billion at March 31, 2016, $1.5 billion at December 31, 2015, and $1.3 billion at March 31, 2015.
We believe that return on average tangible common equity is useful as a tool to help measure and assess a companys use of common equity.
18
|
|
Appendix: Non-GAAP to GAAP Reconciliation
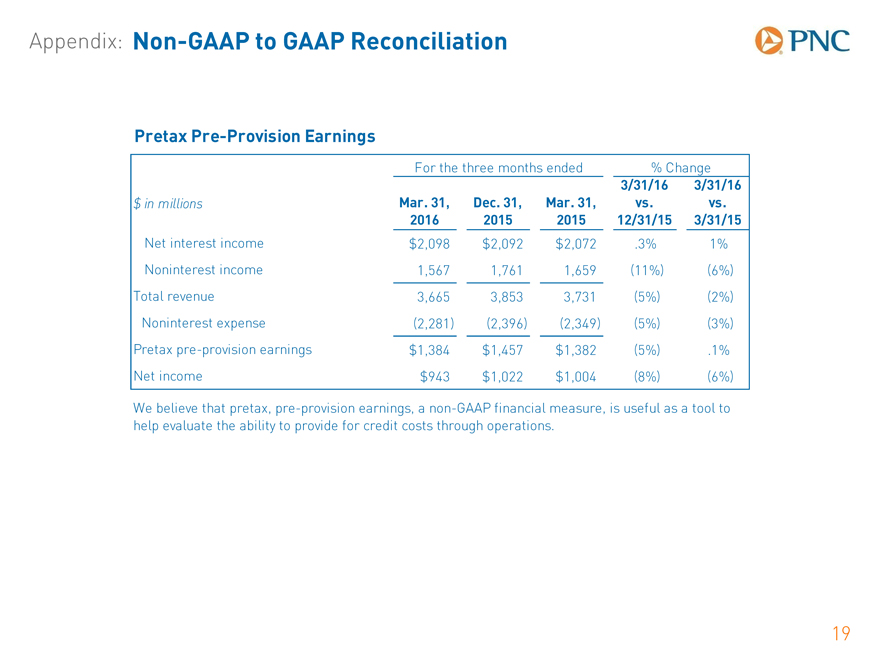
Pretax Pre-Provision Earnings
For the three months ended % Change
3/31/16 3/31/16 $ in millions Mar. 31, Dec. 31, Mar. 31, vs. vs.
2016 2015 2015 12/31/15 3/31/15
Net interest income $2,098 $2,092 $2,072 .3% 1% Noninterest income 1,567 1,761 1,659 (11%) (6%) Total revenue 3,665 3,853 3,731 (5%) (2%) Noninterest expense (2,281) (2,396) (2,349) (5%) (3%) Pretax pre-provision earnings $1,384 $1,457 $1,382 (5%) .1% Net income $943 $1,022 $1,004 (8%) (6%) We believe that pretax, pre-provision earnings, a non-GAAP financial measure, is useful as a tool to help evaluate the ability to provide for credit costs through operations.
18
|
|
Appendix: Non-GAAP to GAAP Reconciliation
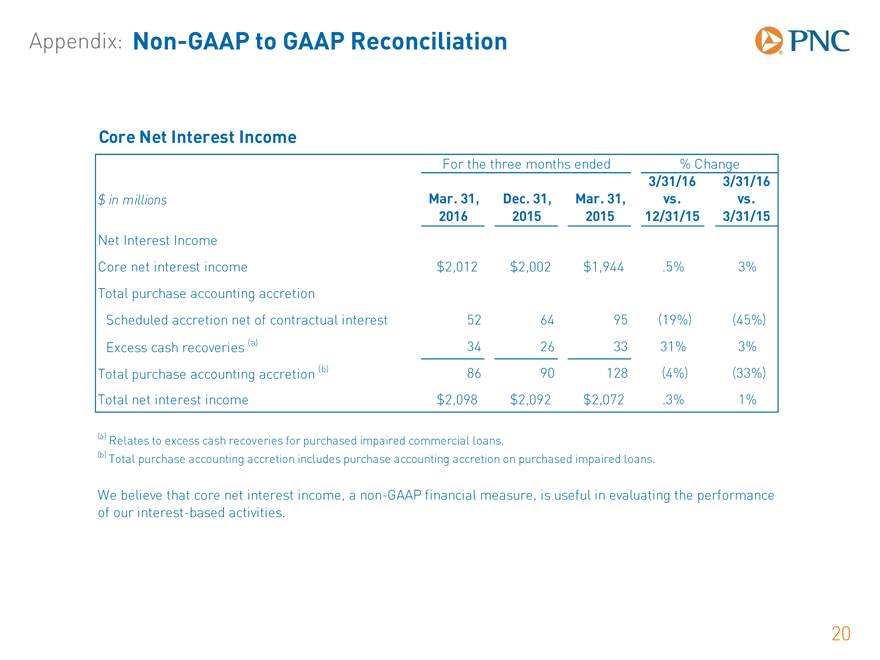
Core Net Interest Income
For the three months ended % Change
3/31/16 3/31/16 $ in millions Mar. 31, Dec. 31, Mar. 31, vs. vs.
2016 2015 2015 12/31/15 3/31/15
Net Interest Income
Core net interest income $2,012 $2,002 $1,944 .5% 3% Total purchase accounting accretion Scheduled accretion net of contractual interest 52 64 95 (19%) (45%) Excess cash recoveries (a) 34 26 33 31% 3% Total purchase accounting accretion (b) 86 90 128 (4%) (33%) Total net interest income $2,098 $2,092 $2,072 .3% 1%
(a) Relates to excess cash recoveries for purchased impaired commercial loans.
(b) Total purchase accounting accretion includes purchase accounting accretion on purchased impaired loans.
We believe that core net interest income, a non-GAAP financial measure, is useful in evaluating the performance of our interest-based activities.
|
|
Appendix: Non-GAAP to GAAP Reconciliation
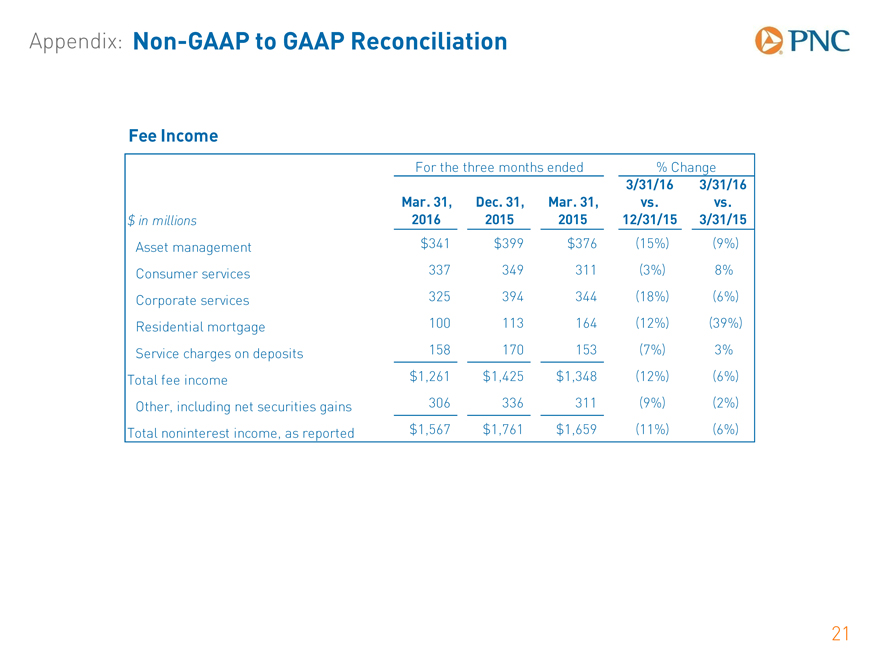
Fee Income
For the three months ended % Change
3/31/16 3/31/16 Mar. 31, Dec. 31, Mar. 31, vs. vs. $ in millions 2016 2015 2015 12/31/15 3/31/15
Asset management $341 $399 $376 (15%) (9%) Consumer services 337 349 311 (3%) 8% Corporate services 325 394 344 (18%) (6%) Residential mortgage 100 113 164 (12%) (39%) Service charges on deposits 158 170 153 (7%) 3% Total fee income $1,261 $1,425 $1,348 (12%) (6%) Other, including net securities gains 306 336 311 (9%) (2%) Total noninterest income, as reported $1,567 $1,761 $1,659 (11%) (6%)
21