EX-99.1
Published on September 9, 2013

The PNC
Financial Services Group, Inc. Barclays Global Financial Services
Conference
September 9, 2013
Exhibit 99.1 |

2
Cautionary Statement Regarding Forward-Looking
Information and Adjusted Information
This presentation includes snapshot
information about PNC used by way of illustration. It is not intended as a full business or
financial review and should be viewed in the context of all of the information made
available by PNC in its SEC filings. The presentation also contains
forward-looking
statements
regarding
our
outlook
for
earnings,
revenues,
expenses,
capital
levels
and
ratios,
liquidity
levels,
asset
levels,
asset quality, financial position, and other matters regarding or affecting PNC and its future
business and operations. Forward-looking statements are necessarily subject to
numerous assumptions, risks and uncertainties, which change over time. The forward-looking
statements in this presentation are qualified by the factors affecting forward-looking
statements identified in the more detailed Cautionary Statement included in the
Appendix, which is included in the version of the presentation materials posted on our corporate website at
www.pnc.com/investorevents
and in our SEC filings. We provide greater detail regarding these as well as other factors in
our 2012 Form 10-K and our 2013 Form 10-Qs, including in the Risk Factors and
Risk Management sections and in the Legal Proceedings and Commitments and Guarantees
Notes of the Notes To Consolidated Financial Statements in those reports, and in our subsequent SEC filings. Our forward-
looking statements may also be subject to other risks and uncertainties, including those we
may discuss in this presentation or in SEC filings, accessible on the SECs
website at www.sec.gov and on PNCs corporate website at www.pnc.com/secfilings. We have included web
addresses in this presentation as inactive textual references only. Information on these
websites is not part of this presentation. Future events or circumstances may change
our outlook and may also affect the nature of the assumptions, risks and uncertainties to which our
forward-looking statements are subject. Forward-looking statements in this
presentation speak only as of the date of this presentation. We do not assume any duty
and do not undertake to update those statements. Actual results or future events could differ, possibly materially,
from those anticipated in forward-looking statements, as well as from historical
performance. In
this
presentation,
we
may
sometimes
refer
to
adjusted
results
to
help
illustrate
the
impact
of
certain
types
of
items.
This
information
supplements our results as reported in accordance with GAAP and should not be viewed in
isolation from, or as a substitute for, our GAAP results. We believe that this
additional information and the reconciliations we provide may be useful to investors, analysts, regulators and
others to help evaluate the impact of these respective items on our operations. We may also
provide information on the components of net interest income (purchase accounting
accretion and the core remainder), on pretax pre-provision earnings (total revenue less noninterest
expense) and on tangible book value per share (calculated as book value per share less total
intangible assets, other than servicing rights, per share). Where applicable, we
provide GAAP reconciliations for such additional information, including in the slides, the Appendix and/or
other slides and materials on our corporate website at www.pnc.com/investorevents and in our
SEC filings. We may also use annualized, proforma, estimated or third party numbers for
illustrative or comparative purposes only. These may not reflect actual results. This
presentation may also include discussion of other non-GAAP financial measures, which, to the extent not so qualified therein or in the
Appendix, is qualified by GAAP reconciliation information available on our corporate website
at www.pnc.com under About PNCInvestor Relations.
|
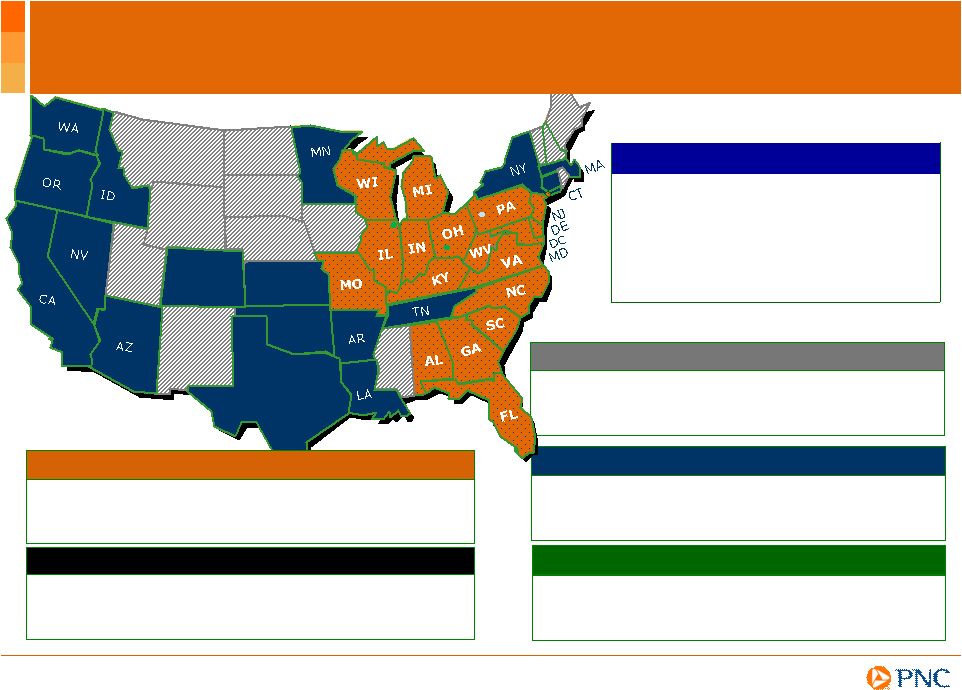
3
Corporate & Institutional
A leader in serving middle-market,
large corporate, government and
non-profit entities
A top 10 U.S. bank-held wealth
manager
Asset Management
Residential Mortgage
National distribution capabilities and
enhanced brand recognition
(1) Rankings source: SNL DataSource; Holding companies (for assets) or Banks (for deposits,
branches and ATMs) headquartered in U.S. Assets rank excludes Morgan Stanley and
Goldman Sachs. CO
TX
KS
OK
BlackRock
A leader in investment management, risk
management and advisory services
worldwide
June 30, 2013
U.S. Rank
(1)
Deposits
$212B
7
th
Assets
$304B
7
th
Branches
2,780
4
th
ATMs
7,335
3
rd
Footprint covering nearly half of the U.S.
population
Retail Banking
Expanding our Leading Franchise |

4
Todays Discussion
Enhancing shareholder value through focused
execution of strategic priorities
Demonstrated progress on strategic priorities
Stronger capital position
greater flexibility for
capital returns
PNC Is Well-Positioned to Continue to Create Shareholder Value.
|

5
Well-Positioned to Deliver Long-Term Value
Targeted
Outcomes
(1)
Drive growth in
newly acquired &
underpenetrated
markets
Build a stronger
Residential
Mortgage business
Manage expenses
Increase
Fee income
Expand
market share
Leverage
cross-sales
Improve operating
efficiencies
Strategic Priorities
(1) Refer to Cautionary Statement in the Appendix, including economic and other assumptions.
Does not take into account impact of potential legal and regulatory
contingencies. Redefine the Retail
Banking business
Capture more
investable assets |
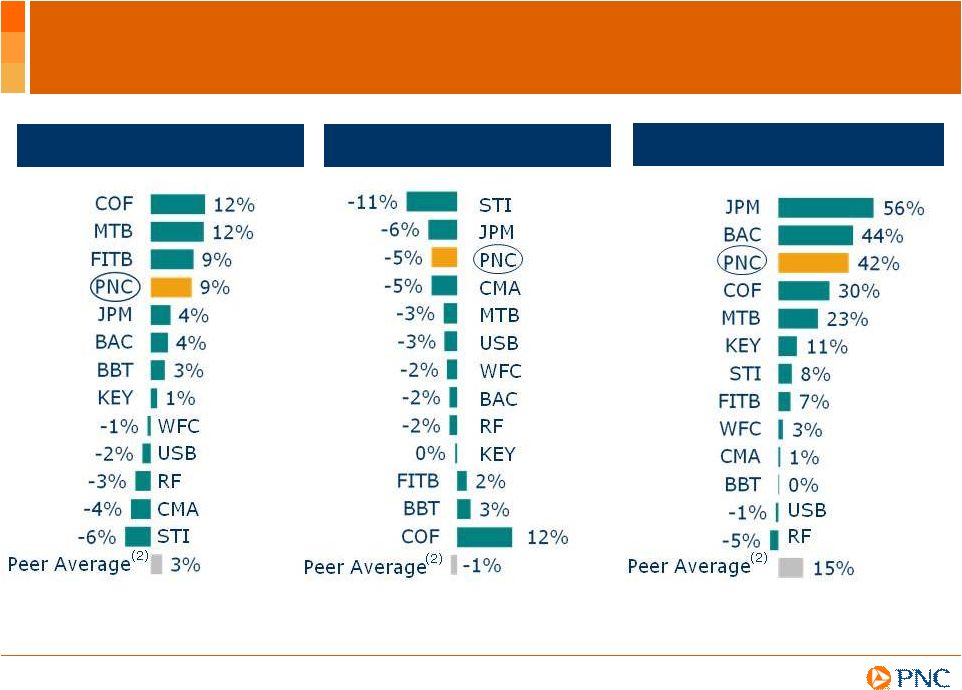
6
1H12-1H13
Expense growth
1H12-1H13
Revenue growth
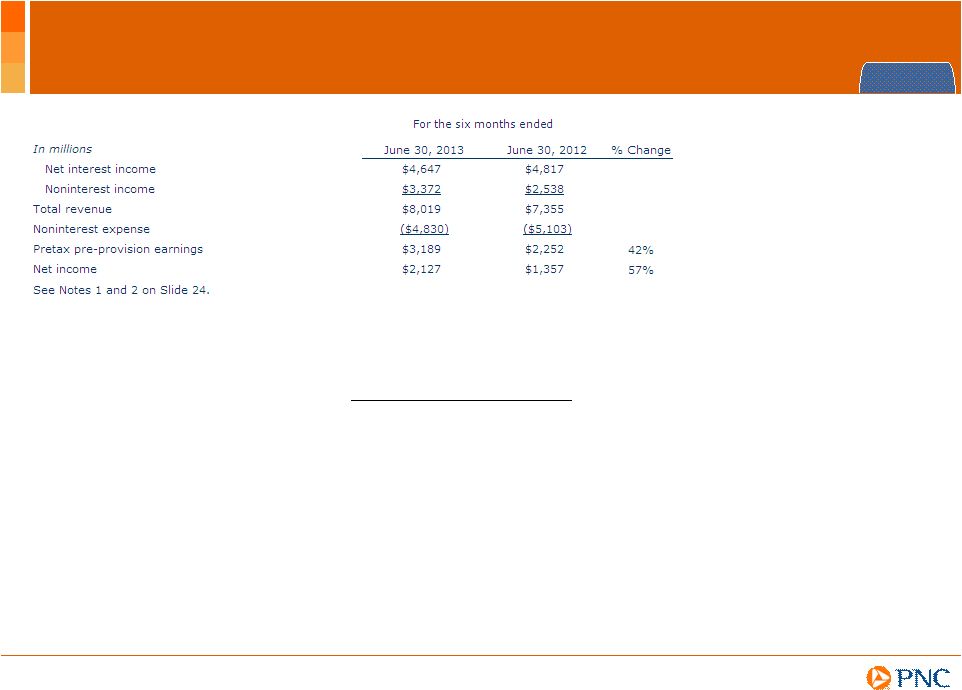
Focused Execution Yielding Results
1H12-1H13 Pretax
Pre-provision
earnings
growth
(1)
(1)
See Appendix for PNC reconciliation. See Notes 1 and 2 in the Appendix for further details.
(2) Peer Source: SNL Datasource. See Note 3 in the Appendix for further details.
|
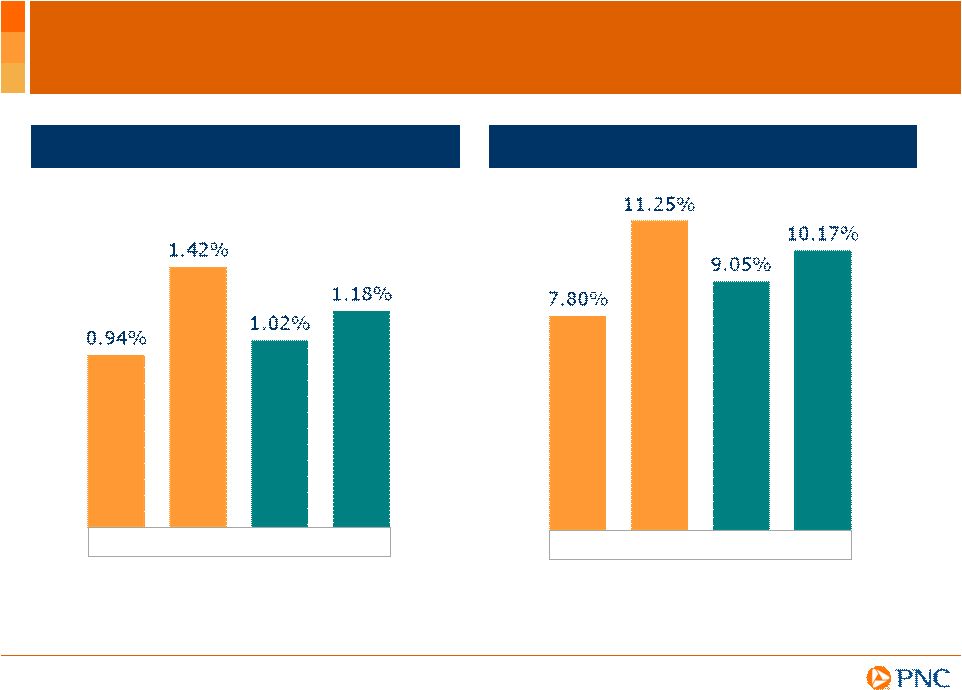
7
Achieving Higher Returns
Return on average
assets
Return on average
shareholders
common equity
PNC
1H12
1H13
1H12
1H13
Peer Average
PNC
1H12
1H13
1H12
1H13
Peer Average
(1) Peer Source: SNL DataSource. See Note 3 in the Appendix for further details.
(1)
(1) |
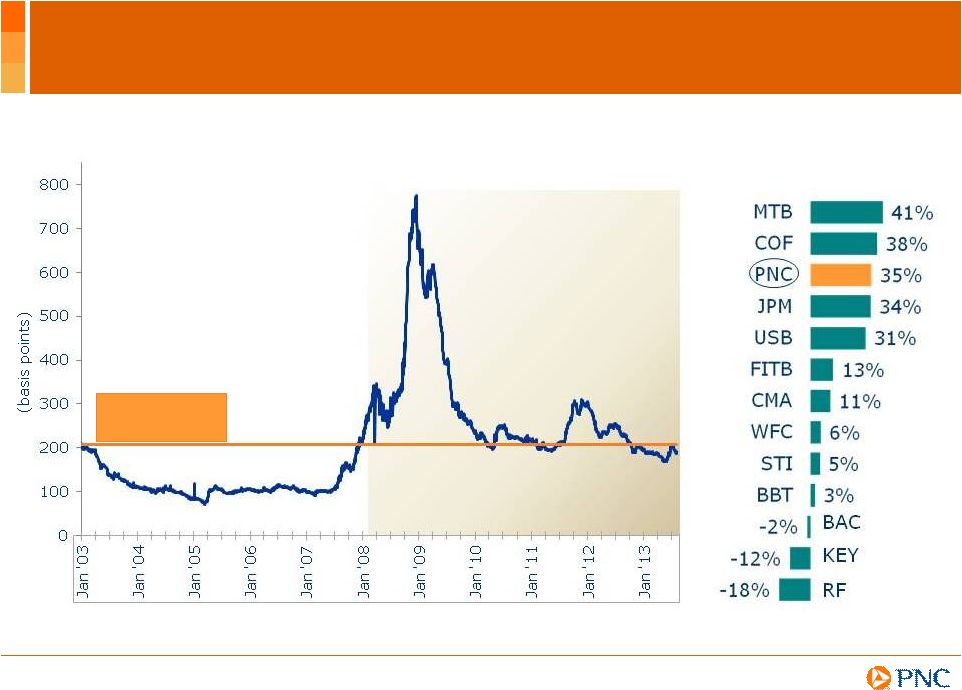
8
Optimizing Returns through the Cycle
Average
207
(1)
(1) Average is calculated from January 2, 2003 through August 2,
2013. Source: Moodys. (2) PNCs commercial loan balance
includes commercial, commercial real estate and equipment lease financing. Peer Source: SNL
Datasource except BBT, BAC, COF and JPM, which are from company reports. JPM and COF
loan growth reflects commercial banking segment reported in company
reports. BAC loan growth reflects U.S. commercial loan balances only, as reported in its
company report. Growth in
Commercial
Loans
(2)
(12/31/09 to 6/30/13)
5 Year BBB Corporate Bond Spreads
Premium risk-
adjusted returns |
9
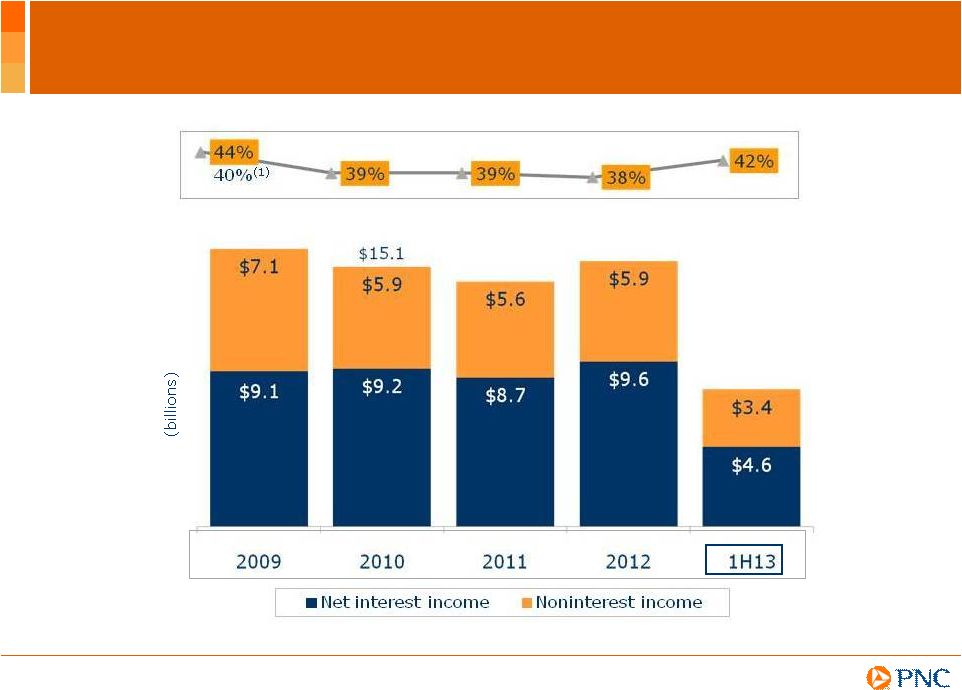
Investing in Opportunities to Grow Fee Income
$16.2
$14.3
$15.5
$8.0
Noninterest income % of total revenue
(1) Noninterest income percentage of total revenue adjusted for pre-tax gain of $1.076
billion related to BlackRocks acquisition of Barclays Global Investors on
December 1, 2009. See Appendix for reconciliation. |
10
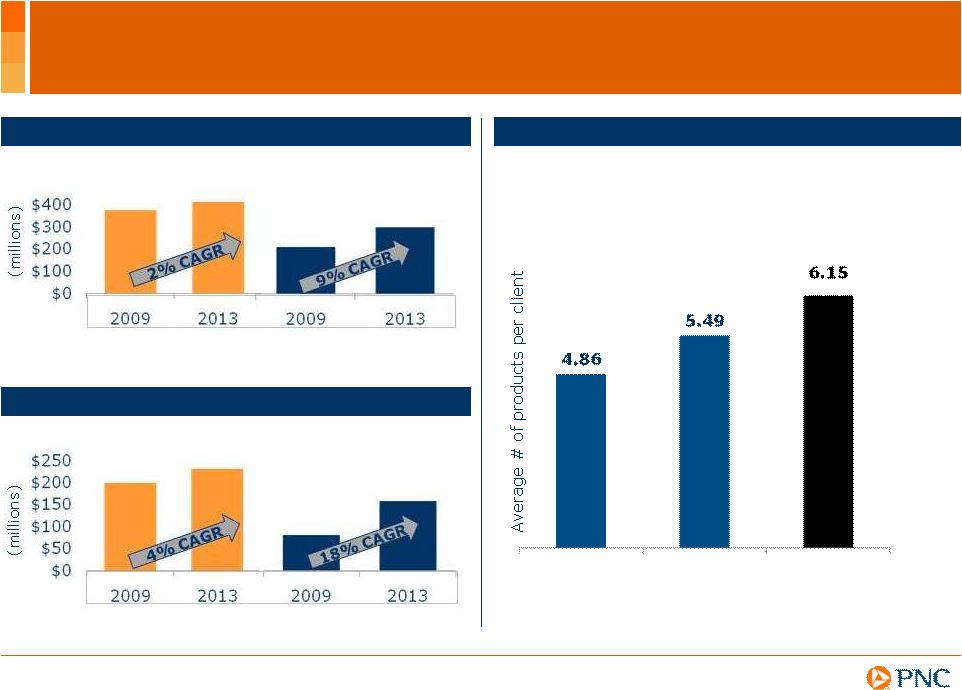
Deeper Penetration and Cross-sell in Underpenetrated
Markets
Total Corporate Banking and AMG sales
Total Corporate Banking and AMG cross-sales
Actual
Annualized
AMG refers to Asset Management Group. (1) 2013 sales and cross-sales through June 30, 2013
annualized. (2) Represents PNCs Corporate Banking clients excluding new
clients of less than three years as of 12/31/12. A Corporate Banking primary client is defined
as a corporate banking relationship with annual revenue generation of $50,000 or more or,
within corporate banking, a commercial banking client relationship with annual revenue
generation of $10,000 or more. Actual
Annualized
Leveraging cross-sell opportunity
Product Growth
New Corporate Banking Primary
Clients
Annualized
Actual
Northeast
Midwest
Northeast
Midwest
(1)
Actual
Annualized
(1)
(1)
(1)
New client
Year 1
New client
Year 2
Existing
clients
(2) |
11
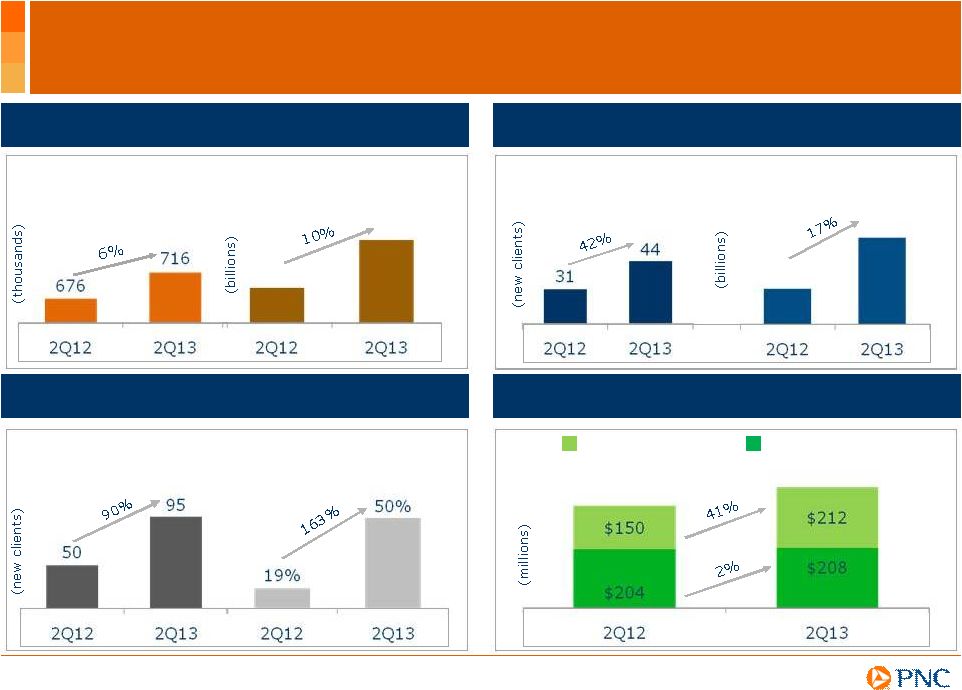
Building Momentum in Southeast Markets
(1)
(1)
Southeast
markets
defined
as
Alabama,
Georgia,
North
Carolina,
South
Carolina,
Florida
West,
Florida.
(2)
Total
DDA
households
refers
to
consumer
accounts.
(3)
A
Corporate
Banking
primary
client
is
defined
as
a
corporate
banking
relationship
with
annual
revenue
generation
of $50,000 or
more or, within corporate banking, a commercial banking client relationship with annual
revenue generation of $10,000 or more. (4) Asset Management Group primary client is
defined as a client relationship with annual revenue generation of $10,000 or more. (5) A mortgage with a borrower as part of a
residential real estate purchase transaction.
Asset Management Group
Residential Mortgage
Retail Banking
Corporate & Institutional Banking
Purchase
(5)
Total DDA households
(2)
Corporate Banking
new primary clients
(3)
New primary clients
(4)
Refinance
$5.9
$6.5
Average Loans
Average Loans
Referral sales % of total sales
$5.1
$6.0
$354
$420 |
12
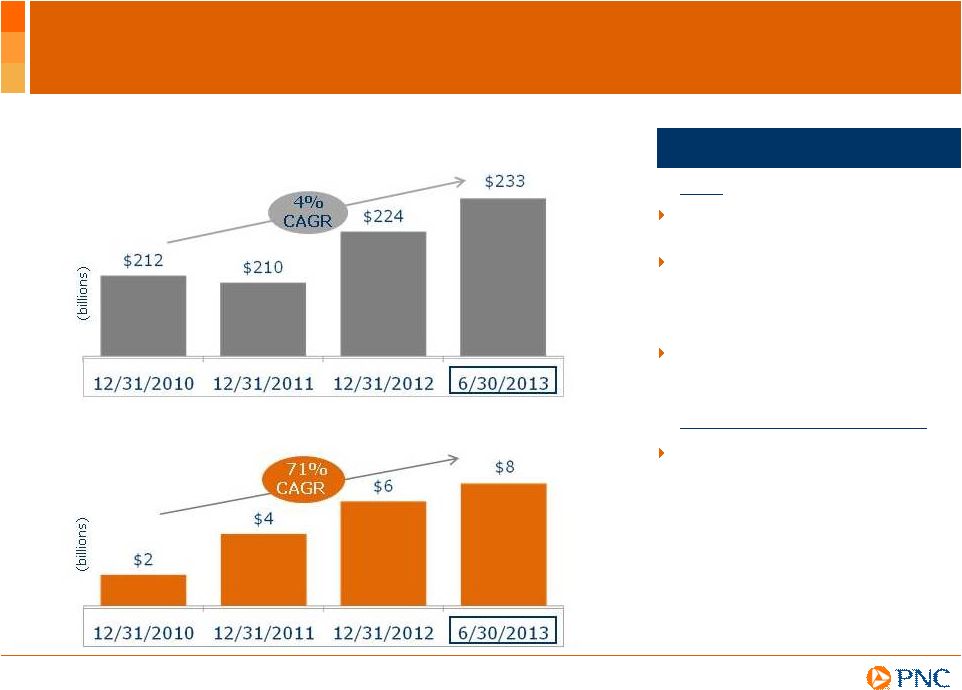
Capturing More Investable Assets
Highlights
Retail Banking -
Brokerage Managed Account Assets
AMG
Continued momentum in asset
growth
Managed Account assets
increased 39% through 1H13
when compared to 1H12
Total Brokerage account
assets of $39 billion up 8% at
end of 2Q13 compared to end
of 2Q prior year
AUA increased 4% from
12/31/12 to 6/30/13
Core net flows
(1)
of $2.1 billion
in Discretionary AUM in 1H13
and $4.5 billion over last four
quarters
Fees accelerating with core net
flows and new business
AMG -
Assets Under Administration (AUA)
AMG refers to Asset Management Group. AUM refers to assets under management. (1) After
adjustment to total net flows for cyclical client activities.
Retail Banking Brokerage |
13
Old Model
Outcomes
New Model
Responses
Transforming our Retail Banking Model
Transitioning model based on innovation and premium value
Expectations of free
Changing customer preferences
Reduced revenue sources
Expensive distribution
New checking continuum
Fair value exchange and brand
Value-based revenue model
Redefine the branch network |
14
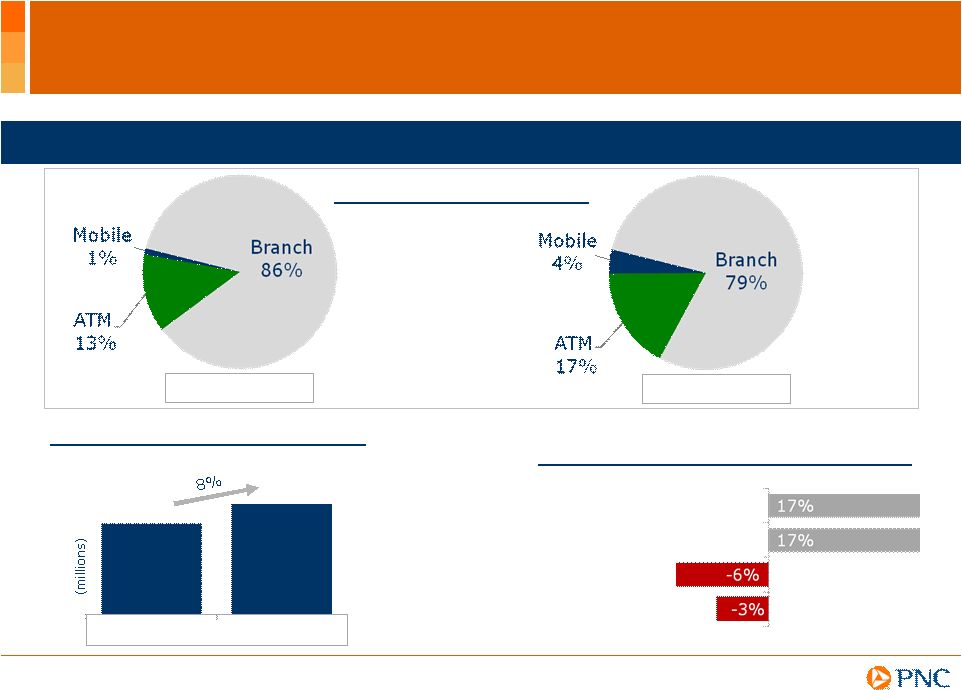
4.0
4.3
June 2012
June 2013
Successfully
migrating
customers
to
self-service
ATM/Mobile
usage
increasing
Retail Banking
Redefining the Branch Network
YTD May 2012
YTD May 2013
Active online banking customers
Total deposit transactions
Retail Banking Headcount (HC)
6 month change
Investment Professionals
Call Center Representatives
Tellers
Total HC
(Dec. 2012 vs. Jun.
2013)
|

15
Retail Banking
Redefining the Branch
Current technology initiatives
Investing in technology
Video advisor
Employee tablet
Video wall
Deposit easy ATMs
New branch formats
Flexible spaces
New sales and
services focus
Assisted ATM
Video teller
Instant card
issuance
Mobile tablet
account opening
Future technology initiatives
Proprietary, joint research
PNC
Financial Innovation Center with
Carnegie Mellon University |
16
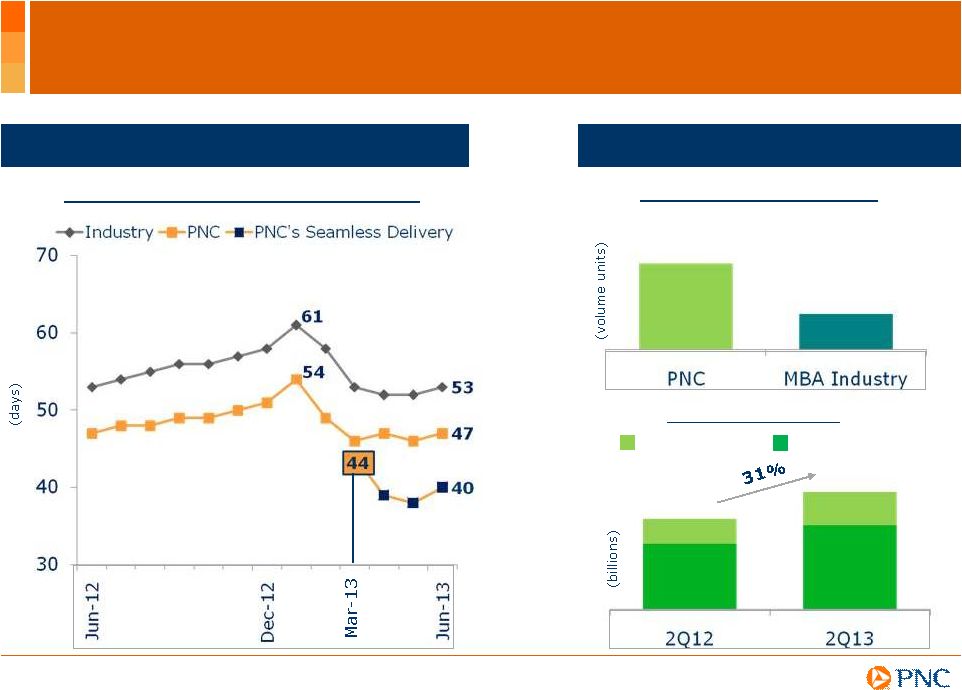
Building a Stronger Residential Mortgage Banking
Business
Improving operational excellence and
customer experience
Purchase Applications to Close Date
(1) See Note 4 in Appendix for additional details on PNCs mortgage origination customer
loyalty. (2) A mortgage with a borrower as part of a residential real estate purchase
transaction. (3) PNC Purchase Applications Source: Mortgage Finance data warehouse. (4) Mortgage Bankers
Association (MBA) Purchase Applications Source: Monthly profile of state and national mortgage
activity (June 2012, June 2013) publications. (5) Impact on the majority of Purchase
applications to close date since seamless delivery program rollout began in March 2013.
Grow the Purchase business
Purchase
(2)
Applications
12%
29%
(3)
(4)
Purchase
(2)
Refinance
$3.6
$4.7
(2Q13 vs. 2Q12)
Origination Volume
Seamless
Delivery
Rollout
(5)
PNCs customer
loyalty
(1)
has
increased 17%
since rollout |
17
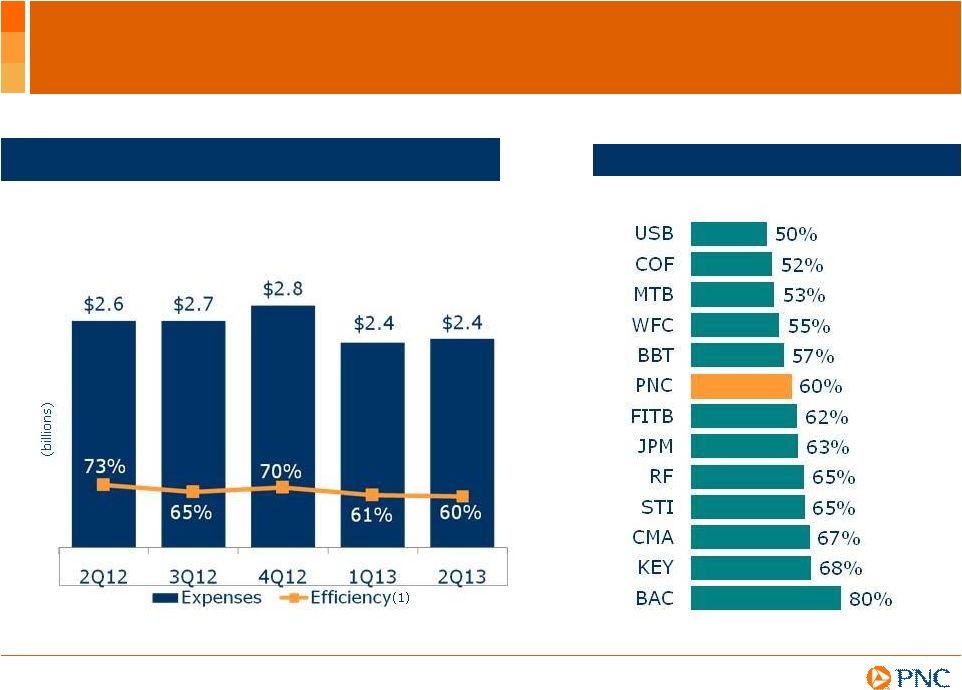
Executing on our Expense Objectives
Noninterest expense trend
(1) Noninterest expense divided by total revenue.
1H13
Efficiency
(1)
ratio |
18
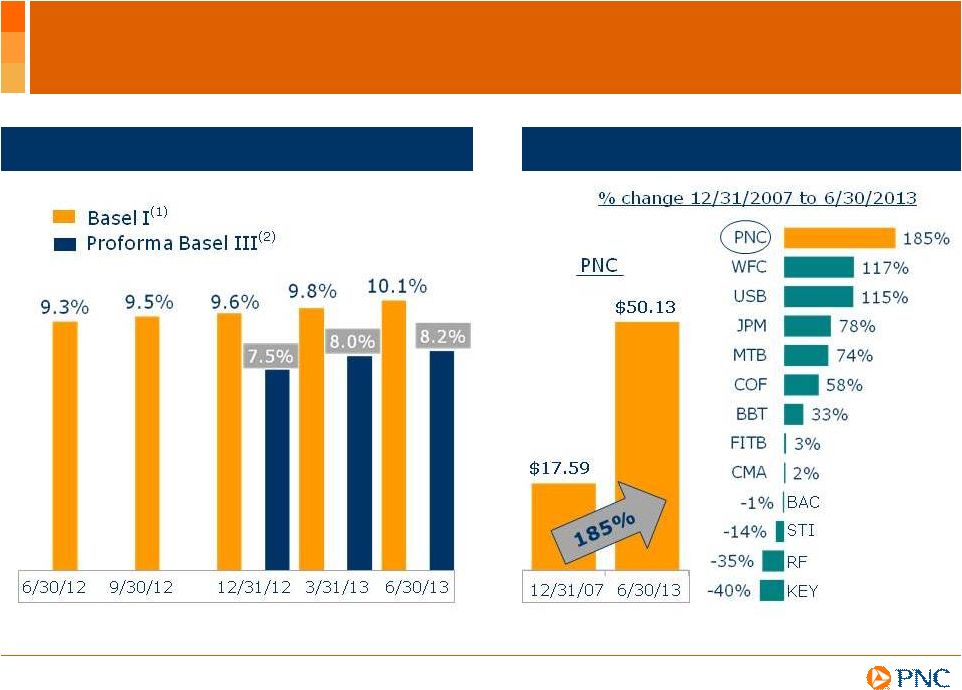
Stronger Capital and Increased Value
(1) See Note 5 in the Appendix for further details. (2) Estimated without benefit of
phase-ins; estimate not provided for 2Q12 or 3Q12. Pending completion
of PNCs evaluation of the Basel III final rules adopted in July 2013, estimates based on our understanding of the prior U.S. Basel III
rule
proposals issued in 2012. We do not believe the changes in the final rules from the proposals
will negatively impact our common capital ratio. See Estimated Pro forma Basel III Tier
1 Common Capital and related information in the Appendix for further details. (3) Peer
source: SNL Datasource. See Note 6 and PNC reconciliation in Appendix for further details.
Tangible
Book
Value
Per
Share
(3)
Tier 1 Common Capital Ratio |

19
Key Take-Aways
Enhancing shareholder value through focused
execution of strategic priorities
Demonstrated progress on strategic priorities
Stronger capital position
greater flexibility for
capital returns
PNC Is Well-Positioned to Continue to Create Shareholder Value.
|

20
Cautionary Statement Regarding Forward-Looking
Information
This presentation includes snapshot
information about PNC used by way of illustration and is not intended as a full business or
financial review. It should not be viewed in isolation but rather in the context
of all of the information made available by PNC in its SEC filings. We also make
statements in this presentation, and we may from time to time make other statements, regarding our outlook for earnings,
revenues, expenses, capital levels and ratios, liquidity levels,
asset levels, asset quality, financial position, and other matters regarding or
affecting PNC and its future business and operations that are forward-looking statements
within the meaning of the Private Securities Litigation Reform Act.
Forward-looking statements are typically identified by words such as believe,
plan,
expect,
anticipate,
see,
look,
intend,
outlook,
project,
forecast,
estimate,
goal,
will,
should
and other similar words and expressions. Forward-
looking statements are subject to numerous assumptions, risks and uncertainties, which change
over time. Forward-looking statements speak only as of the date made. We do
not assume any duty and do not undertake to update forward-looking
statements. Actual results or future events could differ, possibly materially, from
those anticipated in forward-looking statements, as well as from historical
performance. Our forward-looking statements are subject to the following principal
risks and uncertainties. Our businesses, financial results and balance sheet
values are affected by business and economic conditions, including the following:
Changes in interest rates and valuations in debt, equity and other financial markets.
Disruptions in the liquidity and other functioning of U.S. and global financial
markets. The impact on financial markets and the economy of any changes in the credit
ratings of U.S. Treasury obligations and other U.S. government-backed debt, as well
as issues surrounding the level of U.S. and European government debt and concerns
regarding the creditworthiness of certain sovereign governments, supranationals and
financial institutions in Europe. Actions by the Federal Reserve, U.S. Treasury and
other government agencies, including those that impact money supply and market interest
rates. Changes in customers, suppliers
and other counterparties
performance and creditworthiness.
Slowing or reversal of the current moderate economic expansion.
Continued effects of aftermath of recessionary conditions and uneven spread of positive
impacts of recovery on the economy and our counterparties, including adverse impacts on
levels of unemployment, loan utilization rates, delinquencies, defaults and
counterparty ability to meet credit and other obligations.
Changes in customer preferences and behavior, whether due to changing business and economic
conditions, legislative and regulatory initiatives, or other factors.
Our forward-looking financial statements are subject to the risk that economic and
financial market conditions will be substantially different than we are currently
expecting. These statements are based on our current view that the moderate U.S. economic expansion will persist,
despite drags from Federal fiscal restraint and a European recession, and short-term
interest rates will remain very low but bond yields will be higher in the second half
of 2013. These forward-looking statements also do not, unless otherwise indicated, take
into account the
impact of potential legal and regulatory contingencies.
Appendix |

21
Cautionary Statement Regarding Forward-Looking
Information (continued)
PNCs ability to take certain capital actions, including paying dividends and any plans
to increase common stock dividends, repurchase common stock under current or future
programs, or issue or redeem preferred stock or other regulatory capital instruments, is subject to
the review of such proposed actions by the Federal Reserve as part of PNCs comprehensive
capital plan for the applicable period in connection with the regulators
Comprehensive Capital Analysis and Review (CCAR) process and to
the acceptance of such capital plan and
non-objection to such capital actions by the Federal Reserve.
PNCs regulatory capital ratios in the future will depend on, among other things,
the companys financial performance, the scope and terms of final capital
regulations then in effect (particularly those implementing the Basel Capital Accords), and management actions affecting the
composition of PNCs balance sheet. In addition, PNCs ability to determine,
evaluate and forecast regulatory capital ratios, and to take
actions (such as capital distributions) based on actual or forecasted capital ratios, will be
dependent on the ongoing development, validation and regulatory approval of related
models. Legal and regulatory developments could have an impact on our ability to
operate our businesses, financial condition, results of operations,
competitive position, reputation, or pursuit of attractive acquisition opportunities.
Reputational impacts could affect matters such as
business generation and retention, liquidity, funding, and ability to attract and retain
management. These developments could include: Changes resulting from legislative
and regulatory reforms, including major reform of the regulatory oversight structure of the
financial services industry and changes to laws and regulations involving tax, pension,
bankruptcy, consumer protection, and other industry aspects, and changes in accounting
policies and principles. We will be impacted by extensive reforms provided for in the
Dodd-Frank Wall Street Reform and Consumer Protection Act (the Dodd-Frank
Act) and otherwise growing out of the recent financial crisis, the precise
nature, extent and timing of which, and their impact on us, remains uncertain. Changes
to regulations governing bank capital and liquidity standards, including due to the Dodd-Frank Act and to Basel-related
initiatives.
Unfavorable resolution of legal proceedings or other claims and regulatory and other
governmental investigations or other inquiries. In addition to matters relating
to PNCs business and activities, such matters may include proceedings, claims,
investigations, or inquiries relating to pre-acquisition business and activities of
acquired companies, such as National City. These matters may result in monetary
judgments or settlements or other remedies, including fines, penalties, restitution or
alterations in our business practices, and in additional expenses and collateral costs,
and may cause reputational harm to PNC. Results of the regulatory examination and
supervision process, including our failure to satisfy requirements of agreements with
governmental agencies.
Impact on business and operating results of any costs associated
with obtaining rights in intellectual property claimed by others
and of adequacy of our intellectual property protection in general.
Appendix |

22
Cautionary Statement Regarding Forward-Looking
Information (continued)
Business and operating results are affected by our ability to identify and effectively
manage risks inherent in our businesses, including, where appropriate, through
effective use of third-party insurance, derivatives, and capital management techniques,
and to meet evolving
regulatory capital standards. In particular, our results currently depend on our ability
to manage elevated levels of impaired assets. Business and operating results also
include impacts relating to our equity interest in BlackRock, Inc. and rely to a significant
extent on
information provided to us by BlackRock. Risks and uncertainties that could affect
BlackRock are discussed in more detail by BlackRock in its SEC filings.
We grow our business in part by acquiring from time to time other financial services
companies, financial services assets and related deposits and other liabilities.
Acquisition risks and uncertainties include those presented by the nature of the business acquired, including
in some cases those associated with our entry into new businesses or new geographic or other
markets and risks resulting from our inexperience in those new areas, as well as risks
and uncertainties related to the acquisition transactions themselves, regulatory issues, and
the integration of the acquired businesses into PNC after closing.
Competition can have an impact on customer acquisition, growth and retention and on
credit spreads and product pricing, which can affect market share, deposits and
revenues. Industry restructuring in the current environment could also impact our business and financial
performance through changes in counterparty creditworthiness and
performance and in the competitive and regulatory landscape. Our
ability to anticipate and respond to technological changes can also impact our ability to
respond to customer needs and meet competitive demands.
Business and operating results can also be affected by widespread natural and other
disasters, dislocations, terrorist activities or international hostilities through
impacts on the economy and financial markets generally or on us or our counterparties specifically.
We provide greater detail regarding these as well as other factors in our 2012 Form 10-K
and 2013 Form 10-Qs, including in the Risk Factors and Risk Management sections and
the Legal Proceedings and Commitments and Guarantees Notes of the Notes To Consolidated
Financial Statements in those reports, and in our subsequent SEC
filings. Our forward-looking statements may also be subject to other
risks and uncertainties, including those we may discuss elsewhere in this presentation or in
SEC filings, accessible on the SECs website at www.sec.gov and on our corporate
website at www.pnc.com/secfilings. We have included these web addresses as inactive textual
references only. Information on these websites is not part of this document.
Any annualized, proforma, estimated, third party or consensus numbers in this presentation are
used for illustrative or comparative purposes only and may not reflect actual
results. Any consensus earnings estimates are calculated based on the earnings
projections made by analysts who cover that company. The analysts
opinions, estimates or forecasts (and therefore the consensus earnings estimates) are
theirs alone, are not those of PNC or its management, and may not reflect PNCs or other
companys actual or anticipated results. Appendix |

23
Notes
Appendix |

24
Estimated Pro forma Basel III Tier 1 Common Capital
Appendix
Basel I Tier 1 Common Capital Ratio
Dollars in millions
June 30, 2013
March 31, 2013
December 31, 2012
Basel I Tier 1 common capital
$26,668
$25,680
$24,951
Basel I risk-weighted assets, including off-balance sheet instruments and market risk
equivalent assets 264,750
261,491
260,847
Basel I Tier 1 common capital ratio
10.1%
9.8%
9.6%
Estimated Pro forma Basel III Tier 1 Common Capital Ratio
Dollars in millions
June 30, 2013
March 31, 2013
December 31, 2012
Basel I Tier 1 common capital
$26,668
$25,680
$24,951
Less regulatory capital adjustments:
Basel III quantitative limits
(2,224)
(2,076)
(2,330)
Accumulated other comprehensive income (a)
(241)
289
276
All other adjustments
(283)
(367)
(396)
Estimated Basel III Tier 1 common capital
$23,920
$23,526
$22,501
Estimated Basel III risk-weighted assets
290,838
293,810
301,006
Pro forma Basel III Tier 1 common capital ratio
8.2%
8.0%
7.5%
(a) Represents net adjustments related to accumulated other comprehensive income for available
for sale securities and pension and other postretirement benefit plans.
We provide information below regarding PNCs pro forma fully phased-in Basel III Tier
1 common capital ratio using PNC's estimated Basel III advanced approaches
risk-weighted assets and how it differs from the Basel I Tier 1 common capital ratio. This Basel III ratio will replace the current Basel I ratio for Tier
1 common capital when PNC exits the parallel run qualification phase. The Federal Reserve
Board announced final rules implementing Basel III on July 2, 2013. PNC continues its
evaluation of these rules. Pending completion of that evaluation, we have estimated our Basel III capital information set forth below based on
our understanding of the prior U.S. Basel III rule proposals issued in 2012.
Tier 1 common capital as defined under the Basel III rules differs materially from Basel I.
For example, under Basel III, significant common stock investments in unconsolidated
financial institutions, mortgage servicing rights and deferred tax assets must be deducted from capital to the extent they individually exceed
10%, or in the aggregate exceed 15%, of the institution's adjusted Tier 1 common capital.
Also, Basel I regulatory capital excludes certain other comprehensive income related to
both available for sale securities and pension and other postretirement plans, whereas under Basel III these items are a component of PNC's
capital. Basel III risk-weighted assets were estimated under the advanced approaches
included in the Basel III proposed rules and application of Basel II.5, and reflect
credit, market and operational risk. PNC utilizes this capital ratio estimate to assess
its Basel III capital position (without the benefit of phase-ins), including comparison to similar estimates made
by other financial institutions. This Basel III capital estimate is likely to be impacted by
PNC's ongoing analysis of the recently issued Basel III final rules and the ongoing
evolution, validation and regulatory approval of PNC's models integral to the calculation of advanced approaches risk-weighted assets. |
25
Non-GAAP to GAAP Reconcilement
Appendix
For the year ended
In millions
December 31, 2009
Total noninterest income, as reported
$7,145
Total revenue, as reported
$16,228
Adjustments:
Pretax gain related to BlackRock's acquisition of
Barclays Global Investors on December 1, 2009
$1,076
Total noninterest income, as adjusted
$6,069
Total revenue, as adjusted
$15,152
Total noninterest income to total revenue, as reported
44%
Total noninterest income to total revenue, as adjusted
40%
PNC believes that information adjusted for the impact of certain items may be useful to help
evaluate the impact of those items on our operations. |

26
Non-GAAP to GAAP Reconcilement
Appendix
As of
In millions except per share data
Dec. 31, 2007
June 30, 2013
% Change
Common shareholders' equity
$14,847
$36,347
Common shares outstanding
341
531
Book value per common share
$43.60
$68.46
57%
Goodwill and other intangible assets other than servicing rights (1)
$8,850
$9,727
Common shareholders' equity less intangible assets
$5,997
$26,620
Common shares outstanding
341
531
Tangible book value per common share
$17.59
$50.13
185%
PNC
believes
that
tangible
book
value
per
common
share,
a
non-GAAP
measure,
is
useful
as
a
tool
to
help
better
evaluate
growth
of
a
company's
business
apart
from
the
amount,
on
a
per
share
basis,
of
intangible
assets
other
than
servicing rights included in book value per common share.
(1) Servicing rights were $701 million and $1,501 million at December 31, 2007 and June 30,
2013, respectively. |

27
Peer Group of Banks
Appendix
The PNC Financial Services Group, Inc.
PNC
BB&T Corporation
BBT
Bank of America Corporation
BAC
Capital One Financial, Inc.
COF
Comerica Inc.
CMA
Fifth Third Bancorp
FITB
JPMorgan Chase
JPM
KeyCorp
KEY
M&T Bank
MTB
Regions Financial Corporation
RF
SunTrust Banks, Inc.
STI
U.S. Bancorp
USB
Wells Fargo & Co.
WFC |