ELECTRONIC SLIDE PRESENTATION
Published on September 14, 2010

The PNC
Financial Services Group, Inc. Barclays Capital
Global Financial Services Conference
September 14, 2010
Exhibit 99.1 |

2
Cautionary Statement Regarding Forward-Looking
Information and Adjusted Information
This presentation includes snapshot information about PNC used by way of
illustration. It is not intended as a full business or financial review and should
be viewed in the context of all of the information made available by PNC in its SEC filings. The presentation also contains
forward-looking statements regarding our outlook or expectations relating to PNCs
future business, operations, financial condition, financial performance, capital and
liquidity levels, and asset quality. Forward-looking statements are necessarily subject to numerous assumptions,
risks and uncertainties, which change over time.
The forward-looking statements in this presentation are qualified by the factors affecting
forward-looking statements identified in the more detailed Cautionary Statement
included in the Appendix, which is included in the version of the presentation materials posted on our corporate
website at www.pnc.com/investorevents. We provide greater detail regarding some of these
factors in our 2009 Form 10-K and 2010 Form 10-Qs, including in the Risk Factors
and Risk Management sections of those reports, and in our subsequent SEC filings (accessible on the
SECs website at www.sec.gov and on or through our corporate website at
www.pnc.com/secfilings). We have included web addresses here and elsewhere in this
presentation as inactive textual references only. Information on these websites is not part of this document.
Future events or circumstances may change our outlook or expectations and may also affect the
nature of the assumptions, risks and uncertainties to which our forward-looking
statements are subject. The forward-looking statements in this presentation speak only as of the
date of this presentation. We do not assume any duty and do not undertake to update
those statements. In this presentation, we will sometimes refer to adjusted results to help illustrate the
impact of certain types of items, such as the acceleration of accretion of the remaining
issuance discount on our TARP preferred stock in connection with the first quarter 2010 redemption of such
stock, our fourth quarter 2009 gain related to BlackRocks acquisition of Barclays Global
Investors (the BLK/BGI gain), and integration costs in the 2010 and 2009
periods. This information supplements our results as reported in accordance with GAAP and should not be viewed in
isolation from, or a substitute for, our GAAP results. We believe that this additional
information and the reconciliations we provide may be useful to investors, analysts,
regulators and others as they evaluate the impact of these respective items on our results for the periods
presented due to the extent to which the items are not indicative of our ongoing operations.
In certain discussions, we may also provide information on yields and margins for all
interest-earning assets calculated using net interest income on a
taxable-equivalent basis by increasing the interest income earned on tax-exempt assets to make it fully equivalent to interest
income earned on taxable investments. We believe this adjustment may be useful when
comparing yields and margins for all earning assets. We may also provide information on
pretax pre-provision earnings (total revenue less noninterest expense), as we believe that pretax pre-
provision earnings is useful as a tool to help evaluate the ability to provide for credit
costs through operations. This presentation may also include discussion of other non-GAAP financial measures, which,
to the extent not so qualified therein or in the Appendix, is qualified by GAAP
reconciliation information available on our corporate website at www.pnc.com under About PNCInvestor
Relations. |

3
Todays Discussion
PNC Continues to Build a Great Company.
PNC Continues to Build a Great Company.
The financial services industry continues to be challenged
PNC is well-positioned to navigate these challenges and
achieve even greater shareholder value
-
Demonstrated execution
-
Growing and deepening customer relationships
-
Investing to grow; disciplined expense management
-
A strong and high quality capital position |
4
0
50
100
150
200
250
300
350
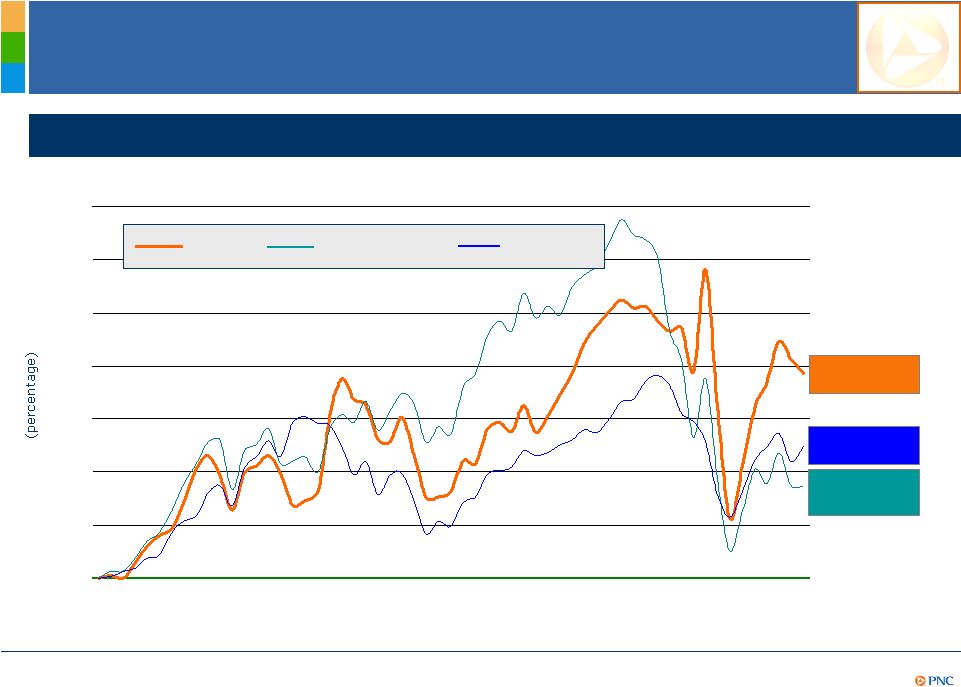
Delivering Long-Term Value
Total shareholder return
PNC
Bank
Index
¹
S&P 500
PNC +192%
Bank
Index
¹
+86%
S&P +124%
1995
1997
1999
2001
2003
2005
2007
2009
Sept 2010
Demonstrated
Execution
(1) SNL Bank and Thrift Index. |
5
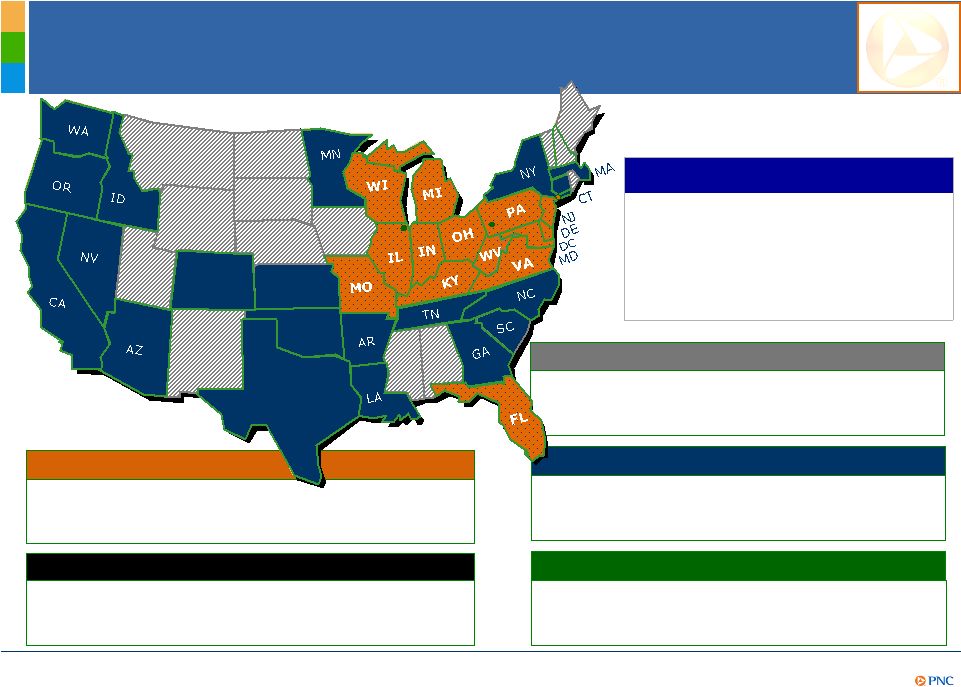
Footprint covering nearly 1/3 of the U.S.
population
Retail
Corporate & Institutional
A leader in serving middle-market
customers and government entities
One of the largest bank-held asset
managers in the U.S.
Asset Management
Residential Mortgage
One of the nations largest mortgage
platforms
PNCs Strong Franchise
8
th
$262 billion
Assets
U.S.
Rank
¹
June 30, 2010
6,539
2,458
$179 billion
5
th
ATMs
5
th
Branches
6
th
Deposits
(1) Rankings source: SNL DataSource; Headquartered in U.S.
CO
TX
KS
OK
BlackRock
A leader in investment management, risk
management and advisory services worldwide
Demonstrated
Execution |

6
PNCs Higher Quality Balance Sheet
(1) December 31, 2008 is the closing date of our acquisition of National City. (2) Proforma
ratio reflects the estimated impact of the sale of PNC Global Investment Servicing,
which closed on July 1, 2010. Further information is provided in the Appendix. Core
funded - loans to
deposits ratio of 86%
Appropriately reserved
Improved quality and pricing
of deposit base
Asset sensitive
duration of
equity negative 3.0 years
Higher quality capital
-
Proforma Tier 1 common
ratio
of
9.0%
²
Balance sheet positioning
$291
17
8
21
52
193
24
58
$111
$291
73
175
$43
Dec. 31,
2008
¹
(7)
14
Other
(7)
1
Preferred equity
($29)
$262
Total liabilities and equity
(12)
40
Borrowed funds
(14)
10
Other time/savings
(14)
179
Total deposits
11
28
Common equity
(15)
43
Retail CDs
$15
$126
Transaction deposits
(19)
54
Other assets
(21)
154
Loans
($29)
$262
Total assets
$54
June 30,
2010
$11
Change
Investment securities
(billions)
Demonstrated
Execution |
7
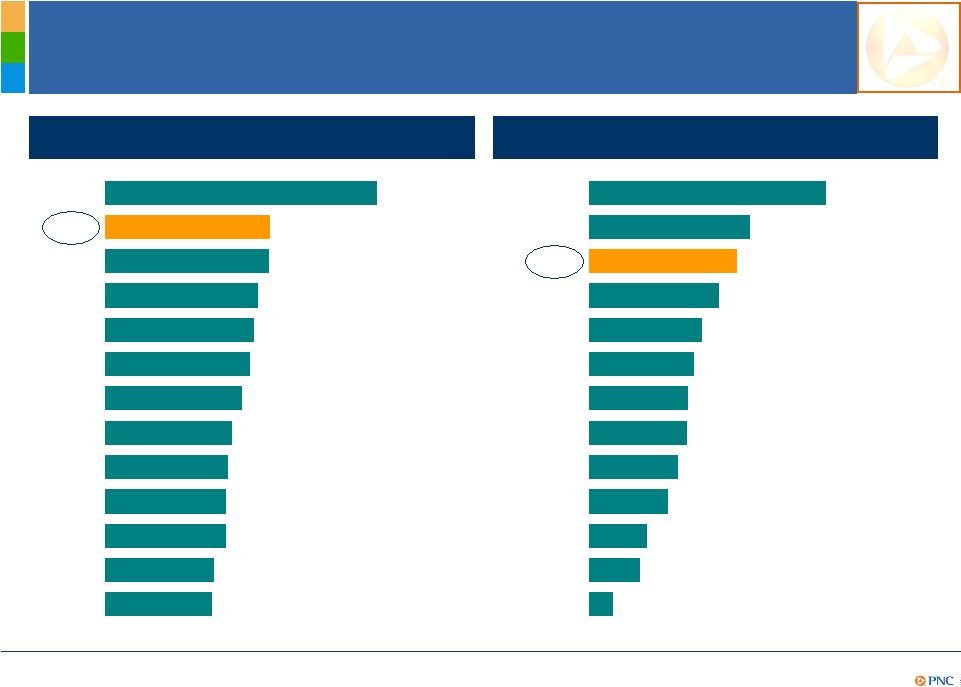
1H10 net interest margin
Peer source: SNL DataSource. (1) Net interest margin less (provision/average interest earning
assets). 7.10%
4.29%
4.28%
3.98%
3.88%
3.78%
3.57%
3.30%
3.21%
3.16%
3.16%
2.84%
2.80%
COF
PNC
WFC
BBT
USB
MTB
FITB
STI
CMA
JPM
KEY
BAC
RF
1H10
risk
adjusted
net
interest
margin
¹
4.63%
3.15%
2.90%
2.54%
2.20%
2.06%
1.93%
1.91%
1.74%
1.55%
1.14%
1.00%
0.46%
COF
MTB
PNC
WFC
BBT
CMA
JPM
USB
FITB
KEY
STI
BAC
RF
Demonstrated
Execution
A Focus on Risk Adjusted Returns |
8
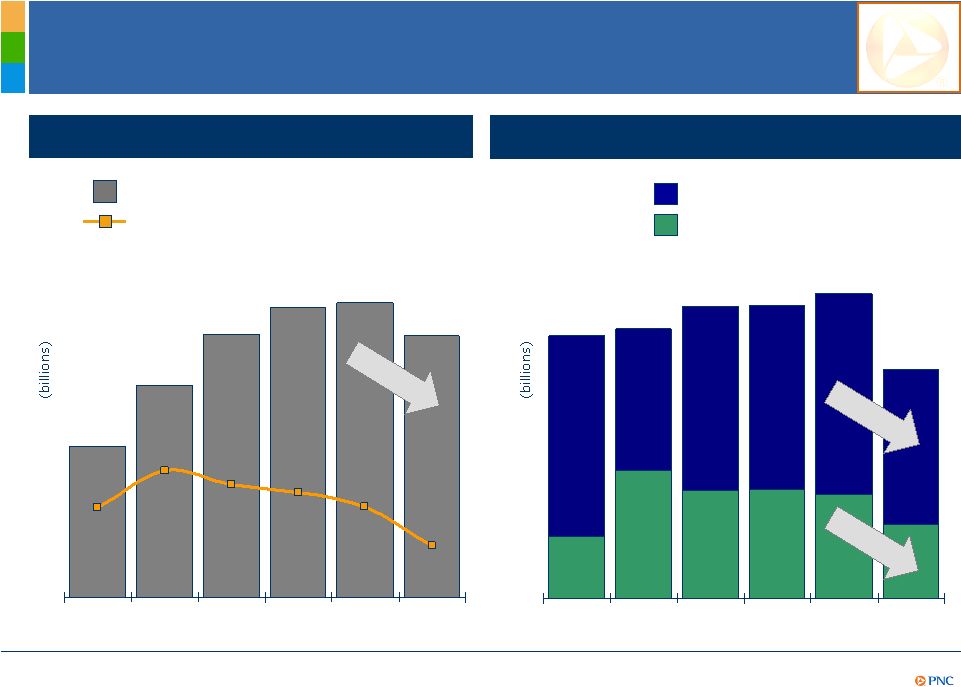
PNCs Credit Quality Continued to Stabilize
$3.0
$4.2
$5.1
$5.7
$5.8
$5.1
$2.0
$1.8
$1.0
$2.2
$2.5
$1.8
1Q09
2Q09
3Q09
4Q09
1Q10
2Q10
Quarter end nonperforming loans
1,2
Loans transferred to nonperforming
status during the quarter
Accruing loans past due
1,3
Nonperforming loans
$2.1
$2.2
$2.4
$2.4
$2.5
$1.9
$0.5
$1.0
$0.9
$0.9
$0.8
$0.6
1Q09
2Q09
3Q09
4Q09
1Q10
2Q10
30-89 Days
90 Days +
Demonstrated
Execution
(1) Loans acquired from National City that were impaired are not included as they were
recorded at estimated fair value when acquired and are currently considered performing
loans due to the accretion of interest in purchase accounting. (2) Does not include loans held for sale or
foreclosed and other assets. (3) Excludes loans that are government insured/guaranteed,
primarily residential mortgages. |
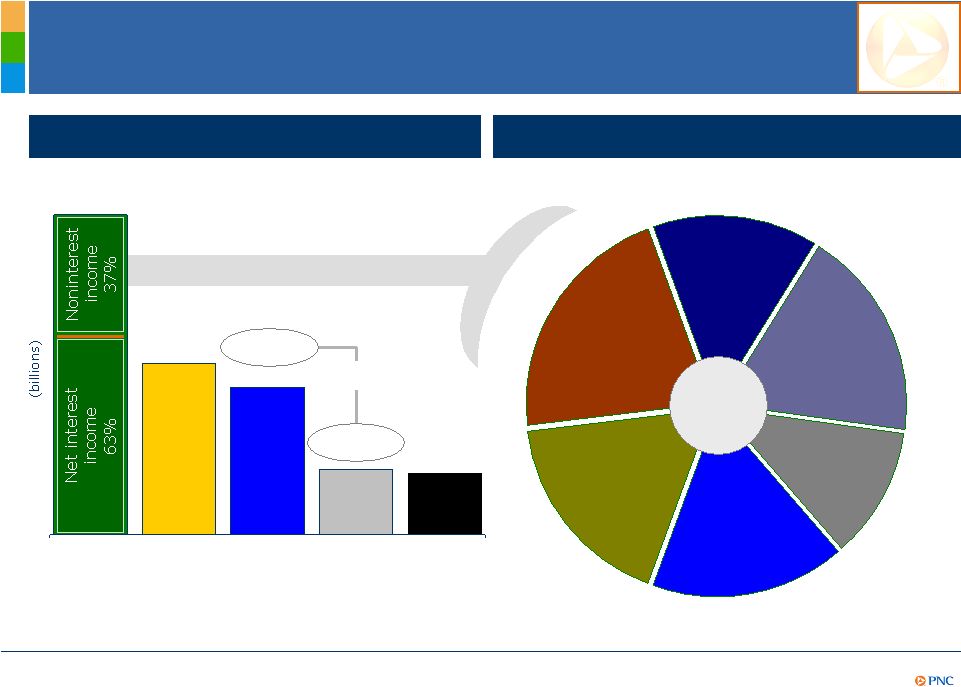
9
Driven by well-diversified streams
Pretax
Pre-Provision
Earnings
¹
More
Than
Doubled Credit Costs
$7.7
$4.1
$3.6
$1.6
1H10 income statement summary
1H10 noninterest income mix
(1) Total revenue less noninterest expense. Further information is provided in the
Appendix. Asset
management
$502
Consumer
services
$611
Corporate
services
$529
Residential
mortgage
$326
Deposit
service
charges
$409
18%
21%
14%
18%
12%
Other
$484
17%
Categories in millions
Total
revenue
Noninterest
expense
Pretax
pre-
provision
earnings
¹
Provision
$1.5
Net
income
$2.9
billion
2.3x
Demonstrated
Execution |
10
1H10 sales up 11% vs. 1H09
92% of markets exceeded 1H10 goal
1H10 sales up 11% vs. 1H09
2Q10
sales
up
15%
linked
quarter
70% of markets exceeded 1H10 goal
Sales Momentum Across the Franchise
Corporate
Banking
Wealth
Management
Institutional
Investments
Commercial
Banking
Sales contribution by region
1H10 annualized
Products
Eastern
markets
60%
Western
markets
40%
PNC Has Significant Sales Momentum Across the Franchise
PNC Has Significant Sales Momentum Across the Franchise
Following the Successful Conversion.
Following the Successful Conversion.
Growing
and
Deepening
Relationships
1H10
franchise
sales
up
11%
vs.
1H09 |
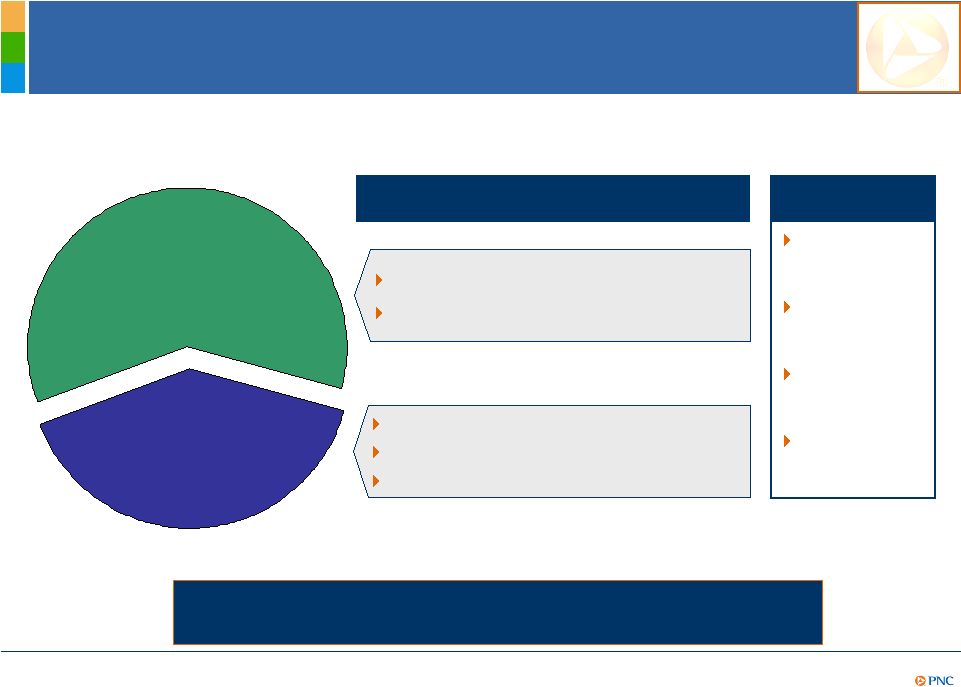
11
Executing on C&IB Cross Sell Opportunities
1H09
1H10
Treasury Management
$560
$600
Revenue
¹
Sales at 120% of
1H10 cross-sell goal
1H09
1H10
Capital Markets
$191
$292
Revenue
¹
(1) Consolidated PNC amounts.
Sales at 125% of
1H10 cross-sell goal
PNC
Has
a
Demonstrated
Ability
to
Cross-Sell
a
Full
Set
of
C&IB
Products and Services.
Growing
and
Deepening
Relationships |
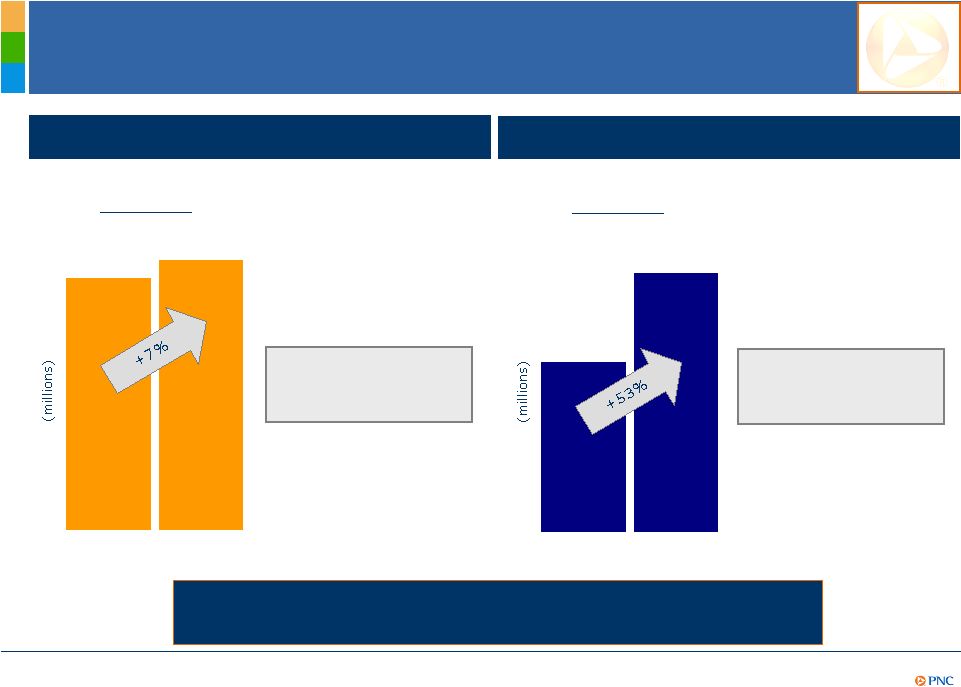
12
Growing and Deepening Retail Relationships
Checking relationships per branch
Active Online Bill Pay customers
Numbers at period end. (1) Excludes relationships impacted by required divestitures.
PNC Is Recognized for the Ability to Grow and Deepen Retail
PNC Is Recognized for the Ability to Grow and Deepen Retail
Relationships.
Relationships.
1,963
1,973
2,006
2,046
2,057
2Q09
3Q09
4Q09
1Q10
2Q10
726
753
780
826
870
2Q09
3Q09
4Q09
1Q10
2Q10
2Q10 average
transaction deposits up
$4.8 billion from 2Q09
¹
Net new checking
relationships +59,000
year
over
year
¹
Customer retention in
converted markets
stronger than expected
Branch banking
employee engagement
at all time high across
the franchise
Retail highlights
+5% year over year
+20% year over year
¹
Growing
and
Deepening
Relationships
¹ |

13
Driving Wealth Management Referrals
Referrals to Wealth Management
PNC
Is
Successfully
Applying
the
Cross
Referral
Process
Across
the
Entire Footprint.
Strong Eastern market referrals
(as a % of goal)
99%
103%
213%
206%
1Q10
2Q10
1Q10
2Q10
From Retail
From C&IB
Improved Western market referrals
(as a % of goal)
37%
95%
112%
389%
1Q10
2Q10
1Q10
2Q10
From Retail
From C&IB
Growing
and
Deepening
Relationships |
14
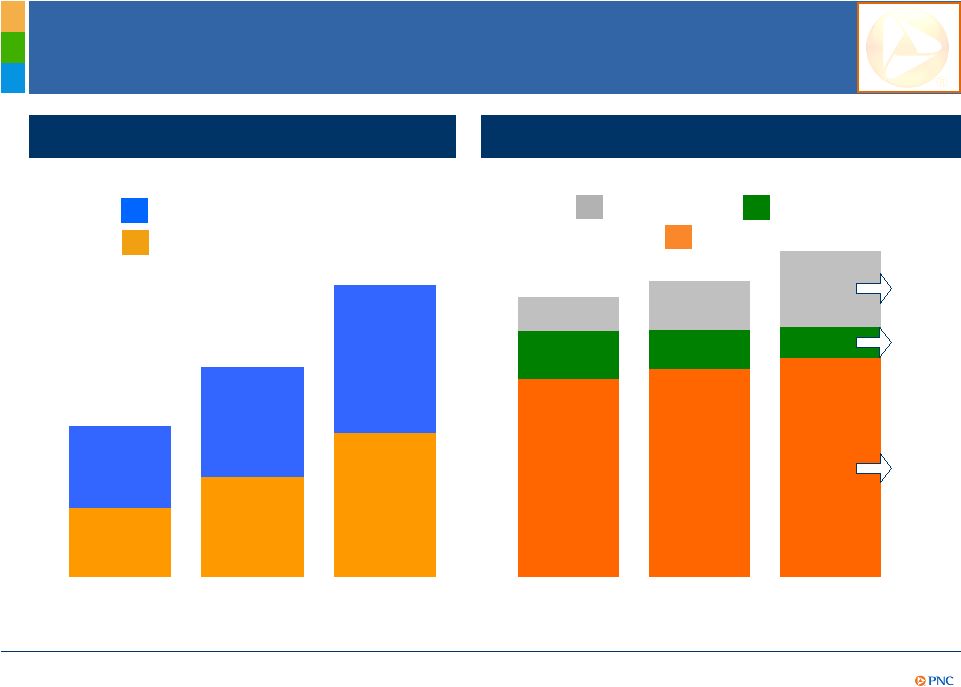
Changes in the Payments Space
132
139
146
32
26
21
23
33
51
2005
2008
2013
Projected
31
45
65
37
49
66
2005
2008
2013
Projected
Sources: Online Banking Report; McKinsey & Company
Mainstreaming of online payments
Paper decline continues
Debit card
Checks
Cash
Online banking only
Online bill-pay
U.S. Households (millions)
Transactions (billions)
Investing
to Grow;
Disciplined
Expense
Management
+121%
(34%)
+11% |

15
PNC -
Investing to Grow
Building out PNCs Virtual Wallet
platform to reach a broader consumer base over time
Broadening PNC Healthcare Advantage with annual revenue
growth of 15%+ since 2004
Leveraging our deep product strengths such as credit card,
residential mortgage, commercial real estate
Investing in high growth potential markets, enhancing our
talent and delivering the PNC brand
PNC Is Committed to Investing in Our Businesses and in Our
PNC Is Committed to Investing in Our Businesses and in Our
Customers to Deliver Even Greater Shareholder Value.
Customers to Deliver Even Greater Shareholder Value.
Investing
to Grow;
Disciplined
Expense
Management |
16
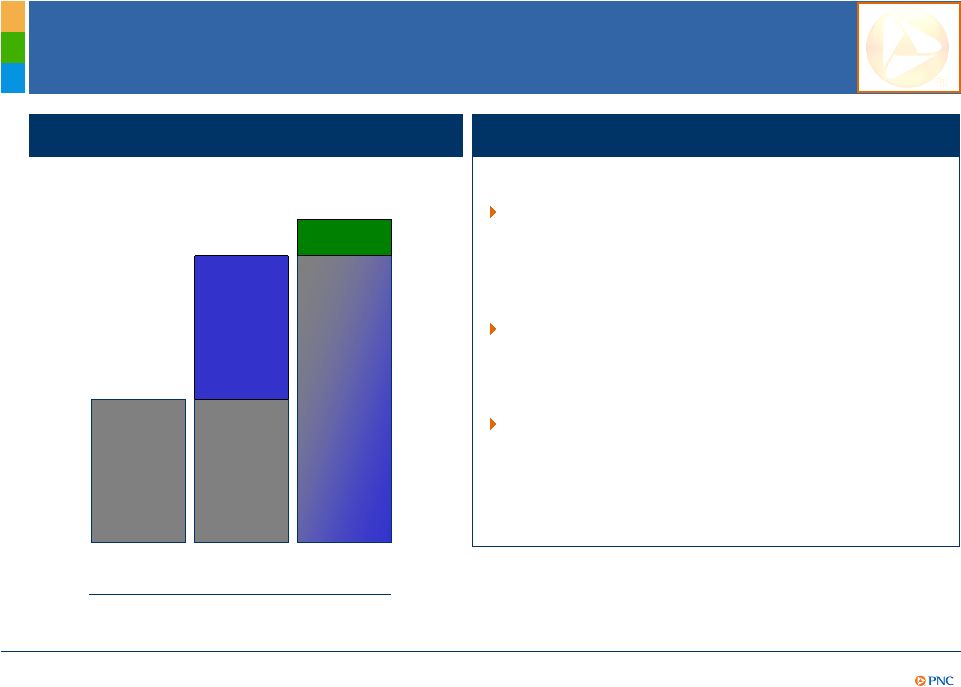
Initial Cost Save Objectives Exceeded
Established New Target of $1.8 Billion
Highlights
Successfully captured $1.6 billion in
annualized acquisition-related cost
savings through 2Q10, well ahead of our
original target amount and schedule
Established a new goal of $1.8 billion in
annualized acquisition-related cost saves
by the end of 2010
Continued to successfully manage
expense base in 2Q10 while investing for
the future
$800
million
captured
in 2009
$800
million
captured
through
2Q10
PNC acquisition-related cost saves
annualized
2009
1H10
New goal
4Q10
$1.8 billion
$1.6 billion
Investing
to Grow;
Disciplined
Expense
Management |
17
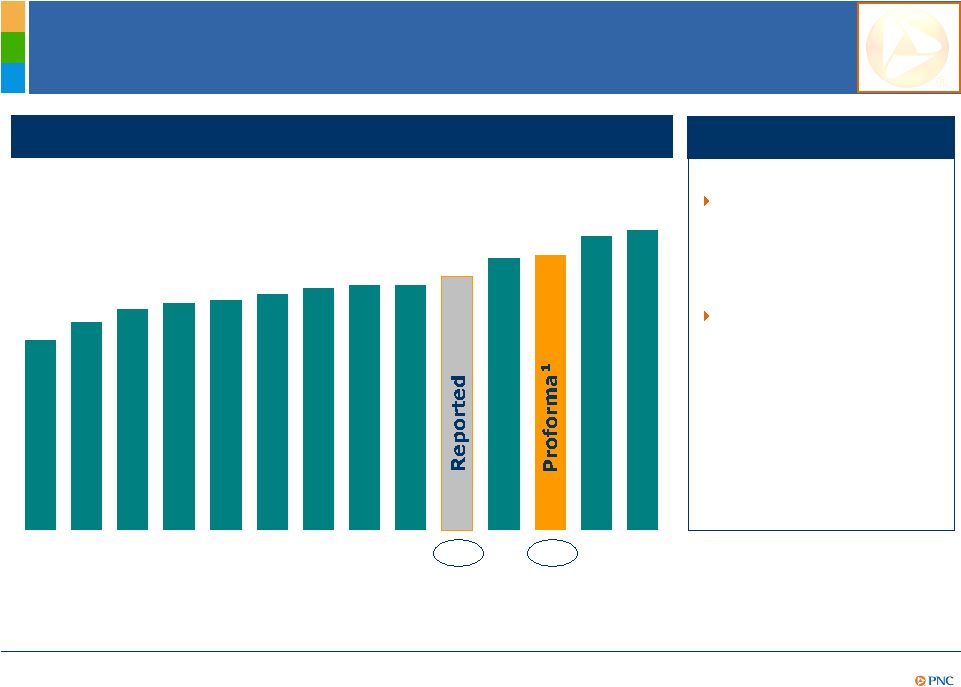
Well Positioned Capital Level and Structure
June 30, 2010 Tier 1 common ratio
PNC highlights
6.2%
6.8%
7.2%
7.4%
7.5%
7.7%
7.9%
8.3%
8.9%
9.0%
9.6%
9.8%
8.0%
8.0%
MTB
COF
FITB
USB
WFC
RF
STI
BAC
KEY
PNC
BBT
PNC
JPM
CMA
Improved quality of
capital
-
Common as a % of Tier 1
capital
²
increased to
78%
¹
from
50%
in
2Q09
Capital priorities
-
Maintain strong capital
levels
-
Support our clients
-
Invest in our businesses
-
Return capital to
shareholders when
appropriate
A Strong and
High Quality
Capital
Position
Ratios as of quarter end. Source: Company reports, MTB and COF are
estimated. (1) Proforma ratio reflects the estimated impact of
the sale of PNC Global Investment Servicing, which closed on July 1, 2010. Further information
is provided in the Appendix. (2) Tier 1 risk-based capital ratio was 10.5% and Tier
1 common capital ratio was 5.3% as of 2Q09. Tier 1 risk-based capital ratio as of 2Q10
was 10.7%. |

18
Summary
PNC Continues to Build a Great Company.
PNC Continues to Build a Great Company.
The operating environment for the financial
services industry remains challenging
PNCs business model and execution have
delivered differentiated results throughout this
cycle
PNC is well positioned to navigate the future
challenges and achieve even greater shareholder
value |

19
Cautionary Statement Regarding Forward-Looking
Information
Appendix
This presentation includes snapshot information about PNC used by way of
illustration and is not intended as a full business or financial review. It should
not be viewed in isolation but rather in the context of all of the information made available by PNC in its SEC filings.
We also make statements in this presentation, and we may from time to time make other
statements, regarding our outlook or expectations for earnings, revenues, expenses,
capital levels, liquidity levels, asset quality and/or other matters regarding or affecting PNC that are
forward-looking statements within the meaning of the Private Securities Litigation Reform
Act. Forward-looking statements are typically identified by words such as
believe, plan, expect, anticipate, intend, outlook, estimate, forecast, will, should, project,
goal and other similar words and expressions. Forward-looking statements
are subject to numerous assumptions, risks and uncertainties, which change over time.
Forward-looking statements speak only as of the date they are made. We do not assume any
duty and do not undertake to update our forward-looking statements. Actual
results or future events could differ, possibly materially, from those that we anticipated in our forward-
looking statements, and future results could differ materially from our historical
performance. Our forward-looking statements are subject to the following principal risks and
uncertainties. We provide greater detail regarding some of these factors in our
2009 Form 10-K and 2010 Form 10-Qs, including in the Risk Factors and Risk Management sections of those reports, and
in our subsequent SEC filings. Our forward-looking statements may also be subject to
other risks and uncertainties, including those that we may discuss elsewhere in this
presentation or in our filings with the SEC, accessible on the SECs website at www.sec.gov and on or through
our corporate website at www.pnc.com/secfilings. We have included these web addresses as
inactive textual references only. Information on these websites is not part of
this document. Our businesses and financial results are affected by business and economic conditions,
both generally and specifically in the principal markets in which we operate. In
particular, our businesses and financial results may be impacted by:
o
Changes in interest rates and valuations in the debt, equity and other financial markets;
o
Disruptions in the liquidity and other functioning of financial markets, including such
disruptions in the markets for real estate and other assets commonly securing financial
products; o
Actions by the Federal Reserve and other government agencies, including those that impact
money supply and market interest rates; o
Changes in our customers, suppliers and other counterparties performance in
general and their creditworthiness in particular; o
A slowing or failure of the moderate economic recovery that began last year;
o
Continued effects of the aftermath of recessionary conditions and the uneven spread of the
positive impacts of the recovery on the economy in general and our customers in
particular, including adverse impact on loan utilization rates as well as delinquencies, defaults
and customer ability to meet credit obligations;
o
Changes in levels of unemployment; and
o
Changes in customer preferences and behavior, whether as a result of changing business and
economic conditions, climate-related physical changes or legislative and regulatory
initiatives, or other factors. A continuation of turbulence in significant
portions of the US and global financial markets, particularly if it worsens, could impact our
performance, both directly by affecting our revenues and the value of our assets and
liabilities and indirectly by affecting our counterparties and the economy generally.
|

20
Cautionary Statement Regarding Forward-Looking
Information (continued)
Appendix
We will be impacted by the extensive reforms enacted in the Dodd-Frank Wall Street
Reform and Consumer Protection Act. Further, as much of that Act will require the
adoption of implementing regulations by a number of different regulatory bodies, the precise nature, extent and timing of
many of these reforms and the impact on us is still uncertain.
Financial industry restructuring in the current environment could also impact our
business and financial performance as a result of changes in the creditworthiness and
performance of our counterparties and by changes in the competitive and regulatory landscape.
Our results depend on our ability to manage current elevated levels of impaired assets.
Given current economic and financial market conditions, our forward-looking
financial statements are subject to the risk that these conditions will be substantially
different than we are currently expecting. These statements are based on our current expectations that interest rates will remain
low in the second half of 2010 and our view that the moderate economic recovery that began
last year will continue throughout the rest of 2010. Legal and regulatory
developments could have an impact on our ability to operate our businesses or our financial condition or results of
operations or our competitive position or reputation. Reputational impacts, in turn,
could affect matters such as business generation and retention, our ability to attract
and retain management, liquidity, and funding. These legal and regulatory developments could include:
o
Changes resulting from legislative and regulatory responses to the current economic and
financial industry environment; o
Other legislative and regulatory reforms, including broad-based restructuring of financial
industry regulation as well as changes to laws and regulations involving tax, pension,
bankruptcy, consumer protection, and other aspects of the financial institution industry;
o
Unfavorable resolution of legal proceedings or other claims and regulatory and other
governmental investigations or other inquiries. In addition to matters relating to
PNCs business and activities, such matters may also include proceedings, claims, investigations, or inquiries
relating to pre-acquisition business and activities of acquired companies such as National
City; o
The results of the regulatory examination and supervision process, including our failure to
satisfy the requirements of agreements with governmental agencies;
o
Changes in accounting policies and principles;
o
Changes resulting from legislative and regulatory initiatives relating to climate change that
have or may have a negative impact on our customers demand for or use of our
products and services in general and their creditworthiness in particular; and
o
Changes to regulations governing bank capital, including as a result of the so-called
Basel 3 initiatives. Our business and operating results are affected
by our ability to identify and effectively manage risks inherent in our businesses, including, where
appropriate, through the effective use of third-party insurance, derivatives, and capital
management techniques, and by our ability to meet evolving regulatory capital standards.
The adequacy of our intellectual property protection, and the extent of any costs
associated with obtaining rights in intellectual property claimed by others, can impact
our business and operating results. Our ability to anticipate and respond to
technological changes can have an impact on our ability to respond to customer needs and to meet
competitive demands.
Our ability to implement our business initiatives and strategies could affect our
financial performance over the next several years. Our expansion with our
National City acquisition in geographic markets and into business operations in areas in which we did not have significant
experience or presence prior to 2009 presents greater risks and uncertainties than were
present for us in other recent acquisitions. Competition can have an impact on
customer acquisition, growth and retention, as well as on our credit spreads and product pricing, which can
affect market share, deposits and revenues. |

21
Cautionary Statement Regarding Forward-Looking
Information (continued)
Appendix
Our business and operating results can also be affected by widespread disasters,
terrorist activities or international hostilities, either as a result of the impact on
the economy and capital and other financial markets generally or on us or on our customers, suppliers or other counterparties
specifically.
Also, risks and uncertainties that could affect the results anticipated in
forward-looking statements or from historical performance relating to our equity
interest in BlackRock, Inc. are discussed in more detail in BlackRocks filings with the SEC, including in the Risk Factors sections of
BlackRocks reports. BlackRocks SEC filings are accessible on the SECs
website and on or through BlackRocks website at www.blackrock.com. This material
is referenced for informational purposes only and should not be deemed to constitute a part of this document.
We grow our business in part by acquiring from time to time other financial services
companies. Acquisitions present us with risks in addition to those presented by
the nature of the business acquired. These include risks and uncertainties related both to the acquisition transactions
themselves and to the integration of the acquired businesses into PNC after closing.
Acquisitions may be substantially more expensive to complete (including unanticipated costs
incurred in connection with the integration of the acquired company) and the
anticipated benefits (including anticipated cost savings and strategic gains) may be significantly harder or take longer to
achieve than expected. Acquisitions may involve our entry into new businesses or new
geographic or other markets, and these situations also present risks resulting from our
inexperience in those new areas. As a regulated financial institution, our pursuit of
attractive acquisition opportunities could be negatively impacted due to regulatory delays or other
regulatory issues. Regulatory and/or legal issues relating to the pre-acquisition
operations of an acquired business may cause reputational harm to PNC following the
acquisition and integration of the acquired business into ours and may result in additional future costs or regulatory limitations
arising as a result of those issues.
Any annualized, proforma, estimated, third party or consensus numbers in this presentation are
used for illustrative or comparative purposes only and may not reflect actual
results. Any consensus earnings estimates are calculated based on the earnings projections made by analysts who cover
that company. The analysts
opinions, estimates or forecasts (and therefore the consensus earnings estimates) are theirs
alone, are not those of PNC or its management, and may not reflect PNCs or other
companys actual or anticipated results. |

22
Impact of Sale of PNC Global Investment Servicing
1
1.1
Net intangible assets
1.3
Goodwill and other intangible assets
Elimination of net intangible assets:
Less:
(1.7)
Book equity / intercompany debt
(billions)
$1.4
(0.2)
0.3
(0.3)
0.6
$2.3
Estimated PNC tangible capital improvement
Eligible deferred income taxes on goodwill
and other intangible assets
After-tax gain
Income taxes
Pretax gain
Sales price
Estimated gain and capital enhancement
Appendix
(1) The transaction closed on July 1, 2010. |

23
Risk-Based Capital Ratios
9.7%
4.8%
Ratios
as
of
December
31,
2008
²
1.4
1.4
Net
impact
of
July
1,
2010
sale
of
GIS
¹
11.3%
9.0%
Proforma ratios as of June 30, 2010
$24.7
$19.6
Proforma
10.7%
8.3%
Ratios as of June 30, 2010
$18.2
Tier 1 common
$23.3
June 30, 2010 -
Capital
Tier 1 risk-based
$ in billions
Appendix
(1) The sale of PNC Global Investment Servicing (GIS) closed on July 1, 2010. We
believe that the disclosure of these ratios reflecting the impact of the sale of GIS
provides additional meaningful information regarding the risk-based capital ratios at that date and the
impact of this event on these ratios. (2) December 31, 2008 is the closing date of our
acquisition of National City. |

24
Non-GAAP to GAAP Reconcilement
Appendix
In millions except per share data
Adjustments,
pretax
Income taxes
Net income
Net income
attributable to
common shareholders
Diluted EPS from
net income
Net income and diluted EPS, as reported
$803
$786
$1.47
Adjustments:
Integration costs
$100
($35)
65
65
.13
Net income and diluted EPS, as adjusted
$868
$851
$1.60
In millions except per share data
Adjustments,
pretax
Income taxes
(benefit)
¹
Net income
Net income
attributable to
common shareholders
Diluted EPS from
net income
Net income and diluted EPS, as reported
$671
$333
$.66
Adjustments:
Integration costs
$113
($40)
73
73
.15
250
.50
Net income and diluted EPS, as adjusted
$744
$656
$1.31
In millions except per share data
Adjustments,
pretax
Income taxes
Net income
Net income
attributable to
common shareholders
Diluted EPS from
net income
Net income and diluted EPS, as reported
$207
$65
$.14
Adjustments:
Integration costs
$125
($34)
91
91
.20
Net income and diluted EPS, as adjusted
$298
$156
$.34
For the three months ended June 30, 2009
(1) Calculated using a marginal federal income tax rate of 35% and includes applicable income
tax adjustments. (2) Represents accelerated accretion of the remaining issuance discount
on redemption of the TARP preferred stock in February 2010. For the three months ended
March 31, 2010 For the three months ended June 30, 2010
(benefit)
¹
(benefit)
¹
TARP
preferred
stock
accelerated
discount
accretion
²
PNC believes that information adjusted for the impact of certain items may be useful due to
the extent to which the items are not indicative of our ongoing operations.
|

25
Non-GAAP to GAAP Reconcilement
Appendix
In millions except per share data
Adjustments,
pretax
Income taxes
(benefit)
¹
Net income
Net income
attributable to
common shareholders
Diluted EPS from
net income
Net income and diluted EPS, as reported
$1,474
$1,119
$2.15
Adjustments:
Integration costs
$213
($75)
138
138
.27
TARP
preferred
stock
accelerated
discount
accretion
²
250
.49
Net income and diluted EPS, as adjusted
$1,612
$1,507
$2.91
In millions except per share data
Adjustments,
pretax
Income taxes
(benefit)
¹
Net income
Net income
attributable to
common shareholders
Diluted EPS from
net income
Net income and diluted EPS, as reported
$737
$525
$1.16
Adjustments:
Integration costs
$177
($52)
125
125
.28
Net income and diluted EPS, as adjusted
$862
$650
$1.44
For the six months ended June 30, 2009
(1) Calculated using a marginal federal income tax rate of 35% and includes applicable income
tax adjustments. (2) Represents accelerated accretion of the remaining issuance discount
on redemption of the TARP preferred stock in February 2010. For the six months ended
June 30, 2010 PNC believes that information adjusted for the impact of certain items may
be useful due to the extent to which the items are not indicative of our ongoing operations.
|

26
Non-GAAP to GAAP Reconcilement
Appendix
Three months ended
Six months ended
Three months ended
June 30, 2010
March 31, 2010
June 30, 2010
June 30, 2009
In millions except ratio and per share data
Total revenue
$3,912
$3,763
$7,675
$3,803
Noninterest expense
2,002
2,113
4,115
2,492
Pretax pre-provision earnings
$1,910
$1,650
$3,560
$1,311
Provision
$823
$751
$1,574
$1,087
Excess of pretax pre-provision earnings over provision
$1,087
$899
$1,986
$224
Pretax pre-provision earnings/provision
2.32
2.20
2.26
1.21
Average common shares
outstanding 527
500
514
453
Pretax pre-provision
earnings/avg common shares $3.62
$3.30
$6.93
$2.89
PNC believes that pretax pre-provision earnings is useful as a tool to help evaluate the
ability to provide for credit costs through operations. In millions except per share
data Adjustments,
pretax
Income taxes
(benefit)
¹
Net income
Net income
attributable to
common shareholders
Diluted EPS from
net income
Net income and diluted EPS, as reported
$1,107
$1,011
$2.17
Adjustments:
Gain on BlackRock/BGI transaction
($1,076)
$389
(687)
(687)
(1.49)
Integration costs
155
(54)
101
101
.22
Net income and diluted EPS, as adjusted
$521
$425
$.90
For the three months ended December 31, 2009
PNC believes that information adjusted for the impact of certain items may be useful due to
the extent to which the items are not indicative of our ongoing operations.
(1) Calculated using a marginal federal income tax rate of 35%. The after-tax gain
on the BlackRock/BGI transaction also reflects the impact of state income taxes.
|

27
Peer Group of Banks
Appendix
The PNC Financial Services Group, Inc.
PNC
BB&T Corporation
BBT
Bank of America Corporation
BAC
Capital One Financial, Inc.
COF
Comerica Inc.
CMA
Fifth Third Bancorp
FITB
JPMorgan Chase
JPM
KeyCorp
KEY
M&T Bank
MTB
Regions Financial Corporation
RF
SunTrust Banks, Inc.
STI
U.S. Bancorp
USB
Wells Fargo & Co.
WFC
Ticker |