ELECTRONIC PRESENTATION SLIDES FOR EARNINGS RELEASE CONFERENCE CALL
Published on April 23, 2009

The PNC
Financial Services Group, Inc. First Quarter 2009 Earnings Conference Call April 23, 2009 Exhibit 99.2 |

2 Cautionary Statement Regarding Forward-Looking Information and Adjusted Information This presentation includes snapshot information about PNC used by way of
illustration. It is not intended as a full business or financial review and should
be viewed in the context of all of the information made available by PNC in its SEC filings. The presentation also contains forward-looking statements regarding our outlook or expectations relating to PNCs future
business, operations, financial condition, financial performance, capital and liquidity
levels, and asset quality. Forward-looking statements are necessarily subject to numerous assumptions, risks and uncertainties, which change over time. The forward-looking statements in this presentation are qualified by the factors affecting
forward-looking statements identified in the more detailed Cautionary Statement
included in the Appendix, which is included in the version of the presentation materials posted on our corporate website at www.pnc.com/investorevents. We provide greater detail regarding these
factors in our 2008 Form 10-K, including in the Risk Factors and Risk Management
sections, and in our other SEC filings (accessible on the SECs website at www.sec.gov and on or through our corporate website at www.pnc.com/secfilings). We have included web addresses here and
elsewhere in this presentation as inactive textual references only. Information on
these websites is not part of this document. Future events or circumstances may change our outlook or expectations and may also affect the
nature of the assumptions, risks and uncertainties to which our forward-looking
statements are subject. The forward-looking statements in this presentation speak only as of the date of this presentation. We do not assume any duty and do not undertake to update those
statements. In this presentation, we will sometimes refer to adjusted results to help illustrate the impact of
certain types of items. This information supplements our results as reported in
accordance with GAAP and should not be viewed in isolation from, or a substitute for, our GAAP results. We provide these adjusted amounts and reconciliations so that investors, analysts,
regulators and others will be better able to evaluate the impact of these items on our
results for the periods presented. We believe that information as adjusted for the impact of the specified items may be useful due to the extent to which these items are not indicative of our
ongoing operations. In certain discussions, we may also provide information on yields and margins for all
interest-earning assets calculated using net interest income on a
taxable-equivalent basis by increasing the interest income earned on tax-exempt assets to make it fully equivalent to interest income earned on taxable investments. We believe this adjustment may be useful when comparing
yields and margins for all earning assets. This presentation may also include a discussion of other non-GAAP financial measures, which, to
the extent not so qualified therein or in the Appendix, is qualified by GAAP
reconciliation information available on our corporate website at www.pnc.com under About PNCInvestor Relations. |

3 Key Take-Aways Posted strong 1Q09 results Businesses performed well in light of economic conditions Strengthened capital and liquidity, increased loan loss reserves Benefits of National City acquisition exceeding original expectations Despite the Environment, PNC Remains Focused on Delivering Long-Term Value. |
4 Significant Integration Progress in 90 Days Focus on the integration Focus on clients Focus on the firm Completed firm wide integration strategy sessions Established National City Risk Committee Client conversion schedule set; phase one planned for second half 2009 Kicked-off new marketing campaign Two of Americas best-known banks. Now simply one of Americas best. Reached out to over 3.6 million National City customers via mail Launched new Corporate Banking outreach campaign Exceeded National City corporate deposit relationship goal topping $2 billion A powerful franchise with experienced leadership in place Conducted comprehensive market visits and town hall meetings PNC Has Laid the Foundation for a Successful Integration. PNC Has Laid the Foundation for a Successful Integration. |

5 1Q09 Performance Overview $259 $(246) $530 Net income (loss), millions
$1.03 1Q09 $(.77) 4Q08 $.71 Diluted earnings per common share 3Q08 Pretax pre-provision earnings¹ exceeded credit costs by over $650 million Expenses remained well-controlled Significant improvement in capital and liquidity Further credit quality deterioration as expected; increased loan loss reserves Strong revenue performance driven by net interest income and diversified fee income Earnings highlights (1) Total revenue less noninterest expense. Further information is provided in the Appendix. |
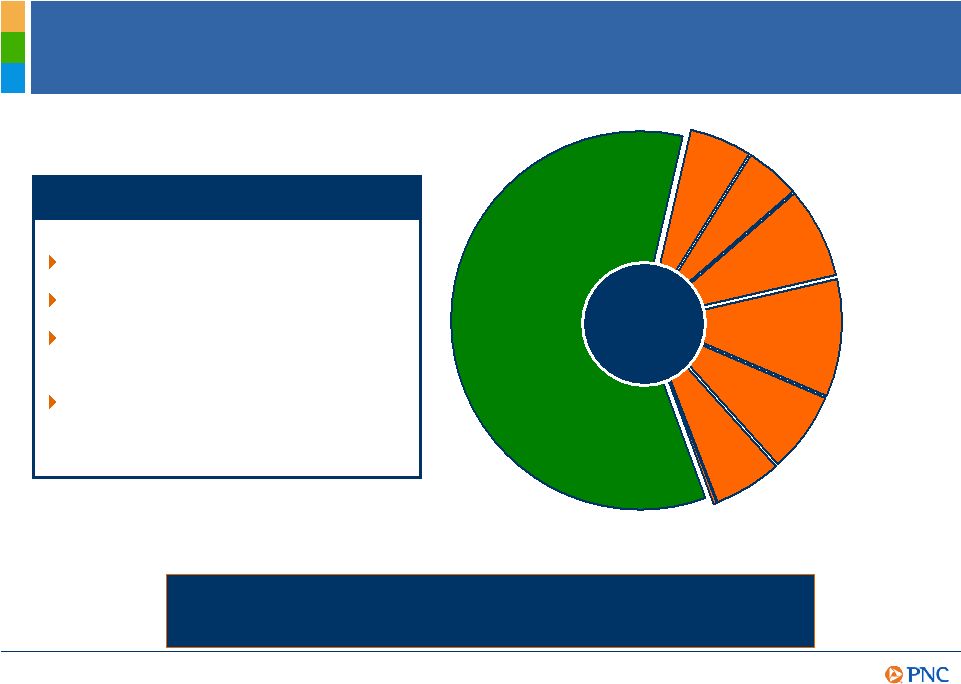
6 Revenue Diversification Net interest income $2,305 Fund servicing $199 Asset management $189 Consumer services $316 Corporate services $245 Residential mortgage $431 Deposit service charges $224 Other $(38) 60% 5% 5% 8% 6% 11% 6% Strong net interest income Net interest margin of 3.81% Significant residential mortgage contribution Offset by OTTI ¹ and other impairments 1Q09 total revenue $3.87B (1)% 1Q09 revenue performance (1) Other-than-temporary-impairments. Revenue categories in millions PNCs Revenue Mix is Diverse with 40% Derived from Noninterest Income Categories. |
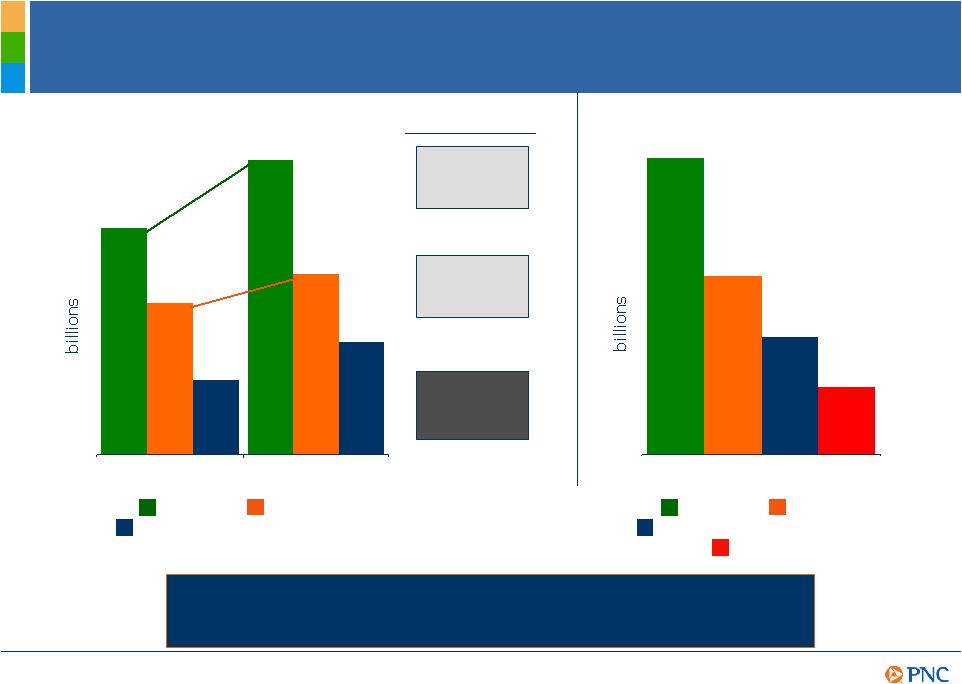
7 Creating Positive Operating Leverage $5.5 $3.7 $7.2 $4.4 2004 2008 Creating Positive Operating Leverage Helps to Cover Increased Creating Positive Operating Leverage Helps to Cover Increased Credit Costs in a Down Cycle. Credit Costs in a Down Cycle. Revenue +7% Expense +5% Operating Leverage +2% 2004-2008 CAGR $1.8 $2.8 Revenue Expense Pretax pre-provision earnings ¹ 1Q09 $3.87 $2.33 $1.54 $.88 Revenue Expense Pretax pre-provision earnings ¹ Provision (1) Total revenue less noninterest expense. Further information is provided in the Appendix.
|
8 Balance Sheet Composition 91% 88% Loans to deposits 5 5 15 Interest-earning deposits with banks 100% 10 5 17 68% 100% 15 60 16 1 3% % of total 100% 10 6 18 66% 100% 15 60 15 2 3% Dec 31, 2008 $286 29 14 48 $195 $286 43 171 46 4 $7 March 31, 2009 Total liabilities and equity Equity Other liabilities Borrowed funds Deposits Total assets Other assets and loan and lease loss allowance Loans ¹ Investment securities Loans held for sale ¹ Cash and short-term investments billions (1) Amounts include items for which PNC has elected the fair value option under SFAS 159.
PNCs Commitment to Returning to a Moderate Risk Profile Remains a Top Priority for Creating Long-Term Value. |
9 Investment Securities $ - 6% $2.6 US Treasury and government agencies $(4.4) 100% $46.3 Total investment securities 3.4 years 2.4 3.1 5.5 9.3 23.4 Fair value Expected weighted average life ¹ (.1) (.5) (.8) (3.6) .6 Net unrealized gain/(loss) 20 Non-agency residential mortgage-backed 5 Other (primarily municipals) 12 Commercial mortgage-backed 7 Asset-backed 50 % of total Agency residential mortgage-backed March 31, 2009, billions (1) Excluding corporate stocks and other included in Other. (2) Rated by at least two nationally recognized rating agencies; ratings at period end. 2008 2009 92% of the portfolio is comprised of agency or investment grade equivalents March 31 June 30 Sept 30 Dec 31 March 31 Investment securities, billions
$(3.6) $(2.0) $(4.4) $(1.6) $(5.4) Net unrealized gain/(loss) PNCs Investment Securities Portfolio Is High Quality. 2 |
10
Credit Metrics (1) As of quarter end, except net charge-off percentage and provision to average loans.
Net charge-off percentage and provision to average loan percentage are annualized. Average loans reflect the National City acquisition beginning with first quarter 2009. Other balance sheet items reflect National City beginning on its acquisition on December 31, 2008.
Fourth quarter 2008 provision includes a $504 million conforming provision for credit
losses related to our National City acquisition. .87 1.02 1.04 5.25 2.03 Provision to average loans 2008 2009 145 2.51 1.21 1.73 1.01 March 31 151 142 125 236 Allowance for loan and lease losses to nonperforming loans 1.22 1.35 1.40 2.23 Allowance for loan and lease losses to total loans .44 .51 .60 .74 Nonperforming assets to total assets .81 .95 1.12 .95 Nonperforming loans to total loans .57 .62 .66 1.09 Net charge-offs to average loans March 31 June 30 Sept 30 Dec 31 Asset quality ratios ¹ , % Credit Quality Deterioration Remained Manageable and Resulted in Increased Loan Loss Reserves. |

11
Capital and Liquidity Substantial 3/31/09 liquidity position enables PNC to meet all 2009 debt maturities 16% 88% 4.4% 3.3% 10.2% March 31 2009 21% 88% 5.1% 3.6% 8.2% Sept 30 2008 15% 91% 4.3% 2.9% 9.7% Dec 31 2008 Key Capital Ratios ¹ Tier 1 risk-based Tangible common equity Tangible common equity excluding accumulated other comprehensive loss Investment securities to total assets Loans to deposits Key Liquidity Ratios PNC Remains Well-Positioned in Terms of Capital and Liquidity. 2 2,3 (1) March 31, 2009 estimated. (2) Period-end common shareholders equity less
goodwill and other intangible assets (net of deferred taxes) excluding mortgage
servicing rights, divided by period-end assets less goodwill and other intangible assets (net of deferred taxes) excluding mortgage servicing rights. (3) Accumulated other comprehensive loss as of 3/31/09,
12/31/08, and 9/30/08 was $3.3 billion, $3.9 billion, and $2.2 billion,
respectively. Adjusted percentages are reconciled to GAAP in the Appendix. |

12
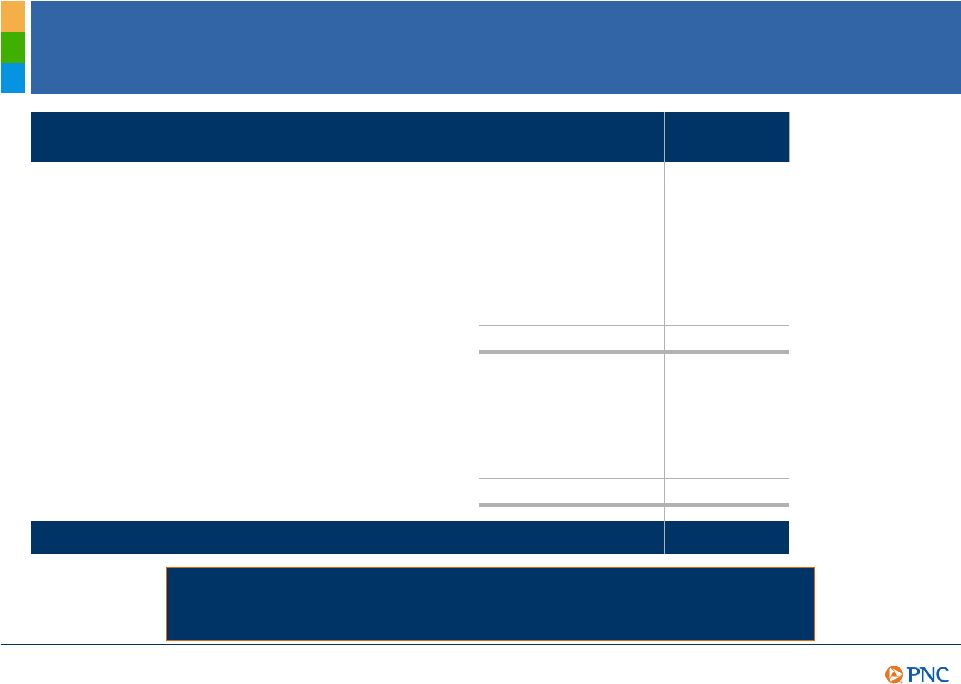
A relentless focus on implementing the PNC model Returning to an overall moderate risk profile Leveraging the brand to grow high quality revenue streams A focus on continuous improvement while investing in innovation Disciplined approach to capital management Strong execution capabilities Summary PNC Continues to Build a Great Company. PNC Continues to Build a Great Company. |

13
This presentation includes snapshot information about PNC used by way of illustration and
is not intended as a full business or financial review. It should not be viewed in isolation
but rather in the context of all of the information made available by PNC in its SEC filings. We also make statements in this presentation, and we may from time to time make other statements, regarding
our outlook or expectations for earnings, revenues, expenses, capital levels, liquidity levels,
asset quality and/or other matters regarding or affecting PNC that are forward-looking statements within the meaning of the Private Securities Litigation Reform Act. Forward-looking statements are typically identified by
words such as believe, expect, anticipate, intend, outlook, estimate, forecast, will, project and
other similar words and expressions. Forward-looking statements are subject to numerous assumptions, risks and uncertainties, which change over time. Forward-looking statements speak only as of the date they are made. We do not assume any duty and do
not undertake to update our forward-looking statements. Actual results or future events
could differ, possibly materially, from those that we anticipated in our forward-looking statements, and future results could differ materially from our historical performance. Our forward-looking statements are subject to the following principal risks and uncertainties. We
provide greater detail regarding some of these factors in our 2008 Form 10-K, including in
the Risk Factors and Risk Management sections of that report, and in our other SEC filings. Our forward-looking statements may also be subject to other risks and uncertainties, including those that we may discuss elsewhere in this
presentation or in our filings with the SEC, accessible on the SECs website at
www.sec.gov and on or through our corporate website at www.pnc.com/secfilings. We have included these web addresses as inactive textual references only. Information on these websites is not part of this document.
Our businesses and financial results are affected by business and economic conditions, both generally and
specifically in the principal markets in which we operate. In particular, our businesses and
financial results may be impacted by: o
Changes in interest rates and valuations in the debt, equity and other
financial markets. o
Disruptions in the liquidity and other functioning of financial markets, including such
disruptions in the markets for real estate and other assets commonly securing financial
products. o
Actions by the Federal Reserve and other government agencies, including those that
impact money supply and market interest rates. o
Changes in our customers,
suppliers and other counterparties performance in general and their creditworthiness in particular. o
Changes in customer preferences and behavior, whether as a result of changing business and economic
conditions or other factors.
A continuation of recent turbulence in significant portions of the US
and global financial markets, particularly if it worsens, could impact our performance, both
directly by affecting our revenues and the value of our assets and liabilities and indirectly by affecting our counterparties and the economy generally.
Our business and financial performance could be impacted as the financial industry restructures in the
current environment, both by changes in the creditworthiness and performance of our
counterparties and by changes in the competitive landscape.
Given current economic and financial
market conditions, our forward-looking financial statements are subject to the risk that these conditions will be substantially different than we are currently expecting. These statements are based on our current
expectations that interest rates will remain low through 2009 with continued wide market credit
spreads, and our view that national economic trends currently point to a continuation of severe recessionary conditions in 2009 followed by a subdued recovery. Cautionary Statement Regarding Forward-Looking Information Appendix |

14
Legal and regulatory developments could have an impact on our ability to operate our businesses or our
financial condition or results of operations or our competitive position or reputation.
Reputational impacts, in turn, could affect matters such as business generation and retention, our ability to attract and retain management, liquidity, and funding. These legal and regulatory developments could include:
o
Changes resulting from the Emergency Economic Stabilization Act of 2008, the American Recovery and
Reinvestment Act of 2009, and other developments in response to the current economic and
financial industry environment, including current and future conditions or restrictions imposed as a result of our participation in the TARP Capital Purchase Program. o
Legislative and regulatory reforms generally, including changes to laws and regulations involving tax,
pension, bankruptcy, consumer protection, and other aspects of the financial institution
industry. o
Increased litigation risk from recent regulatory and other governmental developments. o
Unfavorable resolution of legal proceedings or regulatory and other governmental inquiries. o
The results of the regulatory examination and supervision process, including our failure to satisfy the
requirements of agreements with governmental agencies. o
Changes in accounting policies and principles.
Our issuance of securities to the US Department of the Treasury may limit our ability to return capital to
our shareholders and is dilutive to our common shares. If we are unable previously to redeem
the shares, the dividend rate increases substantially after five years.
Our business and operating results are affected by our ability to identify and effectively manage risks
inherent in our businesses, including, where appropriate, through the effective use of
third-party insurance, derivatives, and capital management techniques.
The adequacy of our intellectual property protection, and the extent of
any costs associated with obtaining rights in intellectual property claimed by others, can
impact our business and operating results.
Our ability to anticipate and respond to technological changes can have an impact on our ability to respond
to customer needs and to meet competitive demands.
Our ability to implement our business initiatives and strategies could affect our financial performance
over the next several years.
Competition can have an impact on customer acquisition, growth and retention, as well as on our credit
spreads and product pricing, which can affect market share, deposits and revenues.
Our business and operating results can also be affected by widespread natural disasters, terrorist
activities or international hostilities, either as a result of the impact on the economy and
capital and other financial markets generally or on us or on our customers, suppliers or other counterparties specifically.
Also, risks and uncertainties that could affect the results anticipated in forward-looking statements
or from historical performance relating to our equity interest in BlackRock, Inc. are discussed
in more detail in BlackRocks filings with the SEC, including in the Risk Factors sections of BlackRocks reports. BlackRocks SEC filings are accessible on the SECs website and on or through BlackRocks
website at www.blackrock.com. This material is referenced for informational purposes only and
should not be deemed to constitute a part of this document. In addition, our recent acquisition of National City Corporation (National City) presents us
with a number of risks and uncertainties related both to the acquisition transaction itself and
to the integration of the acquired businesses into PNC. These risks and uncertainties include the following:
The anticipated benefits of the transaction, including anticipated cost savings and strategic gains, may be
significantly harder or take longer to achieve than expected or may not be achieved in their
entirety as a result of unexpected factors or events. Cautionary Statement Regarding Forward-Looking Information (continued)
Appendix |

15
Cautionary Statement Regarding Forward-Looking Information (continued)
Appendix Our ability to achieve anticipated results from this transaction is dependent on the state going
forward of the economic and financial markets, which have been under significant stress
recently. Specifically, we may incur more credit losses from National Citys loan
portfolio than expected. Other issues related to achieving anticipated financial
results include the possibility that deposit attrition or attrition in key client, partner and other relationships may be greater than expected. Litigation and governmental investigations currently pending against National City, as well as
others that may be filed or commenced relating to National Citys business and
activities before the acquisition, could adversely impact our financial results. Our ability to achieve anticipated results is also dependent on our ability to bring National Citys systems, operating models, and controls into conformity with ours and to do so on our planned time schedule. The integration of National
Citys business and operations into PNC, which will include conversion of National
Citys different systems and procedures, may take longer than anticipated or be more costly than anticipated or have unanticipated adverse results relating to National Citys or PNCs existing businesses.
PNCs ability to integrate National City successfully may be adversely
affected by the fact that this transaction will result in PNC entering several markets where PNC did not previously have any meaningful retail presence. In addition to the National City transaction, we grow our business from time to time by acquiring
other financial services companies. Acquisitions in general present us with risks, in addition to those presented by the nature of the business acquired, similar to some or all of those described above relating to the National City acquisition. Any annualized, proforma, estimated, third party or consensus numbers in this presentation are used
for illustrative or comparative purposes only and may not reflect actual results.
Any consensus earnings estimates are calculated based on the earnings projections made by analysts who cover that company. The analysts opinions, estimates or forecasts (and therefore the consensus earnings estimates) are theirs alone, are not those of PNC or its management, and may not reflect PNCs, National Citys, or other
companys actual or anticipated results. |

16
Non-GAAP to GAAP Reconcilement Appendix in millions 2004 2005 2006 (c) 2007 2008 '04-'08 CAGR Total revenue $5,541 $6,327 $8,572 $6,705 $7,190 7% Noninterest expense 3,712 4,306 4,443 4,296 4,430 5% Pretax pre-provision earnings $1,829 $2,021 $4,129 $2,409 $2,760 Operating leverage 2% (c) Includes the impact on both revenue and expense of the BlackRock/MLIM transaction. For the year ended December 31 In millions, except percentages Tangible common equity ratio (a, b) March 31 December 31 September 30 2009 2008 2008 Common shareholders' equity $18,546 $17,490 $13,712 Add back: accumulated other comprehensive loss (AOCL) 3,289 3,949 2,230 Common shareholders' equity, excluding AOCL $21,835 $21,439 $15,942 Goodwill and other intangible assets, net of deferred taxes $9,448 $9,206 $8,812 Total assets $286,422 $291,081 $145,610 Add back: AOCL assets 2,658 3,282 2,107 Total assets, excluding AOCL $289,080 $294,363 $147,717 Tangible common equity ratio, as reported 3.3 % 2.9 % 3.6 % Add back: AOCL assets 1.1 1.4 1.5 Tangible common equity ratio, as adjusted 4.4 % 4.3 % 5.1 % (a) March 31, 2009 ratios are estimated. (b) Period-end common shareholders equity less goodwill and other intangible assets (net of deferred taxes) excluding mortgage
servicing rights, divided by period-end assets less goodwill and other intangible assets
(net of deferred taxes) excluding mortgage servicing rights
|

17
Non-GAAP to GAAP Reconcilement Appendix Dec 31 Mar 31 2008 2009 Change in millions Total revenue $1,676 $3,871 Noninterest expense 1,129 2,328 Pretax pre-provision earnings $547 $1,543 $996 For the three months ended |

18
Peer Group of Banks Appendix The PNC Financial Services Group, Inc. PNC BB&T Corporation BBT Bank of America Corporation BAC Capital One Financial, Inc. COF Comerica Inc. CMA Fifth Third Bancorp FITB JPMorgan Chase JPM KeyCorp KEY M&T Bank MTB Regions Financial Corporation RF SunTrust Banks, Inc. STI U.S. Bancorp USB Wells Fargo & Company WFC Ticker |