ELECTRONIC SLIDE PRESENTATION
Published on February 3, 2009

The PNC
Financial Services Group, Inc. Fourth Quarter 2008 Earnings Conference Call February 3, 2009 Exhibit 99.2 |

2 Cautionary Statement Regarding Forward-Looking Information and Adjusted Information This presentation includes snapshot information about PNC used by way of illustration. It is not intended as a full business or financial review and should be viewed in the context of all of the information made available by PNC in its SEC filings. The presentation also contains forward-looking statements regarding our outlook or expectations relating to PNCs future business, operations, financial condition, financial performance and asset quality. Forward-looking statements are necessarily subject to numerous assumptions, risks and uncertainties, which change over time. The forward-looking statements in this presentation are qualified by the factors affecting forward-looking statements identified in the more detailed Cautionary Statement included in the Appendix, which is included in the version of the presentation materials posted on our corporate website at www.pnc.com/investorevents. We provide greater detail regarding these factors in our 2007 Form 10-K and our 2008 Form 10-Qs, including in the Risk Factors and Risk Management sections, and in our other SEC filings (accessible on the SECs website at www.sec.gov and on or through our corporate website at www.pnc.com/secfilings). We have included these web addresses as inactive textual references only. Information on these websites is not part of this document. Future events or circumstances may change our outlook or expectations and may also affect the nature of the assumptions, risks and uncertainties to which our forward-looking statements are subject. The forward-looking statements in this presentation speak only as of the date of this presentation. We do not assume any duty and do not undertake to update those statements. In this presentation, we will sometimes refer to adjusted results to help illustrate the impact of certain types of items. This information supplements our results as reported in accordance with GAAP and should not be viewed in isolation from, or a substitute for, our GAAP results. We provide these adjusted amounts and reconciliations so that investors, analysts, regulators and others will be better able to evaluate the impact of these items on our results for the periods presented. We believe that information as adjusted for the impact of the specified items may be useful due to the extent to which these items are not indicative of our ongoing operations. In certain discussions, we may also provide information on yields and margins for all interest-earning assets calculated using net interest income on a taxable-equivalent basis by increasing the interest income earned on tax-exempt assets to make it fully equivalent to interest income earned on taxable investments. We believe this adjustment may be useful when comparing yields and margins for all earning assets. This presentation may also include a discussion of other non-GAAP financial measures, which, to the extent not so qualified therein or in the Appendix, is qualified by GAAP reconciliation information available on our corporate website at www.pnc.com under About PNCInvestor Relations. |

3 PNCs Business Model Performed Relatively Well The National City acquisition provides a tremendous opportunity to leverage our business model The acquisition allowed us to mark higher risk assets to fair value under purchase accounting While credit quality migration accelerated, our reserve coverage ratios strengthened The TARP Capital Purchase Program issuance enhanced our already strong capital levels We remained core funded with substantial liquidity Excitement and enthusiasm about the acquisition allows us to continue our focus on meeting the needs of our clients |
4 A Leader in Executing the Banking Basics (32%) 11% 3 year CAGR (28%) 9% 5 year CAGR (37%) 15% 1 year Pretax pre-provision earnings growth 11% 14% Average noninterest-bearing deposits 10% 8% (3%) 7% 13% Peers 12% 11% 6% 12% 19% PNC 4Q08 growth versus 2Q07 Average total loans Average total deposits Average noninterest-bearing deposits Average total deposits Average total loans 4Q08 annualized linked quarter growth (1) Peer comparison source: SNL DataSource; Peers represents average of super-regional
banks identified in the Appendix other than PNC. (2) Total revenue less
noninterest expense. Further information is provided in the Appendix. PNC has
remained open for business throughout the credit crunch
and remains committed to meeting the needs of our clients
Note: PNC average balances and pretax pre-provision earnings were not impacted by the
National City acquisition, which closed on December 31, 2008.
while delivering long term value for our shareholders. 1 2 |

5 Key Messages Rapidly weakening economic conditions impacted results Strengthened capital, liquidity and loan loss reserve coverage Created significant positive operating leverage offsetting a substantial portion of increased credit costs Remained focused on the balance sheet, transformation process underway Financial projections of acquisition exceed original expectations |

6 Capital and Liquidity PNC Is Well-Positioned in Terms of Capital and Liquidity. 21% 88% 5.1% 3.6% 8.2% Sept 30 2008 15% 91% 4.1% 2.8% 9.7% Dec 31 2008 Substantial 12/31/08 liquidity position enabling PNC to meet all 2009 debt maturities Dec 31 2007 Key Capital Ratios 6.8% Tier 1 risk-based 4.7% Tangible common equity 4.8% Tangible common equity excluding accumulated other comprehensive loss 2,3 22% Investment securities to total assets 83% Loans to deposits Key Liquidity Ratios (1) December 31, 2008 estimated. (2) Common shareholders equity less goodwill and other intangible assets net of eligible deferred taxes (excluding mortgage servicing rights) divided by period-end assets less goodwill and other intangible assets net of eligible deferred taxes (excluding mortgage servicing rights). (3) Accumulated other comprehensive loss as of 12/31/08, 9/30/08, and 12/31/07 was $3.9 billion, $2.2 billion, and $147 million, respectively. Adjusted percentages are reconciled to GAAP in the Appendix. 1 2 |
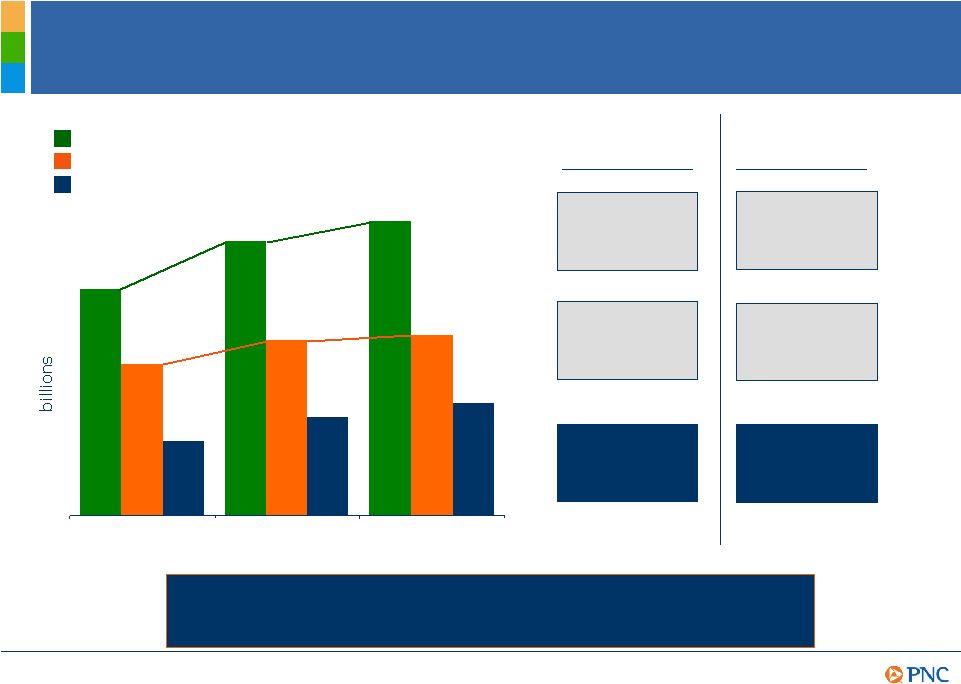
7 $5.5 $3.7 $6.7 $4.3 $7.2 $4.4 2004 2007 2008 PNCs Disciplined Growth Strategies Resulted in Significant Positive Operating Leverage. Creating Positive Operating Leverage Expense +3% Revenue +7% Operating Leverage +4% 2007-2008 Revenue +7% Expense +5% Operating Leverage +2% 2004-2007 CAGR $1.8 $2.4 $2.8 Revenue Expense Pretax pre-provision earnings (1) Total revenue less noninterest expense. Further information is provided in the Appendix. 1 |

8 PNCs Balance Sheet Composition PNCs Commitment to Prudent Risk Management Remains a Top Priority for Creating Long Term Value. 100% 8.7 7.1 17.9 66.3% 100% 15.1 60.3 14.9 1.5 8.2% 2008 % of total $291.1 25.4 20.6 52.2 $192.9 $291.1 43.8 175.5 43.5 4.4 $23.9 Dec 31 2008 100% 10.7 7.5 22.3 59.5% 100% 18.7 49.2 21.8 2.8 7.5% 2007 % of total Total liabilities and shareholders equity Shareholders equity Other liabilities and interests in consolidated entities Total borrowed funds Deposits Total assets Other assets and allowance for loan and lease losses Loans, net of unearned income Investment securities Loans held for sale Cash and short-term investments in billions |

9 Credit Quality Migration (1) As of quarter end, except net charge-off percentage. Net charge-off percentage is
annualized. Information for December 31, 2008, other than net charge-offs, includes the impact of National City, which we acquired as of December 31, 2008. 2008 151 142 125 236 Allowance for loan and lease losses to nonperforming loans 1.22 1.35 1.40 2.23 Allowance for loan and lease losses to total loans .44 .51 .60 .74 Nonperforming assets to total assets .87 1.00 1.16 1.23 Nonperforming assets to total loans and foreclosed assets .81 .95 1.12 .95 Nonperforming loans to total loans .57 .62 .66 1.09 Net charge-offs to average loans Mar 31 June 30 Sept 30 Dec 31 Asset quality ratios , % Credit Quality Migration, While Accelerating, Remains Manageable Credit Quality Migration, While Accelerating, Remains Manageable in Light of Our Ability to Maintain a Strong Capital Position. in Light of Our Ability to Maintain a Strong Capital Position. 1 |

10
Investment Securities $(5.4) 100% $43.5 Total investment securities 3.1 years 3.1 3.2 5.3 8.7 $23.2 Fair value Dec 31, 2008 Expected weighted average life (.1) (.4) (.9) (4.4) $.4 Net unrealized gain/(loss) 20 Non-agency residential mortgage-backed 7 Other (primarily municipals) 12 Commercial mortgage-backed 8 Asset-backed 53% % of total Agency residential mortgage-backed in billions (1) Excluding corporate stocks and other included in Other. (2) Rated by at least two nationally recognized rating agencies. PNCs Investment Securities Portfolio Is High Quality. 2008 other-than-temporary impairments of $314 million, including $74 million of FNMA/FHLMC preferred stock $180 million, or 75% of the remaining impairments, were attributable to changes in market spreads and market illiquidity 91% of the portfolio is Agency or AAA-rated equivalent 1 2 |

11
A Financially Compelling Transaction 15% + 15% + Estimated internal rate of return Significant early client wins across the franchise $2.1 billion $2.4 billion Performing loans $11.0 billion $7.4 billion Impaired loans $1.2 billion $1.2 billion + Estimated annualized cost reduction $1.8 billion $504 million Conforming credit provision adjustment 2010 Estimates at announcement²
2009 Closing Estimated year of accretion to GAAP EPS Purchase accounting adjustments: National City acquisition financial assessment PNC Is Increasingly Confident about the Long Term Benefits of the Acquisition. (1) The acquisition of National City was announced on October 24, 2008 and closed on December 31,
2008. (2) These estimates were based on pre-announcement due diligence using
interim financial information, including loan balances as of August 31, 2008. 1
|

12
2009 Assumptions Severe recessionary conditions Continued credit quality migration Continued growth in total revenue driven by net interest income Well controlled expenses while investing in growth initiatives Enhanced capital ratios |

13
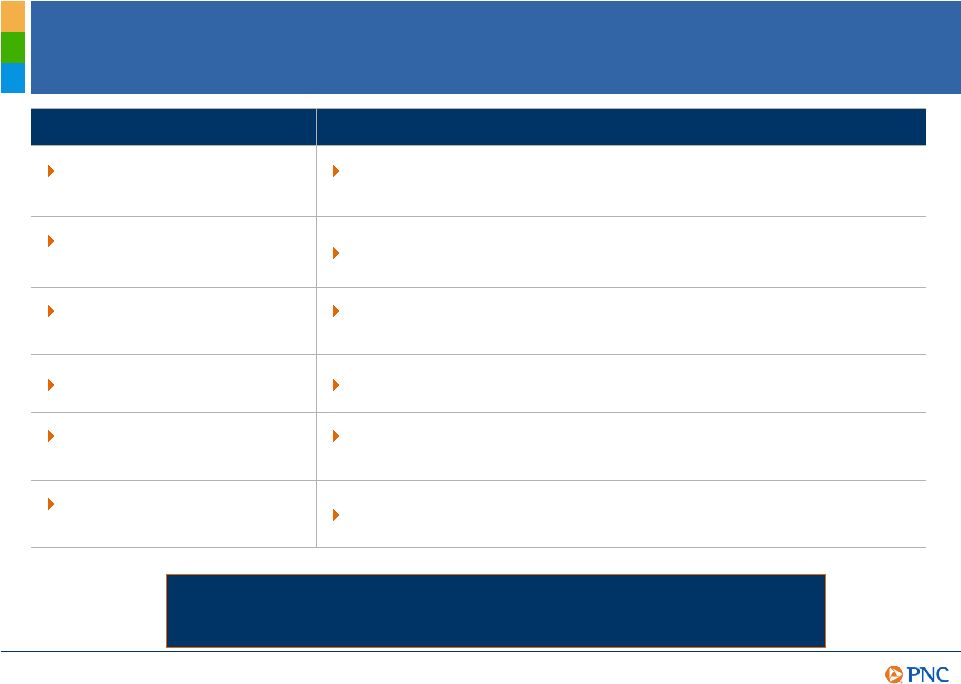
Major Integration Accomplishments A Significant Amount of Progress Has Been Made and We Are on A Significant Amount of Progress Has Been Made and We Are on Track to Meet Our Next Objectives. Track to Meet Our Next Objectives. Appointed integration leaders and teams Announced leadership team and regional executives Appointed new Chief Executive Officer of the mortgage business Announced transaction on Oct 24, 2008 Kicked off extensive deposit gathering campaign Conducted 15+ town hall meetings across the new franchise Systems decisions nearly final Launched comprehensive customer and employee communications Conversion timelines have been set Product and data mapping nearly complete Announced business, market, and staff organizations Closed transaction, purchase accounting marks significantly de-risked the balance sheet
|
14
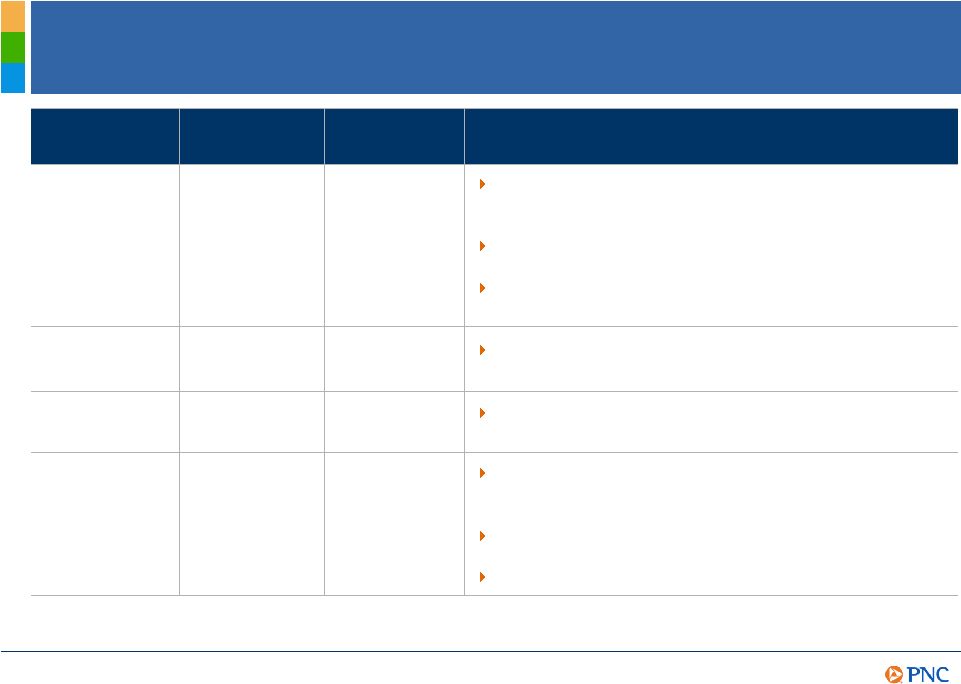
Key Integration Objectives Purchase accounting marks finalized, credit approval and loan/deposit pricing processes aligned Return the balance sheet to a moderate risk profile Distressed and core loan portfolios identified Systems application selection nearly complete and conversion timelines set Schedule for branch conversion near completion Process underway, expect significant portion to be achieved through attrition and elimination of open positions Cost save plan being implemented Status as of Feb 3, 2009 Identify distressed loans and maximize value Convert branch network Achieve $1.2 billion of annualized cost saves Integrate technology platforms Eliminate 5,800 positions across organization Objective The Foundation for a Smooth and Successful Integration Has Been Established and Communicated. |
15
Significant Retail and Wealth Management Revenue Opportunity Combine products and platforms for full impact delivery across our attractive high net worth markets Gain synergies by leveraging the strengths of personal wealth areas and institutional product sets Leverage our established branch referral processes $110B AUM $125B AUA $57B AUM $87B AUA Asset management Expand touch point opportunities to increase our brand awareness and convenience 6,232 4,041 ATMs Leverage one of the largest branch distribution networks in the U.S. 2,589 1,148 Branches 2.9 million Legacy PNC 6+ million PNC Allows for deeper penetration of our product set, especially fee based and payment business related products Combine focus on on-line innovation and platform integration efficiencies Leverage strengths in small business client area to provide highly profitable sources of funding Consumer and small business customers Opportunity As of December 31, 2008. PNC acquired National City Corporation on December 31, 2008. (1) Does not include and (2) includes the impact of National City. (3) None of anticipated branch divestitures or closings assumed. 1 3 3 2 |
16
Significant Corporate & Institutional Banking Revenue Opportunity Combine expertise across top industries Retain and deepen long-term relationships Right size portfolios to meet risk/return criteria $45 billion $17 billion Commercial loans (excluding
real estate) Combine strengths across DUS, FHA, Mezzanine, REIT, and low income housing capabilities Scale back residential development exposures $28 billion $9 billion Commercial real estate loans Leverage established deposit gathering strategy and relationship based approach $27 billion $15 billion Deposits Leverage our demonstrated cross selling capabilities Significant opportunity to leverage our range of relationship-based products and services $400 million $336 million Capital markets revenue Leverage combined strengths in the middle market Opportunity to significantly improve risk adjusted returns through fee-based product offerings $975 million $545 million Treasury management revenue Legacy PNC PNC Opportunity As of or for the year ended December 31, 2008. PNC acquired National City Corporation on
December 31, 2008. (1) Does not include and (2) includes the impact of National
City. Revenue items include PNC estimates of National City revenue as if the acquisition had been completed at the beginning of 2008. 1 2 |

17
A relentless focus on implementing the PNC model Commitment to returning to a moderate risk profile Grow high quality revenue streams A focus on continuous improvement Disciplined approach to capital management Strong execution capabilities Summary PNC Continues to Build a Great Company. PNC Continues to Build a Great Company. |

18
Cautionary Statement Regarding Forward-Looking Information Appendix This presentation includes snapshot information about PNC used by way of illustration and is not intended as a full business or financial review. It should not be viewed in isolation but rather in the context of all of the information made available by PNC in its SEC filings. We also make statements in this presentation, and we may from time to time make other statements, regarding our outlook or expectations for earnings, revenues, expenses and/or other matters regarding or affecting PNC that are forward-looking statements within the meaning of the Private Securities Litigation Reform Act. Forward-looking statements are typically identified by words such as believe, expect, anticipate, intend, outlook, estimate, forecast, will, project, target, potential and other similar words and expressions. Forward-looking statements are subject to numerous assumptions, risks and uncertainties, which change over time. Forward-looking statements speak only as of the date they are made. We do not assume any duty and do not undertake to update our forward-looking statements. Because forward-looking statements are subject to assumptions and uncertainties, actual results or future events could differ, possibly materially, from those that we anticipated in our forward-looking statements, and future results could differ materially from our historical performance. Our forward-looking statements are subject to the following principal risks and uncertainties. We provide greater detail regarding some of these factors in our 2007 Form 10-K and our 2008 Form 10-Qs, including in the Risk Factors and Risk Management sections of those reports, and in our other SEC reports. Our forward-looking statements may also be subject to other risks and uncertainties, including those that we may discuss elsewhere in this presentation or in our filings with the SEC, accessible on the SECs website at www.sec.gov and on or through our corporate website at www.pnc.com/secfilings. We have included these web addresses as inactive textual references only. Information on these websites is not part of this document. Our businesses and financial results are affected by business and economic conditions, both generally and specifically in the principal markets in which we operate. In particular, our businesses and financial results may be impacted by: o Changes in interest rates and valuations in the debt, equity and other financial markets. o Disruptions in the liquidity and other functioning of financial markets, including such disruptions in the markets for real estate and other assets commonly securing financial products. o Actions by the Federal Reserve and other government agencies, including those that impact money supply and market interest rates. o Changes in our customers, suppliers and other counterparties performance in general and their creditworthiness in particular. o Changes in customer preferences and behavior, whether as a result of changing business and economic conditions or other factors. o Changes resulting from the Emergency Economic Stabilization Act of 2008, and other legislative and regulatory developments in response to the current economic and financial situation, including conditions imposed as a result of our participation in the Capital Purchase Program. A continuation of recent turbulence in significant portions of the US and global financial markets, particularly if it worsens, could impact our performance, both directly by affecting our revenues and the value of our assets and liabilities and indirectly by affecting our counterparties and the economy generally. Our business and financial performance could be impacted as the financial industry restructures in the current environment, both by changes in the creditworthiness and performance of our counterparties and by changes in the competitive landscape. |

19
Cautionary Statement Regarding Forward-Looking Information (continued)
Appendix Given current economic and financial market conditions, our forward-looking financial statements are subject to the risk that these conditions will be substantially different than we are currently expecting. These statements are based on our current expectations that interest rates will remain low through 2009 with continued wide market credit spreads, and our view that national economic trends currently point to a continuation of severe recessionary conditions in 2009 followed by a subdued recovery. Our operating results are affected by our liability to provide shares of BlackRock common stock to help fund certain BlackRock long-term incentive plan (LTIP) programs, as our LTIP liability is adjusted quarterly (marked-to-market) based on changes in Blackrock's common stock price and the number of remaining committed shares, and we recognize gain or loss on such shares at such times as shares are transferred for payouts under the LTIP programs. Legal and regulatory developments could have an impact on our ability to operate our businesses or our financial condition or results of operations or our competitive position or reputation. Reputational impacts, in turn, could affect matters such as business generation and retention, our ability to attract and retain management, liquidity, and funding. These legal and regulatory developments could include: (a) the unfavorable resolution of legal proceedings or regulatory and other governmental inquiries; (b) increased litigation risk from recent regulatory and other governmental developments; (c) the results of the regulatory examination process, our failure to satisfy the requirements of agreements with governmental agencies, and regulators future use of supervisory and enforcement tools; (d) legislative and regulatory reforms, including changes to laws and regulations involving tax, pension, education lending, the protection of confidential customer information, and other aspects of the financial institution industry; and (e) changes in accounting policies and principles. Our issuance of securities to the United States Treasury may limit our ability to return capital to our shareholders and is dilutive to our common shares. If we are unable previously to redeem the shares, the dividend rate increases substantially after five years. Our business and operating results are affected by our ability to identify and effectively manage risks inherent in our businesses, including, where appropriate, through the effective use of third-party insurance, derivatives, and capital management techniques. The adequacy of our intellectual property protection, and the extent of any costs associated with obtaining rights in intellectual property claimed by others, can impact our business and operating results. Our ability to anticipate and respond to technological changes can have an impact on our ability to respond to customer needs and to meet competitive demands. Our ability to implement our business initiatives and strategies could affect our financial performance over the next several years. Competition can have an impact on customer acquisition, growth and retention, as well as on our credit spreads and product pricing, which can affect market share, deposits and revenues. Our business and operating results can also be affected by widespread natural disasters, terrorist activities or international hostilities, either as a result of the impact on the economy and capital and other financial markets generally or on us or on our customers, suppliers or other counterparties specifically. Also, risks and uncertainties that could affect the results anticipated in forward-looking statements or from historical performance relating to our equity interest in BlackRock, Inc. are discussed in more detail in BlackRocks filings with the SEC, including in the Risk Factors sections of BlackRocks reports. BlackRocks SEC filings are accessible on the SECs website and on or through BlackRocks website at www.blackrock.com. This material is referenced for informational purposes only and should not be deemed to constitute a part of this document. |

20
Cautionary Statement Regarding Forward-Looking Information (continued)
Appendix In addition, our recent acquisition of National City Corporation (National City) presents us with a number of risks and uncertainties related both to the acquisition transaction itself and to the integration of the acquired businesses into PNC. These risks and uncertainties include the following: The transaction may be substantially more expensive to complete (including the required divestitures and the integration of National Citys businesses) and the anticipated benefits, including anticipated cost savings and strategic gains, may be significantly harder or take longer to achieve than expected or may not be achieved in their entirety as a result of unexpected factors or events. Our ability to achieve anticipated results from this transaction is dependent on the state going forward of the economic and financial markets, which have been under significant stress recently. Specifically, we may incur more credit losses from National Citys loan portfolio than expected. Other issues related to achieving anticipated financial results include the possibility that deposit attrition or attrition in key client, partner and other relationships may be greater than expected. Litigation and governmental investigations currently pending against National City, as well as others that may be filed or commenced as a result of this transaction or otherwise, could impact the timing or realization of anticipated benefits to PNC or otherwise adversely impact our financial results. Our ability to achieve anticipated results is also dependent on our ability to bring National Citys systems, operating models, and controls into conformity with ours and to do so on our planned time schedule. The integration of National Citys business and operations into PNC, which will include conversion of National Citys different systems and procedures, may take longer than anticipated or be more costly than anticipated or have unanticipated adverse results relating to National Citys or PNCs existing businesses. PNCs ability to integrate National City successfully may be adversely affected by the fact that this transaction will result in PNC entering several markets where PNC did not previously have any meaningful retail presence. In addition to the National City transaction, we grow our business from time to time by acquiring other financial services companies. Acquisitions in general present us with risks, in addition to those presented by the nature of the business acquired, similar to some or all of those described above relating to the National City acquisition. Any annualized, proforma, estimated, third party or consensus numbers in this presentation are used for illustrative or comparative purposes only and may not reflect actual results. Any consensus earnings estimates are calculated based on the earnings projections made by analysts who cover that company. The analysts opinions, estimates or forecasts (and therefore the consensus earnings estimates) are theirs alone, are not those of PNC or its management, and may not reflect PNCs, National Citys, or other companys actual or anticipated results. |

21
Non-GAAP to GAAP Reconcilement Appendix In millions, except percentages Tier 1 risk-based capital ratio (a) December 31 2008 Tier 1 risk-based capital $24,328 Less: TARP issuance 7,579 Tier 1 risk-based capital less TARP issuance $16,749 Risk weighted assets (assumes no decrease in assets without TARP issuance) $249,498 Tier 1 risk-based capital ratio as reported 9.7 % Less: TARP issuance 3.0 Tier 1 risk-based capital ratio as adjusted 6.7 % Tangible common equity ratio (a, b) December 31 September 30 December 31 2008 2008 2007 Common shareholders' equity $17,490 $13,712 $14,847 Add back: accumulated other comprehensive loss (AOCL) 3,949 2,230 147 Common shareholders' equity, excluding AOCL $21,439 $15,942 $14,994 Goodwill and other intangible assets, net of deferred taxes $9,737 $8,812 $8,734 Total assets $291,081 $145,610 $138,920 Add back: AOCL assets 3,282 2,107 (30) Total assets, excluding AOCL $294,363 $147,717 $138,890 Tangible common equity ratio, as reported 2.8 % 3.6 % 4.7 % Add back: AOCL assets 1.3 1.5 .1 Tangible common equity ratio, as adjusted 4.1 % 5.1 % 4.8 % (a) December 31, 2008 ratios are estimated. (b) Common shareholders equity less goodwill and other intangible assets net of eligible deferred taxes (excluding mortgage servicing rights) divided by period-end assets less goodwill and other intangible assets net of eligible deferred taxes (excluding mortgage servicing rights). |

22
Non-GAAP to GAAP Reconcilement Appendix In millions, except per share data THREE MONTHS ENDED Adjustments, Net Diluted Adjustments, Net Diluted Pretax Income EPS Pretax Income EPS Net income (loss), as reported $(248) $(.77) $248 $.71 Adjustments: Conforming provision for credit losses - National City $504 328 .94 Other integration costs 81 52 .15 $14 10 .02 Net income, as adjusted $132 $.32 $258 $.73 Adjustments, Net Diluted Pretax Income EPS Net income, as reported $178 $.52 Adjustments: Integration costs $79 (a) 50 .15 Net income, as adjusted $228 $.67 YEAR ENDED Adjustments, Net Diluted Adjustments, Net Diluted Pretax Income EPS Pretax Income EPS Net income, as reported $882 $2.46 $1,467 $4.35 Adjustments: Conforming provision for credit losses - National City $504 328 .95 Other integration costs 145 (b) 94 .27 $151 (a) 99 .30 Net income, as adjusted $1,304 $3.68 $1,566 $4.65 (a) Includes the $45 million conforming provision for credit losses related to the Yardville
acquisition. (b) Includes the $23 million conforming provision for credit losses related to the Sterling
acquisition. December 31, 2008 September 30, 2008 December 31, 2007 December 31, 2008 December 31, 2007 For the year ended December 31, in millions 2003 2004 2005 2006 (c) 2007 2008 '04-'07 CAGR '07-'08 Change '05-'08 CAGR '03-'08 CAGR Total revenue $5,253 $5,541 $6,327 $8,572 $6,705 $7,190 7% 7% Noninterest expense 3,476 3,712 4,306 4,443 4,296 4,430 5% 3% Pretax pre-provision earnings $1,777 $1,829 $2,021 $4,129 $2,409 $2,760 15% 11% 9% Operating leverage 2% 4% (c) Includes the impact on both revenue and expense of the BlackRock/MLIM transaction.
|

23
The PNC Financial Services Group, Inc. PNC BB&T Corporation BBT Comerica CMA Fifth Third Bancorp FITB KeyCorp KEY Regions Financial RF SunTrust Banks, Inc. STI U.S. Bancorp USB Wells Fargo & Company WFC Ticker Peer Group of Super-Regional Banks Appendix |