ELECTRONIC PRESENTATION SLIDES FOR EARNINGS RELEASE CONFERENCE CALL
Published on July 17, 2008

The PNC
Financial Services Group, Inc. Second Quarter 2008 Earnings Conference Call July 17, 2008 Exhibit 99.2 |

2 Cautionary Statement Regarding Forward-Looking Information and Adjusted Information This presentation contains forward-looking statements regarding our outlook or expectations relating to PNCs future business, operations, financial condition, financial performance and asset quality. Forward-looking statements are necessarily subject to numerous assumptions, risks and uncertainties, which change over time. The forward-looking statements in this presentation are qualified by the factors affecting forward-looking statements identified in the more detailed Cautionary Statement included in the Appendix, which is included in the version of the presentation materials posted on our corporate website at www.pnc.com/investorevents. We provide greater detail regarding these factors in our 2007 Form 10-K and first quarter 2008 Form 10-Q, including in the Risk Factors and Risk Management sections, and in our other SEC reports (accessible on the SECs website at www.sec.gov and on or through our corporate website at www.pnc.com/secfilings). Future events or circumstances may change our outlook or expectations and may also affect the nature of the assumptions, risks and uncertainties to which our forward-looking statements are subject. The forward-looking statements in this presentation speak only as of the date of this presentation. We do not assume any duty and do not undertake to update those statements. In this presentation, we will sometimes refer to adjusted results to help illustrate the impact of the deconsolidation of BlackRock near the end of third quarter 2006 and the impact of certain types of items. Adjusted results reflect, as applicable, the following types of adjustments: (1) 2006 and earlier periods reflect the impact of the deconsolidation of BlackRock by adjusting as if we had recorded our BlackRock investment on the equity method prior to its deconsolidation; (2) adjusting 2006 periods, as applicable, to exclude the impact of the third quarter 2006 gain on the BlackRock/MLIM transaction and losses on the repositioning of PNCs securities and mortgage loan portfolios; (3) adjusting fourth quarter 2006 and 2007 periods to exclude the net mark-to-market adjustments on PNCs remaining BlackRock LTIP shares obligation and, as applicable, the gain PNC recognized in first quarter 2007 in connection with the companys transfer of BlackRock shares to satisfy a portion of its BlackRock LTIP shares obligation; (4) adjusting 2007 and 2006 periods to exclude, as applicable, integration costs related to acquisitions and to the BlackRock/MLIM transaction; (5) adjusting 2007 periods, as applicable, for the fourth quarter 2007 Visa litigation charge; and (6) adjusting, as appropriate, for the tax impact of these adjustments. We have provided these adjusted amounts and reconciliations so that investors, analysts, regulators and others will be better able to evaluate the impact of these items on our results for the periods presented, in addition to providing a basis of comparability for the impact of the BlackRock deconsolidation given the magnitude of the impact of deconsolidation on various components of our income statement and balance sheet. We believe that information as adjusted for the impact of the specified items may be useful due to the extent to which these items are not indicative of our ongoing operations as the result of our management activities on those operations. While we have not provided other adjustments for the 2007 and earlier periods discussed, this is not intended to imply that there could not have been other similar types of adjustments, but any such adjustments would not have been similar in magnitude to the amount of the adjustments shown. In certain discussions, we may also provide information on yields and margins for all interest-earning assets calculated using net interest income on a taxable-equivalent basis by increasing the interest income earned on tax-exempt assets to make it fully equivalent to interest income earned on taxable investments. We believe this adjustment may be useful when comparing yields and margins for all earning assets. This presentation may also include a discussion of other non-GAAP financial measures, which, to the extent not so qualified therein or in the Appendix, is qualified by GAAP reconciliation information available on our corporate website at www.pnc.com under About PNCInvestor Relations. |

3 Business Model Performed Well Delivered strong second quarter 2008 results - Reported earnings of $1.45 per diluted share, $1.37 adjusted - Diversified revenue growth created positive operating leverage Key Messages - Well-positioned balance sheet resulted in strong revenue growth - Asset quality migration and related costs remained manageable - Strengthened capital and maintained strong liquidity position Despite Ongoing Market Volatility, PNC Despite Ongoing Market Volatility, PNC Delivered Excellent Results. Delivered Excellent Results. (1) Adjusted diluted earnings per share of $1.37 for the second quarter of 2008 excludes the
after-tax gain of $52 million, or $.15 per diluted share, on the mark to market of
our BlackRock LTIP shares obligation and $24 million, or $.07 per share, of after-tax integration costs. 1 |

4 Differentiated Balance Sheet As of June 30, 2008. Annualized net charge-off percentage is to average loans for the
three months ended. PNCs Moderate Risk Profile Helps Differentiate the Balance Sheet. 2 2.3 Loans held for sale 19 27.3 Other assets 22 31.0 Securities available for sale 51 73.0 Loans, net of unearned income $142.8 $9.2 June 30, 2008 100% 6% % of assets Total assets Cash and short-term investments Category (billions)
% NPA Net charge-off % (billions) .77 .73 $33.5 Commercial, including lease financing 1.50 .78 7.4 Comml real estate (non-residential) 13.60 1.38 2.1 Commercial residential real estate 1.47 .77 $43.0 Total commercial lending Loans, net of unearned income
% 90 days past due .35 .39 .39 .32 Excluding NPLs .60 .41 $30.0 Total consumer lending 6.3 9.0 $14.7 .63 .01 .53 Net charge-off % .47 Other .94 Residential mortgage .44 Home equity Including NPLs (billions) |
5 1.10% 1.09% 1.09% 1.22% 1.21% 1.35% 1.00% 1.05% 1.10% 1.15% 1.20% 1.25% 1.30% 1.35% 1.40% Credit Quality Migration Remained Manageable PNCs Credit Coverage Ratios Are Consistent with a Moderate Risk Profile. Net charge-offs to average loans (1) Annualized for the three months ended. (2) At period end. 1Q07 2Q07 3Q07 4Q07 1Q08 2Q08 Allowance for loan and lease losses to loans 1Q07 2Q07 3Q07 4Q07 1Q08 2Q08 1 2 0.27% 0.20% 0.57% 0.62% 0.30% 0.49% 0.10% 0.20% 0.30% 0.40% 0.50% 0.60% 0.70% 0.80% 0.90% 1.00% |
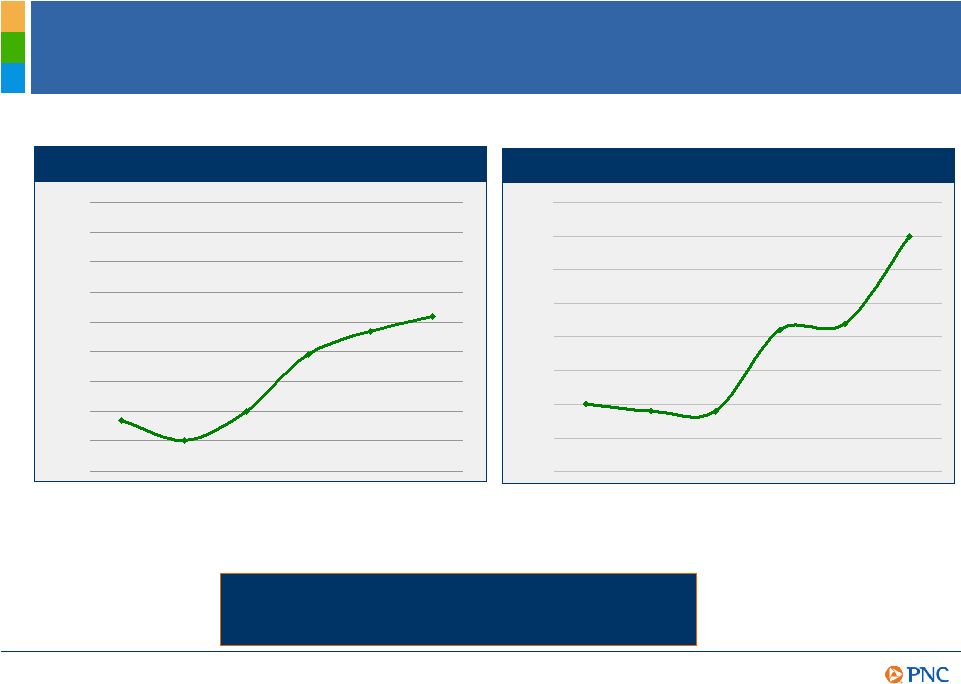
6 Target Range Staying Liquid and Building Capital Flexibility Tier 1 Capital Ratio 8.5% 7.5% PNC Is Well-Positioned in Terms of Liquidity and Capital Flexibility. 4Q07 1Q08 2Q08 Numbers at period end. (1) Unused borrowing capacity. (2) Estimated. 6.8% 7.7% 8.1% Available Liquidity 4Q07 1Q08 2Q08 $30B $27B $27B 1 2 |
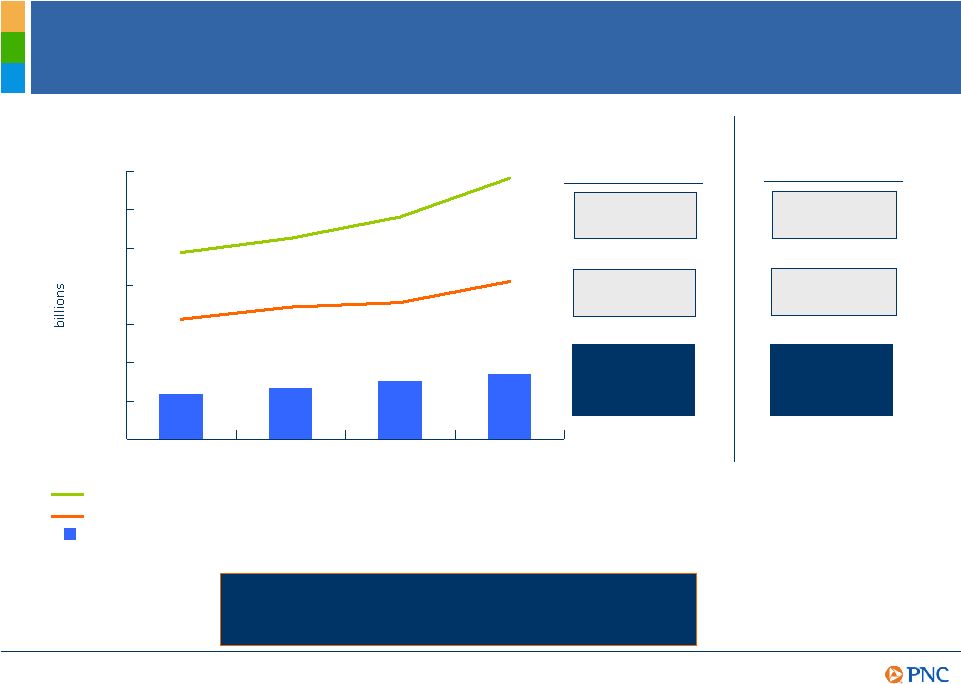
7 +14% +32% +10% +9% +12% +19% For the three months ended June 30, 2008. The sum of deposit NII and loan NII equals GAAP net
interest income. Further information regarding revenue mix is provided in the
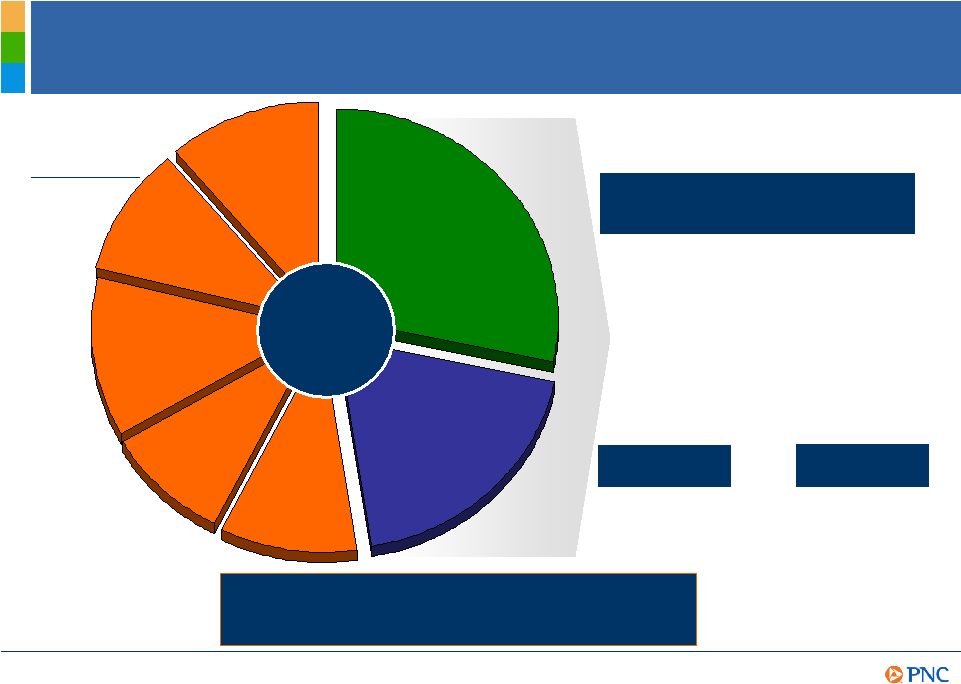
Appendix. Change vs. 1Q08 2Q07 Strong and Diverse Revenue Growth PNCs Revenue Mix Is Valuable and Relies Less on Credit Capital.
. Deposit and other net interest income Loan net interest income 10% 29% 19% Corporate services 12% Consumer services and deposit charges 9% Other 10% Asset management 11% Fund servicing Total revenue $2.0 billion Net interest income Noninterest income Total revenue Contribution to total revenue 2Q08 |
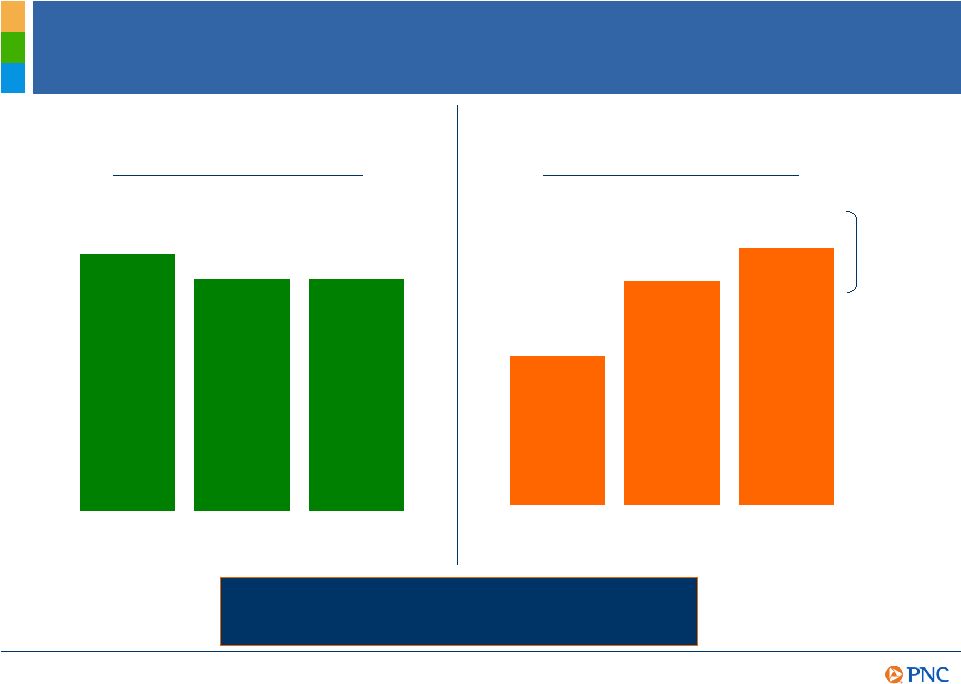
8 $0 $1 $2 $3 $4 $5 $6 $7 Revenue +12% Creating Positive Operating Leverage Adjusted Revenue (as reported $5.5 billion, $6.3 billion, $8.6 billion, $6.7 billion for 2004, 2005, 2006, 2007, respectively) Adjusted Noninterest Expense (as reported $3.7 billion, $4.3 billion, $4.4 billion, $4.3 billion for 2004, 2005, 2006, 2007, respectively) Adjusted Net Income (as reported $1.2 billion, $1.3 billion, $2.6 billion, $1.5 billion for 2004, 2005, 2006, 2007, respectively) $1.2 $1.3 $1.5 (1) As reported: revenue 7%, expense 5%, operating leverage 2%. Adjusted amounts are reconciled to GAAP amounts in the Appendix. 2004 2005 2006 Expense +9% Compound Annual Growth (2004-2007, as adjusted)¹
Revenue +16% Expense +9% For the six months ended June 30 2008 vs. 2007 Operating Leverage +3% Operating Leverage +7% $1.7 2007 PNCs Disciplined Growth Strategies Help Drive Positive Operating Leverage. |

9 Markets Sales across franchise at or above goals New markets outperforming expectations Corporate banking posting excellent cross-sell results Fund servicing revenue pipeline strong ARCS providing diversity with record production levels Innovative Products and Solutions Virtual Wallet Healthcare Advantage PFPC transformation to PNC Global Investment Servicing - Albridge Solutions and Coates Analytics Strategic Growth Initiatives PNCs Strategic Decisions and Focus Are Paying Off.
. |

10
Product Innovation: Capturing Gen Y |

11
Cautionary Statement Regarding Forward-Looking Information Appendix We make statements in this presentation, and we may from time to time make other statements, regarding our outlook or expectations for earnings, revenues, expenses and/or other matters regarding or affecting PNC that are forward-looking statements within the meaning of the Private Securities Litigation Reform Act. Forward-looking statements are typically identified by words such as believe, expect, anticipate, intend, outlook, estimate, forecast, will, project and other similar words and expressions. Forward-looking statements are subject to numerous assumptions, risks and uncertainties, which change over time. Forward-looking statements speak only as of the date they are made. We do not assume any duty and do not undertake to update our forward-looking statements. Because forward-looking statements are subject to assumptions and uncertainties, actual results or future events could differ, possibly materially, from those that we anticipated in our forward-looking statements, and future results could differ materially from our historical performance. Our forward-looking statements are subject to the following principal risks and uncertainties. We provide greater detail regarding some of these factors in our 2007 Form 10-K and our Form 10-Q for the quarter ended March 31, 2008, including in the Risk Factors and Risk Management sections of those reports, and in our other SEC reports. Our forward-looking statements may also be subject to other risks and uncertainties, including those that we may discuss elsewhere in this presentation or in our filings with the SEC, accessible on the SECs website at www.sec.gov and on or through our corporate website at www.pnc.com/secfilings. Our businesses and financial results are affected by business and economic conditions, both generally and specifically in the principal markets in which we operate. In particular, our businesses and financial results may be impacted by: oChanges in interest rates and valuations in the debt, equity and other financial markets. oDisruptions in the liquidity and other functioning of financial markets, including such disruptions in the markets for real estate and other assets commonly securing financial products. oActions by the Federal Reserve and other government agencies, including those that impact money supply and market interest rates. oChanges in our customers, suppliers and other counterparties performance in general and their creditworthiness in particular. oChanges in customer preferences and behavior, whether as a result of changing business and economic conditions or other factors. A continuation of recent turbulence in significant portions of the global financial markets could impact our performance, both directly by affecting our revenues and the value of our assets and liabilities and indirectly by affecting the economy generally. Given current economic and financial market conditions, our forward-looking financial statements are subject to the risk that these conditions will be substantially different than we are currently expecting. These statements are based on our current expectations that interest rates will remain low through 2008 with continued wide market credit spreads and our view that national economic conditions currently point toward a mild recession followed by a subdued recovery. Our operating results are affected by our liability to provide shares of BlackRock common stock to help fund certain BlackRock long-term incentive plan (LTIP) programs, as our LTIP liability is adjusted quarterly (marked-to-market) based on changes in BlackRocks common stock price and the number of remaining committed shares, and we recognize gain or loss on such shares at such times as shares are transferred for payouts under the LTIP programs. Legal and regulatory developments could have an impact on our ability to operate our businesses or our financial condition or results of operations or our competitive position or reputation. Reputational impacts, in turn, could affect matters such as business generation and retention, our ability to attract and retain management, liquidity, and funding. These legal and regulatory developments could include: (a) the unfavorable resolution of legal proceedings or regulatory and other governmental inquiries; (b) increased litigation risk from recent regulatory and other governmental developments; (c) the results of the regulatory examination process, our failure to satisfy the requirements of agreements with governmental agencies, and regulators future use of supervisory and enforcement tools; (d) legislative and regulatory reforms, including changes to laws and regulations involving tax, pension, education lending, and the protection of confidential customer information; and (e) changes in accounting policies and principles. |

12
Cautionary Statement Regarding Forward-Looking Information (continued)
Appendix Our business and operating results are affected by our ability to identify and effectively manage risks inherent in our businesses, including, where appropriate, through the effective use of third-party insurance, derivatives, and capital management techniques. The adequacy of our intellectual property protection, and the extent of any costs associated with obtaining rights in intellectual property claimed by others, can impact our business and operating results. Our ability to anticipate and respond to technological changes can have an impact on our ability to respond to customer needs and to meet competitive demands. Our ability to implement our business initiatives and strategies could affect our financial performance over the next several years. Competition can have an impact on customer acquisition, growth and retention, as well as on our credit spreads and product pricing, which can affect market share, deposits and revenues. Our business and operating results can also be affected by widespread natural disasters, terrorist activities or international hostilities, either as a result of the impact on the economy and capital and other financial markets generally or on us or on our customers, suppliers or other counterparties specifically. Also, risks and uncertainties that could affect the results anticipated in forward-looking statements or from historical performance relating to our equity interest in BlackRock, Inc. are discussed in more detail in BlackRocks filings with the SEC, including in the Risk Factors sections of BlackRocks reports. BlackRocks SEC filings are accessible on the SECs website and on or through BlackRocks website at www.blackrock.com. We grow our business from time to time by acquiring other financial services companies. Acquisitions in general present us with risks in addition to those presented by the nature of the business acquired. In particular, acquisitions may be substantially more expensive to complete (including as a result of costs incurred in connection with the integration of the acquired company) and the anticipated benefits (including anticipated cost savings and strategic gains) may be significantly harder or take longer to achieve than expected. In some cases, acquisitions involve our entry into new businesses or new geographic or other markets, and these situations also present risks resulting from our inexperience in these new areas. As a regulated financial institution, our pursuit of attractive acquisition opportunities could be negatively impacted due to regulatory delays or other regulatory issues. Regulatory and/or legal issues related to the pre-acquisition operations of an acquired business may cause reputational harm to PNC following the acquisition and integration of the acquired business into ours and may result in additional future costs arising as a result of those issues. Our recent acquisition of Sterling Financial Corporation (Sterling) presents regulatory and litigation risk, as a result of financial irregularities at Sterlings commercial finance subsidiary, that may impact our financial results. Any annualized, proforma, estimated, third party or consensus numbers in this presentation are used for illustrative or comparative purposes only and may not reflect actual results. Any consensus earnings estimates are calculated based on the earnings projections made by analysts who cover that company. The analysts opinions, estimates or forecasts (and therefore the consensus earnings estimates) are theirs alone, are not those of PNC or its management, and may not reflect PNCs or other companys actual or anticipated results. |

13
Non-GAAP to GAAP Reconcilement Appendix In millions, for the three months ended June 30, 2008 March 31, 2008 June 30, 2007 March 31, 2008 June 30, 2007 Net interest income $977 $854 $738 14% 32% Loan net interest income 396 337 274 18% 45% Deposit and other net interest income 581 517 464 12% 25% Noninterest income 1,062 967 975 10% 9% Total revenue $2,039 $1,821 $1,713 12% 19% Consumer services $149 $170 Service charges on deposits 92 82 Consumer services and deposit charges 241 252 (4%) Revenue attributable to Hilliard Lyons 33 Consumer services and deposit charges excluding Hilliard Lyons $241 $219 10% % Change for 2Q08 vs. |

14
Non-GAAP to GAAP Reconcilement Appendix For the year ended December 31, 2007 PNC PNC In millions As Reported Adjustments (a) As Adjusted Net interest income $2,915 $2,915 Noninterest income 3,790 $131 3,921 Total revenue 6,705 131 6,836 Provision for credit losses 315 (45) 270 Noninterest expense 4,296 (184) 4,112 Income before income taxes 2,094 360 2,454 Income taxes 627 125 752 Net income $1,467 $235 $1,702 BlackRock For the year ended December 31, 2006 PNC Deconsolidation and BlackRock PNC In millions As Reported Adjustments (a) Other Adjustments Equity Method As Adjusted Net interest income $2,245 $(10) $2,235 Noninterest income 6,327 $(1,812) (1,087) $144 3,572 Total revenue 8,572 (1,812) (1,097) 144 5,807 Provision for credit losses 124 124 Noninterest expense 4,443 (91) (765) 3,587 Income before minority interest and income taxes 4,005 (1,721) (332) 144 2,096 Minority interest in income of BlackRock 47 18 (65) Income taxes 1,363 (658) (130) 7 582 Net income $2,595 $(1,081) $(137) $137 $1,514 (a) Amounts adjusted to exclude the impact of the following pretax items: (1) the gain of $83 million recognized in connection with PNC's transfer of BlackRock shares to satisfy a portion of our BlackRock LTIP shares obligation, (2) the $210 million net loss representing the mark-to-market adjustment on our remaining BlackRock LTIP shares obligation, (3) acquisition integration costs totaling $151 million, and (4) Visa indemnification charge of $82 million. The net tax impact of these items is reflected in the adjustment to income taxes. (a) Includes the impact of the following pretax items: $2,078 million gain on BlackRock/MLIM transaction, $196 million securities portfolio rebalancing loss, $101 million of BlackRock/MLIM transaction integration costs ($91 million of noninterest expense and $10 million impact on noninterest income), $48 millionmortgage loan portfolio repositioning loss, and $12 million net loss related to our BlackRock LTIP shares obligation. The net tax impact of these items is reflected in the adjustment to income taxes. |

15
Non-GAAP to GAAP Reconcilement Appendix For the year ended December 31, 2005 BlackRock PNC Deconsolidation and BlackRock PNC In millions As Reported Other Adjustments Equity Method As Adjusted Net interest income $2,154 $(12) $2,142 Noninterest income 4,173 (1,214) $163 3,122 Total revenue 6,327 (1,226) 163 5,264 Provision for credit losses 21 21 Noninterest expense 4,306 (853) 3,453 Income before minority interest and income taxes 2,000 (373) 163 1,790 Minority interest in income of BlackRock 71 (71) Income taxes 604 (150) 11 465 Net income $1,325 $(152) $152 $1,325 For the year ended December 31, 2004 BlackRock PNC Deconsolidation and BlackRock PNC In millions As Reported Other Adjustments Equity Method As Adjusted Net interest income $1,969 $(14) $1,955 Noninterest income 3,572 (745) $101 2,928 Total revenue 5,541 (759) 101 4,883 Provision for credit losses 52 52 Noninterest expense 3,712 (564) 3,148 Income before minority interest and income taxes 1,777 (195) 101 1,683 Minority interest in income of BlackRock 42 (42) Income taxes 538 (59) 7 486 Net income $1,197 $(94) $94 $1,197 |

16
Non-GAAP to GAAP Reconcilement Appendix Adjusted In millions 2004 2005 2006 2007 '04-'07 CAGR Adjusted net interest income $1,955 $2,142 $2,235 $2,915 14% Adjusted noninterest income 2,928 3,122 3,572 3,921 10% Adjusted total revenue 4,883 5,264 5,807 6,836 12% Adjusted noninterest expense 3,148 3,453 3,587 4,112 9% Adjusted net income 1,197 1,325 1,514 1,702 12% Adjusted operating leverage 3% Reported In millions 2004 2005 2006 2007 '04-'07 CAGR Net interest income, as reported $1,969 $2,154 $2,245 $2,915 14% Noninterest income, as reported 3,572 4,173 6,327 3,790 2% Total revenue, as reported 5,541 6,327 8,572 6,705 7% Noninterest expense, as reported 3,712 4,306 4,443 4,296 5% Net income, as reported 1,197 1,325 2,595 1,467 7% Operating leverage, as reported 2% For the year ended December 31, as adjusted For the year ended December 31, as reported |