SLIDE PRESENTATION
Published on March 10, 2004
EXHIBIT 99.1
The PNC Financial Services Group, Inc.
Sandler ONeill & Partners, L.P.
2004 West Coast Financial Services Conference
Carlsbad, CA
March 10, 2004
Cautionary Statement Regarding Forward-Looking Information
This presentation contains forward-looking statements with respect to PNCs outlook or expectations relating to its future business, operations, financial condition, financial performance and asset quality. Forward-looking statements are necessarily subject to numerous assumptions, risks and uncertainties.
The forward-looking statements in this presentation are qualified by the factors affecting forward-looking statements identified in the more detailed Cautionary Statement included in PNCs written materials distributed at this conference and in the version of these slides posted on PNCs website at www.pnc.com as well as those factors previously disclosed in PNCs SEC reports (accessible on the SECs website at www.sec.gov and on PNCs website).
Future events or circumstances may change PNCs outlook or expectations and may also affect the nature of the assumptions, risks and uncertainties to which the forward-looking statements are subject. The forward-looking statements in this presentation speak only as of the date of this presentation, and PNC assumes no duty and does not undertake to update them.

Key Messages
PNC has
Strong platform for growth
Differentiated business mix that can deliver growth
Clear and executable plans to achieve growth
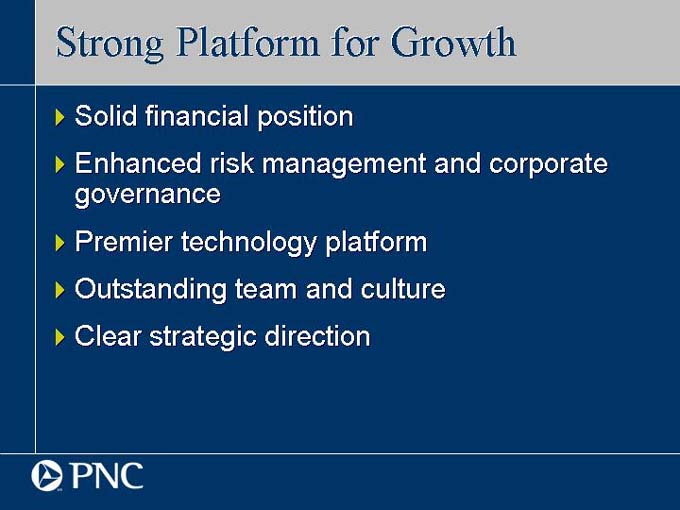
Strong Platform for Growth
Solid financial position
Enhanced risk management and corporate governance
Premier technology platform
Outstanding team and culture
Clear strategic direction

Key Messages
PNC has
Strong platform for growth
Differentiated business mix that can deliver growth
Clear and executable plans to achieve growth
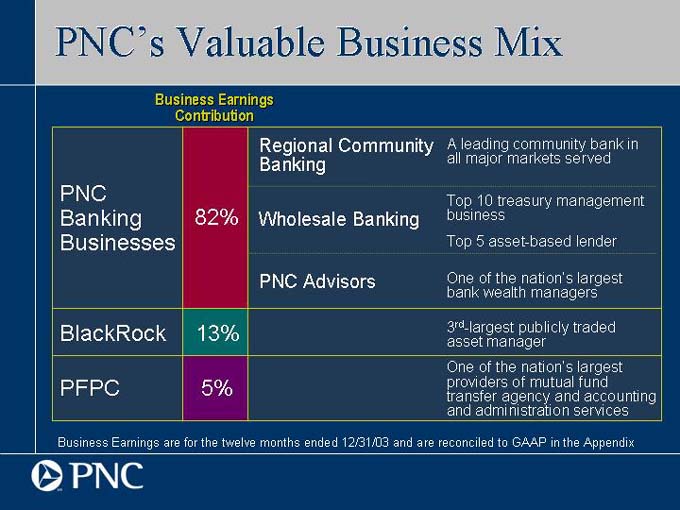
PNCs Valuable Business Mix
Business Earnings Contribution
Regional Community A leading community bank in
Banking all major markets served
PNC Top 10 treasury management
Banking 82% Wholesale Banking business
Businesses Top 5 asset-based lender
PNC Advisors One of the nations largest
bank wealth managers
BlackRock 13% 3rd-largest publicly traded
asset manager
One of the nations largest
PFPC 5% providers of mutual fund
transfer agency and accounting
and administration services
Business Earnings are for the twelve months ended 12/31/03 and are reconciled to GAAP in the Appendix
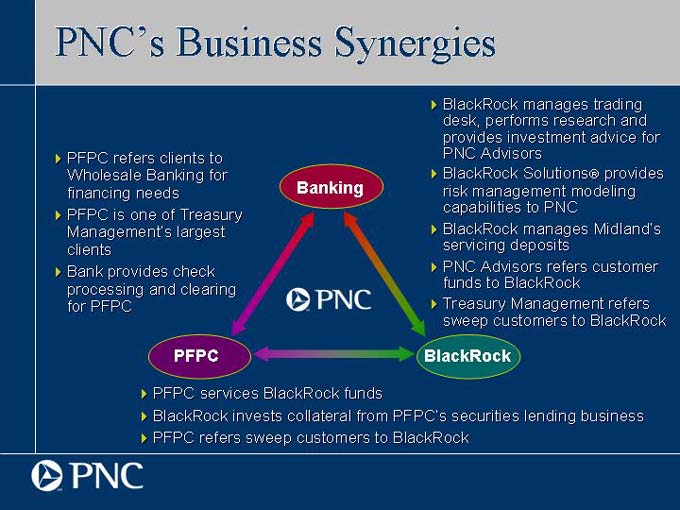
PNCs Business Synergies
PFPC refers clients to Wholesale Banking for financing needs
PFPC is one of Treasury Managements largest clients
Bank provides check processing and clearing for PFPC
BlackRock manages trading desk, performs research and provides investment advice for PNC Advisors
BlackRock Solutions??provides risk management modeling capabilities to PNC
BlackRock manages Midlands servicing deposits
PNC Advisors refers customer funds to BlackRock
Treasury Management refers sweep customers to BlackRock
PFPC services BlackRock funds
BlackRock invests collateral from PFPCs securities lending business
PFPC refers sweep customers to BlackRock
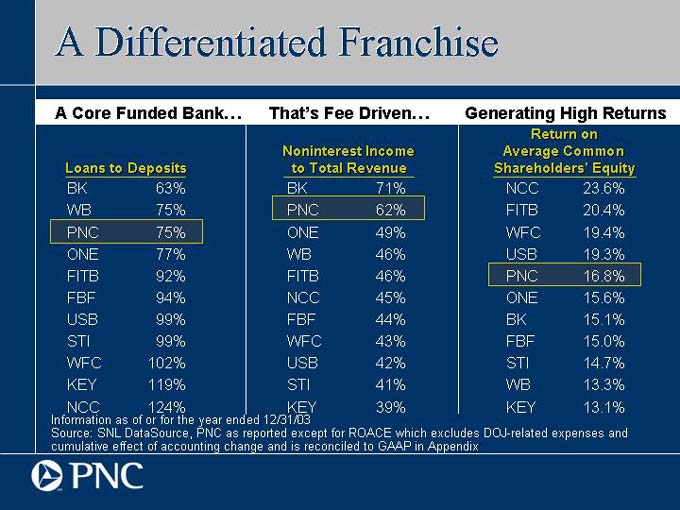
A Differentiated Franchise
A Core Funded Bank Thats Fee Driven Generating High Returns
Return on
Noninterest Income Average Common
Loans to Deposits to Total Revenue Shareholders Equity
BK 63% BK 71% NCC 23.6%
WB 75% PNC 62% FITB 20.4%
PNC 75% ONE 49% WFC 19.4%
ONE 77% WB 46% USB 19.3%
FITB 92% FITB 46% PNC 16.8%
FBF 94% NCC 45% ONE 15.6%
USB 99% FBF 44% BK 15.1%
STI 99% WFC 43% FBF 15.0%
WFC 102% USB 42% STI 14.7%
KEY 119% STI 41% WB 13.3%
NCC 124% KEY 39% KEY 13.1%
Information as of or for the year ended 12/31/03
Source: SNL DataSource, PNC as reported except for ROACE which excludes DOJ-related expenses and cumulative effect of accounting change and is reconciled to GAAP in Appendix
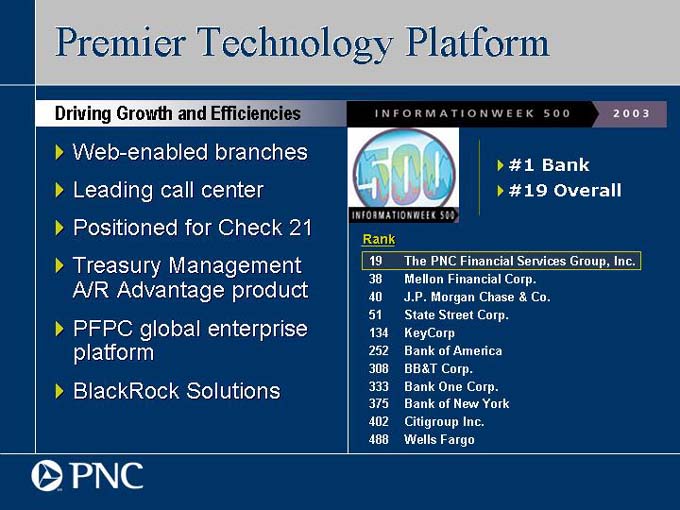
Premier Technology Platform
Driving Growth and Efficiencies
Web-enabled branches
Leading call center
Positioned for Check 21
Treasury Management A/R Advantage product
PFPC global enterprise platform
BlackRock Solutions
#1 Bank
#19 Overall
Rank
19 The PNC Financial Services Group, Inc.
38 Mellon Financial Corp.
40 J.P. Morgan Chase & Co.
51 State Street Corp.
134 KeyCorp
252 Bank of America
308 BB&T Corp.
333 Bank One Corp.
375 Bank of New York
402 Citigroup Inc.
488 Wells Fargo

Key Messages
PNC has
Strong platform for growth
Differentiated business mix that can deliver growth
Clear and executable plans to achieve growth
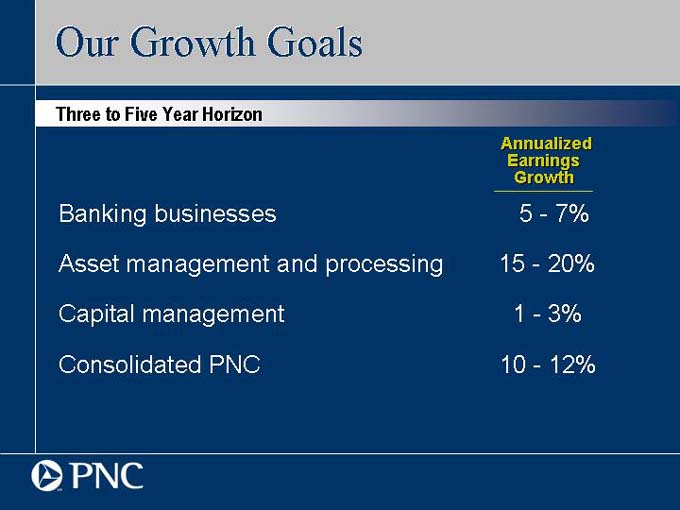
Our Growth Goals
Three to Five Year Horizon
Annualized
Earnings
Growth
Banking businesses 57%
Asset management and processing 1520%
Capital management 13%
Consolidated PNC 1012%
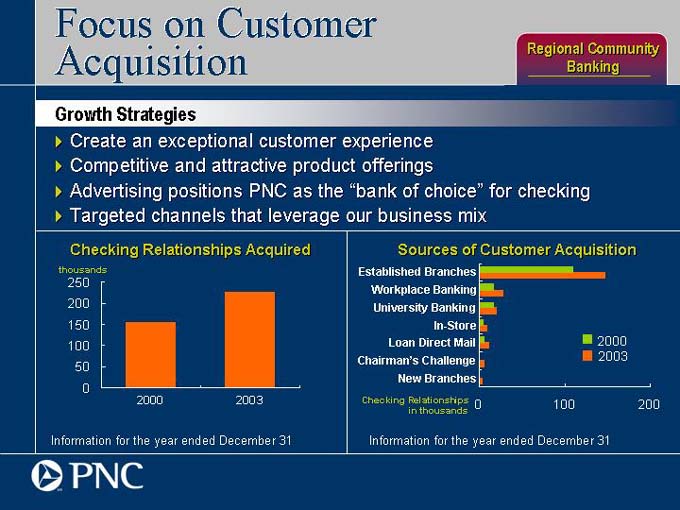
Focus on Customer
Acquisition
Regional Community
Banking
Growth Strategies
Create an exceptional customer experience
Competitive and attractive product offerings
Advertising positions PNC as the bank of choice for checking
Targeted channels that leverage our business mix
Checking Relationships Acquired
Information for the year ended December 31
Sources of Customer Acquisition
Information for the year ended December 31
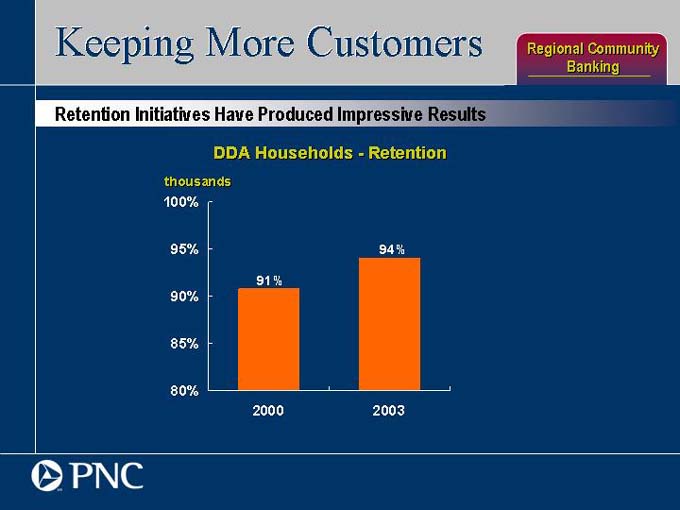
Keeping More Customers
Regional Community
Banking
Retention Initiatives Have Produced Impressive Results
DDA HouseholdsRetention
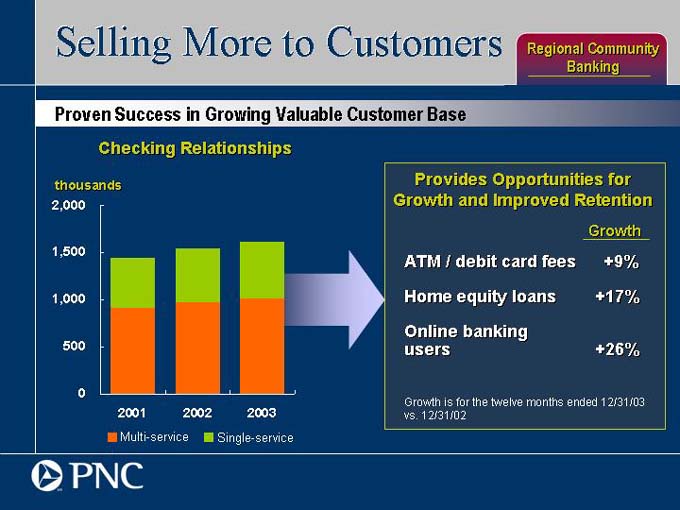
Selling More to Customers
Regional Community
Banking
Proven Success in Growing Valuable Customer Base
Checking Relationships
Provides Opportunities for Growth and Improved Retention
Growth
ATM / debit card fees +9%
Home equity loans +17%
Online banking users +26%
Growth is for the twelve months ended 12/31/03 vs. 12/31/02
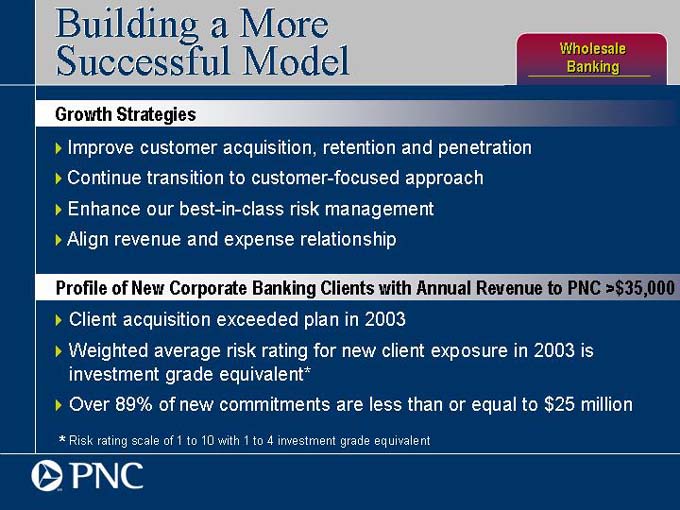
Building a More
Successful Model
Wholesale
Banking
Growth Strategies
Improve customer acquisition, retention and penetration
Continue transition to customer-focused approach
Enhance our best-in-class risk management
Align revenue and expense relationship
Profile of New Corporate Banking Clients with Annual Revenue to PNC >$35,000
Client acquisition exceeded plan in 2003
Weighted average risk rating for new client exposure in 2003 is investment grade equivalent*
Over 89% of new commitments are less than or equal to $25 million
* Risk rating scale of 1 to 10 with 1 to 4 investment grade equivalent

Selling More Fee-Based
Products
Wholesale
Banking
Highlights
Significant Treasury Management client wins
#1 in number of loan syndications for middle market in the Northeast in 2003
Commercial real estate finance industry leader
Noninterest Income $ millions $140 $135 $130 $125 $120 $115 $110 $105 $100
Noninterest income is reconciled to GAAP in the Appendix and excludes institutional lending held for sale gains, net securities gains and the adoption of FIN 46R
PNC Advisors
Repositioning the Franchise
Growth Strategies
Significantly improve sales results
Enhance client experience
Implement best practices around sales, service and client relationships
Leverage United National customer base
Capitalize on cross-sell opportunities
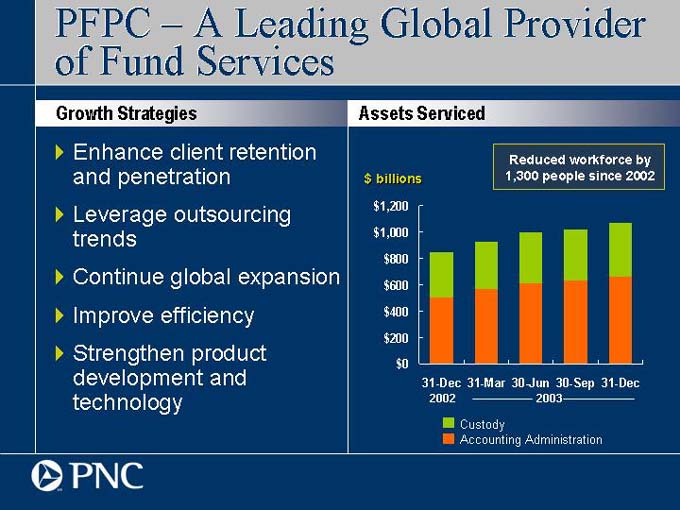
PFPC A Leading Global Provider of Fund Services
Growth Strategies
Enhance client retention and penetration
Leverage outsourcing trends
Continue global expansion
Improve efficiency
Strengthen product development and technology
Assets Serviced
Reduced workforce by 1,300 people since 2002
Custody
Accounting Administration
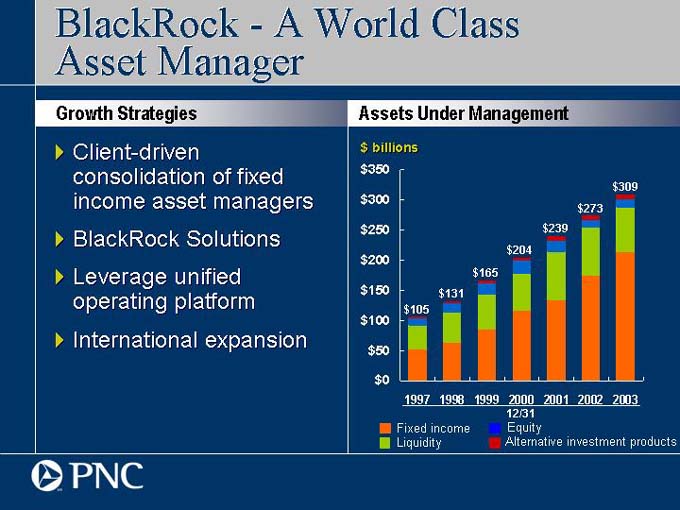
BlackRockA World Class Asset Manager
Growth Strategies
Client-driven consolidation of fixed income asset managers
BlackRock Solutions
Leverage unified operating platform
International expansion
Assets Under Management
Fixed income Liquidity
Equity Alternative investment products
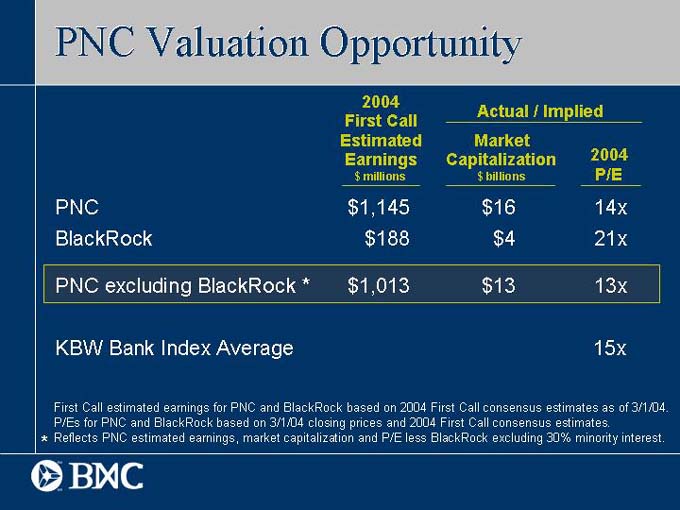
PNC Valuation Opportunity
2004
Actual / Implied
First Call
Estimated Market
Earnings Capitalization 2004
$ millions $ billions P/E
PNC $ 1,145 $ 16 14x
BlackRock $ 188 $ 4 21x
PNC excluding BlackRock * $ 1,013 $ 13 13x
KBW Bank Index Average 15x
First Call estimated earnings for PNC and BlackRock based on 2004 First Call consensus estimates as of 3/1/04. P/Es for PNC and BlackRock based on 3/1/04 closing prices and 2004 First Call consensus estimates.
* Reflects PNC estimated earnings, market capitalization and P/E less BlackRock excluding 30% minority interest.

Key Messages
PNC has
Strong platform for growth
Differentiated business mix that can deliver growth
Clear and executable plans to achieve growth


Appendix
Cautionary Statement Regarding Forward-Looking Information
This Report contains, and other statements that the Corporation may make may contain, forward-looking statements with respect to the Corporations outlook or expectations for earnings, revenues, expenses, capital levels, asset quality or other future financial or business performance, strategies or expectations, or the impact of legal, regulatory or supervisory matters on the Corporations business operations or performance. Forward-looking statements are typically identified by words or phrases such as believe, feel, expect, anticipate, intend, outlook, estimate, forecast, project, position, target, assume, achievable, potential, strategy, goal, objective, plan, aspiration, outcome, continue, remain, maintain, seek, strive, trend, and variations of such words and similar expressions, or future or conditional verbs such as will, would, should, could, might, can, may or similar expressions.
The Corporation cautions that forward-looking statements are subject to numerous assumptions, risks and uncertainties, which change over time. Forward-looking statements speak only as of the date they are made, and the Corporation assumes no duty and does not undertake to update forward-looking statements. Actual results or future events could differ, possibly materially, from those anticipated in forward-looking statements and future results could differ materially from historical performance.
The factors discussed elsewhere in this Report or previously disclosed in the Corporations other SEC reports (accessible on PNCs website at www.pnc.com and on the SECs website at www.sec.gov) and the following factors, among others, could cause actual results or future events to differ materially from those anticipated in forward-looking statements or from historical performance:
(1) changes in political, economic or industry conditions, the interest rate environment or financial and capital markets (including as a result of actions of the Federal Reserve Board affecting interest rates, money supply or otherwise reflecting changes in monetary policy), which could affect: (a) credit quality and the extent of credit losses; (b) the extent of funding of unfunded loan commitments and letters of credit; (c) allowances for credit losses and unfunded loan commitments and letters of credit; (d) demand for credit or fee-based products and services; (e) net interest income; (f) value of assets under management and assets serviced, of private equity investments, of other debt and equity investments, of loans held for sale, or of other on-balance sheet and off-balance sheet assets; or (g) the availability and terms of funding necessary to meet PNCs liquidity needs;
(2) the impact of legal and regulatory developments (including (a) the resolution of legal proceedings or regulatory and other governmental inquiries; (b) increased litigation risk from recent regulatory and other governmental developments; (c) the results of regulatory examination process, PNCs failure to satisfy the requirements of agreements with governmental agencies, and regulators future use of supervisory and enforcement tools; (d) legislative and regulatory reforms; and (e) changes in accounting policies and principles), with the impact of any such developments possibly affecting the ability of PNC to operate its businesses, PNCs financial condition, results of operations, or reputation, which in turn could have an impact on such matters as business generation and retention, the ability to attract and retain management, liquidity and funding;
(3) the impact of changes in the nature or extent of competition;
(4) the introduction, withdrawal, success and timing of business initiatives and strategies;
Cautionary Statement Regarding Forward-Looking Information (continued)
(5) customer acceptance of PNCs products and services and their borrowing, repayment, investment and deposit practices;
(6) the impact of changes in the extent of customer or counterparty delinquencies, bankruptcies or defaults that could affect, among other things, credit and asset quality risk and the provision for credit losses;
(7) the ability to identify and effectively manage risks inherent in PNCs business;
(8) how PNC chooses to redeploy available capital, including the extent and timing of any share repurchases and acquisitions or other investments in PNC businesses;
(9) the impact, extent and timing of technological changes, the adequacy of intellectual property protection and costs associated with obtaining rights in intellectual property claimed by others;
(10) the timing and pricing of any sales of loans or other financial assets held for sale;
(11) the ability of PNC to obtain desirable levels of insurance and whether or not insurance coverage for claims by PNC is denied;
(12) relative and absolute investment performance of assets under management; and
(13) the extent of terrorist activities and international hostilities, increases or continuations of which may adversely affect the economy and financial and capital markets generally or PNC specifically.
In addition, PNCs forward-looking statements are also subject to risks and uncertainties related to the United National Bancorp acquisition and the expected consequences of the integration of its business into that of PNC, including the following: (a) the integration of United Nationals business and operations into PNC, which will include conversion of UnitedTrust Banks different systems and procedures, may take longer than anticipated or be more costly than anticipated or have unanticipated adverse results relating to PNCs businesses, including those acquired in the acquisition; (b) the anticipated cost savings of the acquisition may take longer than expected to be realized, may not be achieved, or may not be achieved in their entirety; and (c) the anticipated benefits to PNC are dependent in part on the performance of United Nationals business in the future, and there can be no assurance as to actual future results, which could be impacted by various factors, including the risks and uncertainties generally related to the performance of PNCs and United Nationals businesses (with respect to United National, see United Nationals SEC reports, also accessible on the SECs website) or due to factors related to the acquisition of United National and the process of integrating it into PNC. Any future mergers, acquisitions, restructurings, divestitures or related transactions will also be subject to similar risks and uncertainties related to the ability to realize expected cost savings or revenue enhancements or to implement integration plans.
Any annualized, proforma, estimated, third party or consensus numbers in this presentation are used for illustrative or comparative purposes only and may not reflect actual results. Consensus earnings estimates are calculated based on the earnings projections made by analysts who cover that company. The analysts opinions, estimates or forecasts (and therefore the consensus earnings estimates) are theirs alone, are not those of PNC or its management, and may not reflect PNCs actual or anticipated results.
Non-GAAP to GAAP
Reconcilement
Appendix
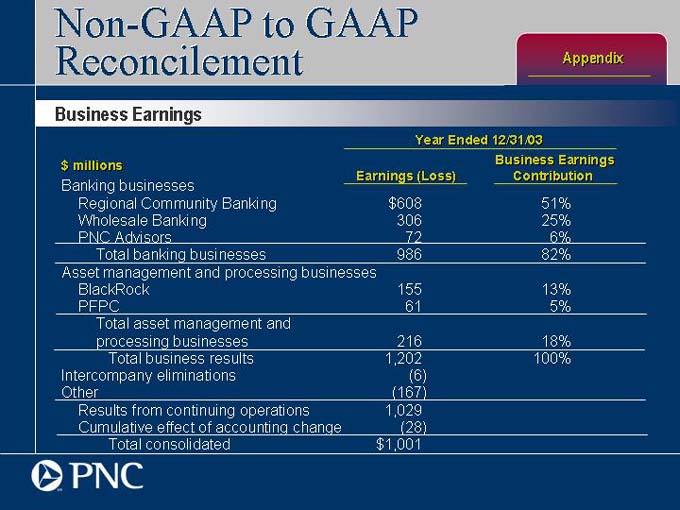
Business Earnings
Year Ended 12/31/03
$ millions Business Earnings
Earnings (Loss) Contribution
Banking businesses
Regional Community Banking $ 608 51%
Wholesale Banking 306 25%
PNC Advisors 72 6%
Total banking businesses 986 82%
Asset management and processing businesses
BlackRock 155 13%
PFPC 61 5%
Total asset management and
processing businesses 216 18%
Total business results 1,202 100%
Intercompany eliminations (6)
Other (167)
Results from continuing operations 1,029
Cumulative effect of accounting change (28)
Total consolidated $ 1,001
Non-GAAP to GAAP
Reconcilement
Appendix
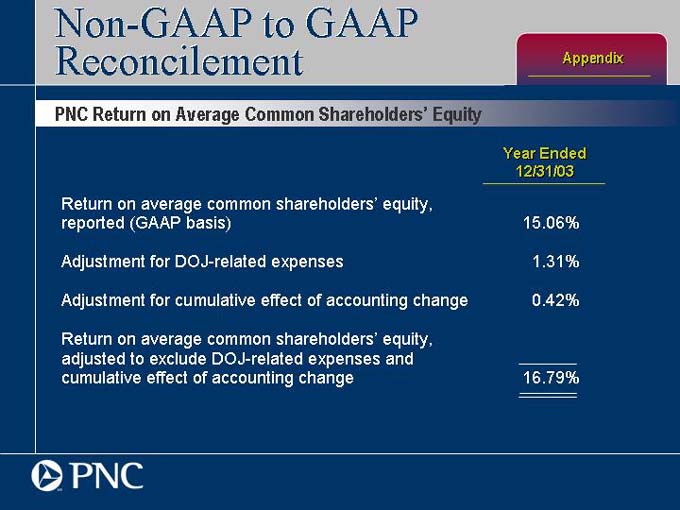
PNC Return on Average Common Shareholders Equity
Year Ended 12/31/03
Return on average common shareholders equity, reported (GAAP basis) 15.06%
Adjustment for DOJ-related expenses 1.31%
Adjustment for cumulative effect of accounting change 0.42%
Return on average common shareholders equity, adjusted to exclude DOJ-related expenses and cumulative effect of accounting change 16.79%
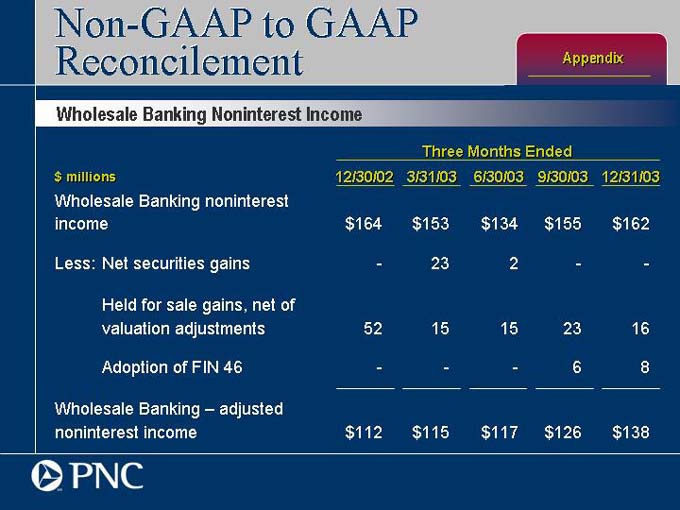
Non-GAAP to GAAP
Reconcilement
Appendix
Wholesale Banking Noninterest Income
Three Months Ended $ millions 12/30/02 3/31/03 6/30/03 9/30/03 12/31/03
Wholesale Banking noninterest income $164 $153 $134 $155 $162
Less: Net securities gains - 23 2 - -
Held for sale gains, net of valuation adjustments 52 15 15 23 16
Adoption of FIN 46 - - - 6 8
Wholesale Banking adjusted noninterest income $112 $115 $117 $126 $138
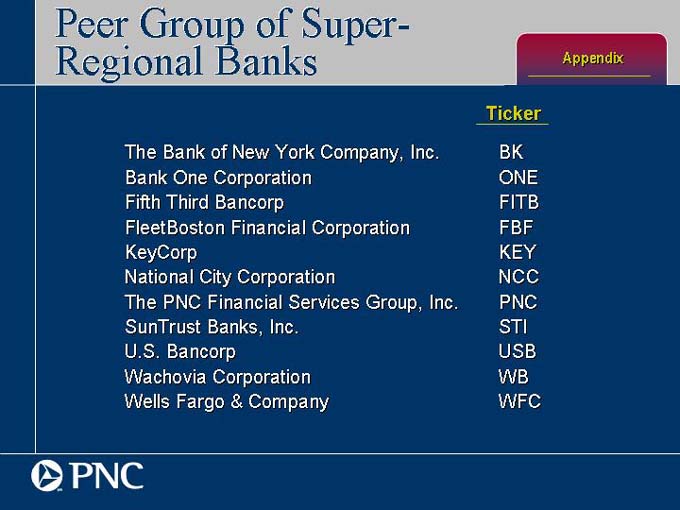
Peer Group of Super-
Regional Banks
Appendix
Ticker
The Bank of New York Company, Inc. BK
Bank One Corporation ONE
Fifth Third Bancorp FITB
FleetBoston Financial Corporation FBF
KeyCorp KEY
National City Corporation NCC
The PNC Financial Services Group, Inc. PNC
SunTrust Banks, Inc. STI
U.S. Bancorp USB
Wachovia Corporation WB
Wells Fargo & Company WFC