EX-99.1
Published on March 5, 2024
The PNC Financial Services Group RBC Capital Markets Global Financial Institutions Conference Gagan Singh, Chief Investment Officer March 5, 2024 Exhibit 99.1
Cautionary Statement Regarding Forward-Looking and non-GAAP Financial Information This presentation is not intended as a full business or financial review and should be viewed in the context of all of the information made available by PNC in its SEC filings and on our corporate website. The presentation contains forward-looking statements regarding our outlook for financial performance, such as earnings, revenues, expenses, tax rates, capital and liquidity levels and ratios, asset levels, asset quality, financial position, and other matters regarding or affecting PNC and its future business and operations, including sustainability strategy. Forward-looking statements are necessarily subject to numerous assumptions, risks and uncertainties, which change over time. The forward- looking statements in this presentation are qualified by the factors affecting forward-looking statements identified in the more detailed Cautionary Statement included in the Appendix. We provide greater detail regarding these and other factors in our 2023 Form 10-K and other subsequent SEC filings. Our forward-looking statements may also be subject to risks and uncertainties including those we may discuss in this presentation or in our SEC filings. Future events or circumstances may change our outlook and may also affect the nature of the assumptions, risks and uncertainties to which our forward-looking statements are subject. Forward-looking statements in this presentation speak only as of the date of this presentation. We do not assume any duty and do not undertake any obligation to update those statements. Actual results or future events could differ, possibly materially, from those anticipated in forward-looking statements, as well as from historical performance. As a result, we caution against placing undue reliance on any forward-looking statements. References to our corporate website are to www.pnc.com under “About Us - Investor Relations.” Our SEC filings are available both on our corporate website and on the SEC’s website at www.sec.gov. We include web addresses here as inactive textual references only. Information on these websites is not part of this presentation. 1
Agenda 2 Economic outlook Fed and interest rate outlook PNC interest rate risk profile PNC and banking sector balance sheet trends
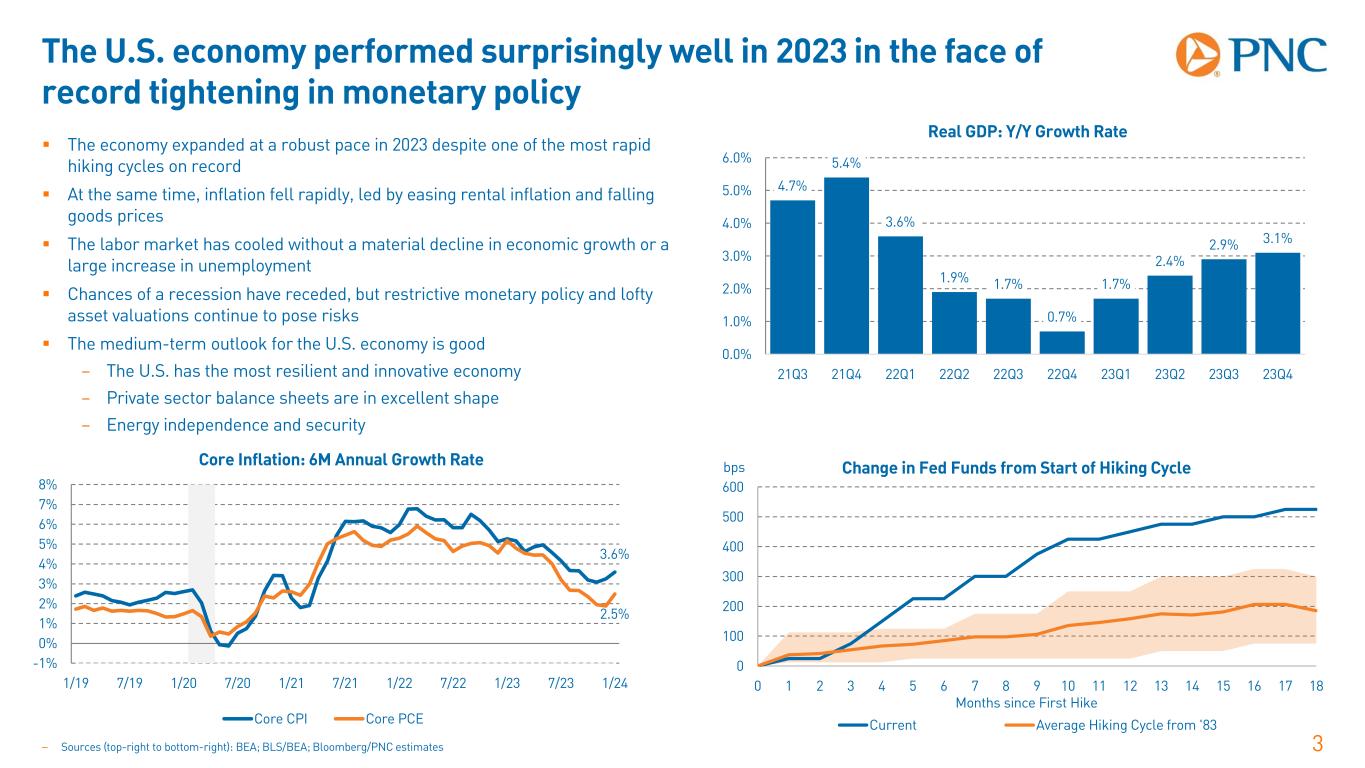
The U.S. economy performed surprisingly well in 2023 in the face of record tightening in monetary policy 3 The economy expanded at a robust pace in 2023 despite one of the most rapid hiking cycles on record At the same time, inflation fell rapidly, led by easing rental inflation and falling goods prices The labor market has cooled without a material decline in economic growth or a large increase in unemployment Chances of a recession have receded, but restrictive monetary policy and lofty asset valuations continue to pose risks The medium-term outlook for the U.S. economy is good – The U.S. has the most resilient and innovative economy – Private sector balance sheets are in excellent shape – Energy independence and security – Sources (top-right to bottom-right): BEA; BLS/BEA; Bloomberg/PNC estimates 4.7% 5.4% 3.6% 1.9% 1.7% 0.7% 1.7% 2.4% 2.9% 3.1% 0.0% 1.0% 2.0% 3.0% 4.0% 5.0% 6.0% 21Q3 21Q4 22Q1 22Q2 22Q3 22Q4 23Q1 23Q2 23Q3 23Q4 Real GDP: Y/Y Growth Rate 0 100 200 300 400 500 600 0 1 2 3 4 5 6 7 8 9 10 11 12 13 14 15 16 17 18 bps Months since First Hike Change in Fed Funds from Start of Hiking Cycle Current Average Hiking Cycle from '83 3.6% 2.5% -1% 0% 1% 2% 3% 4% 5% 6% 7% 8% 1/19 7/19 1/20 7/20 1/21 7/21 1/22 7/22 1/23 7/23 1/24 Core Inflation: 6M Annual Growth Rate Core CPI Core PCE
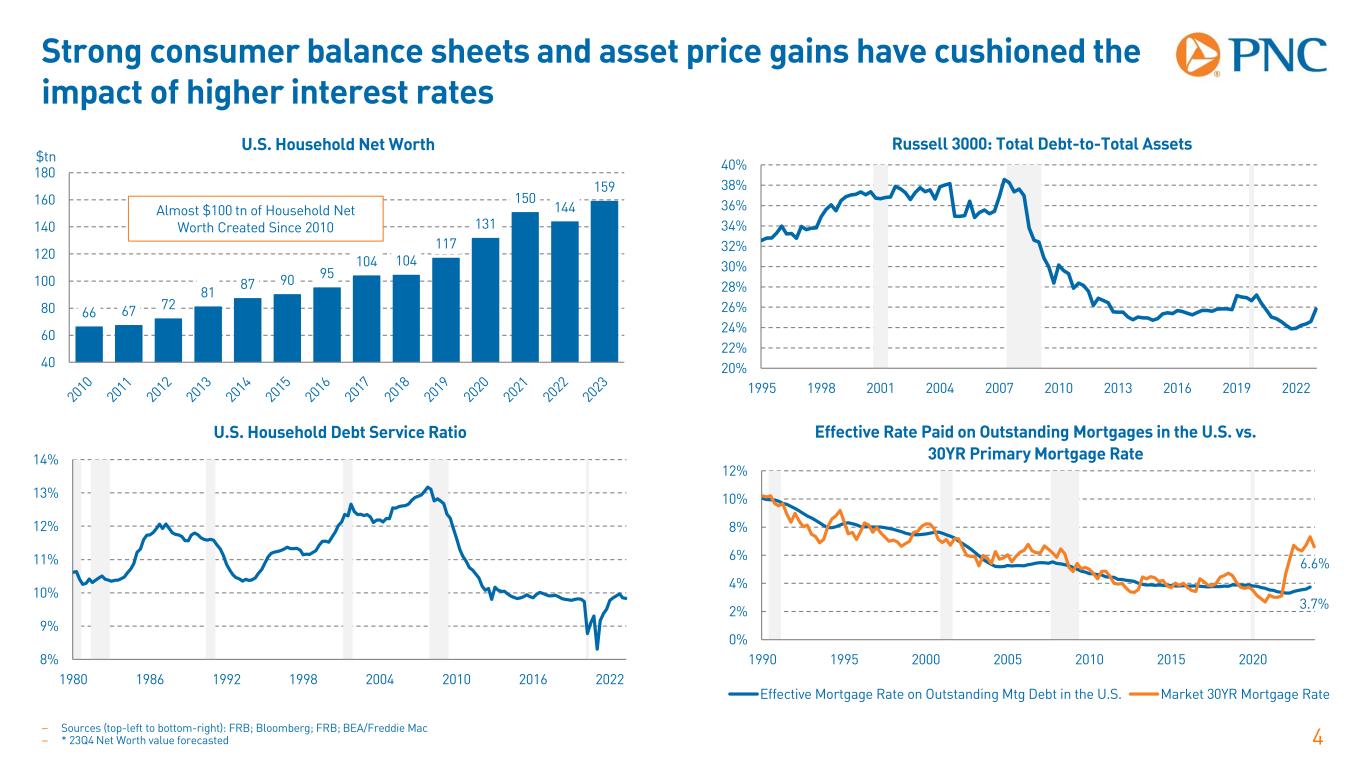
Strong consumer balance sheets and asset price gains have cushioned the impact of higher interest rates 4– Sources (top-left to bottom-right): FRB; Bloomberg; FRB; BEA/Freddie Mac – * 23Q4 Net Worth value forecasted 3.7% 6.6% 0% 2% 4% 6% 8% 10% 12% 1990 1995 2000 2005 2010 2015 2020 Effective Rate Paid on Outstanding Mortgages in the U.S. vs. 30YR Primary Mortgage Rate Effective Mortgage Rate on Outstanding Mtg Debt in the U.S. Market 30YR Mortgage Rate 8% 9% 10% 11% 12% 13% 14% 1980 1986 1992 1998 2004 2010 2016 2022 U.S. Household Debt Service Ratio 66 67 72 81 87 90 95 104 104 117 131 150 144 159 40 60 80 100 120 140 160 180 $tn U.S. Household Net Worth Almost $100 tn of Household Net Worth Created Since 2010 20% 22% 24% 26% 28% 30% 32% 34% 36% 38% 40% 1995 1998 2001 2004 2007 2010 2013 2016 2019 2022 Russell 3000: Total Debt-to-Total Assets
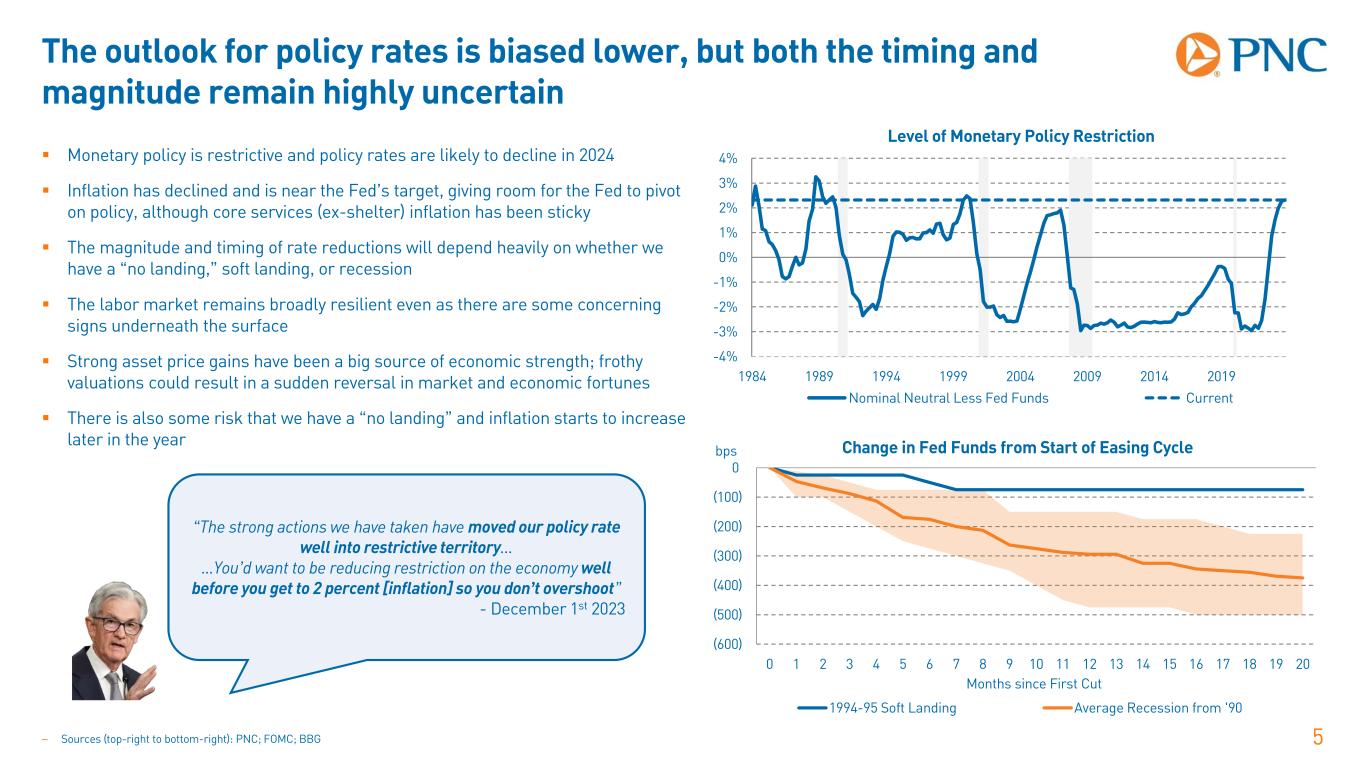
The outlook for policy rates is biased lower, but both the timing and magnitude remain highly uncertain 5 Monetary policy is restrictive and policy rates are likely to decline in 2024 Inflation has declined and is near the Fed’s target, giving room for the Fed to pivot on policy, although core services (ex-shelter) inflation has been sticky The magnitude and timing of rate reductions will depend heavily on whether we have a “no landing,” soft landing, or recession The labor market remains broadly resilient even as there are some concerning signs underneath the surface Strong asset price gains have been a big source of economic strength; frothy valuations could result in a sudden reversal in market and economic fortunes There is also some risk that we have a “no landing” and inflation starts to increase later in the year – Sources (top-right to bottom-right): PNC; FOMC; BBG -4% -3% -2% -1% 0% 1% 2% 3% 4% 1984 1989 1994 1999 2004 2009 2014 2019 Level of Monetary Policy Restriction Nominal Neutral Less Fed Funds Current (600) (500) (400) (300) (200) (100) 0 0 1 2 3 4 5 6 7 8 9 10 11 12 13 14 15 16 17 18 19 20 bps Months since First Cut Change in Fed Funds from Start of Easing Cycle 1994-95 Soft Landing Average Recession from '90 “The strong actions we have taken have moved our policy rate well into restrictive territory... …You’d want to be reducing restriction on the economy well before you get to 2 percent [inflation] so you don’t overshoot” - December 1st 2023
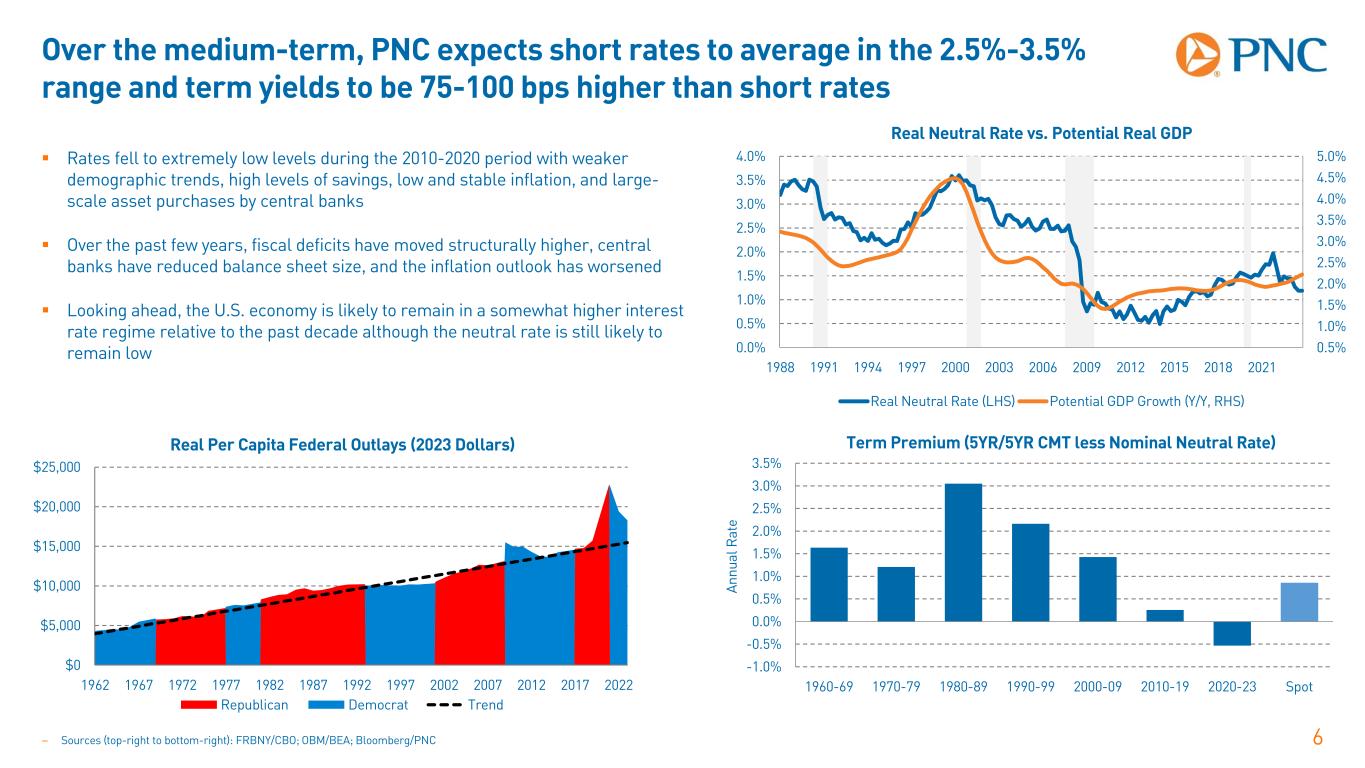
Over the medium-term, PNC expects short rates to average in the 2.5%-3.5% range and term yields to be 75-100 bps higher than short rates 6– Sources (top-right to bottom-right): FRBNY/CBO; OBM/BEA; Bloomberg/PNC Rates fell to extremely low levels during the 2010-2020 period with weaker demographic trends, high levels of savings, low and stable inflation, and large- scale asset purchases by central banks Over the past few years, fiscal deficits have moved structurally higher, central banks have reduced balance sheet size, and the inflation outlook has worsened Looking ahead, the U.S. economy is likely to remain in a somewhat higher interest rate regime relative to the past decade although the neutral rate is still likely to remain low -1.0% -0.5% 0.0% 0.5% 1.0% 1.5% 2.0% 2.5% 3.0% 3.5% 1960-69 1970-79 1980-89 1990-99 2000-09 2010-19 2020-23 Spot An nu al R at e Term Premium (5YR/5YR CMT less Nominal Neutral Rate) 0.5% 1.0% 1.5% 2.0% 2.5% 3.0% 3.5% 4.0% 4.5% 5.0% 0.0% 0.5% 1.0% 1.5% 2.0% 2.5% 3.0% 3.5% 4.0% 1988 1991 1994 1997 2000 2003 2006 2009 2012 2015 2018 2021 Real Neutral Rate vs. Potential Real GDP Real Neutral Rate (LHS) Potential GDP Growth (Y/Y, RHS) $0 $5,000 $10,000 $15,000 $20,000 $25,000 1962 1967 1972 1977 1982 1987 1992 1997 2002 2007 2012 2017 2022 Real Per Capita Federal Outlays (2023 Dollars) Republican Democrat Trend
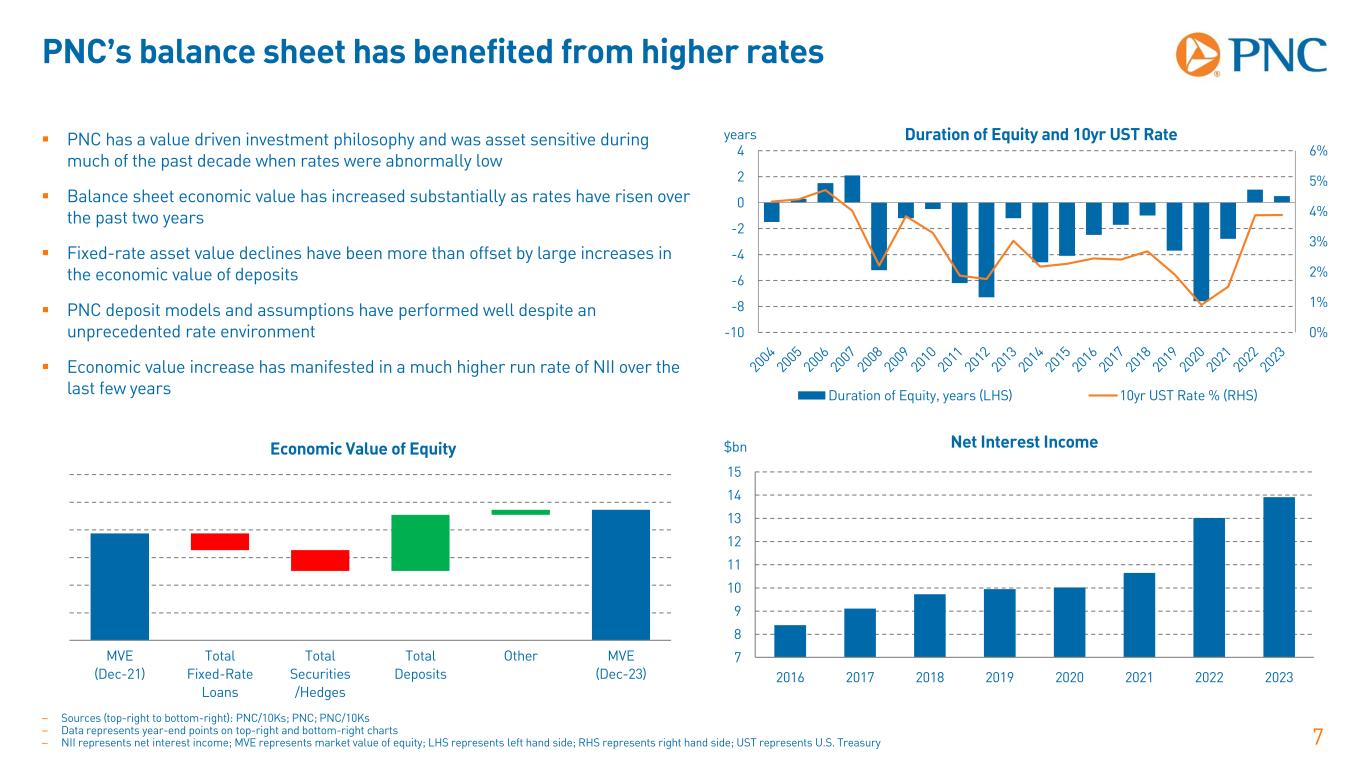
PNC’s balance sheet has benefited from higher rates 7 – Sources (top-right to bottom-right): PNC/10Ks; PNC; PNC/10Ks – Data represents year-end points on top-right and bottom-right charts – NII represents net interest income; MVE represents market value of equity; LHS represents left hand side; RHS represents right hand side; UST represents U.S. Treasury PNC has a value driven investment philosophy and was asset sensitive during much of the past decade when rates were abnormally low Balance sheet economic value has increased substantially as rates have risen over the past two years Fixed-rate asset value declines have been more than offset by large increases in the economic value of deposits PNC deposit models and assumptions have performed well despite an unprecedented rate environment Economic value increase has manifested in a much higher run rate of NII over the last few years MVE (Dec-21) Total Fixed-Rate Loans Total Securities /Hedges Total Deposits Other MVE (Dec-23) Economic Value of Equity 0% 1% 2% 3% 4% 5% 6% -10 -8 -6 -4 -2 0 2 4 years Duration of Equity and 10yr UST Rate Duration of Equity, years (LHS) 10yr UST Rate % (RHS) 7 8 9 10 11 12 13 14 15 2016 2017 2018 2019 2020 2021 2022 2023 $bn Net Interest Income
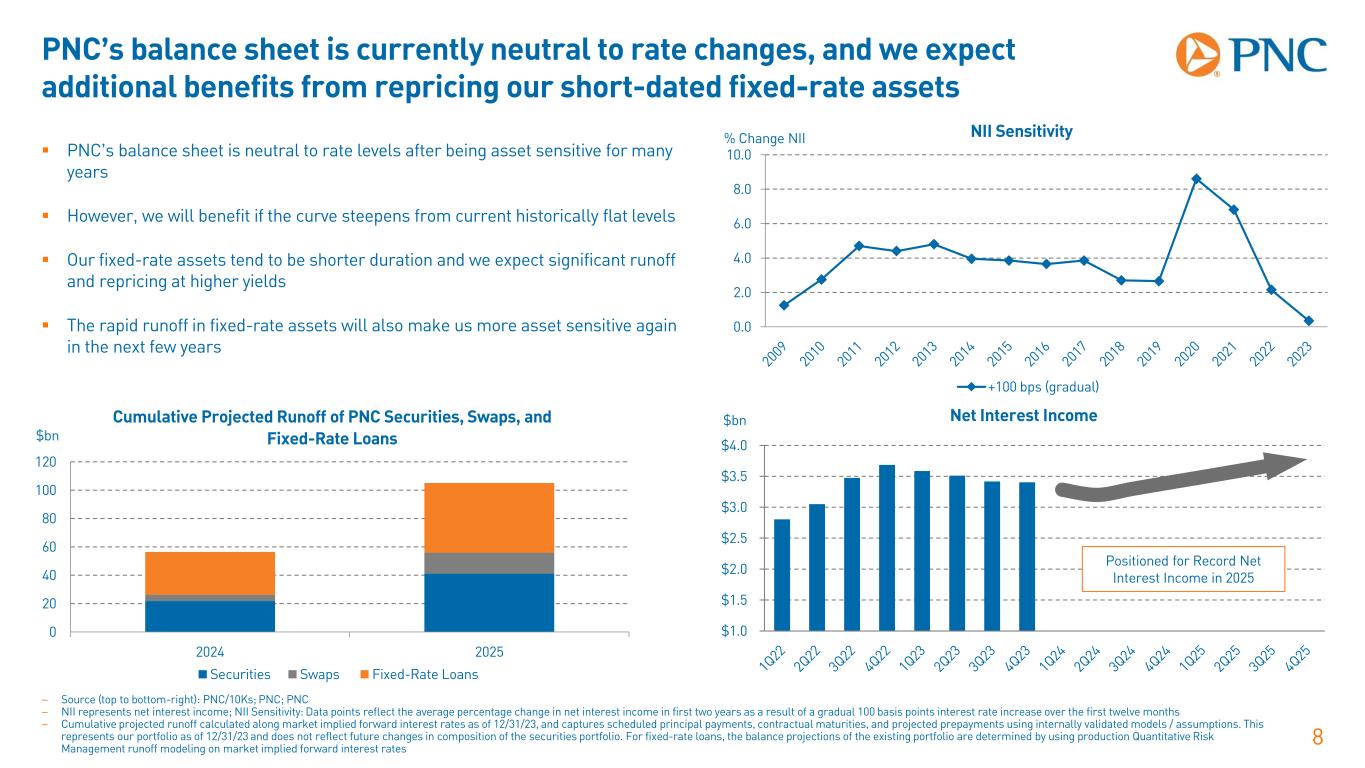
PNC’s balance sheet is currently neutral to rate changes, and we expect additional benefits from repricing our short-dated fixed-rate assets 8 PNC’s balance sheet is neutral to rate levels after being asset sensitive for many years However, we will benefit if the curve steepens from current historically flat levels Our fixed-rate assets tend to be shorter duration and we expect significant runoff and repricing at higher yields The rapid runoff in fixed-rate assets will also make us more asset sensitive again in the next few years 0 20 40 60 80 100 120 2024 2025 $bn Cumulative Projected Runoff of PNC Securities, Swaps, and Fixed-Rate Loans Securities Swaps Fixed-Rate Loans 0.0 2.0 4.0 6.0 8.0 10.0 % Change NII NII Sensitivity +100 bps (gradual) – Source (top to bottom-right): PNC/10Ks; PNC; PNC – NII represents net interest income; NII Sensitivity: Data points reflect the average percentage change in net interest income in first two years as a result of a gradual 100 basis points interest rate increase over the first twelve months – Cumulative projected runoff calculated along market implied forward interest rates as of 12/31/23, and captures scheduled principal payments, contractual maturities, and projected prepayments using internally validated models / assumptions. This represents our portfolio as of 12/31/23 and does not reflect future changes in composition of the securities portfolio. For fixed-rate loans, the balance projections of the existing portfolio are determined by using production Quantitative Risk Management runoff modeling on market implied forward interest rates $1.0 $1.5 $2.0 $2.5 $3.0 $3.5 $4.0 $bn Net Interest Income Positioned for Record Net Interest Income in 2025
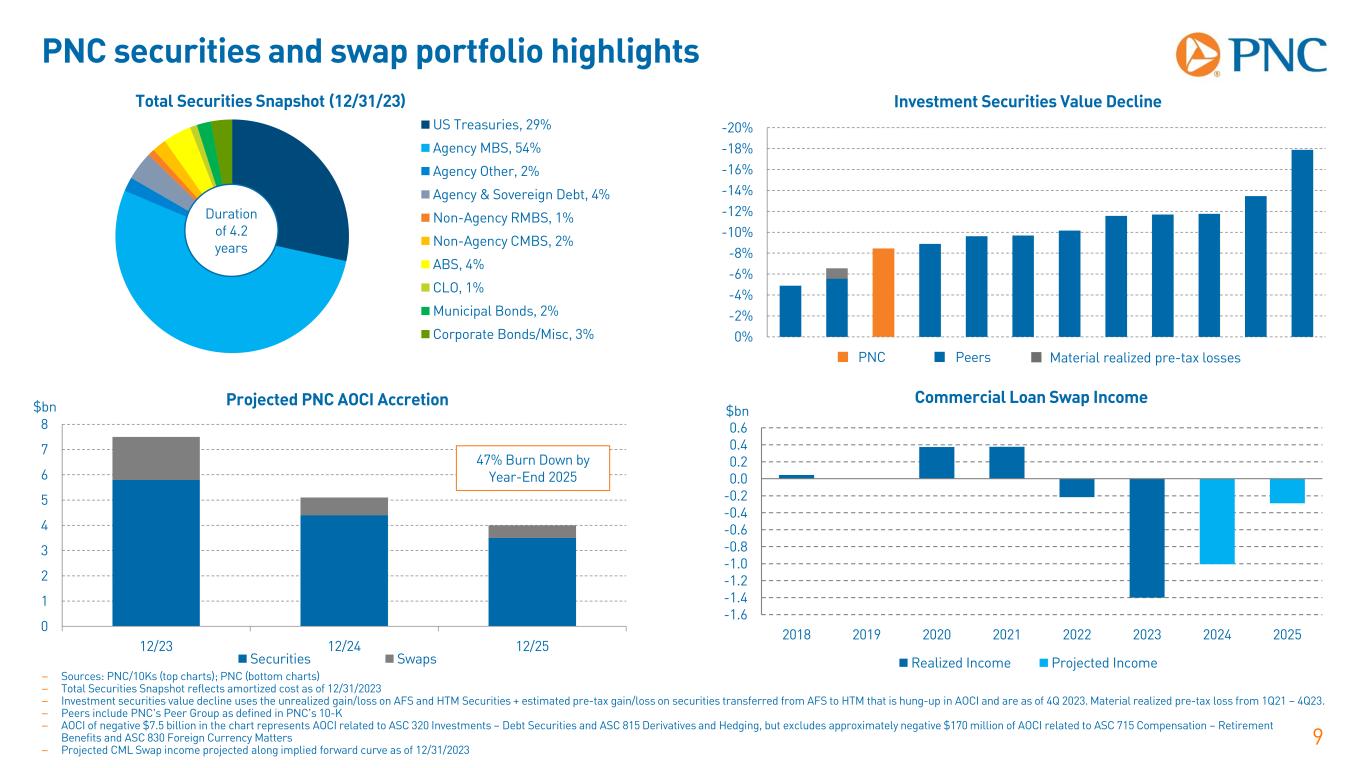
PNC securities and swap portfolio highlights 9 0 1 2 3 4 5 6 7 8 12/23 12/24 12/25 $bn Projected PNC AOCI Accretion Securities Swaps 47% Burn Down by Year-End 2025 -1.6 -1.4 -1.2 -1.0 -0.8 -0.6 -0.4 -0.2 0.0 0.2 0.4 0.6 2018 2019 2020 2021 2022 2023 2024 2025 $bn Realized Income Projected Income Commercial Loan Swap Income – Sources: PNC/10Ks (top charts); PNC (bottom charts) – Total Securities Snapshot reflects amortized cost as of 12/31/2023 – Investment securities value decline uses the unrealized gain/loss on AFS and HTM Securities + estimated pre-tax gain/loss on securities transferred from AFS to HTM that is hung-up in AOCI and are as of 4Q 2023. Material realized pre-tax loss from 1Q21 – 4Q23. – Peers include PNC’s Peer Group as defined in PNC’s 10-K – AOCI of negative $7.5 billion in the chart represents AOCI related to ASC 320 Investments – Debt Securities and ASC 815 Derivatives and Hedging, but excludes approximately negative $170 million of AOCI related to ASC 715 Compensation – Retirement Benefits and ASC 830 Foreign Currency Matters – Projected CML Swap income projected along implied forward curve as of 12/31/2023 -20% -18% -16% -14% -12% -10% -8% -6% -4% -2% 0% Investment Securities Value DeclineTotal Securities Snapshot (12/31/23) US Treasuries, 29% Agency MBS, 54% Agency Other, 2% Agency & Sovereign Debt, 4% Non-Agency RMBS, 1% Non-Agency CMBS, 2% ABS, 4% CLO, 1% Municipal Bonds, 2% Corporate Bonds/Misc, 3% Duration of 4.2 years PNC Peers Material realized pre-tax losses
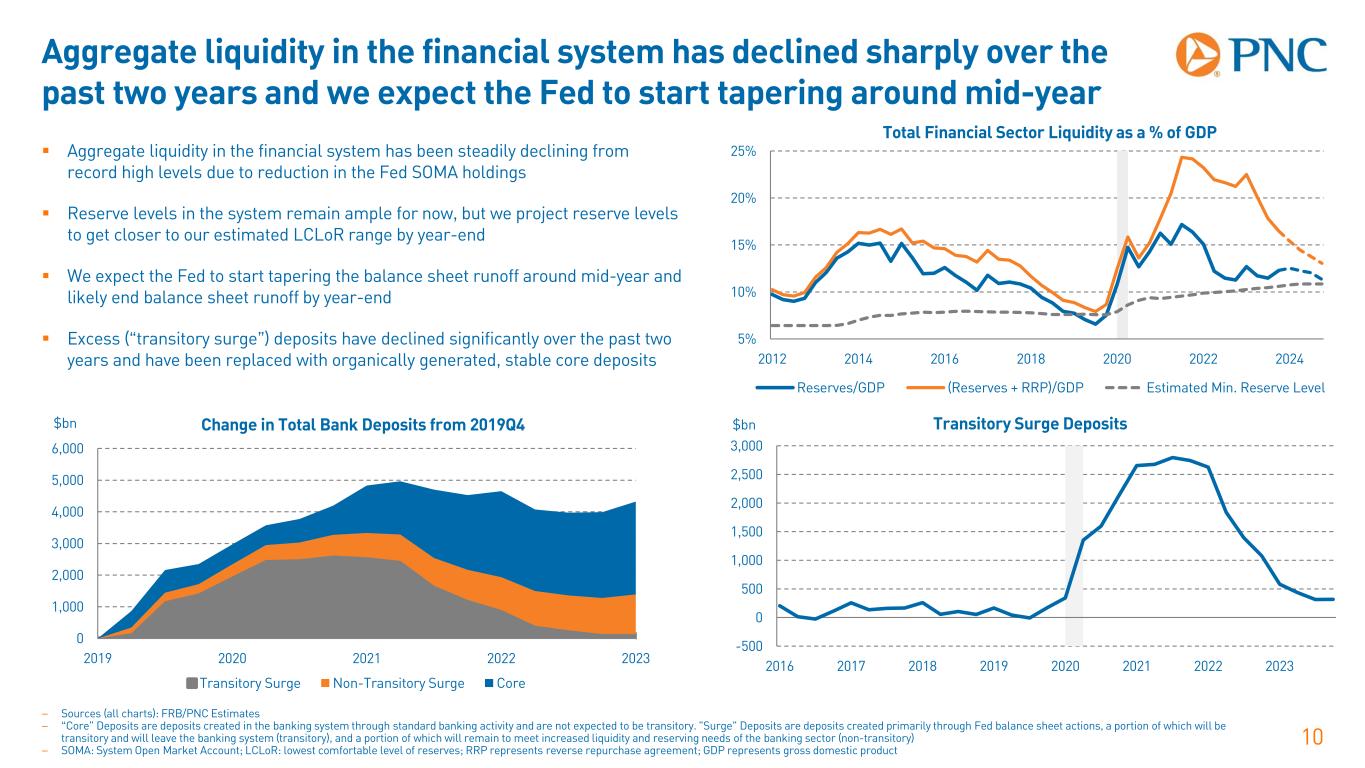
Aggregate liquidity in the financial system has declined sharply over the past two years and we expect the Fed to start tapering around mid-year 10 Aggregate liquidity in the financial system has been steadily declining from record high levels due to reduction in the Fed SOMA holdings Reserve levels in the system remain ample for now, but we project reserve levels to get closer to our estimated LCLoR range by year-end We expect the Fed to start tapering the balance sheet runoff around mid-year and likely end balance sheet runoff by year-end Excess (“transitory surge”) deposits have declined significantly over the past two years and have been replaced with organically generated, stable core deposits 5% 10% 15% 20% 25% 2012 2014 2016 2018 2020 2022 2024 Total Financial Sector Liquidity as a % of GDP Reserves/GDP (Reserves + RRP)/GDP Estimated Min. Reserve Level -500 0 500 1,000 1,500 2,000 2,500 3,000 2016 2017 2018 2019 2020 2021 2022 2023 $bn Transitory Surge Deposits – Sources (all charts): FRB/PNC Estimates – “Core" Deposits are deposits created in the banking system through standard banking activity and are not expected to be transitory. "Surge" Deposits are deposits created primarily through Fed balance sheet actions, a portion of which will be transitory and will leave the banking system (transitory), and a portion of which will remain to meet increased liquidity and reserving needs of the banking sector (non-transitory) – SOMA: System Open Market Account; LCLoR: lowest comfortable level of reserves; RRP represents reverse repurchase agreement; GDP represents gross domestic product 0 1,000 2,000 3,000 4,000 5,000 6,000 2019 2020 2021 2022 2023 $bn Change in Total Bank Deposits from 2019Q4 Transitory Surge Non-Transitory Surge Core
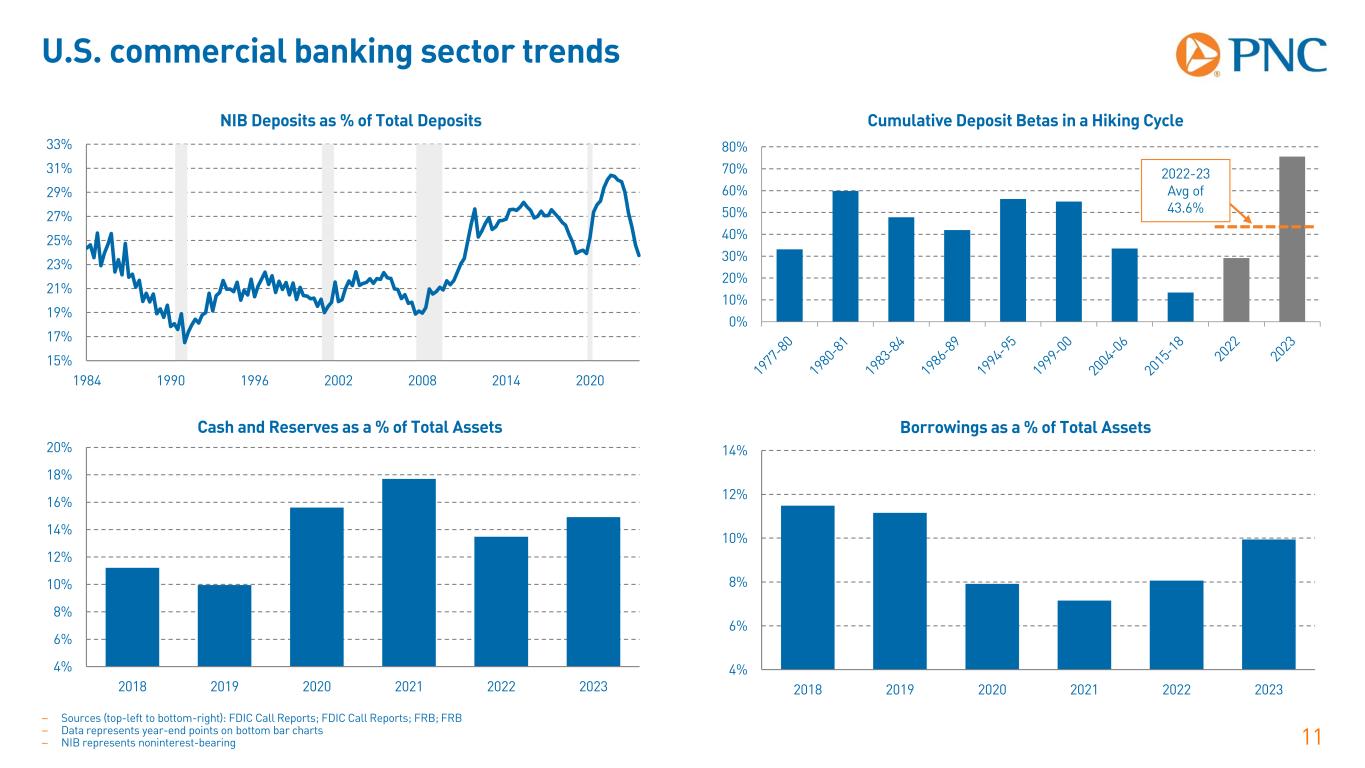
U.S. commercial banking sector trends 11 15% 17% 19% 21% 23% 25% 27% 29% 31% 33% 1984 1990 1996 2002 2008 2014 2020 NIB Deposits as % of Total Deposits 4% 6% 8% 10% 12% 14% 2018 2019 2020 2021 2022 2023 Borrowings as a % of Total Assets 0% 10% 20% 30% 40% 50% 60% 70% 80% Cumulative Deposit Betas in a Hiking Cycle 2022-23 Avg of 43.6% – Sources (top-left to bottom-right): FDIC Call Reports; FDIC Call Reports; FRB; FRB – Data represents year-end points on bottom bar charts – NIB represents noninterest-bearing 4% 6% 8% 10% 12% 14% 16% 18% 20% 2018 2019 2020 2021 2022 2023 Cash and Reserves as a % of Total Assets
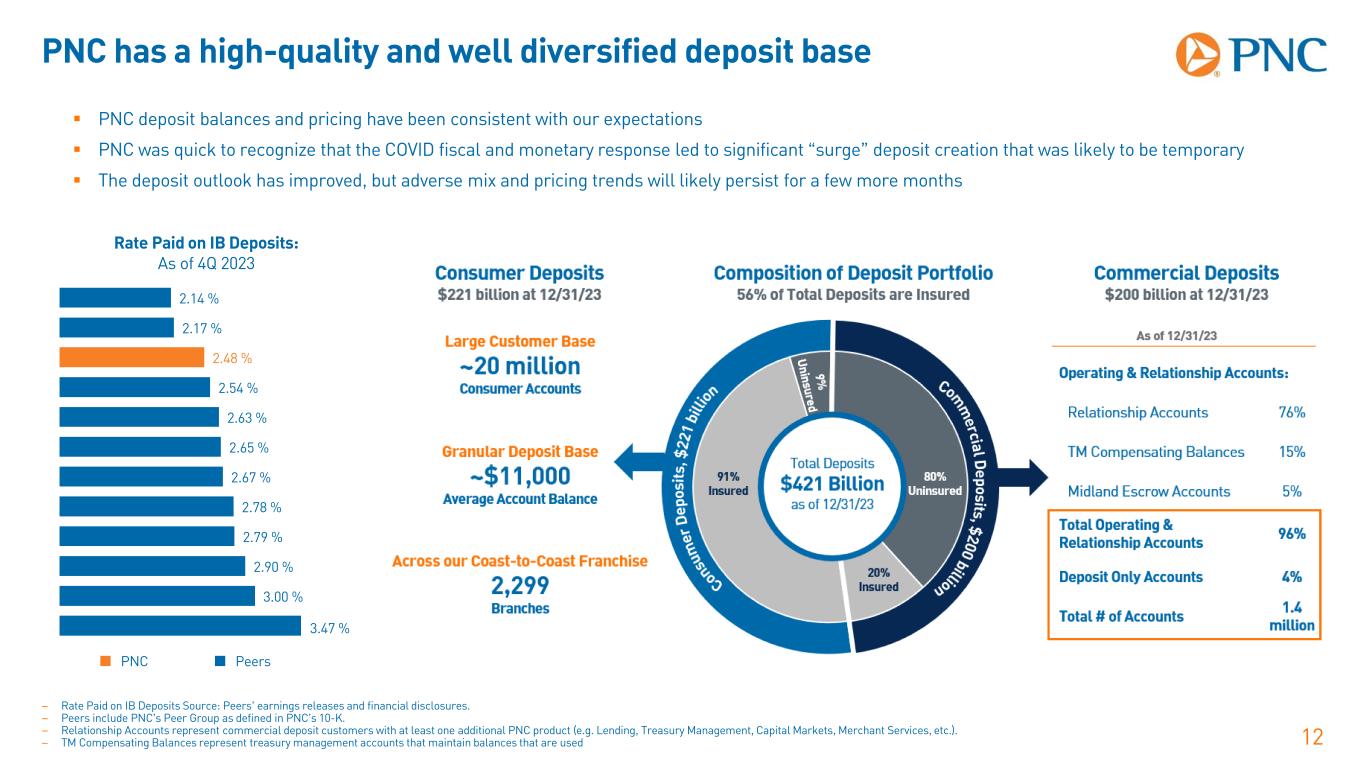
PNC has a high-quality and well diversified deposit base 12 PNC deposit balances and pricing have been consistent with our expectations PNC was quick to recognize that the COVID fiscal and monetary response led to significant “surge” deposit creation that was likely to be temporary The deposit outlook has improved, but adverse mix and pricing trends will likely persist for a few more months 3.47 % 3.00 % 2.90 % 2.79 % 2.78 % 2.67 % 2.65 % 2.63 % 2.54 % 2.48 % 2.17 % 2.14 % PNC Peers Rate Paid on IB Deposits: As of 4Q 2023 – Rate Paid on IB Deposits Source: Peers’ earnings releases and financial disclosures. – Peers include PNC’s Peer Group as defined in PNC’s 10-K. – Relationship Accounts represent commercial deposit customers with at least one additional PNC product (e.g. Lending, Treasury Management, Capital Markets, Merchant Services, etc.). – TM Compensating Balances represent treasury management accounts that maintain balances that are used
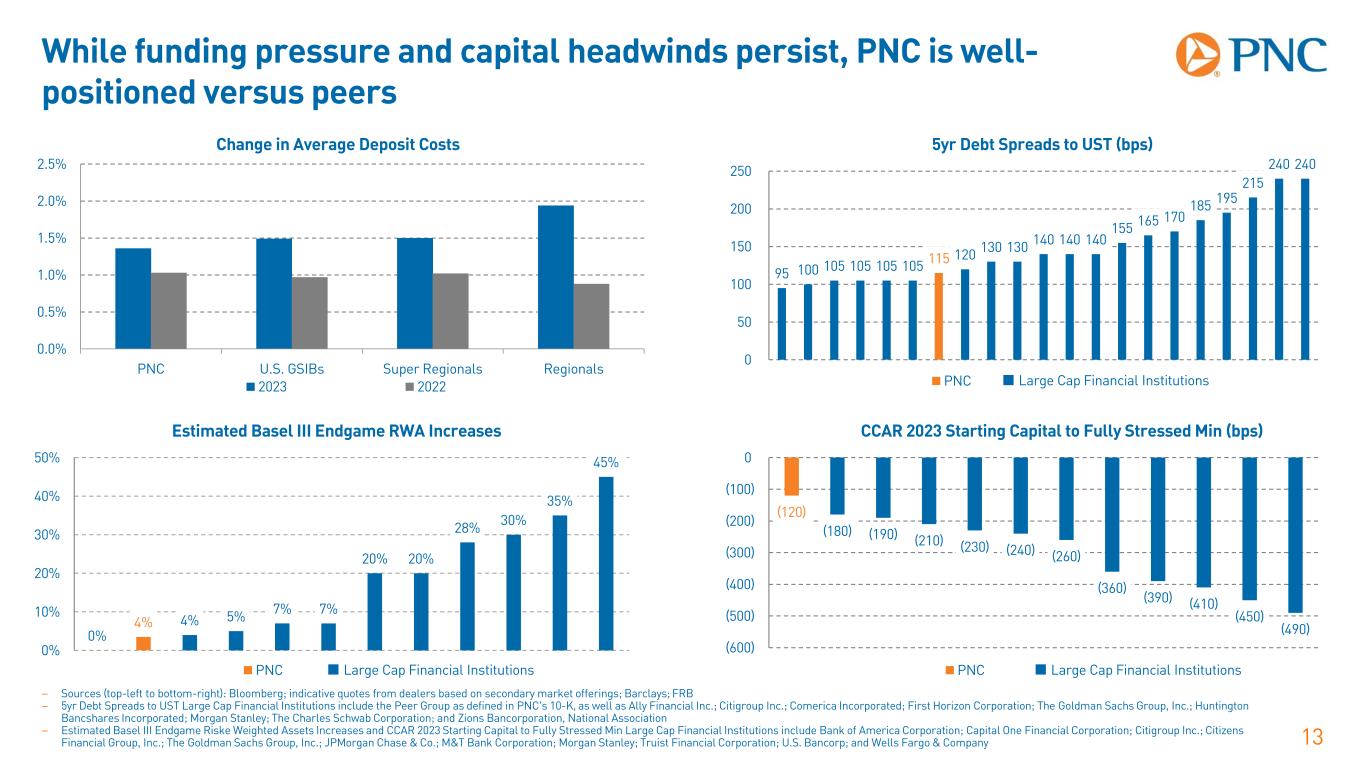
While funding pressure and capital headwinds persist, PNC is well- positioned versus peers 13 – Sources (top-left to bottom-right): Bloomberg; indicative quotes from dealers based on secondary market offerings; Barclays; FRB – 5yr Debt Spreads to UST Large Cap Financial Institutions include the Peer Group as defined in PNC’s 10-K, as well as Ally Financial Inc.; Citigroup Inc.; Comerica Incorporated; First Horizon Corporation; The Goldman Sachs Group, Inc.; Huntington Bancshares Incorporated; Morgan Stanley; The Charles Schwab Corporation; and Zions Bancorporation, National Association – Estimated Basel III Endgame Riske Weighted Assets Increases and CCAR 2023 Starting Capital to Fully Stressed Min Large Cap Financial Institutions include Bank of America Corporation; Capital One Financial Corporation; Citigroup Inc.; Citizens Financial Group, Inc.; The Goldman Sachs Group, Inc.; JPMorgan Chase & Co.; M&T Bank Corporation; Morgan Stanley; Truist Financial Corporation; U.S. Bancorp; and Wells Fargo & Company 0% 4% 4% 5% 7% 7% 20% 20% 28% 30% 35% 45% 0% 10% 20% 30% 40% 50% Estimated Basel III Endgame RWA Increases PNC 0.0% 0.5% 1.0% 1.5% 2.0% 2.5% PNC U.S. GSIBs Super Regionals Regionals Change in Average Deposit Costs 2023 2022 (120) (180) (190) (210) (230) (240) (260) (360) (390) (410) (450) (490) (600) (500) (400) (300) (200) (100) 0 CCAR 2023 Starting Capital to Fully Stressed Min (bps) PNC 95 100 105 105 105 105 115 120 130 130 140 140 140 155 165 170 185 195 215 240 240 0 50 100 150 200 250 5yr Debt Spreads to UST (bps) PNC Large Cap Financial Institutions Large Cap Financial Institutions Large Cap Financial Institutions
Summary 14 Despite significant monetary policy headwinds, the U.S. economy performed well in 2023, defying recession forecasts Inflation declined sharply, driven by shelter and goods prices; services inflation has proven to be sticky and has stayed stubbornly high The economic outlook for 2024 has brightened with declining inflation and improving financial conditions Monetary policy is restrictive, especially with inflation declining, and we expect the Fed to ease policy rates this year, but the magnitude and timing remain uncertain PNC’s overall interest rate risk (IRR) position is close to neutral, and we expect additional NII benefits from repricing our fixed-rate assets over the next few years PNC balance sheet is positioned well for the new rate, funding, and regulatory environment
Cautionary Statement Regarding Forward-Looking Information 15 This presentation includes “snapshot” information about PNC used by way of illustration and is not intended as a full business or financial review. It should not be viewed in isolation but rather in the context of all of the information made available by PNC in its SEC filings. We make statements in this presentation, and we may from time to time make other statements, regarding our outlook for financial performance, such as earnings, revenues, expenses, tax rates, capital and liquidity levels and ratios, asset levels, asset quality, financial position, and other matters regarding or affecting us and our future business and operations, including our sustainability strategy, that are forward-looking statements within the meaning of the Private Securities Litigation Reform Act. Forward-looking statements are typically identified by words such as “believe,” “plan,” “expect,” “anticipate,” “see,” “look,” “intend,” “outlook,” “project,” “forecast,” “estimate,” “goal,” “will,” “should” and other similar words and expressions. Forward-looking statements are necessarily subject to numerous assumptions, risks and uncertainties, which change over time. Future events or circumstances may change our outlook and may also affect the nature of the assumptions, risks and uncertainties to which our forward-looking statements are subject. Forward-looking statements speak only as of the date made. We do not assume any duty and do not undertake any obligation to update forward-looking statements. Actual results or future events could differ, possibly materially, from those anticipated in forward-looking statements, as well as from historical performance. As a result, we caution against placing undue reliance on any forward-looking statements. Our forward-looking statements are subject to the following principal risks and uncertainties. Our businesses, financial results and balance sheet values are affected by business and economic conditions, including: − Changes in interest rates and valuations in debt, equity and other financial markets, − Disruptions in the U.S. and global financial markets, − Actions by the Federal Reserve Board, U.S. Treasury and other government agencies, including those that impact money supply, market interest rates and inflation, − Changes in customer behavior due to changing business and economic conditions or legislative or regulatory initiatives, − Changes in customers’, suppliers’ and other counterparties’ performance and creditworthiness, − Impacts of sanctions, tariffs and other trade policies of the U.S. and its global trading partners, − Impacts of changes in federal, state and local governmental policy, including on the regulatory landscape, capital markets, taxes, infrastructure spending and social programs, − Our ability to attract, recruit and retain skilled employees, and − Commodity price volatility.
Cautionary Statement Regarding Forward-Looking Information 16 Our forward-looking financial statements are subject to the risk that economic and financial market conditions will be substantially different than those we are currently expecting and do not take into account potential legal and regulatory contingencies. These statements are based on our views that: − PNC’s baseline forecast is for slower economic growth in 2024 as consumer spending growth slows and higher interest rates remain a drag on the economy. The ongoing strength of the labor market will continue to support consumer spending. Slowing inflation will allow for federal funds rate cuts starting in the late spring or early summer; this will support economic growth in the second half of 2024. − GDP growth this year will be below trend at slightly above 1%, and the unemployment rate will increase modestly to somewhat above 4% by the end of 2024. Inflation will continue to slow as wage pressures abate, moving back to the Federal Reserve’s 2% long-term objective by the end of the year. − PNC expects the federal funds rate to remain unchanged in the first part of 2024, between 5.25% and 5.50%, with federal funds rate cuts starting in May 2024 as inflation slows further. PNC expects the federal funds rate to end 2024 between 4.25% and 4.50%. PNC’s ability to take certain capital actions, including returning capital to shareholders, is subject to PNC meeting or exceeding a stress capital buffer established by the Federal Reserve Board in connection with the Federal Reserve Board’s Comprehensive Capital Analysis and Review (CCAR) process. PNC’s regulatory capital ratios in the future will depend on, among other things, its financial performance, the scope and terms of final capital regulations then in effect and management actions affecting the composition of PNC’s balance sheet. In addition, PNC’s ability to determine, evaluate and forecast regulatory capital ratios, and to take actions (such as capital distributions) based on actual or forecasted capital ratios, will be dependent at least in part on the development, validation and regulatory review of related models and the reliability of and risks resulting from extensive use of such models. Legal and regulatory developments could have an impact on our ability to operate our businesses, financial condition, results of operations, competitive position, reputation or pursuit of attractive acquisition opportunities. Reputational impacts could affect matters such as business generation and retention, liquidity, funding and ability to attract and retain employees. These developments could include: − Changes to laws and regulations, including changes affecting oversight of the financial services industry, changes in the enforcement and interpretation of such laws and regulations, and changes in accounting and reporting standards. − Unfavorable resolution of legal proceedings or other claims and regulatory and other governmental investigations or other inquiries resulting in monetary losses, costs, or alterations in our business practices, and potentially causing reputational harm to PNC. − Results of the regulatory examination and supervision process, including our failure to satisfy requirements of agreements with governmental agencies. − Costs associated with obtaining rights in intellectual property claimed by others and of adequacy of our intellectual property protection in general.
Cautionary Statement Regarding Forward-Looking Information 17 Business and operating results are affected by our ability to identify and effectively manage risks inherent in our businesses, including, where appropriate, through effective use of systems and controls, third-party insurance, derivatives and capital management techniques, and to meet evolving regulatory capital and liquidity standards. Our reputation and business and operating results may be affected by our ability to appropriately meet or address environmental, social or governance targets, goals, commitments or concerns that may arise. We grow our business in part through acquisitions and new strategic initiatives. Risks and uncertainties include those presented by the nature of the business acquired and strategic initiative, including in some cases those associated with our entry into new businesses or new geographic or other markets and risks resulting from our inexperience in those new areas, as well as risks and uncertainties related to the acquisition transactions themselves, regulatory issues, the integration of the acquired businesses into PNC after closing or any failure to execute strategic or operational plans. Competition can have an impact on customer acquisition, growth and retention and on credit spreads and product pricing, which can affect market share, deposits and revenues. Our ability to anticipate and respond to technological changes can also impact our ability to respond to customer needs and meet competitive demands. Business and operating results can also be affected by widespread manmade, natural and other disasters (including severe weather events), health emergencies, dislocations, geopolitical instabilities or events, terrorist activities, system failures or disruptions, security breaches, cyberattacks, international hostilities, or other extraordinary events beyond PNC’s control through impacts on the economy and financial markets generally or on us or our counterparties, customers or third-party vendors and service providers specifically. We provide greater detail regarding these as well as other factors in our 2023 Form 10-K, including in the Risk Factors and Risk Management sections and the Legal Proceedings and Commitments Notes of the Notes To Consolidated Financial Statements in those reports, and in our subsequent SEC filings. Our forward-looking statements may also be subject to other risks and uncertainties, including those we may discuss elsewhere in this presentation or in our SEC filings, accessible on the SEC’s website at www.sec.gov and on our corporate website at www.pnc.com/secfilings. We have included these web addresses as inactive textual references only. Information on these websites is not part of this document.