EX-99.2
Published on August 5, 2021
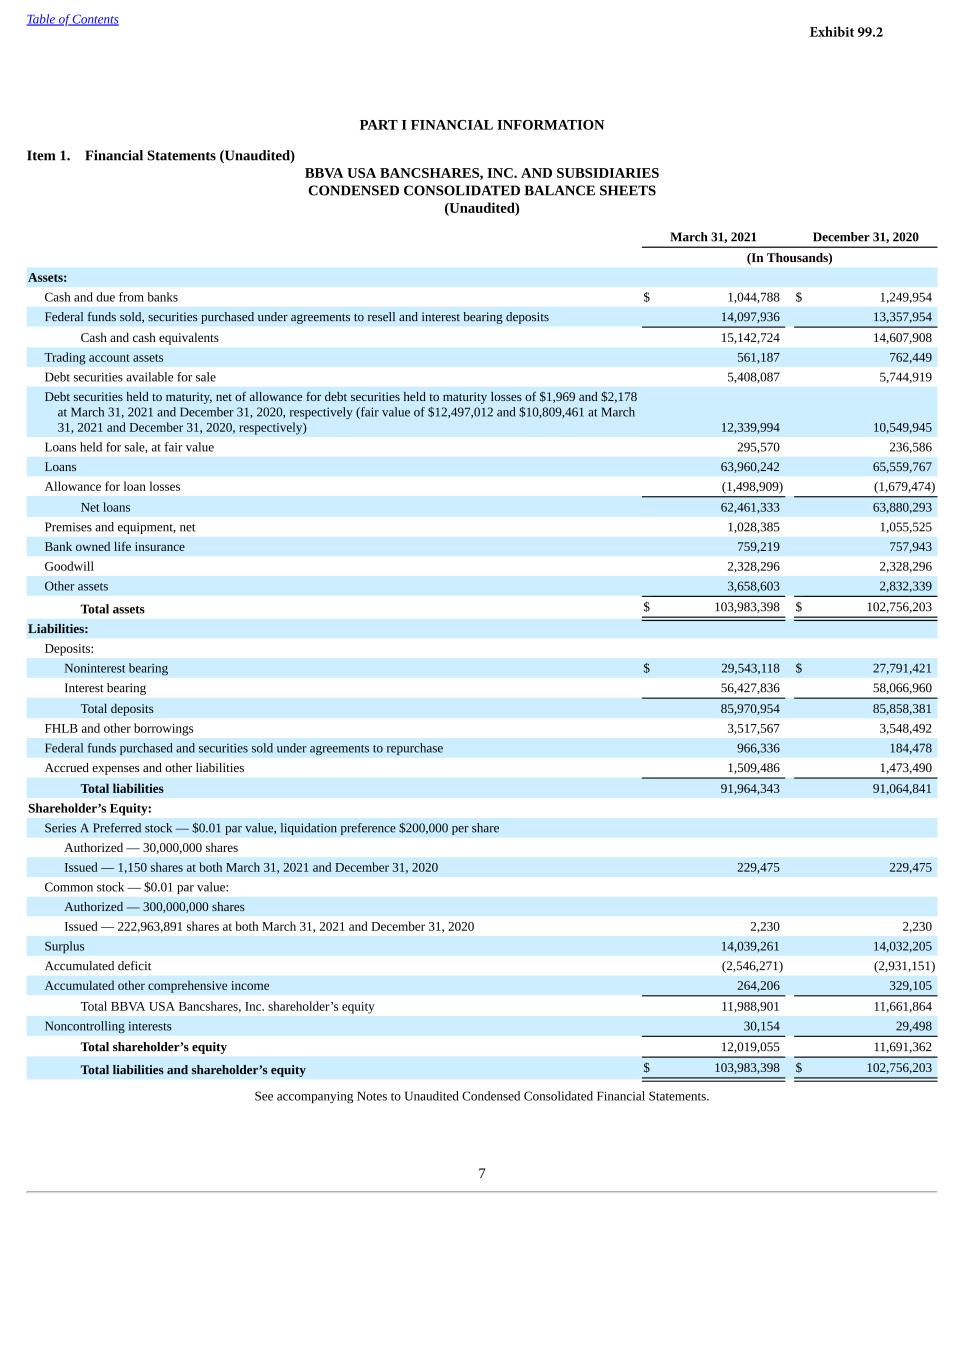
Table of Contents PART I FINANCIAL INFORMATION Item 1. Financial Statements (Unaudited) BBVA USA BANCSHARES, INC. AND SUBSIDIARIES CONDENSED CONSOLIDATED BALANCE SHEETS (Unaudited) March 31, 2021 December 31, 2020 (In Thousands) Assets: Cash and due from banks $ 1,044,788 $ 1,249,954 Federal funds sold, securities purchased under agreements to resell and interest bearing deposits 14,097,936 13,357,954 Cash and cash equivalents 15,142,724 14,607,908 Trading account assets 561,187 762,449 Debt securities available for sale 5,408,087 5,744,919 Debt securities held to maturity, net of allowance for debt securities held to maturity losses of $1,969 and $2,178 at March 31, 2021 and December 31, 2020, respectively (fair value of $12,497,012 and $10,809,461 at March 31, 2021 and December 31, 2020, respectively) 12,339,994 10,549,945 Loans held for sale, at fair value 295,570 236,586 Loans 63,960,242 65,559,767 Allowance for loan losses (1,498,909) (1,679,474) Net loans 62,461,333 63,880,293 Premises and equipment, net 1,028,385 1,055,525 Bank owned life insurance 759,219 757,943 Goodwill 2,328,296 2,328,296 Other assets 3,658,603 2,832,339 Total assets $ 103,983,398 $ 102,756,203 Liabilities: Deposits: Noninterest bearing $ 29,543,118 $ 27,791,421 Interest bearing 56,427,836 58,066,960 Total deposits 85,970,954 85,858,381 FHLB and other borrowings 3,517,567 3,548,492 Federal funds purchased and securities sold under agreements to repurchase 966,336 184,478 Accrued expenses and other liabilities 1,509,486 1,473,490 Total liabilities 91,964,343 91,064,841 Shareholder’s Equity: Series A Preferred stock — $0.01 par value, liquidation preference $200,000 per share Authorized — 30,000,000 shares Issued — 1,150 shares at both March 31, 2021 and December 31, 2020 229,475 229,475 Common stock — $0.01 par value: Authorized — 300,000,000 shares Issued — 222,963,891 shares at both March 31, 2021 and December 31, 2020 2,230 2,230 Surplus 14,039,261 14,032,205 Accumulated deficit (2,546,271) (2,931,151) Accumulated other comprehensive income 264,206 329,105 Total BBVA USA Bancshares, Inc. shareholder’s equity 11,988,901 11,661,864 Noncontrolling interests 30,154 29,498 Total shareholder’s equity 12,019,055 11,691,362 Total liabilities and shareholder’s equity $ 103,983,398 $ 102,756,203 See accompanying Notes to Unaudited Condensed Consolidated Financial Statements. 7 Exhibit 99.2
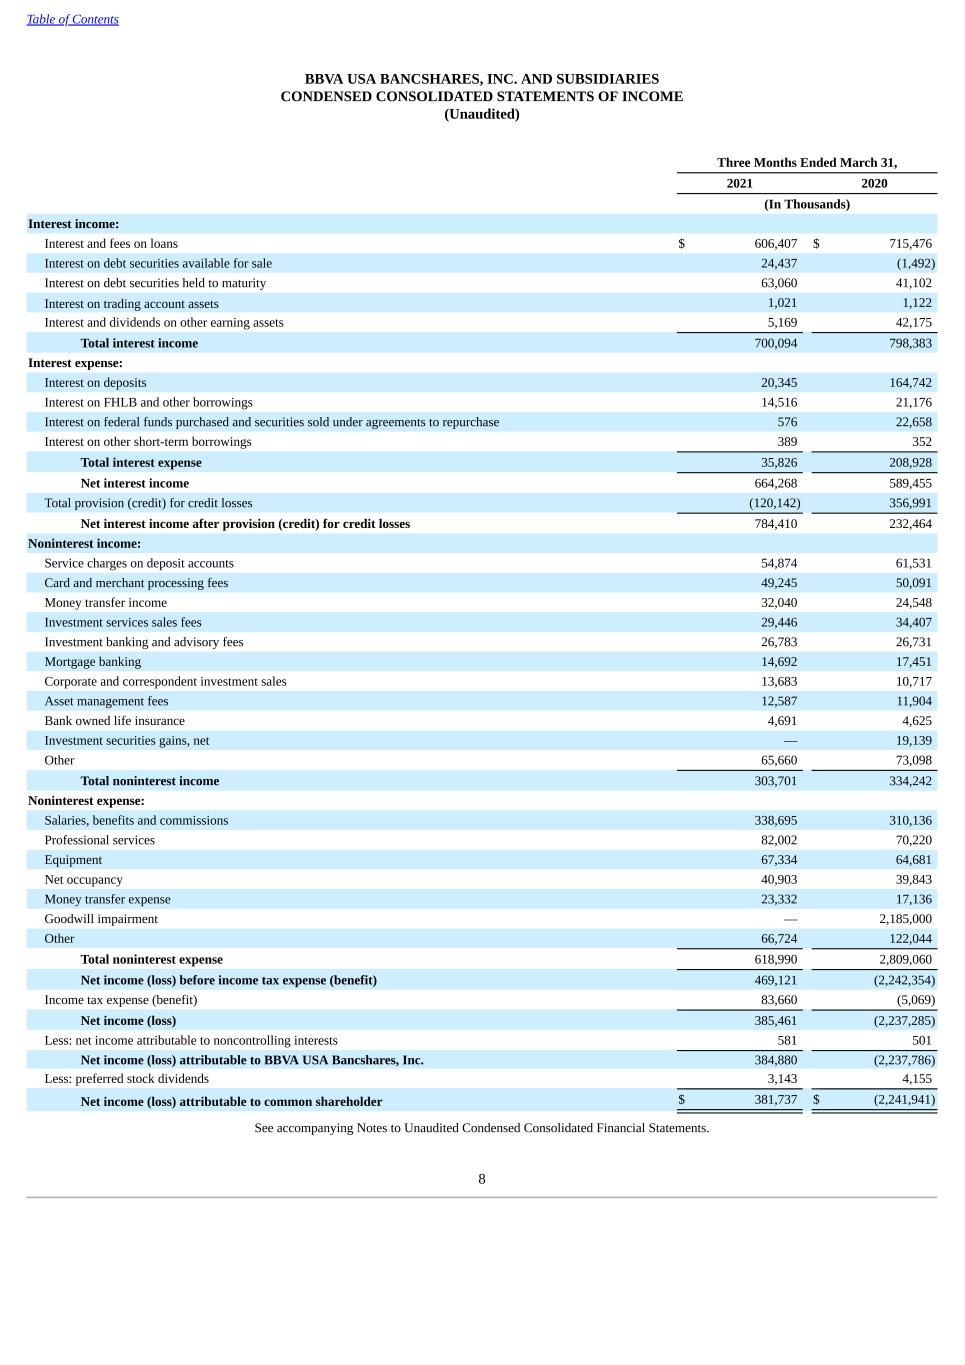
Table of Contents BBVA USA BANCSHARES, INC. AND SUBSIDIARIES CONDENSED CONSOLIDATED STATEMENTS OF INCOME (Unaudited) Three Months Ended March 31, 2021 2020 (In Thousands) Interest income: Interest and fees on loans $ 606,407 $ 715,476 Interest on debt securities available for sale 24,437 (1,492) Interest on debt securities held to maturity 63,060 41,102 Interest on trading account assets 1,021 1,122 Interest and dividends on other earning assets 5,169 42,175 Total interest income 700,094 798,383 Interest expense: Interest on deposits 20,345 164,742 Interest on FHLB and other borrowings 14,516 21,176 Interest on federal funds purchased and securities sold under agreements to repurchase 576 22,658 Interest on other short-term borrowings 389 352 Total interest expense 35,826 208,928 Net interest income 664,268 589,455 Total provision (credit) for credit losses (120,142) 356,991 Net interest income after provision (credit) for credit losses 784,410 232,464 Noninterest income: Service charges on deposit accounts 54,874 61,531 Card and merchant processing fees 49,245 50,091 Money transfer income 32,040 24,548 Investment services sales fees 29,446 34,407 Investment banking and advisory fees 26,783 26,731 Mortgage banking 14,692 17,451 Corporate and correspondent investment sales 13,683 10,717 Asset management fees 12,587 11,904 Bank owned life insurance 4,691 4,625 Investment securities gains, net — 19,139 Other 65,660 73,098 Total noninterest income 303,701 334,242 Noninterest expense: Salaries, benefits and commissions 338,695 310,136 Professional services 82,002 70,220 Equipment 67,334 64,681 Net occupancy 40,903 39,843 Money transfer expense 23,332 17,136 Goodwill impairment — 2,185,000 Other 66,724 122,044 Total noninterest expense 618,990 2,809,060 Net income (loss) before income tax expense (benefit) 469,121 (2,242,354) Income tax expense (benefit) 83,660 (5,069) Net income (loss) 385,461 (2,237,285) Less: net income attributable to noncontrolling interests 581 501 Net income (loss) attributable to BBVA USA Bancshares, Inc. 384,880 (2,237,786) Less: preferred stock dividends 3,143 4,155 Net income (loss) attributable to common shareholder $ 381,737 $ (2,241,941) See accompanying Notes to Unaudited Condensed Consolidated Financial Statements. 8
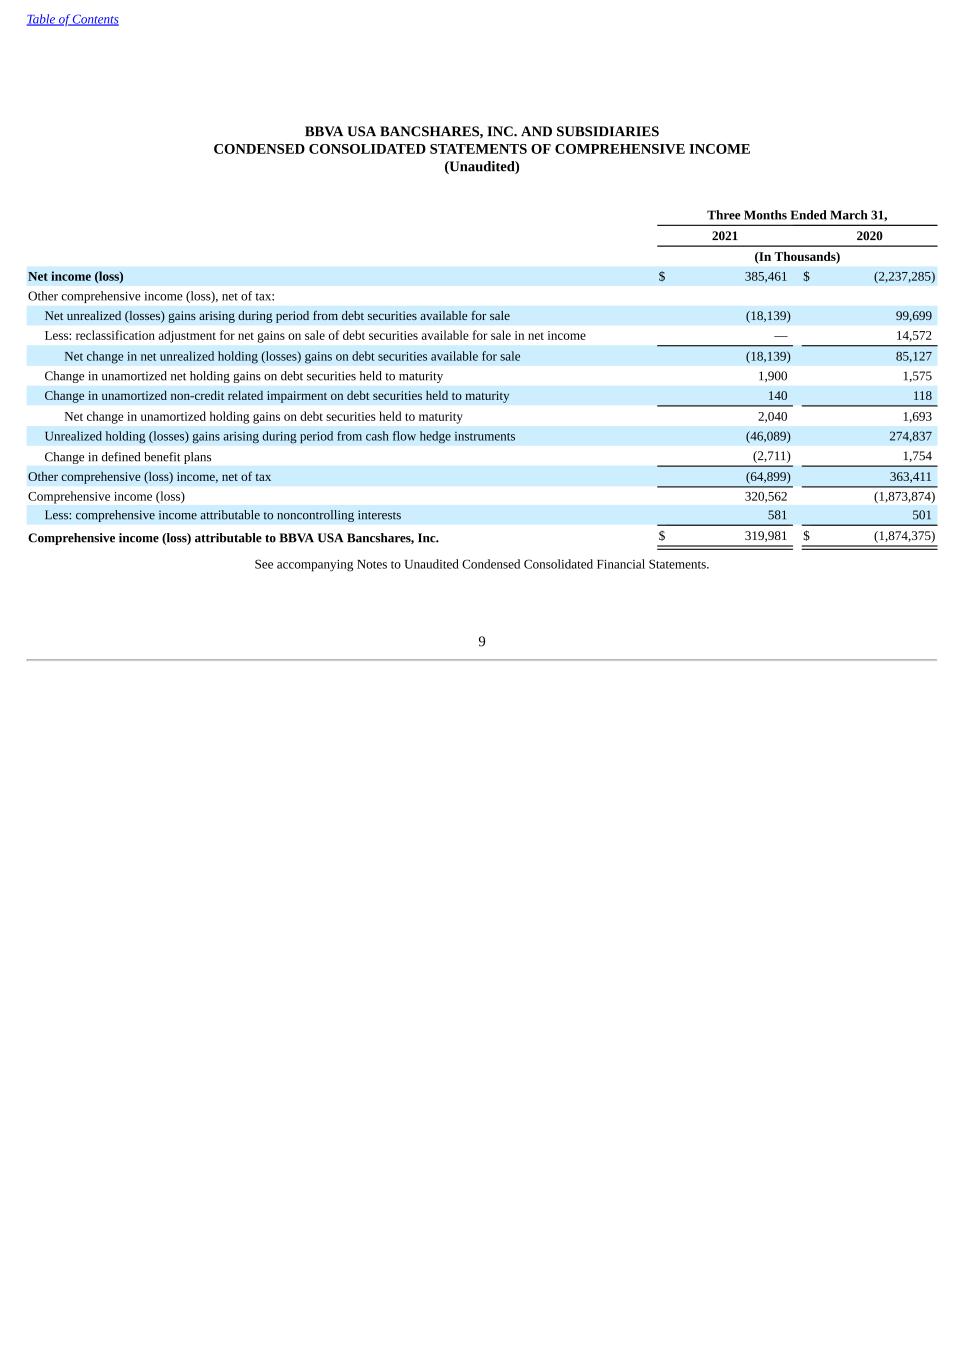
Table of Contents BBVA USA BANCSHARES, INC. AND SUBSIDIARIES CONDENSED CONSOLIDATED STATEMENTS OF COMPREHENSIVE INCOME (Unaudited) Three Months Ended March 31, 2021 2020 (In Thousands) Net income (loss) $ 385,461 $ (2,237,285) Other comprehensive income (loss), net of tax: Net unrealized (losses) gains arising during period from debt securities available for sale (18,139) 99,699 Less: reclassification adjustment for net gains on sale of debt securities available for sale in net income — 14,572 Net change in net unrealized holding (losses) gains on debt securities available for sale (18,139) 85,127 Change in unamortized net holding gains on debt securities held to maturity 1,900 1,575 Change in unamortized non-credit related impairment on debt securities held to maturity 140 118 Net change in unamortized holding gains on debt securities held to maturity 2,040 1,693 Unrealized holding (losses) gains arising during period from cash flow hedge instruments (46,089) 274,837 Change in defined benefit plans (2,711) 1,754 Other comprehensive (loss) income, net of tax (64,899) 363,411 Comprehensive income (loss) 320,562 (1,873,874) Less: comprehensive income attributable to noncontrolling interests 581 501 Comprehensive income (loss) attributable to BBVA USA Bancshares, Inc. $ 319,981 $ (1,874,375) See accompanying Notes to Unaudited Condensed Consolidated Financial Statements. 9
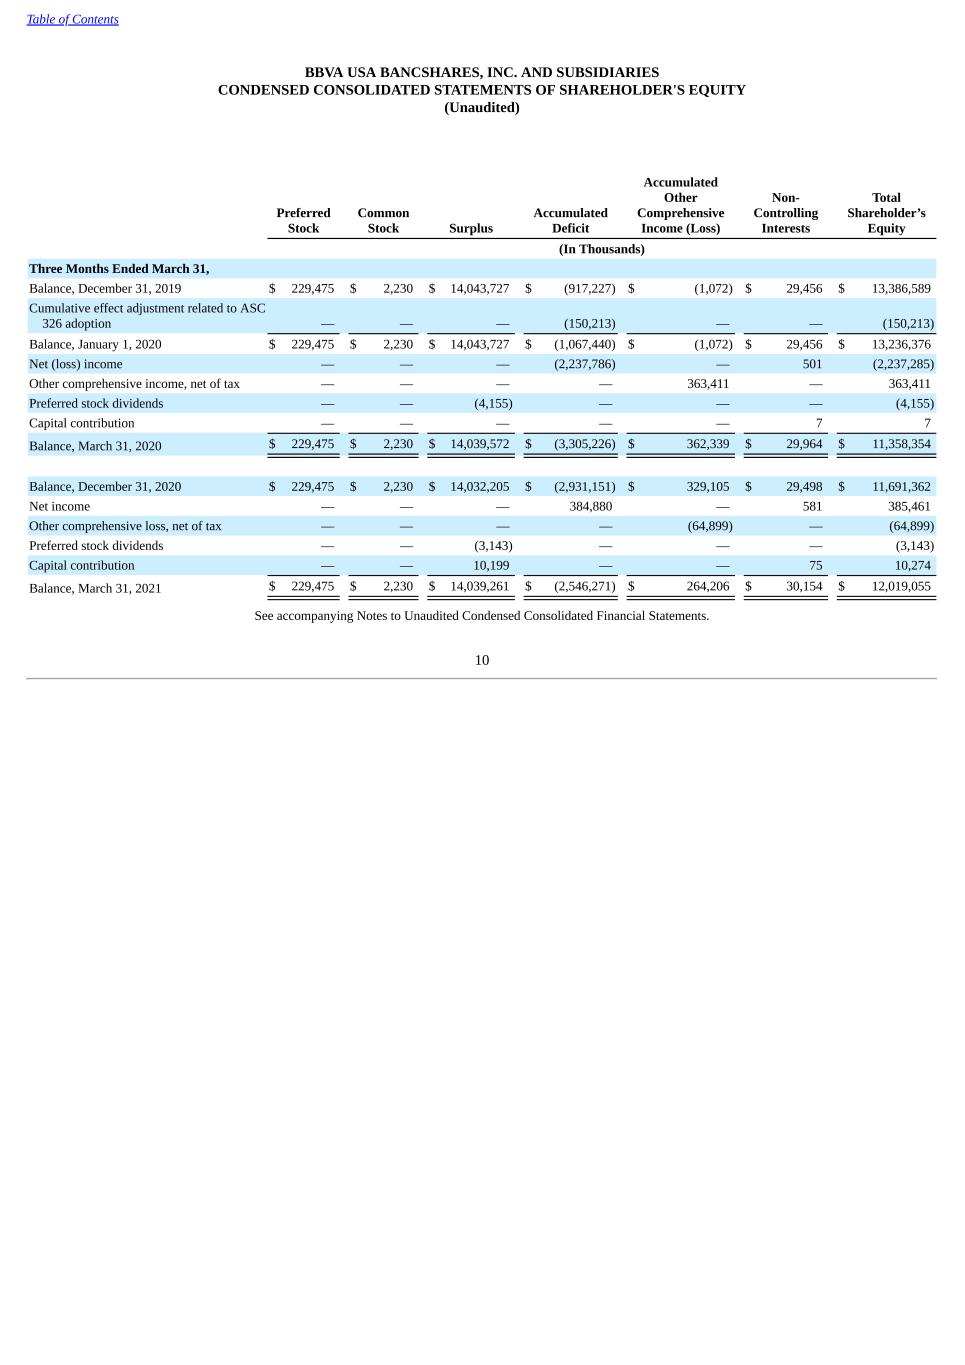
Table of Contents BBVA USA BANCSHARES, INC. AND SUBSIDIARIES CONDENSED CONSOLIDATED STATEMENTS OF SHAREHOLDER'S EQUITY (Unaudited) Preferred Stock Common Stock Surplus Accumulated Deficit Accumulated Other Comprehensive Income (Loss) Non- Controlling Interests Total Shareholder’s Equity (In Thousands) Three Months Ended March 31, Balance, December 31, 2019 $ 229,475 $ 2,230 $ 14,043,727 $ (917,227) $ (1,072) $ 29,456 $ 13,386,589 Cumulative effect adjustment related to ASC 326 adoption — — — (150,213) — — (150,213) Balance, January 1, 2020 $ 229,475 $ 2,230 $ 14,043,727 $ (1,067,440) $ (1,072) $ 29,456 $ 13,236,376 Net (loss) income — — — (2,237,786) — 501 (2,237,285) Other comprehensive income, net of tax — — — — 363,411 — 363,411 Preferred stock dividends — — (4,155) — — — (4,155) Capital contribution — — — — — 7 7 Balance, March 31, 2020 $ 229,475 $ 2,230 $ 14,039,572 $ (3,305,226) $ 362,339 $ 29,964 $ 11,358,354 Balance, December 31, 2020 $ 229,475 $ 2,230 $ 14,032,205 $ (2,931,151) $ 329,105 $ 29,498 $ 11,691,362 Net income — — — 384,880 — 581 385,461 Other comprehensive loss, net of tax — — — — (64,899) — (64,899) Preferred stock dividends — — (3,143) — — — (3,143) Capital contribution — — 10,199 — — 75 10,274 Balance, March 31, 2021 $ 229,475 $ 2,230 $ 14,039,261 $ (2,546,271) $ 264,206 $ 30,154 $ 12,019,055 See accompanying Notes to Unaudited Condensed Consolidated Financial Statements. 10
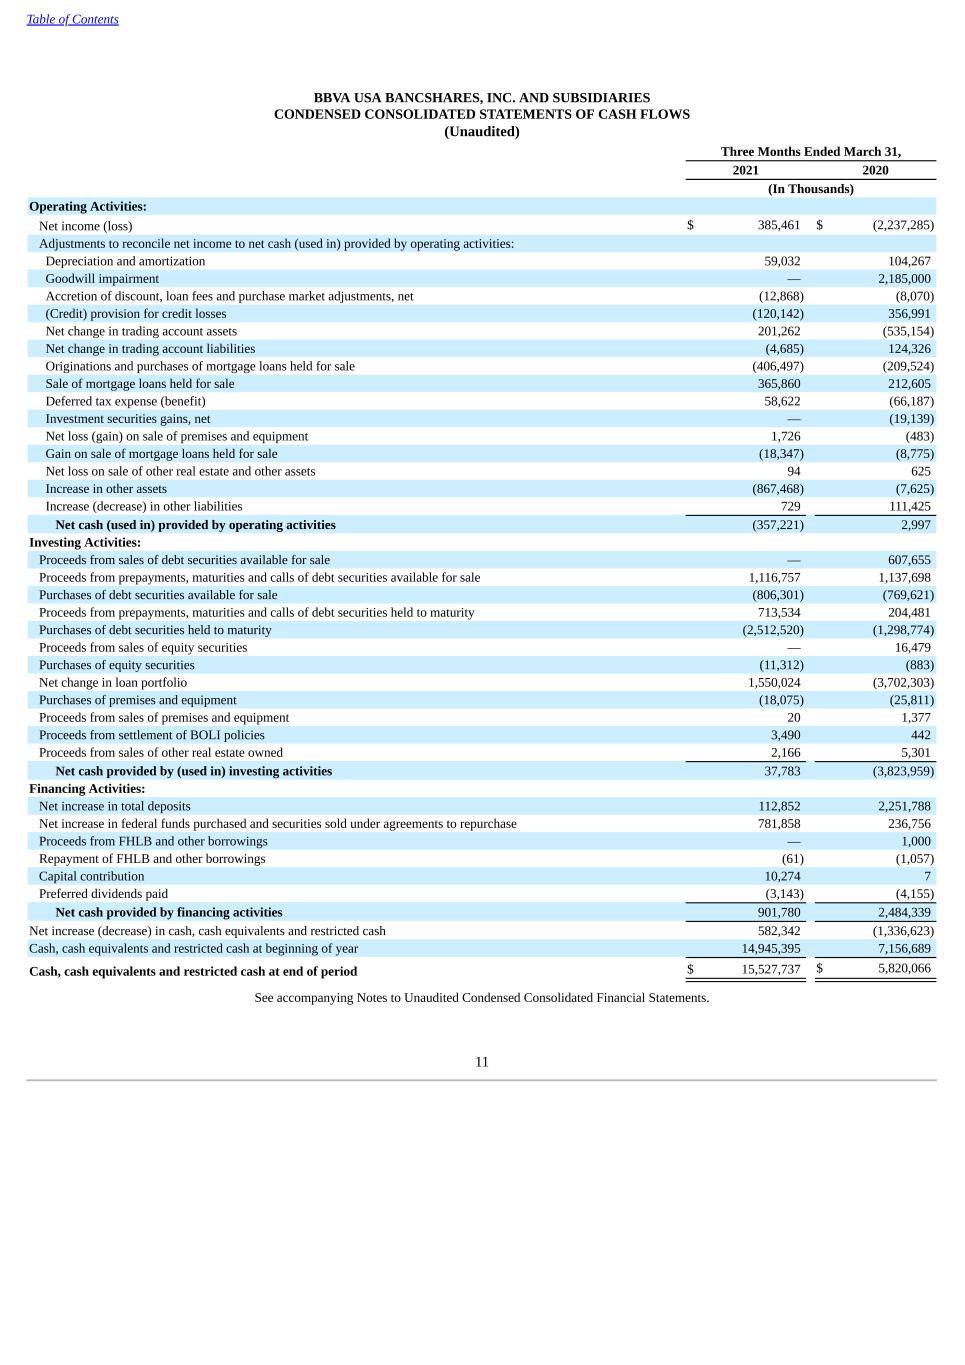
Table of Contents BBVA USA BANCSHARES, INC. AND SUBSIDIARIES CONDENSED CONSOLIDATED STATEMENTS OF CASH FLOWS (Unaudited) Three Months Ended March 31, 2021 2020 (In Thousands) Operating Activities: Net income (loss) $ 385,461 $ (2,237,285) Adjustments to reconcile net income to net cash (used in) provided by operating activities: Depreciation and amortization 59,032 104,267 Goodwill impairment — 2,185,000 Accretion of discount, loan fees and purchase market adjustments, net (12,868) (8,070) (Credit) provision for credit losses (120,142) 356,991 Net change in trading account assets 201,262 (535,154) Net change in trading account liabilities (4,685) 124,326 Originations and purchases of mortgage loans held for sale (406,497) (209,524) Sale of mortgage loans held for sale 365,860 212,605 Deferred tax expense (benefit) 58,622 (66,187) Investment securities gains, net — (19,139) Net loss (gain) on sale of premises and equipment 1,726 (483) Gain on sale of mortgage loans held for sale (18,347) (8,775) Net loss on sale of other real estate and other assets 94 625 Increase in other assets (867,468) (7,625) Increase (decrease) in other liabilities 729 111,425 Net cash (used in) provided by operating activities (357,221) 2,997 Investing Activities: Proceeds from sales of debt securities available for sale — 607,655 Proceeds from prepayments, maturities and calls of debt securities available for sale 1,116,757 1,137,698 Purchases of debt securities available for sale (806,301) (769,621) Proceeds from prepayments, maturities and calls of debt securities held to maturity 713,534 204,481 Purchases of debt securities held to maturity (2,512,520) (1,298,774) Proceeds from sales of equity securities — 16,479 Purchases of equity securities (11,312) (883) Net change in loan portfolio 1,550,024 (3,702,303) Purchases of premises and equipment (18,075) (25,811) Proceeds from sales of premises and equipment 20 1,377 Proceeds from settlement of BOLI policies 3,490 442 Proceeds from sales of other real estate owned 2,166 5,301 Net cash provided by (used in) investing activities 37,783 (3,823,959) Financing Activities: Net increase in total deposits 112,852 2,251,788 Net increase in federal funds purchased and securities sold under agreements to repurchase 781,858 236,756 Proceeds from FHLB and other borrowings — 1,000 Repayment of FHLB and other borrowings (61) (1,057) Capital contribution 10,274 7 Preferred dividends paid (3,143) (4,155) Net cash provided by financing activities 901,780 2,484,339 Net increase (decrease) in cash, cash equivalents and restricted cash 582,342 (1,336,623) Cash, cash equivalents and restricted cash at beginning of year 14,945,395 7,156,689 Cash, cash equivalents and restricted cash at end of period $ 15,527,737 $ 5,820,066 See accompanying Notes to Unaudited Condensed Consolidated Financial Statements. 11
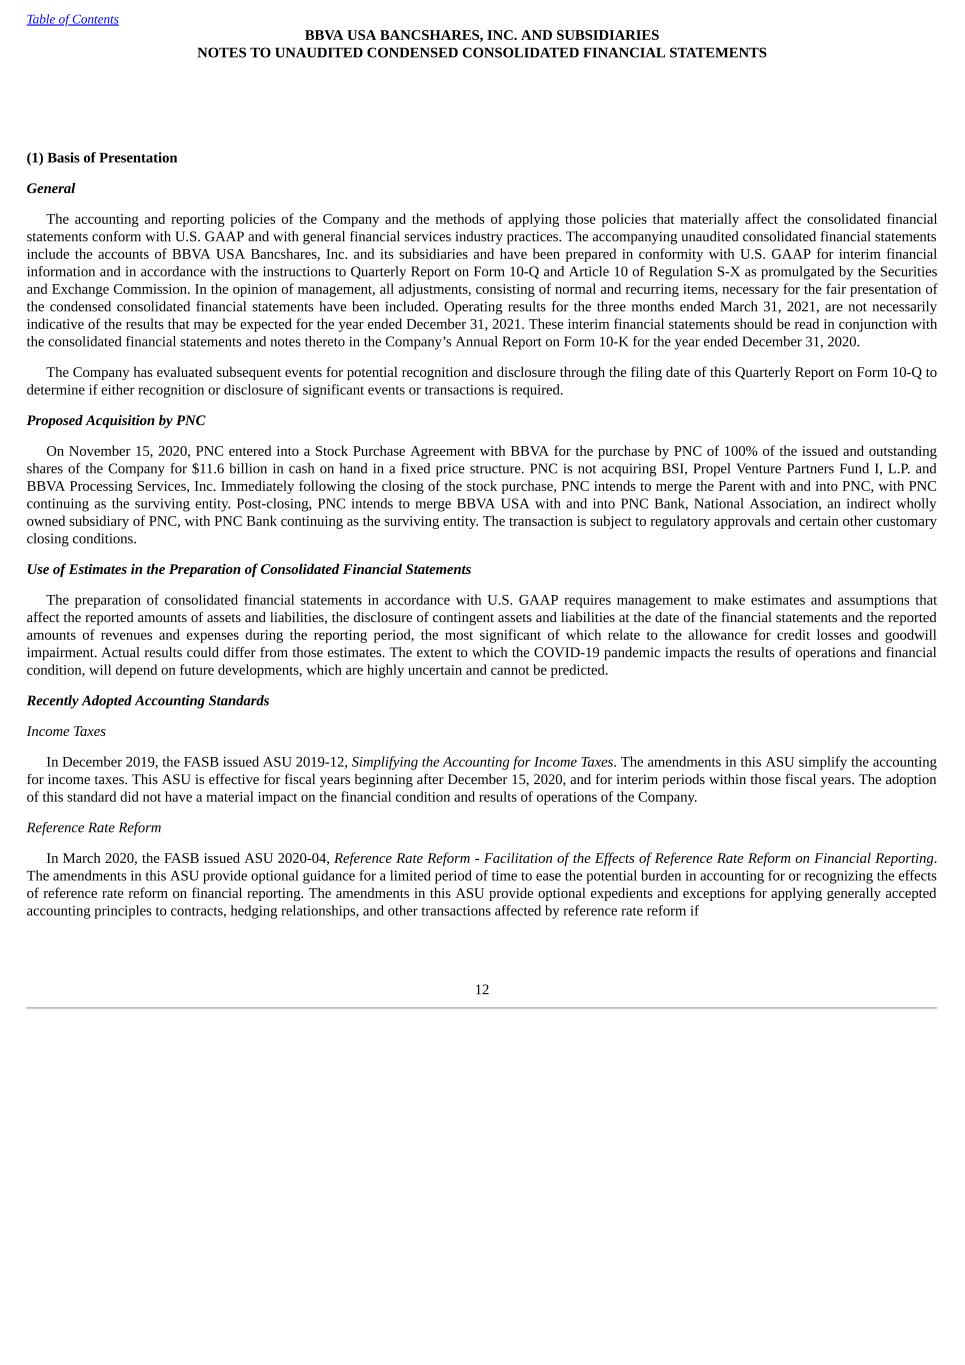
Table of Contents BBVA USA BANCSHARES, INC. AND SUBSIDIARIES NOTES TO UNAUDITED CONDENSED CONSOLIDATED FINANCIAL STATEMENTS (1) Basis of Presentation General The accounting and reporting policies of the Company and the methods of applying those policies that materially affect the consolidated financial statements conform with U.S. GAAP and with general financial services industry practices. The accompanying unaudited consolidated financial statements include the accounts of BBVA USA Bancshares, Inc. and its subsidiaries and have been prepared in conformity with U.S. GAAP for interim financial information and in accordance with the instructions to Quarterly Report on Form 10-Q and Article 10 of Regulation S-X as promulgated by the Securities and Exchange Commission. In the opinion of management, all adjustments, consisting of normal and recurring items, necessary for the fair presentation of the condensed consolidated financial statements have been included. Operating results for the three months ended March 31, 2021, are not necessarily indicative of the results that may be expected for the year ended December 31, 2021. These interim financial statements should be read in conjunction with the consolidated financial statements and notes thereto in the Company’s Annual Report on Form 10-K for the year ended December 31, 2020. The Company has evaluated subsequent events for potential recognition and disclosure through the filing date of this Quarterly Report on Form 10-Q to determine if either recognition or disclosure of significant events or transactions is required. Proposed Acquisition by PNC On November 15, 2020, PNC entered into a Stock Purchase Agreement with BBVA for the purchase by PNC of 100% of the issued and outstanding shares of the Company for $11.6 billion in cash on hand in a fixed price structure. PNC is not acquiring BSI, Propel Venture Partners Fund I, L.P. and BBVA Processing Services, Inc. Immediately following the closing of the stock purchase, PNC intends to merge the Parent with and into PNC, with PNC continuing as the surviving entity. Post-closing, PNC intends to merge BBVA USA with and into PNC Bank, National Association, an indirect wholly owned subsidiary of PNC, with PNC Bank continuing as the surviving entity. The transaction is subject to regulatory approvals and certain other customary closing conditions. Use of Estimates in the Preparation of Consolidated Financial Statements The preparation of consolidated financial statements in accordance with U.S. GAAP requires management to make estimates and assumptions that affect the reported amounts of assets and liabilities, the disclosure of contingent assets and liabilities at the date of the financial statements and the reported amounts of revenues and expenses during the reporting period, the most significant of which relate to the allowance for credit losses and goodwill impairment. Actual results could differ from those estimates. The extent to which the COVID-19 pandemic impacts the results of operations and financial condition, will depend on future developments, which are highly uncertain and cannot be predicted. Recently Adopted Accounting Standards Income Taxes In December 2019, the FASB issued ASU 2019-12, Simplifying the Accounting for Income Taxes. The amendments in this ASU simplify the accounting for income taxes. This ASU is effective for fiscal years beginning after December 15, 2020, and for interim periods within those fiscal years. The adoption of this standard did not have a material impact on the financial condition and results of operations of the Company. Reference Rate Reform In March 2020, the FASB issued ASU 2020-04, Reference Rate Reform - Facilitation of the Effects of Reference Rate Reform on Financial Reporting. The amendments in this ASU provide optional guidance for a limited period of time to ease the potential burden in accounting for or recognizing the effects of reference rate reform on financial reporting. The amendments in this ASU provide optional expedients and exceptions for applying generally accepted accounting principles to contracts, hedging relationships, and other transactions affected by reference rate reform if 12
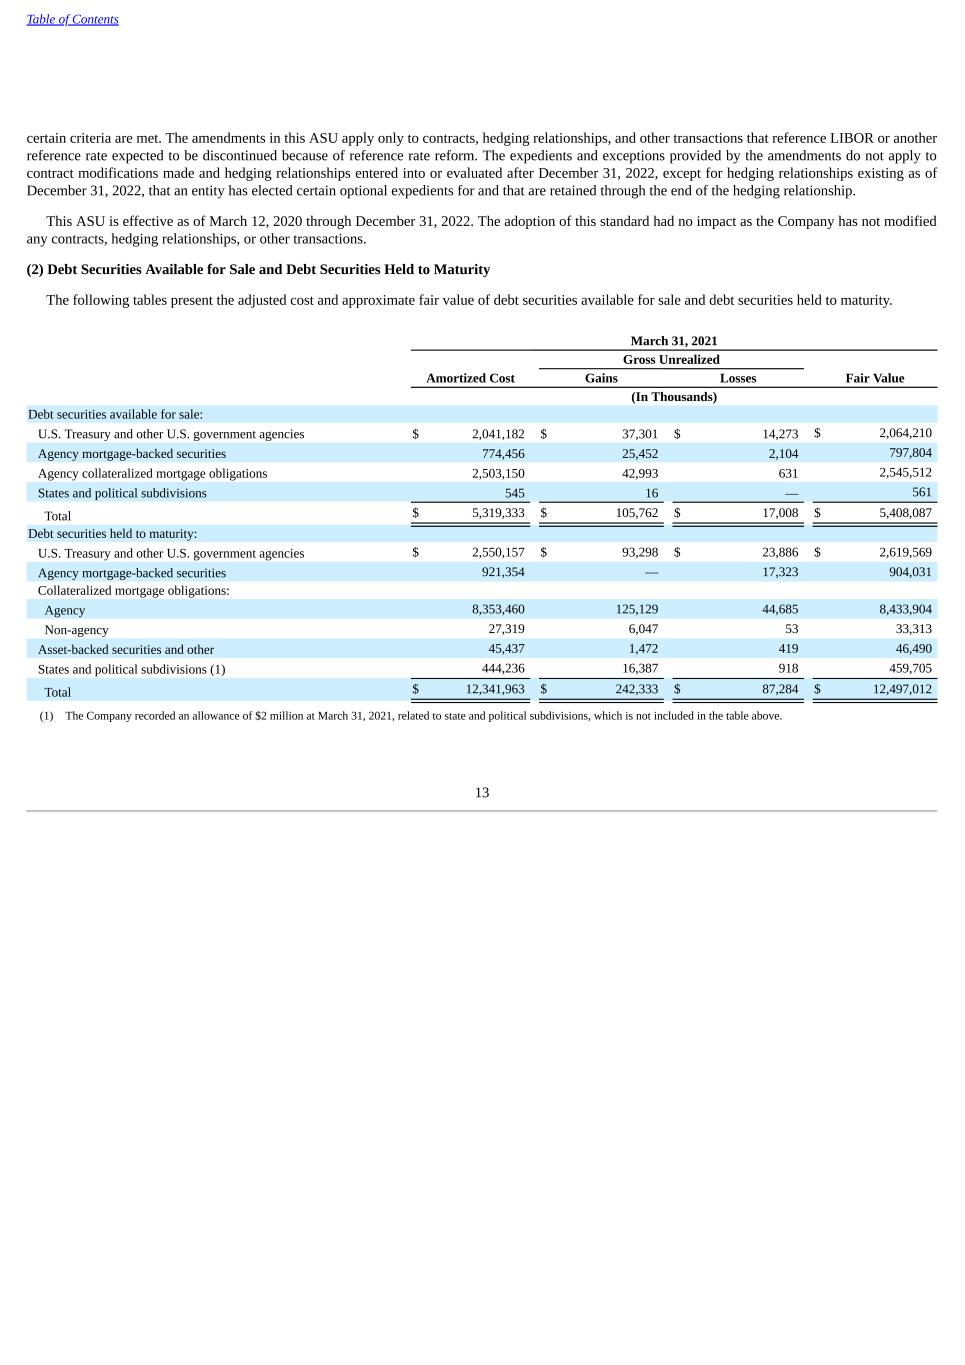
Table of Contents certain criteria are met. The amendments in this ASU apply only to contracts, hedging relationships, and other transactions that reference LIBOR or another reference rate expected to be discontinued because of reference rate reform. The expedients and exceptions provided by the amendments do not apply to contract modifications made and hedging relationships entered into or evaluated after December 31, 2022, except for hedging relationships existing as of December 31, 2022, that an entity has elected certain optional expedients for and that are retained through the end of the hedging relationship. This ASU is effective as of March 12, 2020 through December 31, 2022. The adoption of this standard had no impact as the Company has not modified any contracts, hedging relationships, or other transactions. (2) Debt Securities Available for Sale and Debt Securities Held to Maturity The following tables present the adjusted cost and approximate fair value of debt securities available for sale and debt securities held to maturity. March 31, 2021 Gross Unrealized Amortized Cost Gains Losses Fair Value (In Thousands) Debt securities available for sale: U.S. Treasury and other U.S. government agencies $ 2,041,182 $ 37,301 $ 14,273 $ 2,064,210 Agency mortgage-backed securities 774,456 25,452 2,104 797,804 Agency collateralized mortgage obligations 2,503,150 42,993 631 2,545,512 States and political subdivisions 545 16 — 561 Total $ 5,319,333 $ 105,762 $ 17,008 $ 5,408,087 Debt securities held to maturity: U.S. Treasury and other U.S. government agencies $ 2,550,157 $ 93,298 $ 23,886 $ 2,619,569 Agency mortgage-backed securities 921,354 — 17,323 904,031 Collateralized mortgage obligations: Agency 8,353,460 125,129 44,685 8,433,904 Non-agency 27,319 6,047 53 33,313 Asset-backed securities and other 45,437 1,472 419 46,490 States and political subdivisions (1) 444,236 16,387 918 459,705 Total $ 12,341,963 $ 242,333 $ 87,284 $ 12,497,012 (1) The Company recorded an allowance of $2 million at March 31, 2021, related to state and political subdivisions, which is not included in the table above. 13
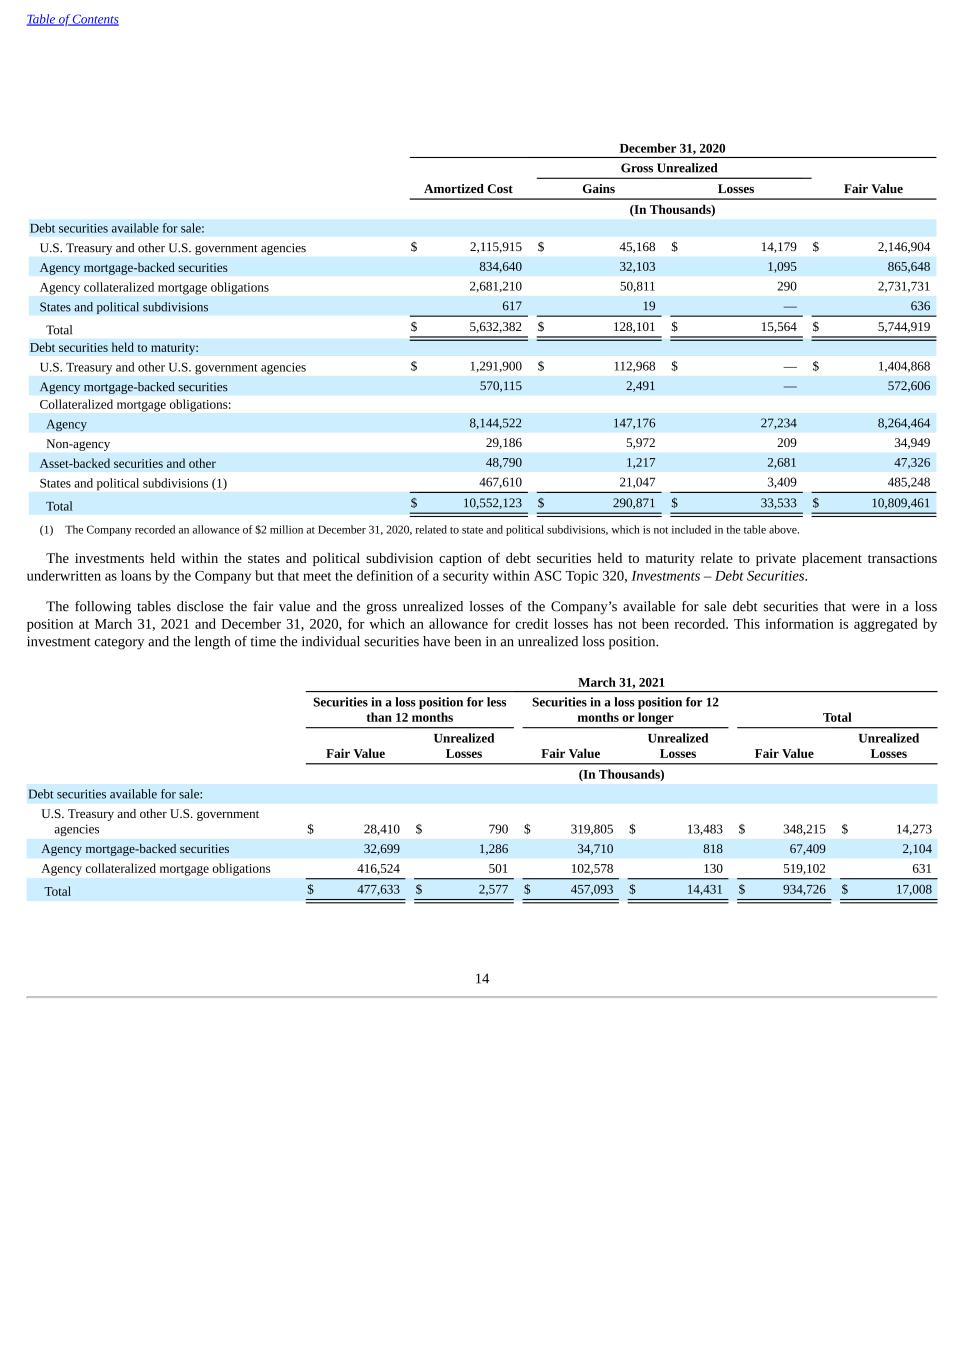
Table of Contents December 31, 2020 Gross Unrealized Amortized Cost Gains Losses Fair Value (In Thousands) Debt securities available for sale: U.S. Treasury and other U.S. government agencies $ 2,115,915 $ 45,168 $ 14,179 $ 2,146,904 Agency mortgage-backed securities 834,640 32,103 1,095 865,648 Agency collateralized mortgage obligations 2,681,210 50,811 290 2,731,731 States and political subdivisions 617 19 — 636 Total $ 5,632,382 $ 128,101 $ 15,564 $ 5,744,919 Debt securities held to maturity: U.S. Treasury and other U.S. government agencies $ 1,291,900 $ 112,968 $ — $ 1,404,868 Agency mortgage-backed securities 570,115 2,491 — 572,606 Collateralized mortgage obligations: Agency 8,144,522 147,176 27,234 8,264,464 Non-agency 29,186 5,972 209 34,949 Asset-backed securities and other 48,790 1,217 2,681 47,326 States and political subdivisions (1) 467,610 21,047 3,409 485,248 Total $ 10,552,123 $ 290,871 $ 33,533 $ 10,809,461 (1) The Company recorded an allowance of $2 million at December 31, 2020, related to state and political subdivisions, which is not included in the table above. The investments held within the states and political subdivision caption of debt securities held to maturity relate to private placement transactions underwritten as loans by the Company but that meet the definition of a security within ASC Topic 320, Investments – Debt Securities. The following tables disclose the fair value and the gross unrealized losses of the Company’s available for sale debt securities that were in a loss position at March 31, 2021 and December 31, 2020, for which an allowance for credit losses has not been recorded. This information is aggregated by investment category and the length of time the individual securities have been in an unrealized loss position. March 31, 2021 Securities in a loss position for less than 12 months Securities in a loss position for 12 months or longer Total Fair Value Unrealized Losses Fair Value Unrealized Losses Fair Value Unrealized Losses (In Thousands) Debt securities available for sale: U.S. Treasury and other U.S. government agencies $ 28,410 $ 790 $ 319,805 $ 13,483 $ 348,215 $ 14,273 Agency mortgage-backed securities 32,699 1,286 34,710 818 67,409 2,104 Agency collateralized mortgage obligations 416,524 501 102,578 130 519,102 631 Total $ 477,633 $ 2,577 $ 457,093 $ 14,431 $ 934,726 $ 17,008 14
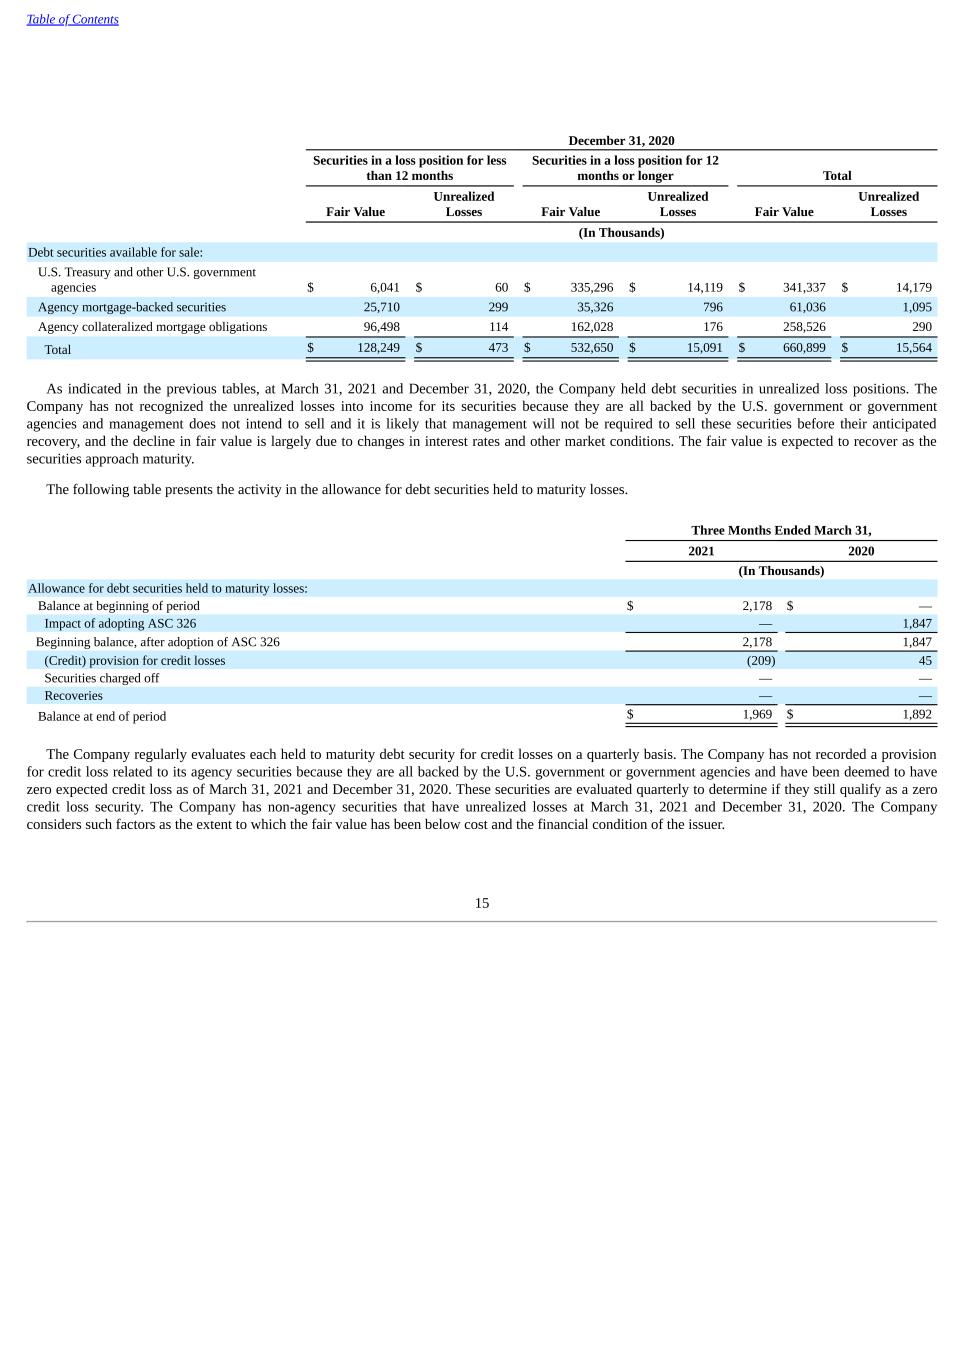
Table of Contents December 31, 2020 Securities in a loss position for less than 12 months Securities in a loss position for 12 months or longer Total Fair Value Unrealized Losses Fair Value Unrealized Losses Fair Value Unrealized Losses (In Thousands) Debt securities available for sale: U.S. Treasury and other U.S. government agencies $ 6,041 $ 60 $ 335,296 $ 14,119 $ 341,337 $ 14,179 Agency mortgage-backed securities 25,710 299 35,326 796 61,036 1,095 Agency collateralized mortgage obligations 96,498 114 162,028 176 258,526 290 Total $ 128,249 $ 473 $ 532,650 $ 15,091 $ 660,899 $ 15,564 As indicated in the previous tables, at March 31, 2021 and December 31, 2020, the Company held debt securities in unrealized loss positions. The Company has not recognized the unrealized losses into income for its securities because they are all backed by the U.S. government or government agencies and management does not intend to sell and it is likely that management will not be required to sell these securities before their anticipated recovery, and the decline in fair value is largely due to changes in interest rates and other market conditions. The fair value is expected to recover as the securities approach maturity. The following table presents the activity in the allowance for debt securities held to maturity losses. Three Months Ended March 31, 2021 2020 (In Thousands) Allowance for debt securities held to maturity losses: Balance at beginning of period $ 2,178 $ — Impact of adopting ASC 326 — 1,847 Beginning balance, after adoption of ASC 326 2,178 1,847 (Credit) provision for credit losses (209) 45 Securities charged off — — Recoveries — — Balance at end of period $ 1,969 $ 1,892 The Company regularly evaluates each held to maturity debt security for credit losses on a quarterly basis. The Company has not recorded a provision for credit loss related to its agency securities because they are all backed by the U.S. government or government agencies and have been deemed to have zero expected credit loss as of March 31, 2021 and December 31, 2020. These securities are evaluated quarterly to determine if they still qualify as a zero credit loss security. The Company has non-agency securities that have unrealized losses at March 31, 2021 and December 31, 2020. The Company considers such factors as the extent to which the fair value has been below cost and the financial condition of the issuer. 15

Table of Contents The Company monitors the credit quality of its HTM debt securities through credit ratings. The following tables present the amortized cost of HTM debt securities, aggregated by credit quality indicator. March 31, 2021 Range of Ratings AAA AA+ / A - BBB+ / B- CCC+ / C D NR Total (In Thousands) Debt securities held to maturity: U.S. Treasury and other U.S. government agencies $ 2,550,157 $ — $ — $ — $ — $ — $ 2,550,157 Agency mortgage-backed securities 921,354 — — — — — 921,354 Collateralized mortgage obligations: Agency 8,353,460 — — — — — 8,353,460 Non-agency 224 6,357 9,770 3,144 771 7,053 27,319 Asset-backed securities and other — 44,870 183 384 — — 45,437 States and political subdivisions (1) — 236,151 208,085 — — — 444,236 $ 11,825,195 $ 287,378 $ 218,038 $ 3,528 $ 771 $ 7,053 $ 12,341,963 (1) The Company recorded an allowance of $2 million at March 31, 2021, related to state and political subdivisions, which is not included in the table above. December 31, 2020 Range of Ratings AAA AA+ / A - BBB+ / B- CCC+ / C D NR Total (In Thousands) Debt securities held to maturity: U.S. Treasury and other U.S. government agencies $ 1,291,900 $ — $ — $ — $ — $ — $ 1,291,900 Agency mortgage-backed securities 570,115 — — — — — 570,115 Collateralized mortgage obligations: Agency 8,144,522 — — — — — 8,144,522 Non-agency 278 6,840 10,517 5,462 2,533 3,556 29,186 Asset-backed securities and other — 48,127 200 463 — — 48,790 States and political subdivisions (1) — 246,210 221,400 — — — 467,610 $ 10,006,815 $ 301,177 $ 232,117 $ 5,925 $ 2,533 $ 3,556 $ 10,552,123 (1) The Company recorded an allowance of $2 million at December 31, 2020, related to state and political subdivisions, which is not included in the table above. 16
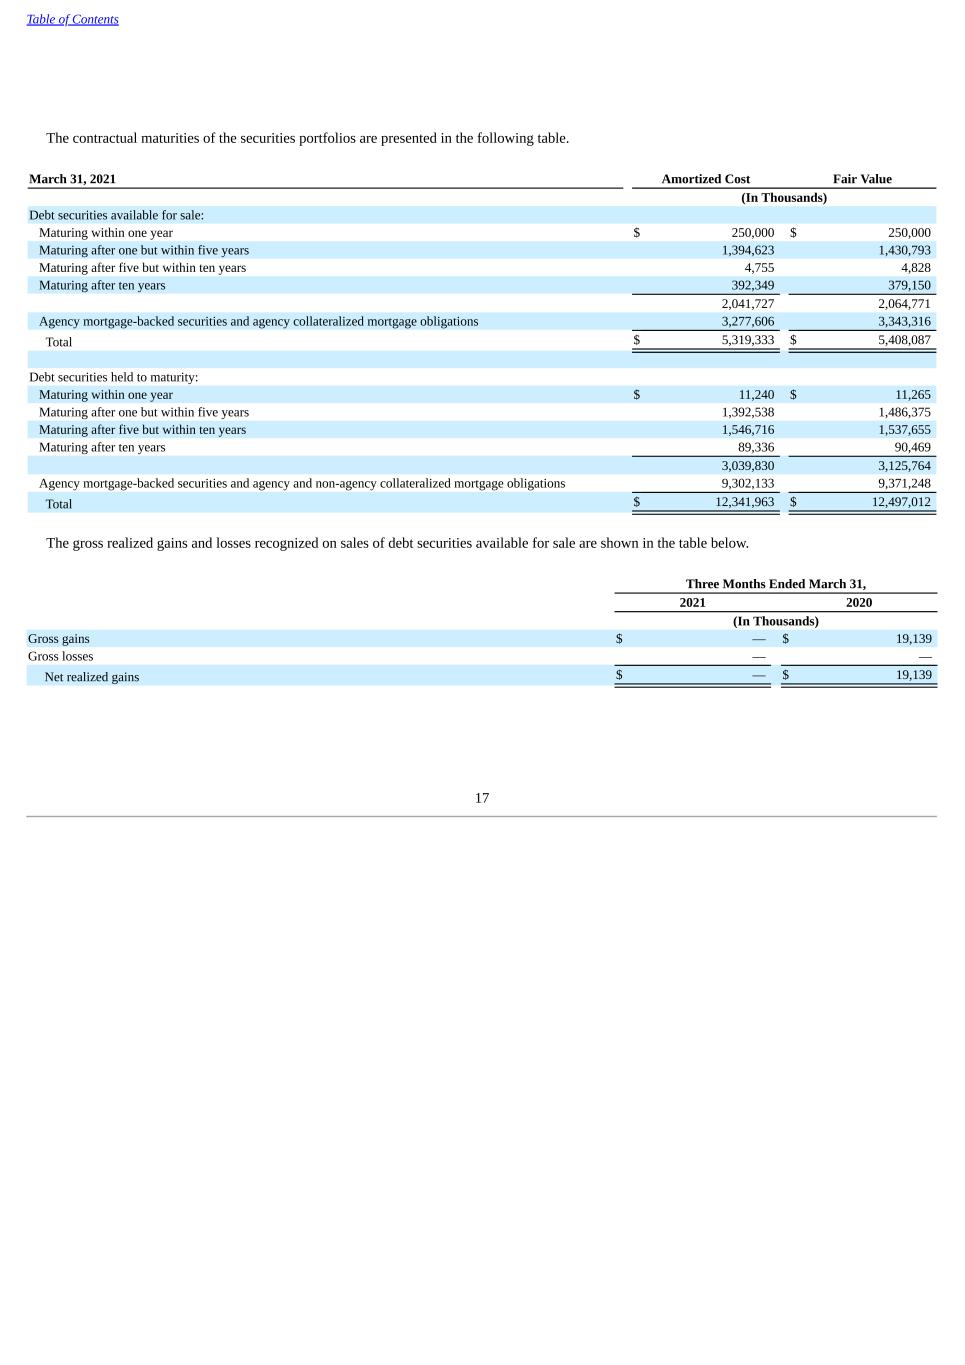
Table of Contents The contractual maturities of the securities portfolios are presented in the following table. March 31, 2021 Amortized Cost Fair Value (In Thousands) Debt securities available for sale: Maturing within one year $ 250,000 $ 250,000 Maturing after one but within five years 1,394,623 1,430,793 Maturing after five but within ten years 4,755 4,828 Maturing after ten years 392,349 379,150 2,041,727 2,064,771 Agency mortgage-backed securities and agency collateralized mortgage obligations 3,277,606 3,343,316 Total $ 5,319,333 $ 5,408,087 Debt securities held to maturity: Maturing within one year $ 11,240 $ 11,265 Maturing after one but within five years 1,392,538 1,486,375 Maturing after five but within ten years 1,546,716 1,537,655 Maturing after ten years 89,336 90,469 3,039,830 3,125,764 Agency mortgage-backed securities and agency and non-agency collateralized mortgage obligations 9,302,133 9,371,248 Total $ 12,341,963 $ 12,497,012 The gross realized gains and losses recognized on sales of debt securities available for sale are shown in the table below. Three Months Ended March 31, 2021 2020 (In Thousands) Gross gains $ — $ 19,139 Gross losses — — Net realized gains $ — $ 19,139 17
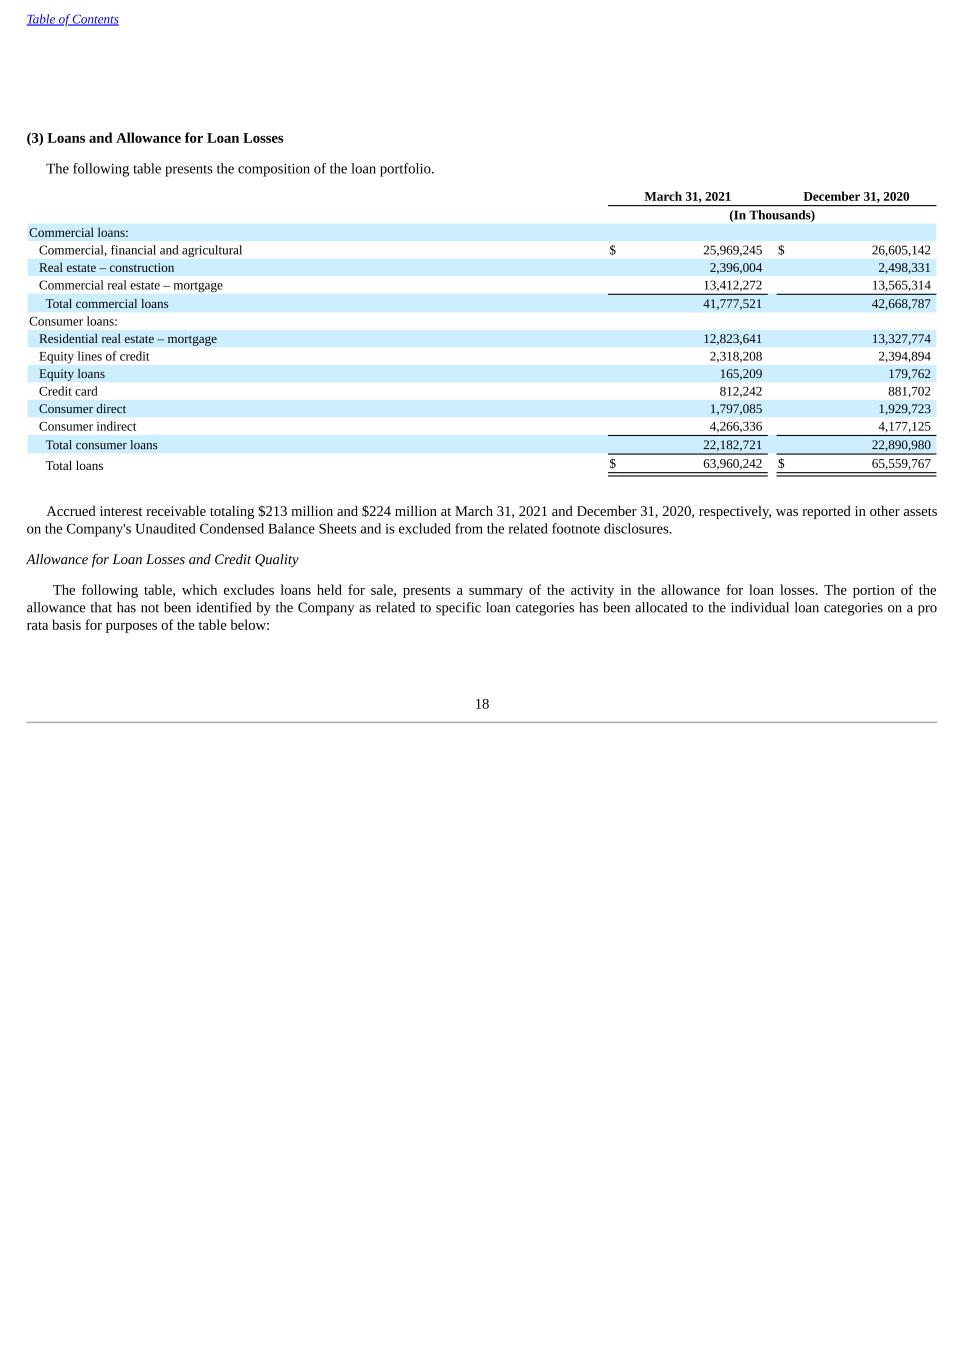
Table of Contents (3) Loans and Allowance for Loan Losses The following table presents the composition of the loan portfolio. March 31, 2021 December 31, 2020 (In Thousands) Commercial loans: Commercial, financial and agricultural $ 25,969,245 $ 26,605,142 Real estate – construction 2,396,004 2,498,331 Commercial real estate – mortgage 13,412,272 13,565,314 Total commercial loans 41,777,521 42,668,787 Consumer loans: Residential real estate – mortgage 12,823,641 13,327,774 Equity lines of credit 2,318,208 2,394,894 Equity loans 165,209 179,762 Credit card 812,242 881,702 Consumer direct 1,797,085 1,929,723 Consumer indirect 4,266,336 4,177,125 Total consumer loans 22,182,721 22,890,980 Total loans $ 63,960,242 $ 65,559,767 Accrued interest receivable totaling $213 million and $224 million at March 31, 2021 and December 31, 2020, respectively, was reported in other assets on the Company's Unaudited Condensed Balance Sheets and is excluded from the related footnote disclosures. Allowance for Loan Losses and Credit Quality The following table, which excludes loans held for sale, presents a summary of the activity in the allowance for loan losses. The portion of the allowance that has not been identified by the Company as related to specific loan categories has been allocated to the individual loan categories on a pro rata basis for purposes of the table below: 18
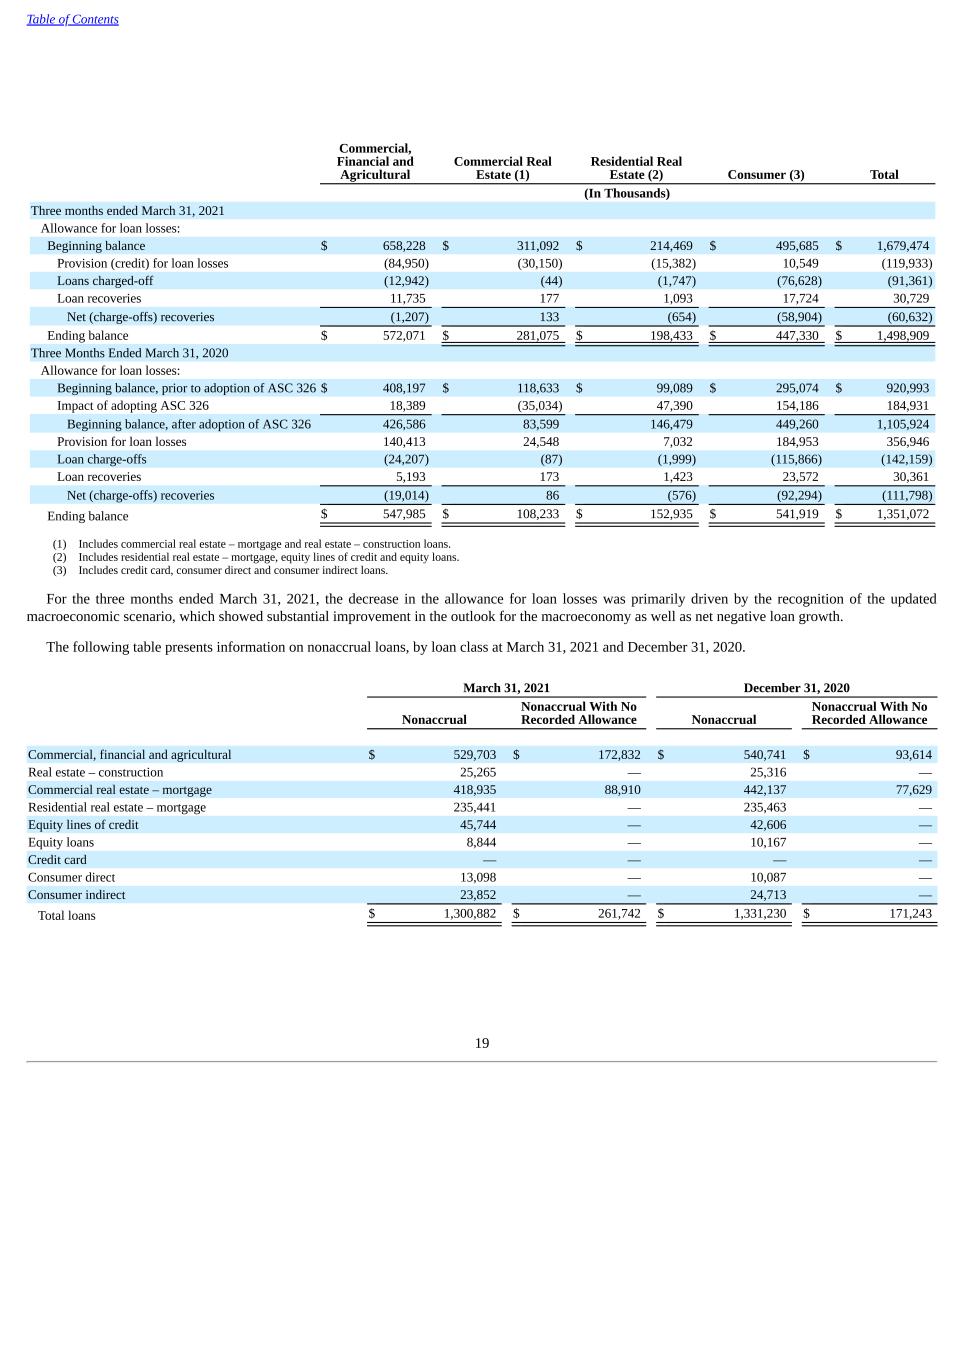
Table of Contents Commercial, Financial and Agricultural Commercial Real Estate (1) Residential Real Estate (2) Consumer (3) Total (In Thousands) Three months ended March 31, 2021 Allowance for loan losses: Beginning balance $ 658,228 $ 311,092 $ 214,469 $ 495,685 $ 1,679,474 Provision (credit) for loan losses (84,950) (30,150) (15,382) 10,549 (119,933) Loans charged-off (12,942) (44) (1,747) (76,628) (91,361) Loan recoveries 11,735 177 1,093 17,724 30,729 Net (charge-offs) recoveries (1,207) 133 (654) (58,904) (60,632) Ending balance $ 572,071 $ 281,075 $ 198,433 $ 447,330 $ 1,498,909 Three Months Ended March 31, 2020 Allowance for loan losses: Beginning balance, prior to adoption of ASC 326 $ 408,197 $ 118,633 $ 99,089 $ 295,074 $ 920,993 Impact of adopting ASC 326 18,389 (35,034) 47,390 154,186 184,931 Beginning balance, after adoption of ASC 326 426,586 83,599 146,479 449,260 1,105,924 Provision for loan losses 140,413 24,548 7,032 184,953 356,946 Loan charge-offs (24,207) (87) (1,999) (115,866) (142,159) Loan recoveries 5,193 173 1,423 23,572 30,361 Net (charge-offs) recoveries (19,014) 86 (576) (92,294) (111,798) Ending balance $ 547,985 $ 108,233 $ 152,935 $ 541,919 $ 1,351,072 (1) Includes commercial real estate – mortgage and real estate – construction loans. (2) Includes residential real estate – mortgage, equity lines of credit and equity loans. (3) Includes credit card, consumer direct and consumer indirect loans. For the three months ended March 31, 2021, the decrease in the allowance for loan losses was primarily driven by the recognition of the updated macroeconomic scenario, which showed substantial improvement in the outlook for the macroeconomy as well as net negative loan growth. The following table presents information on nonaccrual loans, by loan class at March 31, 2021 and December 31, 2020. March 31, 2021 December 31, 2020 Nonaccrual Nonaccrual With No Recorded Allowance Nonaccrual Nonaccrual With No Recorded Allowance Commercial, financial and agricultural $ 529,703 $ 172,832 $ 540,741 $ 93,614 Real estate – construction 25,265 — 25,316 — Commercial real estate – mortgage 418,935 88,910 442,137 77,629 Residential real estate – mortgage 235,441 — 235,463 — Equity lines of credit 45,744 — 42,606 — Equity loans 8,844 — 10,167 — Credit card — — — — Consumer direct 13,098 — 10,087 — Consumer indirect 23,852 — 24,713 — Total loans $ 1,300,882 $ 261,742 $ 1,331,230 $ 171,243 19
Table of Contents The Company monitors the credit quality of its commercial portfolio using an internal dual risk rating, which considers both the obligor and the facility. The obligor risk ratings are defined by ranges of default probabilities of the borrowers, through internally assigned letter grades (AAA through D2) and the facility risk ratings are defined by ranges of the loss given default. The combination of those two approaches results in the assessment of the likelihood of loss and it is mapped to the regulatory classifications. The Company assigns internal risk ratings at loan origination and at regular intervals subsequent to origination. Loan review intervals are dependent on the size and risk grade of the loan, and are generally conducted at least annually. Additional reviews are conducted when information affecting the loan’s risk grade becomes available. The general characteristics of the risk grades are as follows: • The Company’s internally assigned letter grades “AAA” through “B-” correspond to the regulatory classification “Pass.” These loans do not have any identified potential or well-defined weaknesses and have a high likelihood of orderly repayment. Exceptions exist when either the facility is fully secured by a CD and held at the Company or the facility is secured by properly margined and controlled marketable securities. • Internally assigned letter grades “CCC+” through “CCC” correspond to the regulatory classification “Special Mention.” Loans within this classification have potential weaknesses that deserve management’s close attention. If left uncorrected, these potential weaknesses may result in deterioration of the repayment prospects for the loan or in the institution’s credit position at some future date. Special mention loans are not adversely classified and do not expose an institution to sufficient risk to warrant adverse classification. • Internally assigned letter grades “CCC-” through “D1” correspond to the regulatory classification “Substandard.” A loan classified as substandard is inadequately protected by the current sound worth and paying capacity of the obligor or of the collateral pledged, if any. Substandard loans have a well-defined weakness or weaknesses that jeopardize the liquidation of the loan. They are characterized by the distinct possibility that the Company will sustain some loss if the deficiencies are not corrected. • The internally assigned letter grade “D2” corresponds to the regulatory classification “Doubtful.” Loans classified as doubtful have all the weaknesses inherent in a loan classified as substandard with the added characteristic that the weaknesses make collection or liquidation in full, on the basis of currently existing facts, conditions, and values, highly questionable or improbable. The Company considers payment history as the best indicator of credit quality for the consumer portfolio. Nonperforming loans in the tables below include loans classified as nonaccrual, loans 90 days or more past due and loans modified in a TDR 90 days or more past due. 20
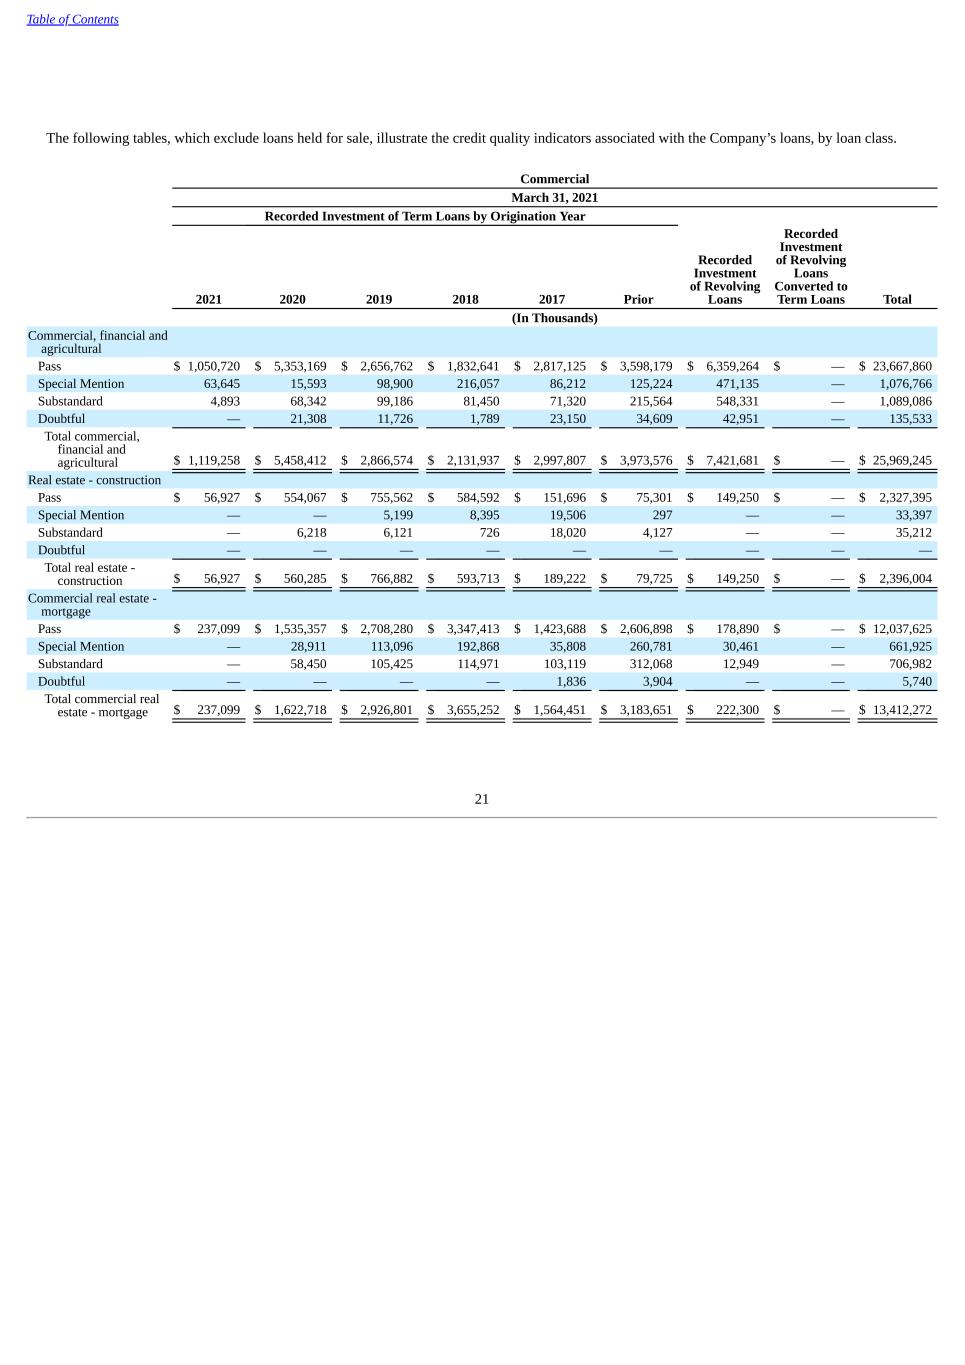
Table of Contents The following tables, which exclude loans held for sale, illustrate the credit quality indicators associated with the Company’s loans, by loan class. Commercial March 31, 2021 Recorded Investment of Term Loans by Origination Year 2021 2020 2019 2018 2017 Prior Recorded Investment of Revolving Loans Recorded Investment of Revolving Loans Converted to Term Loans Total (In Thousands) Commercial, financial and agricultural Pass $ 1,050,720 $ 5,353,169 $ 2,656,762 $ 1,832,641 $ 2,817,125 $ 3,598,179 $ 6,359,264 $ — $ 23,667,860 Special Mention 63,645 15,593 98,900 216,057 86,212 125,224 471,135 — 1,076,766 Substandard 4,893 68,342 99,186 81,450 71,320 215,564 548,331 — 1,089,086 Doubtful — 21,308 11,726 1,789 23,150 34,609 42,951 — 135,533 Total commercial, financial and agricultural $ 1,119,258 $ 5,458,412 $ 2,866,574 $ 2,131,937 $ 2,997,807 $ 3,973,576 $ 7,421,681 $ — $ 25,969,245 Real estate - construction Pass $ 56,927 $ 554,067 $ 755,562 $ 584,592 $ 151,696 $ 75,301 $ 149,250 $ — $ 2,327,395 Special Mention — — 5,199 8,395 19,506 297 — — 33,397 Substandard — 6,218 6,121 726 18,020 4,127 — — 35,212 Doubtful — — — — — — — — — Total real estate - construction $ 56,927 $ 560,285 $ 766,882 $ 593,713 $ 189,222 $ 79,725 $ 149,250 $ — $ 2,396,004 Commercial real estate - mortgage Pass $ 237,099 $ 1,535,357 $ 2,708,280 $ 3,347,413 $ 1,423,688 $ 2,606,898 $ 178,890 $ — $ 12,037,625 Special Mention — 28,911 113,096 192,868 35,808 260,781 30,461 — 661,925 Substandard — 58,450 105,425 114,971 103,119 312,068 12,949 — 706,982 Doubtful — — — — 1,836 3,904 — — 5,740 Total commercial real estate - mortgage $ 237,099 $ 1,622,718 $ 2,926,801 $ 3,655,252 $ 1,564,451 $ 3,183,651 $ 222,300 $ — $ 13,412,272 21
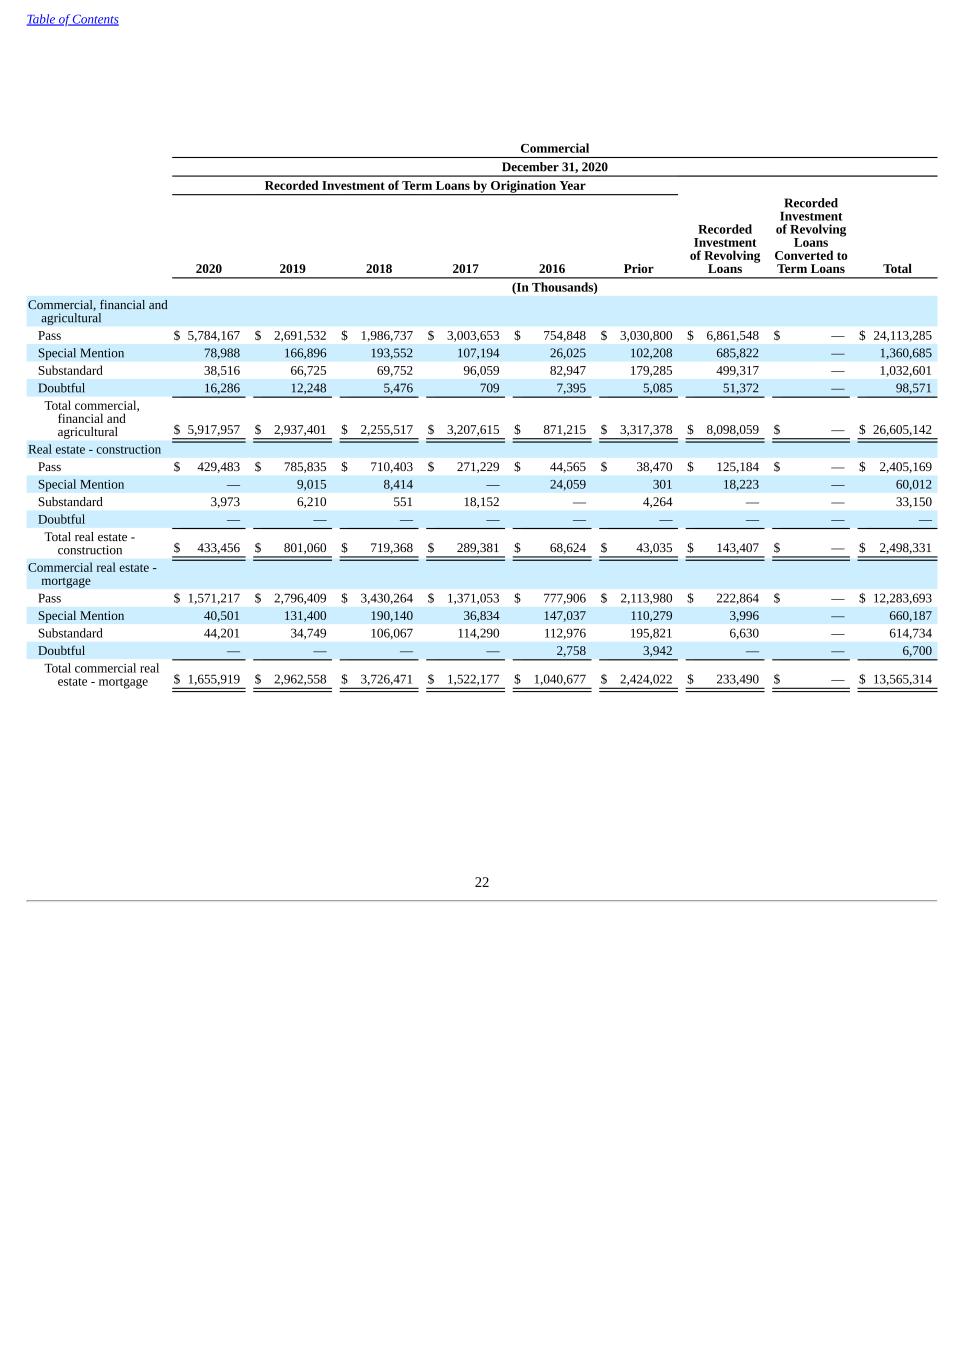
Table of Contents Commercial December 31, 2020 Recorded Investment of Term Loans by Origination Year 2020 2019 2018 2017 2016 Prior Recorded Investment of Revolving Loans Recorded Investment of Revolving Loans Converted to Term Loans Total (In Thousands) Commercial, financial and agricultural Pass $ 5,784,167 $ 2,691,532 $ 1,986,737 $ 3,003,653 $ 754,848 $ 3,030,800 $ 6,861,548 $ — $ 24,113,285 Special Mention 78,988 166,896 193,552 107,194 26,025 102,208 685,822 — 1,360,685 Substandard 38,516 66,725 69,752 96,059 82,947 179,285 499,317 — 1,032,601 Doubtful 16,286 12,248 5,476 709 7,395 5,085 51,372 — 98,571 Total commercial, financial and agricultural $ 5,917,957 $ 2,937,401 $ 2,255,517 $ 3,207,615 $ 871,215 $ 3,317,378 $ 8,098,059 $ — $ 26,605,142 Real estate - construction Pass $ 429,483 $ 785,835 $ 710,403 $ 271,229 $ 44,565 $ 38,470 $ 125,184 $ — $ 2,405,169 Special Mention — 9,015 8,414 — 24,059 301 18,223 — 60,012 Substandard 3,973 6,210 551 18,152 — 4,264 — — 33,150 Doubtful — — — — — — — — — Total real estate - construction $ 433,456 $ 801,060 $ 719,368 $ 289,381 $ 68,624 $ 43,035 $ 143,407 $ — $ 2,498,331 Commercial real estate - mortgage Pass $ 1,571,217 $ 2,796,409 $ 3,430,264 $ 1,371,053 $ 777,906 $ 2,113,980 $ 222,864 $ — $ 12,283,693 Special Mention 40,501 131,400 190,140 36,834 147,037 110,279 3,996 — 660,187 Substandard 44,201 34,749 106,067 114,290 112,976 195,821 6,630 — 614,734 Doubtful — — — — 2,758 3,942 — — 6,700 Total commercial real estate - mortgage $ 1,655,919 $ 2,962,558 $ 3,726,471 $ 1,522,177 $ 1,040,677 $ 2,424,022 $ 233,490 $ — $ 13,565,314 22
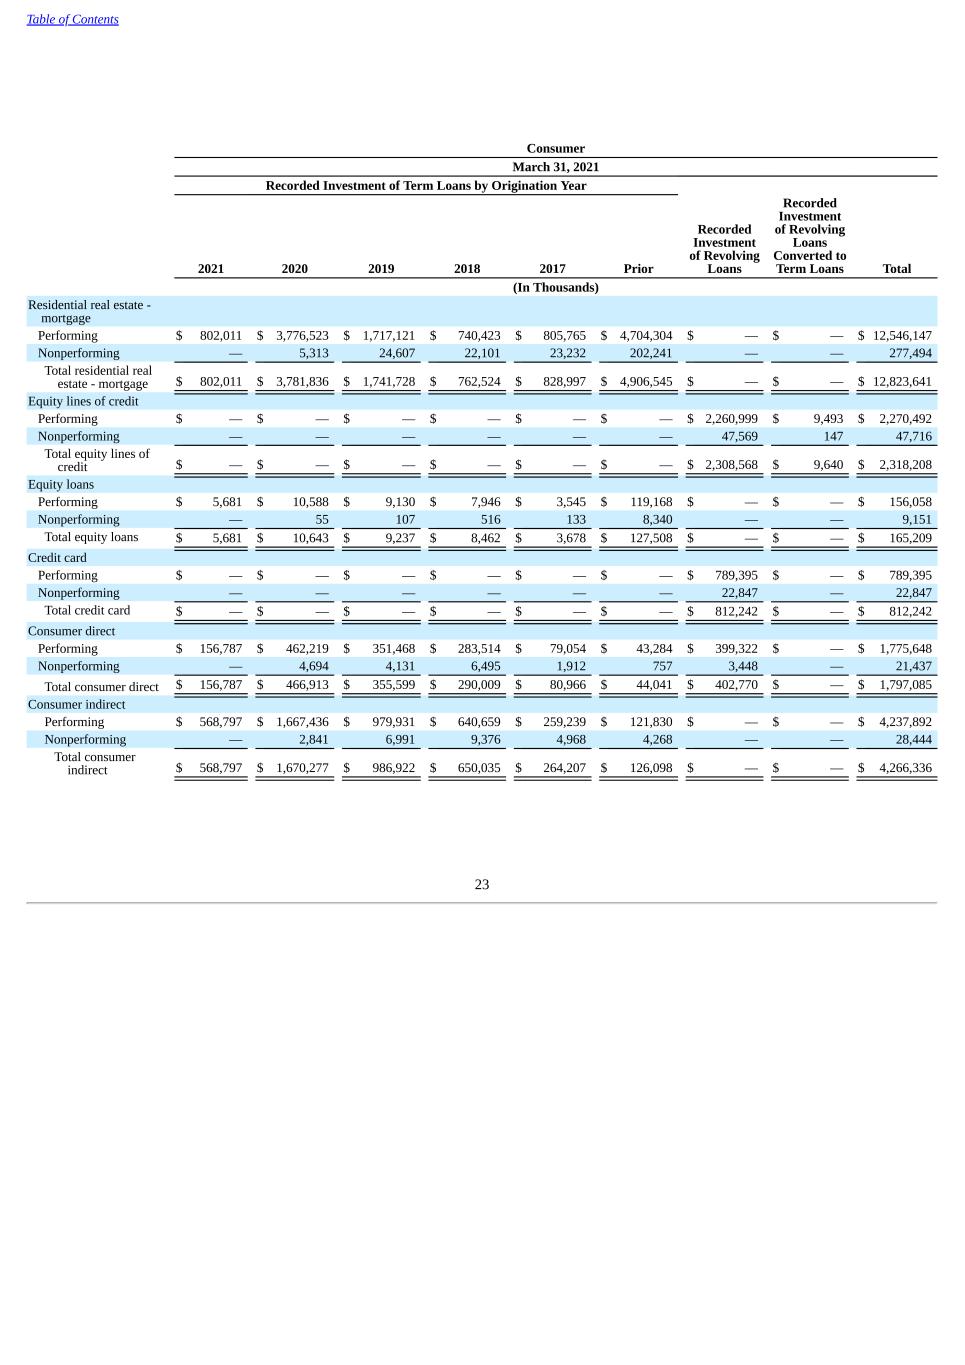
Table of Contents Consumer March 31, 2021 Recorded Investment of Term Loans by Origination Year 2021 2020 2019 2018 2017 Prior Recorded Investment of Revolving Loans Recorded Investment of Revolving Loans Converted to Term Loans Total (In Thousands) Residential real estate - mortgage Performing $ 802,011 $ 3,776,523 $ 1,717,121 $ 740,423 $ 805,765 $ 4,704,304 $ — $ — $ 12,546,147 Nonperforming — 5,313 24,607 22,101 23,232 202,241 — — 277,494 Total residential real estate - mortgage $ 802,011 $ 3,781,836 $ 1,741,728 $ 762,524 $ 828,997 $ 4,906,545 $ — $ — $ 12,823,641 Equity lines of credit Performing $ — $ — $ — $ — $ — $ — $ 2,260,999 $ 9,493 $ 2,270,492 Nonperforming — — — — — — 47,569 147 47,716 Total equity lines of credit $ — $ — $ — $ — $ — $ — $ 2,308,568 $ 9,640 $ 2,318,208 Equity loans Performing $ 5,681 $ 10,588 $ 9,130 $ 7,946 $ 3,545 $ 119,168 $ — $ — $ 156,058 Nonperforming — 55 107 516 133 8,340 — — 9,151 Total equity loans $ 5,681 $ 10,643 $ 9,237 $ 8,462 $ 3,678 $ 127,508 $ — $ — $ 165,209 Credit card Performing $ — $ — $ — $ — $ — $ — $ 789,395 $ — $ 789,395 Nonperforming — — — — — — 22,847 — 22,847 Total credit card $ — $ — $ — $ — $ — $ — $ 812,242 $ — $ 812,242 Consumer direct Performing $ 156,787 $ 462,219 $ 351,468 $ 283,514 $ 79,054 $ 43,284 $ 399,322 $ — $ 1,775,648 Nonperforming — 4,694 4,131 6,495 1,912 757 3,448 — 21,437 Total consumer direct $ 156,787 $ 466,913 $ 355,599 $ 290,009 $ 80,966 $ 44,041 $ 402,770 $ — $ 1,797,085 Consumer indirect Performing $ 568,797 $ 1,667,436 $ 979,931 $ 640,659 $ 259,239 $ 121,830 $ — $ — $ 4,237,892 Nonperforming — 2,841 6,991 9,376 4,968 4,268 — — 28,444 Total consumer indirect $ 568,797 $ 1,670,277 $ 986,922 $ 650,035 $ 264,207 $ 126,098 $ — $ — $ 4,266,336 23
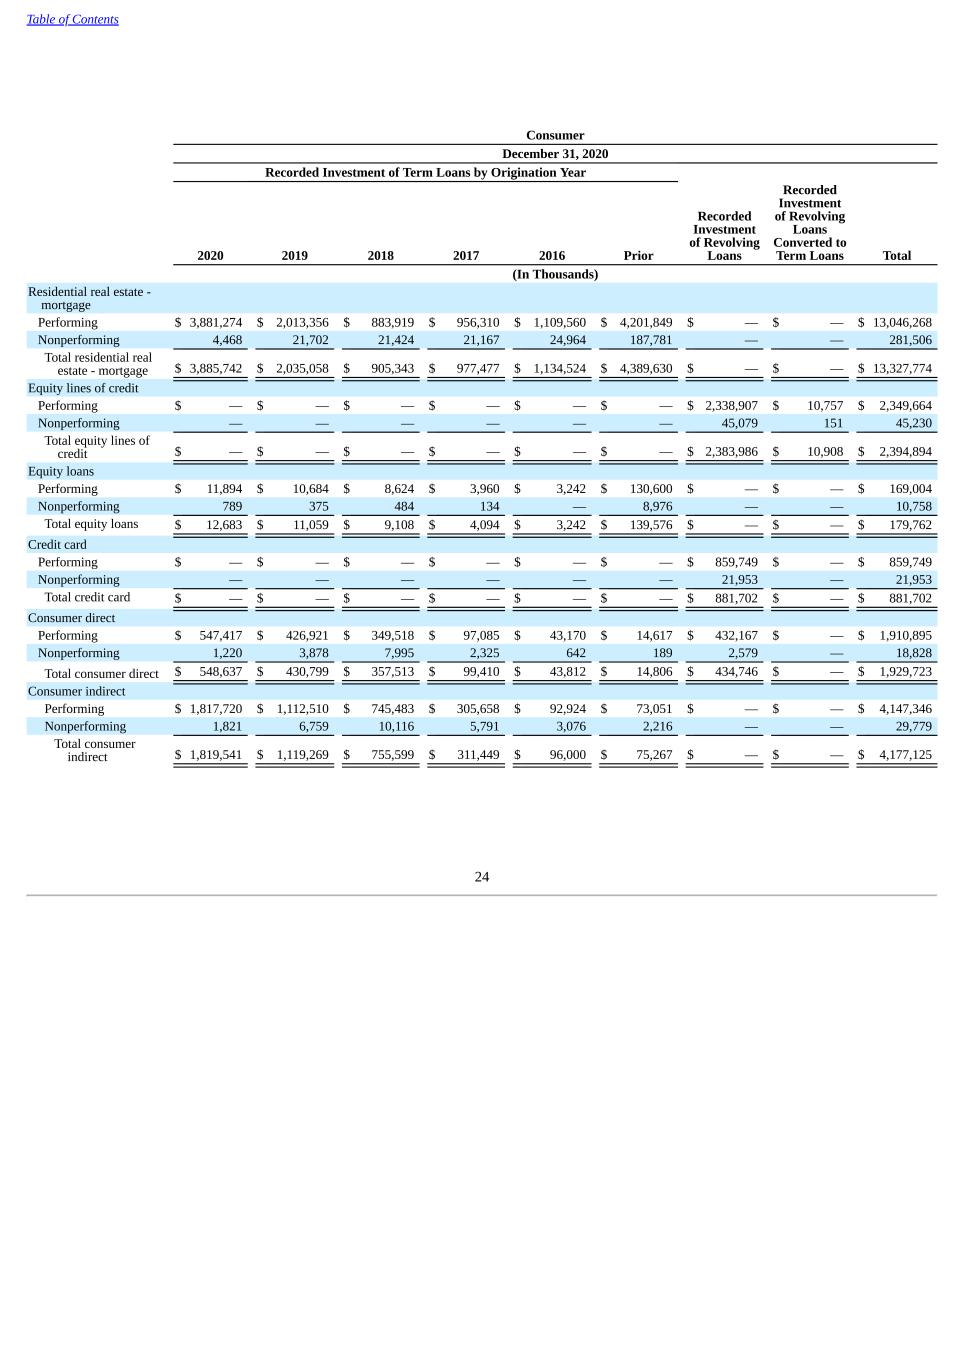
Table of Contents Consumer December 31, 2020 Recorded Investment of Term Loans by Origination Year 2020 2019 2018 2017 2016 Prior Recorded Investment of Revolving Loans Recorded Investment of Revolving Loans Converted to Term Loans Total (In Thousands) Residential real estate - mortgage Performing $ 3,881,274 $ 2,013,356 $ 883,919 $ 956,310 $ 1,109,560 $ 4,201,849 $ — $ — $ 13,046,268 Nonperforming 4,468 21,702 21,424 21,167 24,964 187,781 — — 281,506 Total residential real estate - mortgage $ 3,885,742 $ 2,035,058 $ 905,343 $ 977,477 $ 1,134,524 $ 4,389,630 $ — $ — $ 13,327,774 Equity lines of credit Performing $ — $ — $ — $ — $ — $ — $ 2,338,907 $ 10,757 $ 2,349,664 Nonperforming — — — — — — 45,079 151 45,230 Total equity lines of credit $ — $ — $ — $ — $ — $ — $ 2,383,986 $ 10,908 $ 2,394,894 Equity loans Performing $ 11,894 $ 10,684 $ 8,624 $ 3,960 $ 3,242 $ 130,600 $ — $ — $ 169,004 Nonperforming 789 375 484 134 — 8,976 — — 10,758 Total equity loans $ 12,683 $ 11,059 $ 9,108 $ 4,094 $ 3,242 $ 139,576 $ — $ — $ 179,762 Credit card Performing $ — $ — $ — $ — $ — $ — $ 859,749 $ — $ 859,749 Nonperforming — — — — — — 21,953 — 21,953 Total credit card $ — $ — $ — $ — $ — $ — $ 881,702 $ — $ 881,702 Consumer direct Performing $ 547,417 $ 426,921 $ 349,518 $ 97,085 $ 43,170 $ 14,617 $ 432,167 $ — $ 1,910,895 Nonperforming 1,220 3,878 7,995 2,325 642 189 2,579 — 18,828 Total consumer direct $ 548,637 $ 430,799 $ 357,513 $ 99,410 $ 43,812 $ 14,806 $ 434,746 $ — $ 1,929,723 Consumer indirect Performing $ 1,817,720 $ 1,112,510 $ 745,483 $ 305,658 $ 92,924 $ 73,051 $ — $ — $ 4,147,346 Nonperforming 1,821 6,759 10,116 5,791 3,076 2,216 — — 29,779 Total consumer indirect $ 1,819,541 $ 1,119,269 $ 755,599 $ 311,449 $ 96,000 $ 75,267 $ — $ — $ 4,177,125 24

Table of Contents The following tables present an aging analysis of the Company’s past due loans, excluding loans classified as held for sale. March 31, 2021 30-59 Days Past Due 60-89 Days Past Due 90 Days or More Past Due Nonaccrual Accruing TDRs Total Past Due, Nonaccrual or TDR Not Past Due, Nonaccrual or TDR Total (In Thousands) Commercial, financial and agricultural $ 17,433 $ 19,078 $ 12,609 $ 529,703 $ 77,466 $ 656,289 $ 25,312,956 $ 25,969,245 Real estate – construction 2,538 — 532 25,265 142 28,477 2,367,527 2,396,004 Commercial real estate – mortgage 703 253 7,790 418,935 26,746 454,427 12,957,845 13,412,272 Residential real estate – mortgage 40,315 19,696 41,590 235,441 53,568 390,610 12,433,031 12,823,641 Equity lines of credit 8,325 2,642 1,972 45,744 — 58,683 2,259,525 2,318,208 Equity loans 665 223 134 8,844 19,326 29,192 136,017 165,209 Credit card 8,378 6,442 22,847 — — 37,667 774,575 812,242 Consumer direct 17,028 9,438 8,339 13,098 23,041 70,944 1,726,141 1,797,085 Consumer indirect 30,024 8,513 4,592 23,852 — 66,981 4,199,355 4,266,336 Total loans $ 125,409 $ 66,285 $ 100,405 $ 1,300,882 $ 200,289 $ 1,793,270 $ 62,166,972 $ 63,960,242 December 31, 2020 30-59 Days Past Due 60-89 Days Past Due 90 Days or More Past Due Nonaccrual Accruing TDRs Total Past Due, Nonaccrual or TDR Not Past Due, Nonaccrual or TDR Total (In Thousands) Commercial, financial and agricultural $ 15,862 $ 22,569 $ 35,472 $ 540,741 $ 17,686 $ 632,330 $ 25,972,812 $ 26,605,142 Real estate – construction 3,595 174 532 25,316 145 29,762 2,468,569 2,498,331 Commercial real estate – mortgage 2,113 2,004 1,104 442,137 910 448,268 13,117,046 13,565,314 Residential real estate – mortgage 49,445 20,694 45,761 235,463 53,380 404,743 12,923,031 13,327,774 Equity lines of credit 11,108 4,305 2,624 42,606 — 60,643 2,334,251 2,394,894 Equity loans 1,417 243 317 10,167 19,606 31,750 148,012 179,762 Credit card 12,147 10,191 21,953 — — 44,291 837,411 881,702 Consumer direct 24,076 17,550 8,741 10,087 23,163 83,617 1,846,106 1,929,723 Consumer indirect 47,174 14,951 5,066 24,713 — 91,904 4,085,221 4,177,125 Total loans $ 166,937 $ 92,681 $ 121,570 $ 1,331,230 $ 114,890 $ 1,827,308 $ 63,732,459 $ 65,559,767 It is the Company’s policy to classify TDRs that are not accruing interest as nonaccrual loans. It is also the Company’s policy to classify TDR past due loans that are accruing interest as TDRs and not according to their past due status. The tables above reflect this policy. In response to the COVID-19 pandemic, beginning in March 2020, the Company began providing financial hardship relief in the form of payment deferrals and forbearances to consumer and commercial customers across a wide array of lending products, as well as the suspension of vehicle repossessions and home foreclosures. The payment deferrals and forbearances generally cover periods of three to six months. In most cases as allowed under the CARES Act, these offers are not classified as TDRs and do not result in loans being placed on nonaccrual status. For loans that receive a payment deferral or forbearance under these hardship relief programs, the Company continues to accrue interest and recognize interest income during the period of the deferral. Depending on the terms of each program, all or a portion of this accrued interest may be paid directly by the borrower (either during the relief period, at the end of the relief period or at maturity of the loan). For certain programs, the maturity date of the 25

Table of Contents loan may also be extended by the number of payments deferred. Interest income will continue to be recognized at the original contractual interest rate unless that rate is concurrently modified upon entering the relief program (in which case, the modified rate would be used to recognize interest). At March 31, 2021, the Company had deferrals on approximately three thousand loans with an amortized cost of $279 million. Modifications to borrowers' loan agreements are considered TDRs if a concession is granted for economic or legal reasons related to a borrower’s financial difficulties that otherwise would not be considered. Within each of the Company’s loan classes, TDRs typically involve modification of the loan interest rate to a below market rate or an extension or deferment of the loan. During the three months ended March 31, 2021, $7.8 million of TDR modifications included an interest rate concession and $325.1 million of TDR modifications resulted from modifications to the loan’s structure. During the three months ended March 31, 2020, $5.2 million of TDR modifications included an interest rate concession and $43.6 million of TDR modifications resulted from modifications to the loan’s structure. The following table presents an analysis of the types of loans that were restructured and classified as TDRs, excluding loans classified as held for sale. Three Months Ended March 31, 2021 Three Months Ended March 31, 2020 Number of Contracts Post-Modification Outstanding Recorded Investment Number of Contracts Post-Modification Outstanding Recorded Investment (Dollars in Thousands) Commercial, financial and agricultural 10 $ 109,107 10 $ 41,238 Real estate – construction 1 18,056 — — Commercial real estate – mortgage 10 196,993 2 1,740 Residential real estate – mortgage 21 6,542 8 844 Equity lines of credit 3 154 1 36 Equity loans 5 554 1 192 Credit card — — — — Consumer direct 37 1,527 89 4,762 Consumer indirect — — — — The impact to the allowance for loan losses related to modifications classified as TDRs was approximately $(3.3) million and $5.3 million for the three months ended March 31, 2021 and 2020, respectively. The Company considers TDRs aged 90 days or more past due, charged off or classified as nonaccrual subsequent to modification, where the loan was not classified as a nonperforming loan at the time of modification, as subsequently defaulted. 26
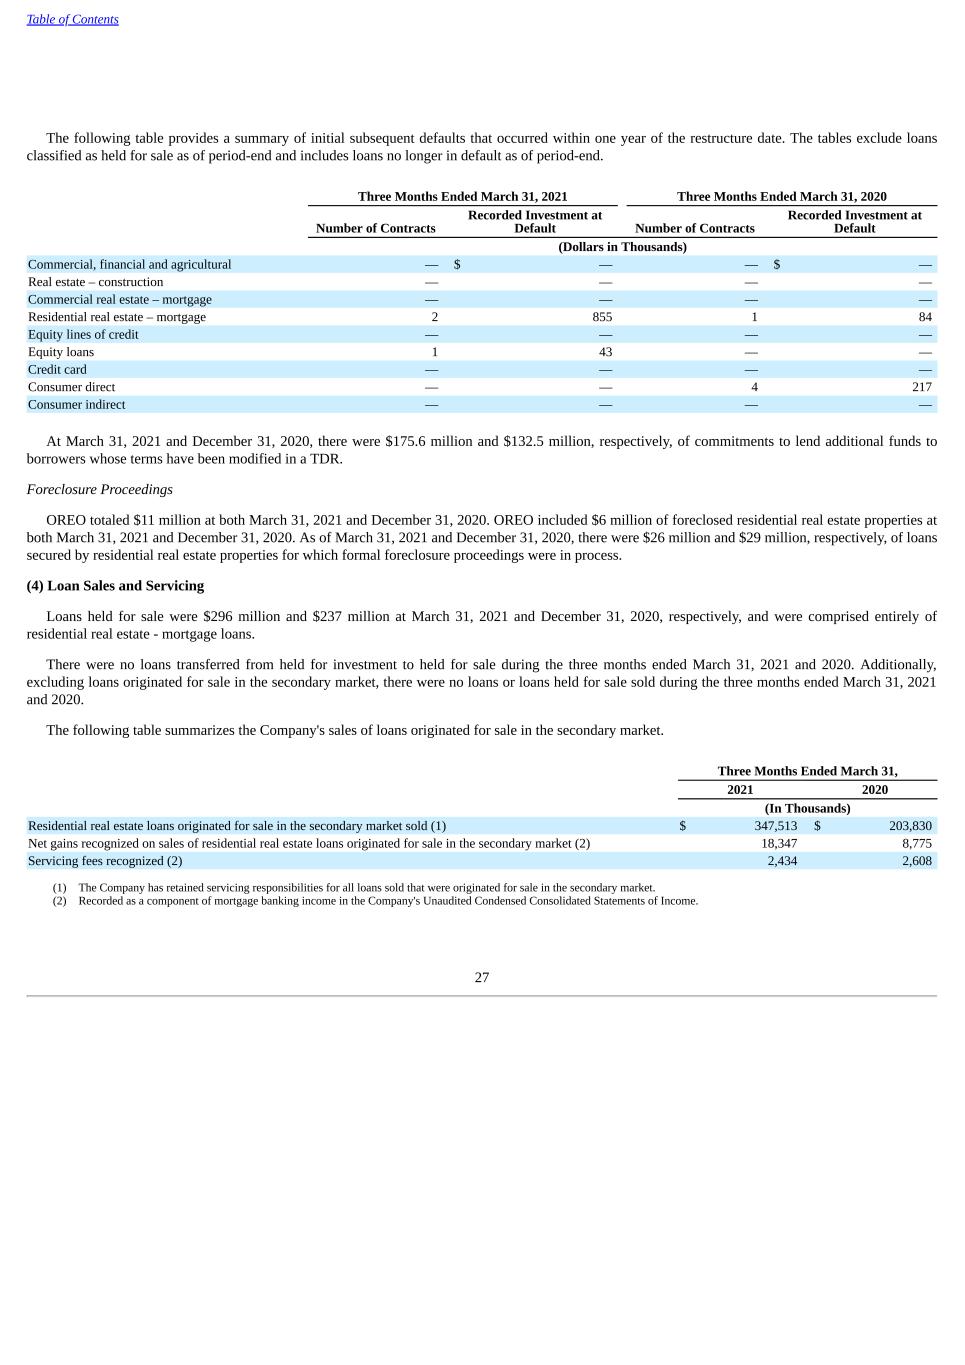
Table of Contents The following table provides a summary of initial subsequent defaults that occurred within one year of the restructure date. The tables exclude loans classified as held for sale as of period-end and includes loans no longer in default as of period-end. Three Months Ended March 31, 2021 Three Months Ended March 31, 2020 Number of Contracts Recorded Investment at Default Number of Contracts Recorded Investment at Default (Dollars in Thousands) Commercial, financial and agricultural — $ — — $ — Real estate – construction — — — — Commercial real estate – mortgage — — — — Residential real estate – mortgage 2 855 1 84 Equity lines of credit — — — — Equity loans 1 43 — — Credit card — — — — Consumer direct — — 4 217 Consumer indirect — — — — At March 31, 2021 and December 31, 2020, there were $175.6 million and $132.5 million, respectively, of commitments to lend additional funds to borrowers whose terms have been modified in a TDR. Foreclosure Proceedings OREO totaled $11 million at both March 31, 2021 and December 31, 2020. OREO included $6 million of foreclosed residential real estate properties at both March 31, 2021 and December 31, 2020. As of March 31, 2021 and December 31, 2020, there were $26 million and $29 million, respectively, of loans secured by residential real estate properties for which formal foreclosure proceedings were in process. (4) Loan Sales and Servicing Loans held for sale were $296 million and $237 million at March 31, 2021 and December 31, 2020, respectively, and were comprised entirely of residential real estate - mortgage loans. There were no loans transferred from held for investment to held for sale during the three months ended March 31, 2021 and 2020. Additionally, excluding loans originated for sale in the secondary market, there were no loans or loans held for sale sold during the three months ended March 31, 2021 and 2020. The following table summarizes the Company's sales of loans originated for sale in the secondary market. Three Months Ended March 31, 2021 2020 (In Thousands) Residential real estate loans originated for sale in the secondary market sold (1) $ 347,513 $ 203,830 Net gains recognized on sales of residential real estate loans originated for sale in the secondary market (2) 18,347 8,775 Servicing fees recognized (2) 2,434 2,608 (1) The Company has retained servicing responsibilities for all loans sold that were originated for sale in the secondary market. (2) Recorded as a component of mortgage banking income in the Company's Unaudited Condensed Consolidated Statements of Income. 27
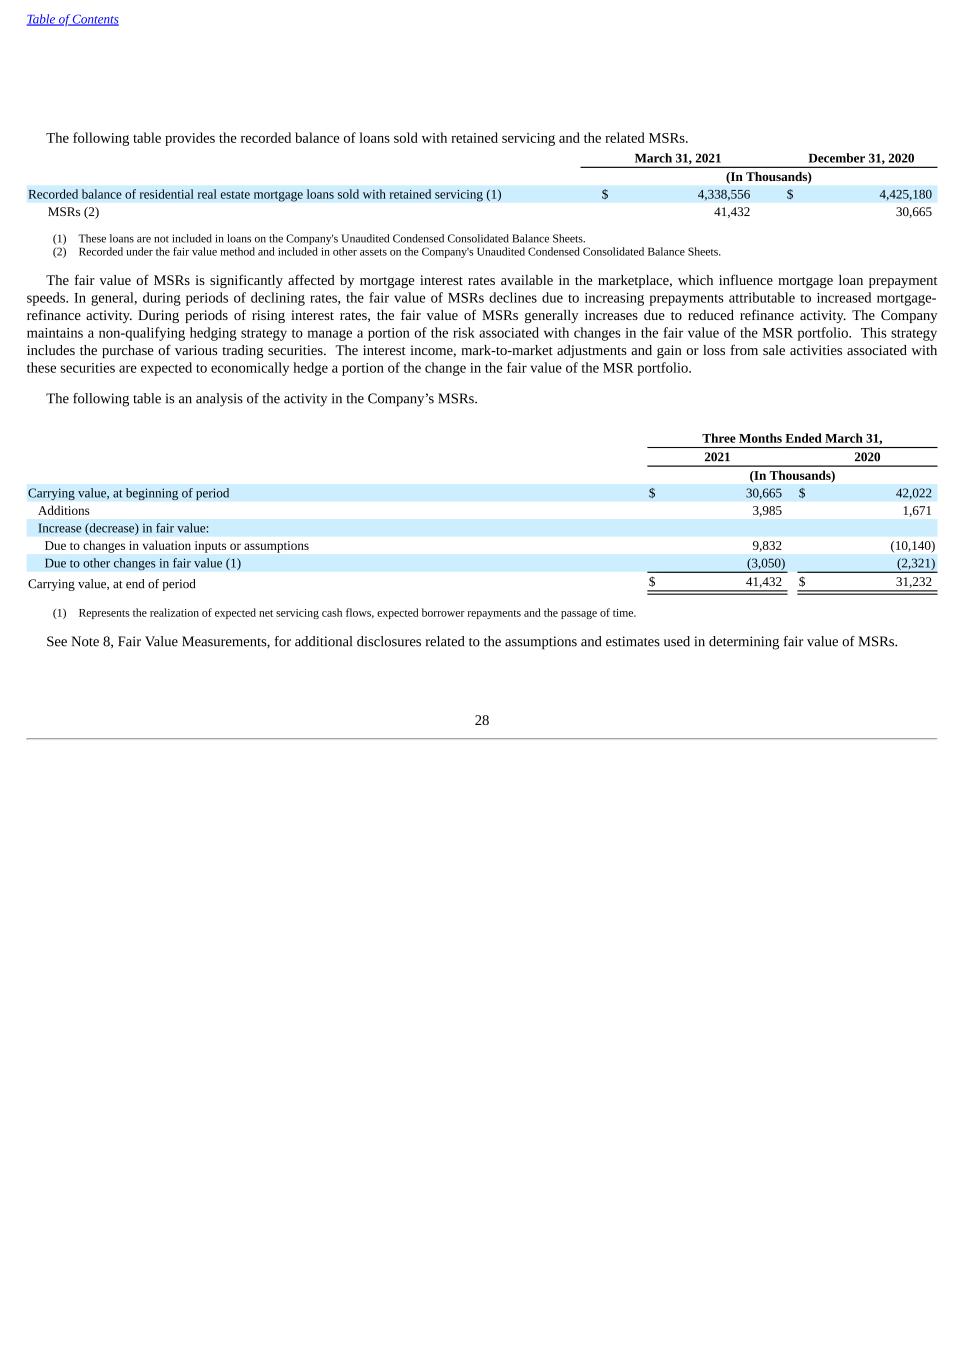
Table of Contents The following table provides the recorded balance of loans sold with retained servicing and the related MSRs. March 31, 2021 December 31, 2020 (In Thousands) Recorded balance of residential real estate mortgage loans sold with retained servicing (1) $ 4,338,556 $ 4,425,180 MSRs (2) 41,432 30,665 (1) These loans are not included in loans on the Company's Unaudited Condensed Consolidated Balance Sheets. (2) Recorded under the fair value method and included in other assets on the Company's Unaudited Condensed Consolidated Balance Sheets. The fair value of MSRs is significantly affected by mortgage interest rates available in the marketplace, which influence mortgage loan prepayment speeds. In general, during periods of declining rates, the fair value of MSRs declines due to increasing prepayments attributable to increased mortgage- refinance activity. During periods of rising interest rates, the fair value of MSRs generally increases due to reduced refinance activity. The Company maintains a non-qualifying hedging strategy to manage a portion of the risk associated with changes in the fair value of the MSR portfolio. This strategy includes the purchase of various trading securities. The interest income, mark-to-market adjustments and gain or loss from sale activities associated with these securities are expected to economically hedge a portion of the change in the fair value of the MSR portfolio. The following table is an analysis of the activity in the Company’s MSRs. Three Months Ended March 31, 2021 2020 (In Thousands) Carrying value, at beginning of period $ 30,665 $ 42,022 Additions 3,985 1,671 Increase (decrease) in fair value: Due to changes in valuation inputs or assumptions 9,832 (10,140) Due to other changes in fair value (1) (3,050) (2,321) Carrying value, at end of period $ 41,432 $ 31,232 (1) Represents the realization of expected net servicing cash flows, expected borrower repayments and the passage of time. See Note 8, Fair Value Measurements, for additional disclosures related to the assumptions and estimates used in determining fair value of MSRs. 28
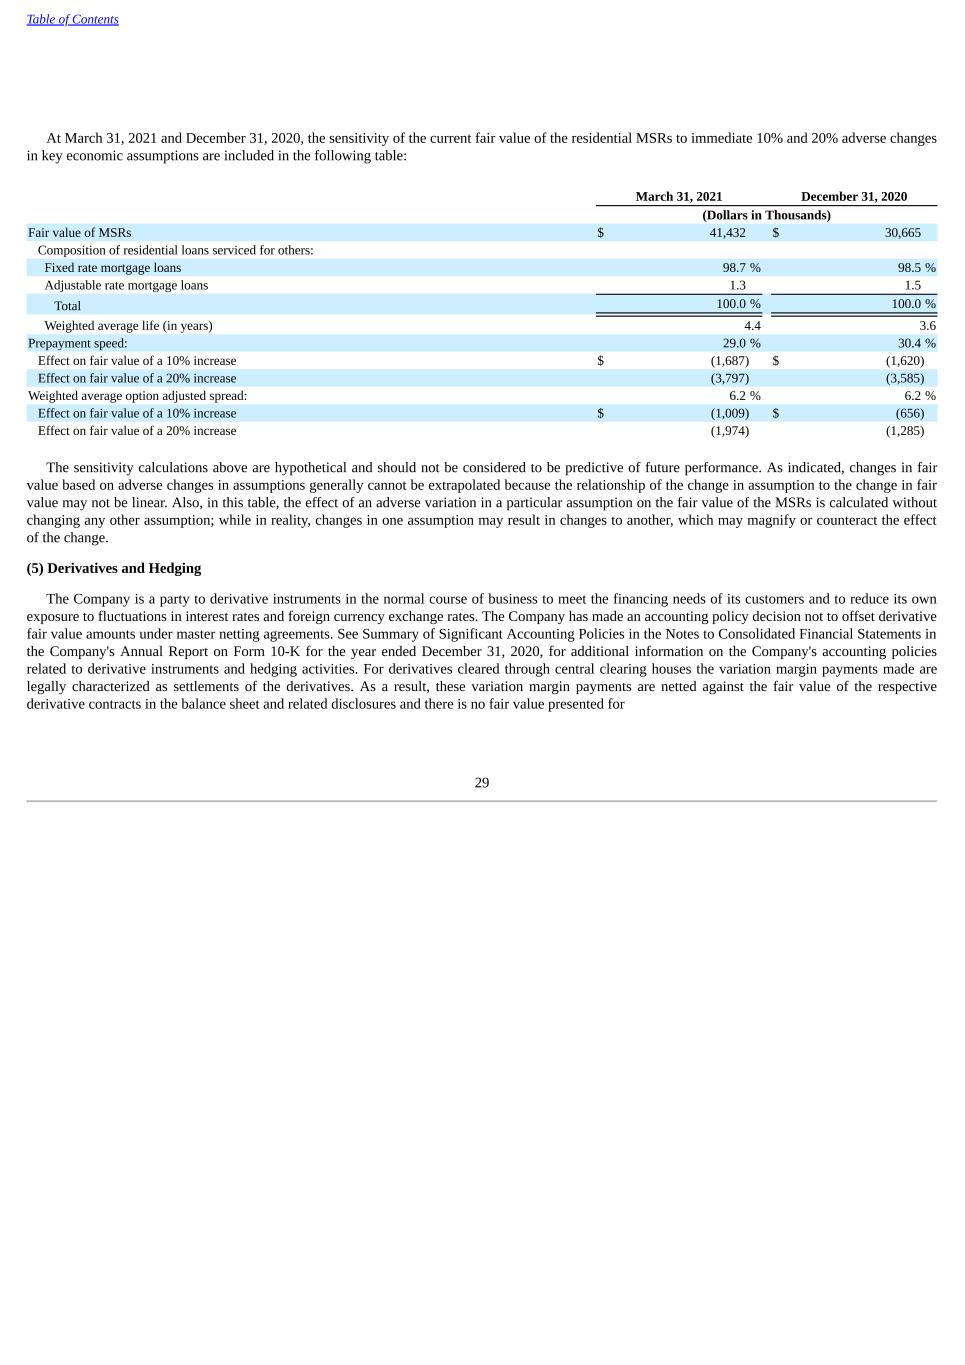
Table of Contents At March 31, 2021 and December 31, 2020, the sensitivity of the current fair value of the residential MSRs to immediate 10% and 20% adverse changes in key economic assumptions are included in the following table: March 31, 2021 December 31, 2020 (Dollars in Thousands) Fair value of MSRs $ 41,432 $ 30,665 Composition of residential loans serviced for others: Fixed rate mortgage loans 98.7 % 98.5 % Adjustable rate mortgage loans 1.3 1.5 Total 100.0 % 100.0 % Weighted average life (in years) 4.4 3.6 Prepayment speed: 29.0 % 30.4 % Effect on fair value of a 10% increase $ (1,687) $ (1,620) Effect on fair value of a 20% increase (3,797) (3,585) Weighted average option adjusted spread: 6.2 % 6.2 % Effect on fair value of a 10% increase $ (1,009) $ (656) Effect on fair value of a 20% increase (1,974) (1,285) The sensitivity calculations above are hypothetical and should not be considered to be predictive of future performance. As indicated, changes in fair value based on adverse changes in assumptions generally cannot be extrapolated because the relationship of the change in assumption to the change in fair value may not be linear. Also, in this table, the effect of an adverse variation in a particular assumption on the fair value of the MSRs is calculated without changing any other assumption; while in reality, changes in one assumption may result in changes to another, which may magnify or counteract the effect of the change. (5) Derivatives and Hedging The Company is a party to derivative instruments in the normal course of business to meet the financing needs of its customers and to reduce its own exposure to fluctuations in interest rates and foreign currency exchange rates. The Company has made an accounting policy decision not to offset derivative fair value amounts under master netting agreements. See Summary of Significant Accounting Policies in the Notes to Consolidated Financial Statements in the Company's Annual Report on Form 10-K for the year ended December 31, 2020, for additional information on the Company's accounting policies related to derivative instruments and hedging activities. For derivatives cleared through central clearing houses the variation margin payments made are legally characterized as settlements of the derivatives. As a result, these variation margin payments are netted against the fair value of the respective derivative contracts in the balance sheet and related disclosures and there is no fair value presented for 29
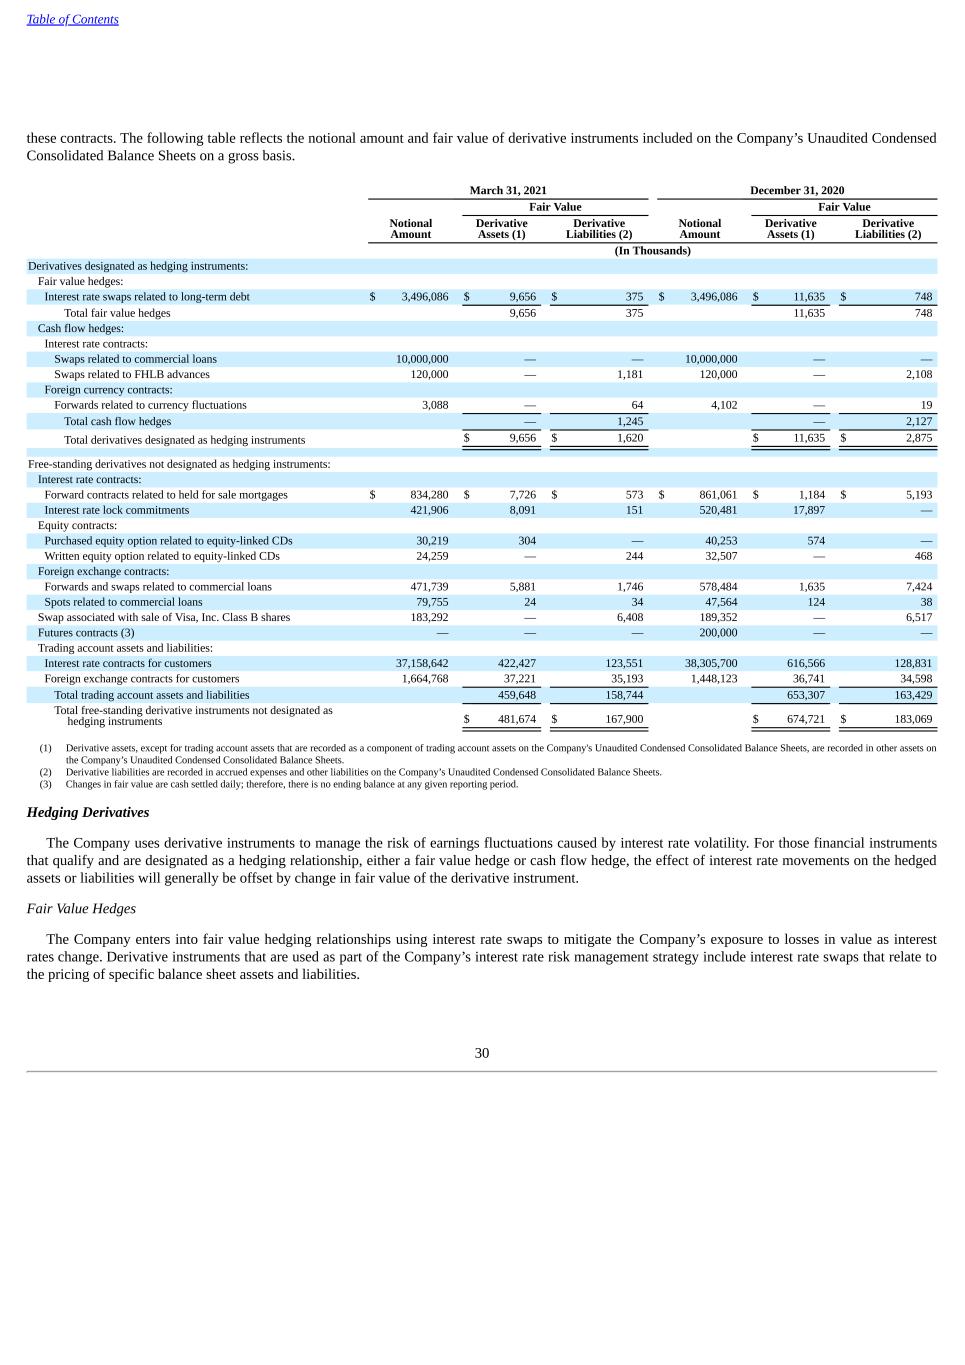
Table of Contents these contracts. The following table reflects the notional amount and fair value of derivative instruments included on the Company’s Unaudited Condensed Consolidated Balance Sheets on a gross basis. March 31, 2021 December 31, 2020 Fair Value Fair Value Notional Amount Derivative Assets (1) Derivative Liabilities (2) Notional Amount Derivative Assets (1) Derivative Liabilities (2) (In Thousands) Derivatives designated as hedging instruments: Fair value hedges: Interest rate swaps related to long-term debt $ 3,496,086 $ 9,656 $ 375 $ 3,496,086 $ 11,635 $ 748 Total fair value hedges 9,656 375 11,635 748 Cash flow hedges: Interest rate contracts: Swaps related to commercial loans 10,000,000 — — 10,000,000 — — Swaps related to FHLB advances 120,000 — 1,181 120,000 — 2,108 Foreign currency contracts: Forwards related to currency fluctuations 3,088 — 64 4,102 — 19 Total cash flow hedges — 1,245 — 2,127 Total derivatives designated as hedging instruments $ 9,656 $ 1,620 $ 11,635 $ 2,875 Free-standing derivatives not designated as hedging instruments: Interest rate contracts: Forward contracts related to held for sale mortgages $ 834,280 $ 7,726 $ 573 $ 861,061 $ 1,184 $ 5,193 Interest rate lock commitments 421,906 8,091 151 520,481 17,897 — Equity contracts: Purchased equity option related to equity-linked CDs 30,219 304 — 40,253 574 — Written equity option related to equity-linked CDs 24,259 — 244 32,507 — 468 Foreign exchange contracts: Forwards and swaps related to commercial loans 471,739 5,881 1,746 578,484 1,635 7,424 Spots related to commercial loans 79,755 24 34 47,564 124 38 Swap associated with sale of Visa, Inc. Class B shares 183,292 — 6,408 189,352 — 6,517 Futures contracts (3) — — — 200,000 — — Trading account assets and liabilities: Interest rate contracts for customers 37,158,642 422,427 123,551 38,305,700 616,566 128,831 Foreign exchange contracts for customers 1,664,768 37,221 35,193 1,448,123 36,741 34,598 Total trading account assets and liabilities 459,648 158,744 653,307 163,429 Total free-standing derivative instruments not designated as hedging instruments $ 481,674 $ 167,900 $ 674,721 $ 183,069 (1) Derivative assets, except for trading account assets that are recorded as a component of trading account assets on the Company's Unaudited Condensed Consolidated Balance Sheets, are recorded in other assets on the Company’s Unaudited Condensed Consolidated Balance Sheets. (2) Derivative liabilities are recorded in accrued expenses and other liabilities on the Company’s Unaudited Condensed Consolidated Balance Sheets. (3) Changes in fair value are cash settled daily; therefore, there is no ending balance at any given reporting period. Hedging Derivatives The Company uses derivative instruments to manage the risk of earnings fluctuations caused by interest rate volatility. For those financial instruments that qualify and are designated as a hedging relationship, either a fair value hedge or cash flow hedge, the effect of interest rate movements on the hedged assets or liabilities will generally be offset by change in fair value of the derivative instrument. Fair Value Hedges The Company enters into fair value hedging relationships using interest rate swaps to mitigate the Company’s exposure to losses in value as interest rates change. Derivative instruments that are used as part of the Company’s interest rate risk management strategy include interest rate swaps that relate to the pricing of specific balance sheet assets and liabilities. 30

Table of Contents Interest rate swaps are used to convert the Company’s fixed rate long-term debt to a variable rate. The critical terms of the interest rate swaps match the terms of the corresponding hedged items. All components of each derivative instrument’s gain or loss are included in the assessment of hedge effectiveness. The Company recognized no gains or losses for the three months ended March 31, 2021 and 2020, related to hedged firm commitments no longer qualifying as a fair value hedge. At March 31, 2021, the fair value hedges had a weighted average expected remaining term of 2.2 years. Cash Flow Hedges The Company enters into cash flow hedging relationships using interest rate swaps and options, such as caps and floors, to mitigate exposure to the variability in future cash flows or other forecasted transactions associated with its floating rate assets and liabilities. The Company uses interest rate swaps and options to hedge the repricing characteristics of its floating rate commercial loans and FHLB advances. The Company also uses foreign currency forward contracts to hedge its exposure to fluctuations in foreign currency exchange rates due to a portion of money transfer expense being denominated in foreign currency. All components of each derivative instrument’s gain or loss are included in the assessment of hedge effectiveness. The initial assessment of expected hedge effectiveness is based on regression analysis. The ongoing periodic measures of hedge ineffectiveness are based on the expected change in cash flows of the hedged item caused by changes in the benchmark interest rate. There were no gains or losses reclassified from other comprehensive income because of the discontinuance of cash flow hedges related to certain forecasted transactions that are probable of not occurring for the three months ended March 31, 2021 and 2020. At March 31, 2021, cash flow hedges not terminated had a net fair value of $(1) million and a weighted average life of 1.9 years. Net gains of $175.8 million are expected to be reclassified to income over the next 12 months as net settlements occur. The maximum length of time over which the entity is hedging its exposure to the variability in future cash flows for forecasted transactions is 2.9 years. 31
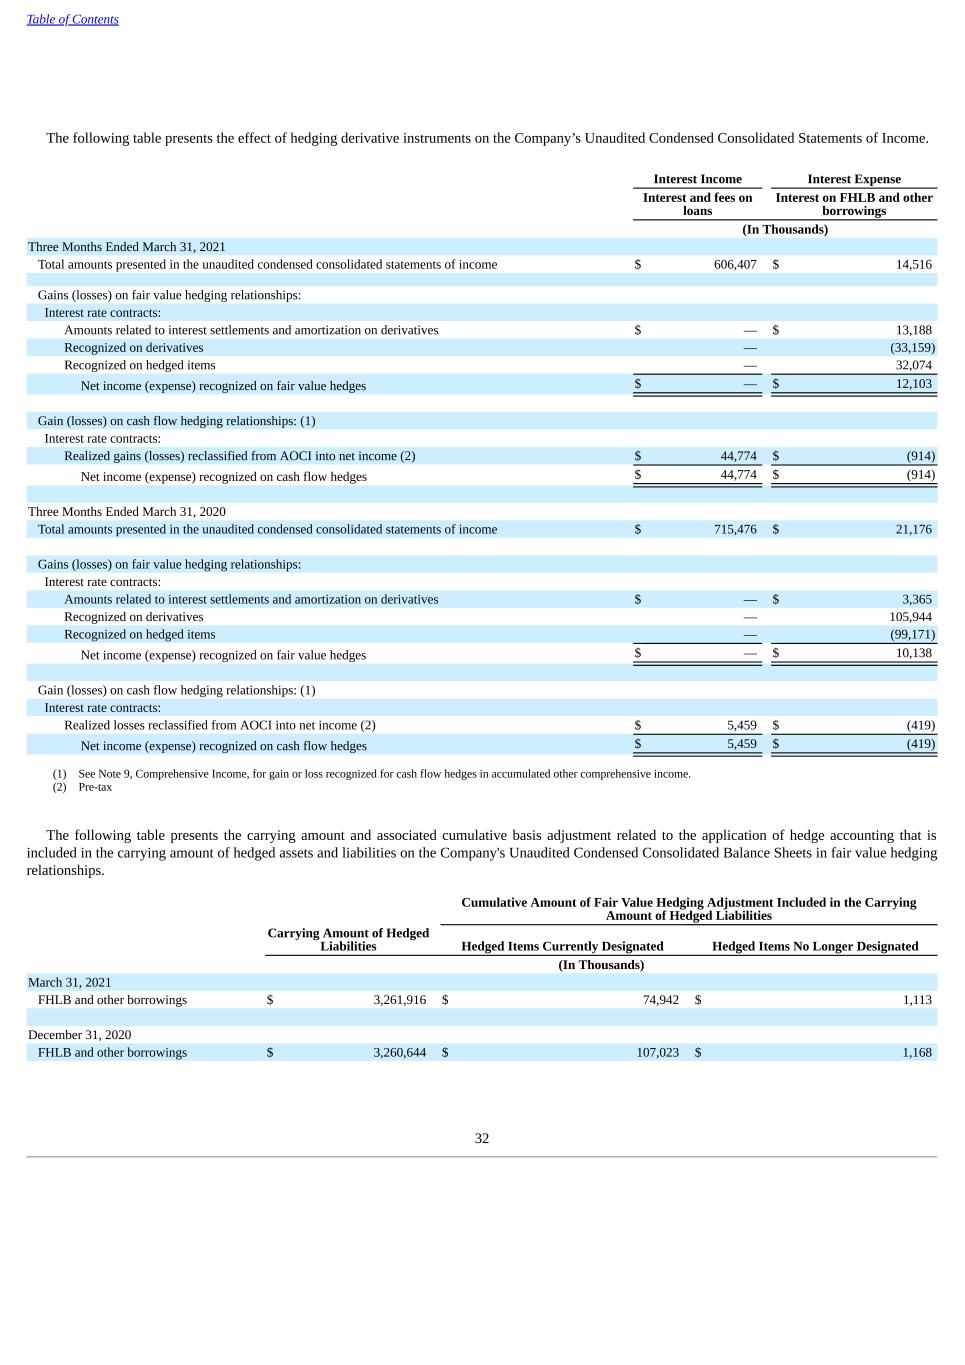
Table of Contents The following table presents the effect of hedging derivative instruments on the Company’s Unaudited Condensed Consolidated Statements of Income. Interest Income Interest Expense Interest and fees on loans Interest on FHLB and other borrowings (In Thousands) Three Months Ended March 31, 2021 Total amounts presented in the unaudited condensed consolidated statements of income $ 606,407 $ 14,516 Gains (losses) on fair value hedging relationships: Interest rate contracts: Amounts related to interest settlements and amortization on derivatives $ — $ 13,188 Recognized on derivatives — (33,159) Recognized on hedged items — 32,074 Net income (expense) recognized on fair value hedges $ — $ 12,103 Gain (losses) on cash flow hedging relationships: (1) Interest rate contracts: Realized gains (losses) reclassified from AOCI into net income (2) $ 44,774 $ (914) Net income (expense) recognized on cash flow hedges $ 44,774 $ (914) Three Months Ended March 31, 2020 Total amounts presented in the unaudited condensed consolidated statements of income $ 715,476 $ 21,176 Gains (losses) on fair value hedging relationships: Interest rate contracts: Amounts related to interest settlements and amortization on derivatives $ — $ 3,365 Recognized on derivatives — 105,944 Recognized on hedged items — (99,171) Net income (expense) recognized on fair value hedges $ — $ 10,138 Gain (losses) on cash flow hedging relationships: (1) Interest rate contracts: Realized losses reclassified from AOCI into net income (2) $ 5,459 $ (419) Net income (expense) recognized on cash flow hedges $ 5,459 $ (419) (1) See Note 9, Comprehensive Income, for gain or loss recognized for cash flow hedges in accumulated other comprehensive income. (2) Pre-tax The following table presents the carrying amount and associated cumulative basis adjustment related to the application of hedge accounting that is included in the carrying amount of hedged assets and liabilities on the Company's Unaudited Condensed Consolidated Balance Sheets in fair value hedging relationships. Cumulative Amount of Fair Value Hedging Adjustment Included in the Carrying Amount of Hedged Liabilities Carrying Amount of Hedged Liabilities Hedged Items Currently Designated Hedged Items No Longer Designated (In Thousands) March 31, 2021 FHLB and other borrowings $ 3,261,916 $ 74,942 $ 1,113 December 31, 2020 FHLB and other borrowings $ 3,260,644 $ 107,023 $ 1,168 32
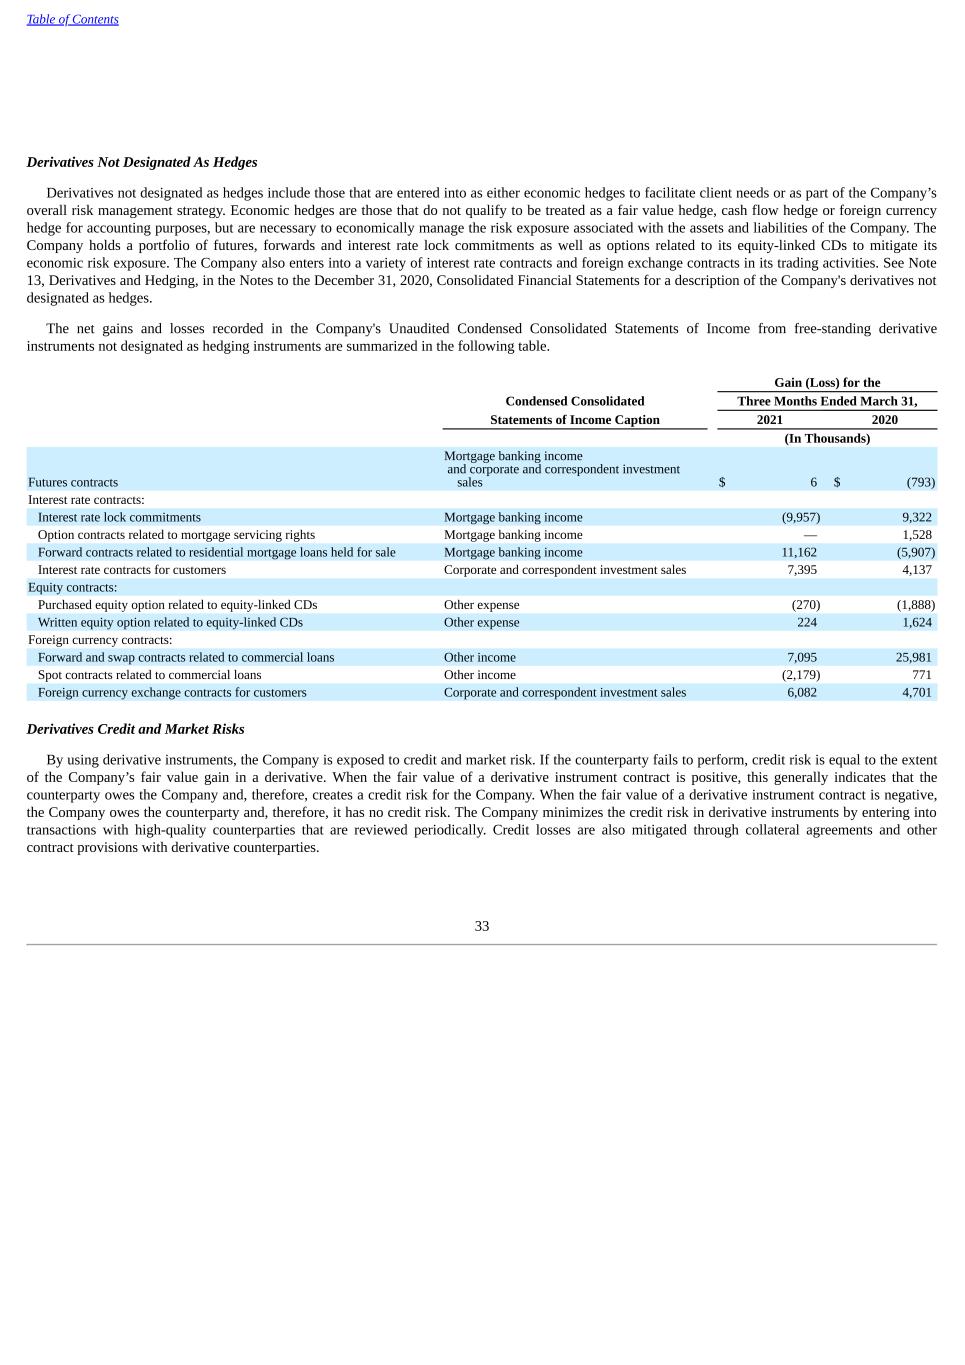
Table of Contents Derivatives Not Designated As Hedges Derivatives not designated as hedges include those that are entered into as either economic hedges to facilitate client needs or as part of the Company’s overall risk management strategy. Economic hedges are those that do not qualify to be treated as a fair value hedge, cash flow hedge or foreign currency hedge for accounting purposes, but are necessary to economically manage the risk exposure associated with the assets and liabilities of the Company. The Company holds a portfolio of futures, forwards and interest rate lock commitments as well as options related to its equity-linked CDs to mitigate its economic risk exposure. The Company also enters into a variety of interest rate contracts and foreign exchange contracts in its trading activities. See Note 13, Derivatives and Hedging, in the Notes to the December 31, 2020, Consolidated Financial Statements for a description of the Company's derivatives not designated as hedges. The net gains and losses recorded in the Company's Unaudited Condensed Consolidated Statements of Income from free-standing derivative instruments not designated as hedging instruments are summarized in the following table. Gain (Loss) for the Condensed Consolidated Three Months Ended March 31, Statements of Income Caption 2021 2020 (In Thousands) Futures contracts Mortgage banking income and corporate and correspondent investment sales $ 6 $ (793) Interest rate contracts: Interest rate lock commitments Mortgage banking income (9,957) 9,322 Option contracts related to mortgage servicing rights Mortgage banking income — 1,528 Forward contracts related to residential mortgage loans held for sale Mortgage banking income 11,162 (5,907) Interest rate contracts for customers Corporate and correspondent investment sales 7,395 4,137 Equity contracts: Purchased equity option related to equity-linked CDs Other expense (270) (1,888) Written equity option related to equity-linked CDs Other expense 224 1,624 Foreign currency contracts: Forward and swap contracts related to commercial loans Other income 7,095 25,981 Spot contracts related to commercial loans Other income (2,179) 771 Foreign currency exchange contracts for customers Corporate and correspondent investment sales 6,082 4,701 Derivatives Credit and Market Risks By using derivative instruments, the Company is exposed to credit and market risk. If the counterparty fails to perform, credit risk is equal to the extent of the Company’s fair value gain in a derivative. When the fair value of a derivative instrument contract is positive, this generally indicates that the counterparty owes the Company and, therefore, creates a credit risk for the Company. When the fair value of a derivative instrument contract is negative, the Company owes the counterparty and, therefore, it has no credit risk. The Company minimizes the credit risk in derivative instruments by entering into transactions with high-quality counterparties that are reviewed periodically. Credit losses are also mitigated through collateral agreements and other contract provisions with derivative counterparties. 33
Table of Contents Market risk is the adverse effect that a change in interest rates or implied volatility rates has on the value of a financial instrument. The Company manages the market risk associated with interest rate contracts by establishing and monitoring limits as to the types and degree of risk that may be undertaken. The Company’s derivatives activities are monitored by its Asset/Liability Committee as part of its risk-management oversight. The Company’s Asset/Liability Committee is responsible for mandating various hedging strategies that are developed through its analysis of data from financial simulation models and other internal and industry sources. The resulting hedging strategies are then incorporated into the Company’s overall interest rate risk management and trading strategies. Entering into interest rate swap agreements and options involves not only the risk of dealing with counterparties and their ability to meet the terms of the contracts but also interest rate risk associated with unmatched positions. At March 31, 2021, interest rate swap agreements and options classified as trading were substantially matched. The Company had credit risk of $460 million related to derivative instruments in the trading account portfolio, which does not take into consideration master netting arrangements or the value of the collateral. There were no credit losses associated with derivative instruments classified as trading for the three months ended March 31, 2021 and 2020. At March 31, 2021 and December 31, 2020, there were no material nonperforming derivative positions classified as trading. The Company’s derivative positions designated as hedging instruments are primarily executed in the over-the-counter market. These positions at March 31, 2021, have credit risk of $10 million, which does not take into consideration master netting arrangements or the value of the collateral. There were no credit losses associated with derivative instruments classified as nontrading for the three months ended March 31, 2021 and 2020. At March 31, 2021 and December 31, 2020, there were no nonperforming derivative positions classified as nontrading. As of March 31, 2021 and December 31, 2020, the Company had recorded the right to reclaim cash collateral of $163 million and $199 million, respectively, within other assets on the Company’s Unaudited Condensed Consolidated Balance Sheets. As of March 31, 2021 and December 31, 2020, the Company had recorded the obligation to return cash collateral of $23 million and $14 million, respectively, within deposits on the Company’s Unaudited Condensed Consolidated Balance Sheets. Contingent Features Certain of the Company’s derivative instruments contain provisions that require the Company’s debt maintain a certain credit rating from each of the major credit rating agencies. If the Company’s debt were to fall below this rating, it would be in violation of these provisions, and the counterparties to the derivative instruments could demand immediate and ongoing full overnight collateralization on derivative instruments in net liability positions. The aggregate fair value of all derivative instruments with credit-risk-related contingent features that were in a liability position on March 31, 2021, was $50 million for which the Company has collateral requirements of $48 million in the normal course of business. If the credit risk-related contingent features underlying these agreements had been triggered on March 31, 2021, the Company’s collateral requirements to its counterparties would increase by $2 million. The aggregate fair value of all derivative instruments with credit risk-related contingent features that were in a liability position on December 31, 2020, was $66 million for which the Company had collateral requirements of $64 million in the normal course of business. If the credit risk-related contingent features underlying these agreements had been triggered on December 31, 2020, the Company’s collateral requirements to its counterparties would have increased by $2 million. Netting of Derivative Instruments The Company is party to master netting arrangements with its financial institution counterparties for some of its derivative and hedging activities. The Company does not offset assets and liabilities under these master netting arrangements for financial statement presentation purposes. The master netting arrangements provide for single net settlement of all derivative instrument arrangements, as well as collateral, in the event of default with respect to, or termination of, any one contract with the respective counterparties. Cash collateral is usually posted by the counterparty with a net liability position in accordance with contract thresholds. 34
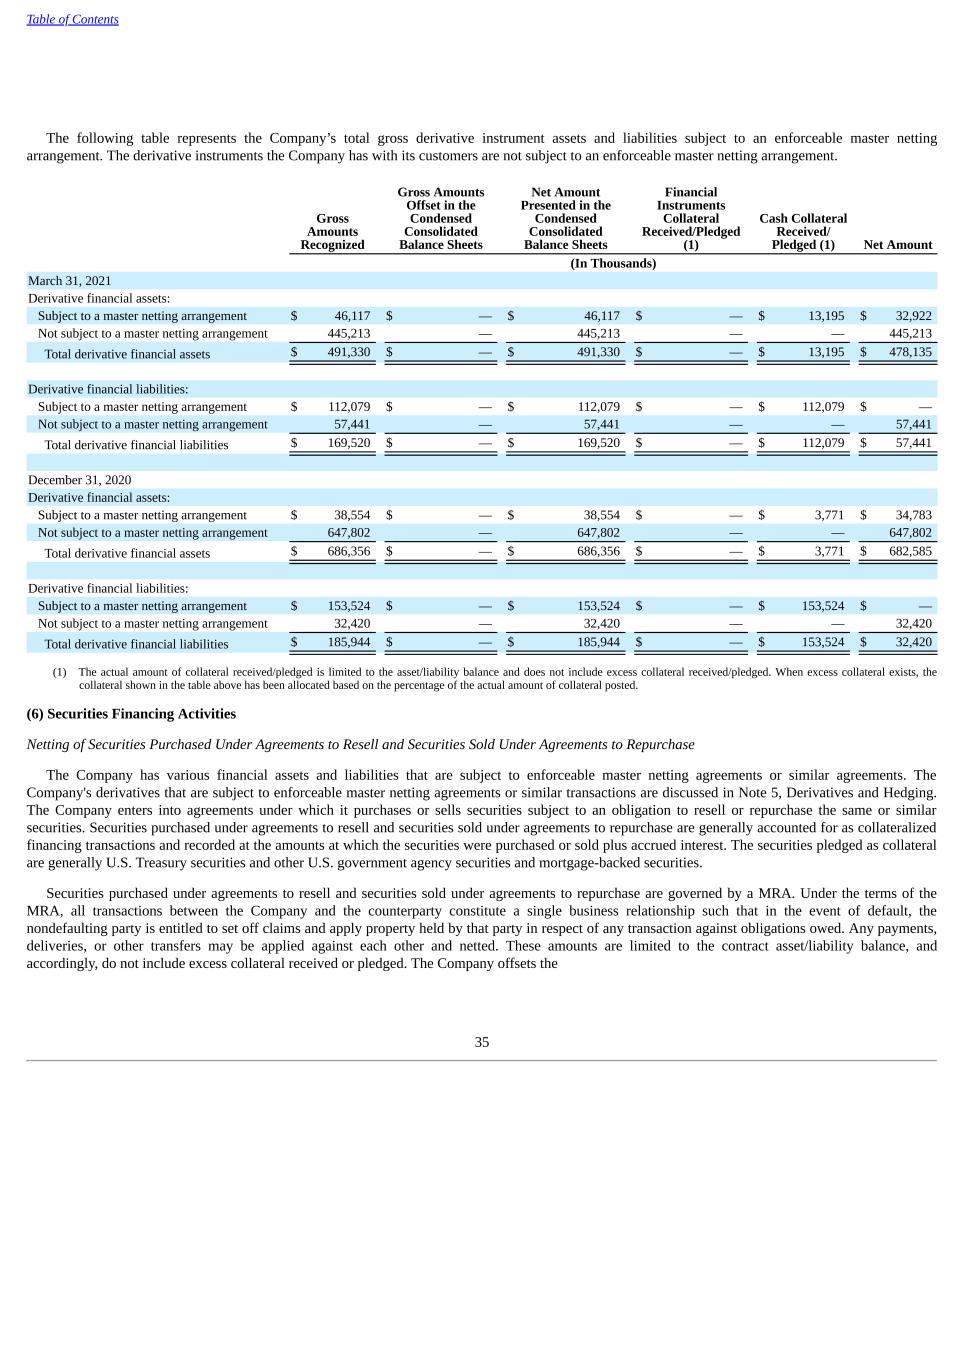
Table of Contents The following table represents the Company’s total gross derivative instrument assets and liabilities subject to an enforceable master netting arrangement. The derivative instruments the Company has with its customers are not subject to an enforceable master netting arrangement. Gross Amounts Recognized Gross Amounts Offset in the Condensed Consolidated Balance Sheets Net Amount Presented in the Condensed Consolidated Balance Sheets Financial Instruments Collateral Received/Pledged (1) Cash Collateral Received/ Pledged (1) Net Amount (In Thousands) March 31, 2021 Derivative financial assets: Subject to a master netting arrangement $ 46,117 $ — $ 46,117 $ — $ 13,195 $ 32,922 Not subject to a master netting arrangement 445,213 — 445,213 — — 445,213 Total derivative financial assets $ 491,330 $ — $ 491,330 $ — $ 13,195 $ 478,135 Derivative financial liabilities: Subject to a master netting arrangement $ 112,079 $ — $ 112,079 $ — $ 112,079 $ — Not subject to a master netting arrangement 57,441 — 57,441 — — 57,441 Total derivative financial liabilities $ 169,520 $ — $ 169,520 $ — $ 112,079 $ 57,441 December 31, 2020 Derivative financial assets: Subject to a master netting arrangement $ 38,554 $ — $ 38,554 $ — $ 3,771 $ 34,783 Not subject to a master netting arrangement 647,802 — 647,802 — — 647,802 Total derivative financial assets $ 686,356 $ — $ 686,356 $ — $ 3,771 $ 682,585 Derivative financial liabilities: Subject to a master netting arrangement $ 153,524 $ — $ 153,524 $ — $ 153,524 $ — Not subject to a master netting arrangement 32,420 — 32,420 — — 32,420 Total derivative financial liabilities $ 185,944 $ — $ 185,944 $ — $ 153,524 $ 32,420 (1) The actual amount of collateral received/pledged is limited to the asset/liability balance and does not include excess collateral received/pledged. When excess collateral exists, the collateral shown in the table above has been allocated based on the percentage of the actual amount of collateral posted. (6) Securities Financing Activities Netting of Securities Purchased Under Agreements to Resell and Securities Sold Under Agreements to Repurchase The Company has various financial assets and liabilities that are subject to enforceable master netting agreements or similar agreements. The Company's derivatives that are subject to enforceable master netting agreements or similar transactions are discussed in Note 5, Derivatives and Hedging. The Company enters into agreements under which it purchases or sells securities subject to an obligation to resell or repurchase the same or similar securities. Securities purchased under agreements to resell and securities sold under agreements to repurchase are generally accounted for as collateralized financing transactions and recorded at the amounts at which the securities were purchased or sold plus accrued interest. The securities pledged as collateral are generally U.S. Treasury securities and other U.S. government agency securities and mortgage-backed securities. Securities purchased under agreements to resell and securities sold under agreements to repurchase are governed by a MRA. Under the terms of the MRA, all transactions between the Company and the counterparty constitute a single business relationship such that in the event of default, the nondefaulting party is entitled to set off claims and apply property held by that party in respect of any transaction against obligations owed. Any payments, deliveries, or other transfers may be applied against each other and netted. These amounts are limited to the contract asset/liability balance, and accordingly, do not include excess collateral received or pledged. The Company offsets the 35
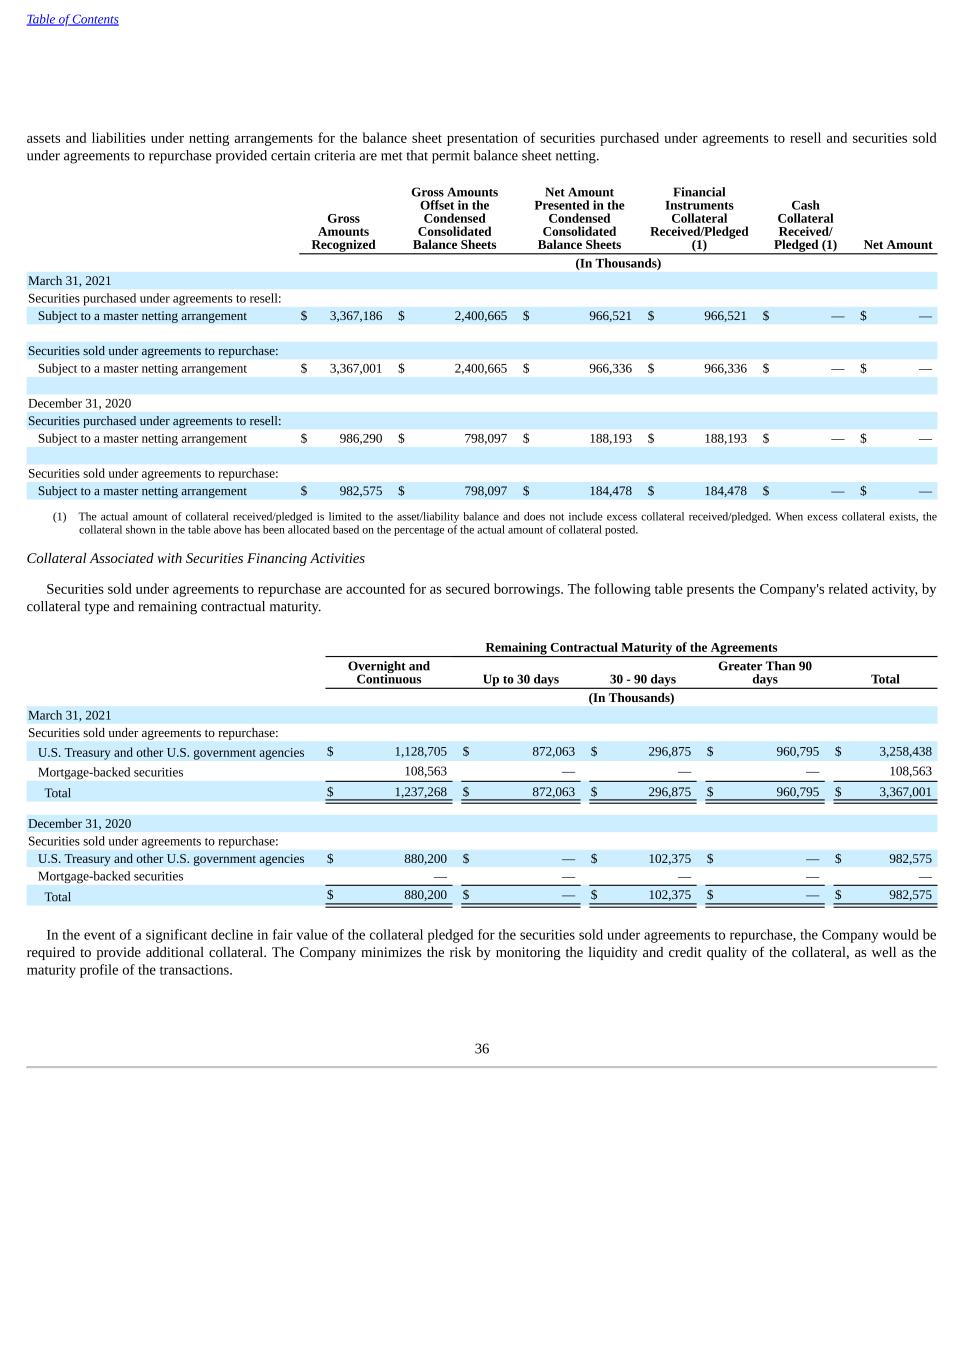
Table of Contents assets and liabilities under netting arrangements for the balance sheet presentation of securities purchased under agreements to resell and securities sold under agreements to repurchase provided certain criteria are met that permit balance sheet netting. Gross Amounts Recognized Gross Amounts Offset in the Condensed Consolidated Balance Sheets Net Amount Presented in the Condensed Consolidated Balance Sheets Financial Instruments Collateral Received/Pledged (1) Cash Collateral Received/ Pledged (1) Net Amount (In Thousands) March 31, 2021 Securities purchased under agreements to resell: Subject to a master netting arrangement $ 3,367,186 $ 2,400,665 $ 966,521 $ 966,521 $ — $ — Securities sold under agreements to repurchase: Subject to a master netting arrangement $ 3,367,001 $ 2,400,665 $ 966,336 $ 966,336 $ — $ — December 31, 2020 Securities purchased under agreements to resell: Subject to a master netting arrangement $ 986,290 $ 798,097 $ 188,193 $ 188,193 $ — $ — Securities sold under agreements to repurchase: Subject to a master netting arrangement $ 982,575 $ 798,097 $ 184,478 $ 184,478 $ — $ — (1) The actual amount of collateral received/pledged is limited to the asset/liability balance and does not include excess collateral received/pledged. When excess collateral exists, the collateral shown in the table above has been allocated based on the percentage of the actual amount of collateral posted. Collateral Associated with Securities Financing Activities Securities sold under agreements to repurchase are accounted for as secured borrowings. The following table presents the Company's related activity, by collateral type and remaining contractual maturity. Remaining Contractual Maturity of the Agreements Overnight and Continuous Up to 30 days 30 - 90 days Greater Than 90 days Total (In Thousands) March 31, 2021 Securities sold under agreements to repurchase: U.S. Treasury and other U.S. government agencies $ 1,128,705 $ 872,063 $ 296,875 $ 960,795 $ 3,258,438 Mortgage-backed securities 108,563 — — — 108,563 Total $ 1,237,268 $ 872,063 $ 296,875 $ 960,795 $ 3,367,001 December 31, 2020 Securities sold under agreements to repurchase: U.S. Treasury and other U.S. government agencies $ 880,200 $ — $ 102,375 $ — $ 982,575 Mortgage-backed securities — — — — — Total $ 880,200 $ — $ 102,375 $ — $ 982,575 In the event of a significant decline in fair value of the collateral pledged for the securities sold under agreements to repurchase, the Company would be required to provide additional collateral. The Company minimizes the risk by monitoring the liquidity and credit quality of the collateral, as well as the maturity profile of the transactions. 36
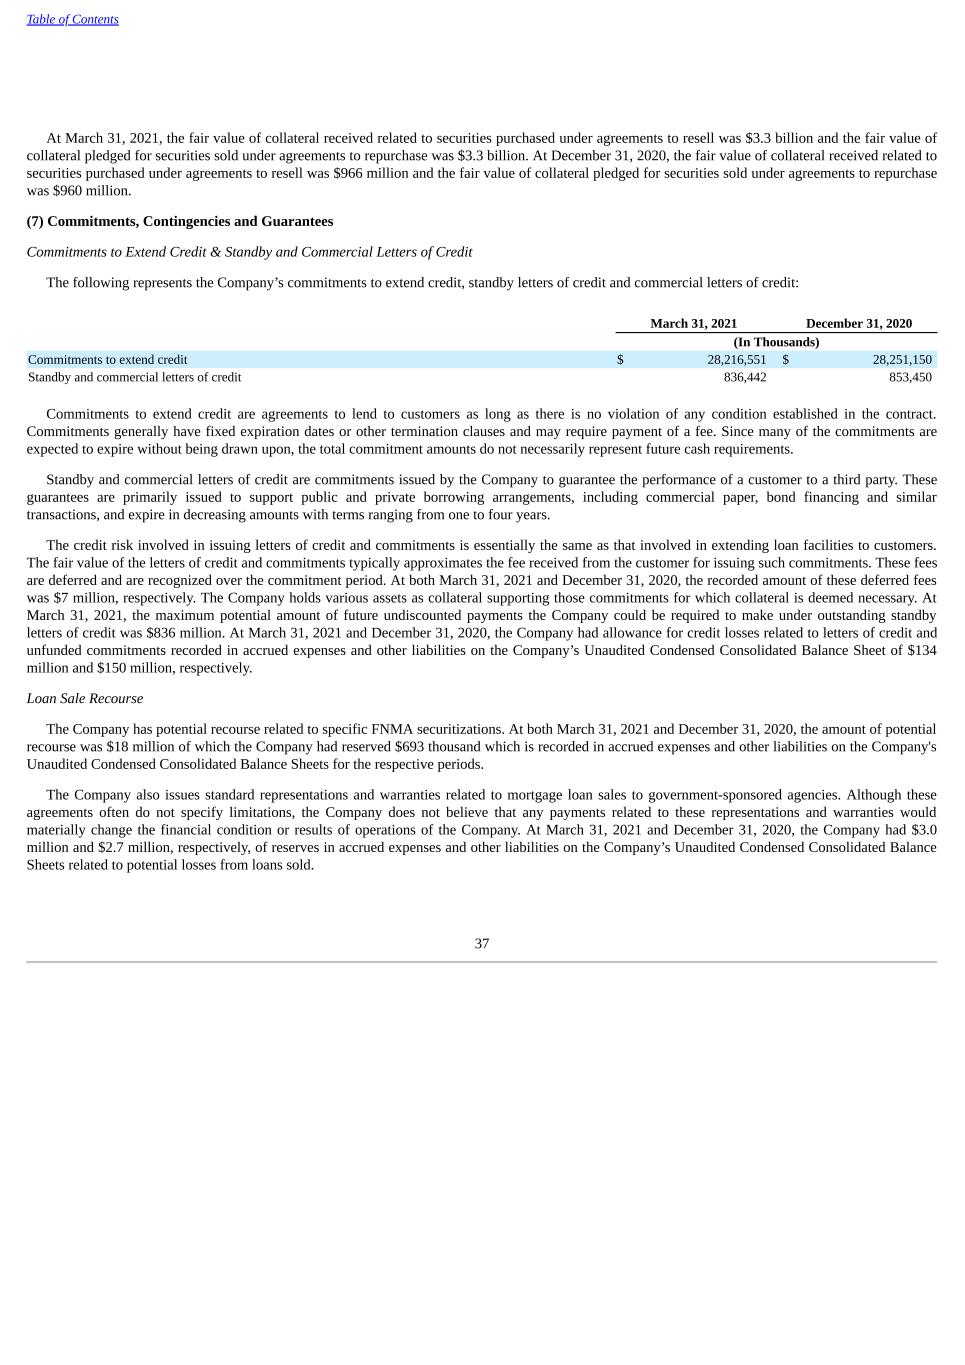
Table of Contents At March 31, 2021, the fair value of collateral received related to securities purchased under agreements to resell was $3.3 billion and the fair value of collateral pledged for securities sold under agreements to repurchase was $3.3 billion. At December 31, 2020, the fair value of collateral received related to securities purchased under agreements to resell was $966 million and the fair value of collateral pledged for securities sold under agreements to repurchase was $960 million. (7) Commitments, Contingencies and Guarantees Commitments to Extend Credit & Standby and Commercial Letters of Credit The following represents the Company’s commitments to extend credit, standby letters of credit and commercial letters of credit: March 31, 2021 December 31, 2020 (In Thousands) Commitments to extend credit $ 28,216,551 $ 28,251,150 Standby and commercial letters of credit 836,442 853,450 Commitments to extend credit are agreements to lend to customers as long as there is no violation of any condition established in the contract. Commitments generally have fixed expiration dates or other termination clauses and may require payment of a fee. Since many of the commitments are expected to expire without being drawn upon, the total commitment amounts do not necessarily represent future cash requirements. Standby and commercial letters of credit are commitments issued by the Company to guarantee the performance of a customer to a third party. These guarantees are primarily issued to support public and private borrowing arrangements, including commercial paper, bond financing and similar transactions, and expire in decreasing amounts with terms ranging from one to four years. The credit risk involved in issuing letters of credit and commitments is essentially the same as that involved in extending loan facilities to customers. The fair value of the letters of credit and commitments typically approximates the fee received from the customer for issuing such commitments. These fees are deferred and are recognized over the commitment period. At both March 31, 2021 and December 31, 2020, the recorded amount of these deferred fees was $7 million, respectively. The Company holds various assets as collateral supporting those commitments for which collateral is deemed necessary. At March 31, 2021, the maximum potential amount of future undiscounted payments the Company could be required to make under outstanding standby letters of credit was $836 million. At March 31, 2021 and December 31, 2020, the Company had allowance for credit losses related to letters of credit and unfunded commitments recorded in accrued expenses and other liabilities on the Company’s Unaudited Condensed Consolidated Balance Sheet of $134 million and $150 million, respectively. Loan Sale Recourse The Company has potential recourse related to specific FNMA securitizations. At both March 31, 2021 and December 31, 2020, the amount of potential recourse was $18 million of which the Company had reserved $693 thousand which is recorded in accrued expenses and other liabilities on the Company's Unaudited Condensed Consolidated Balance Sheets for the respective periods. The Company also issues standard representations and warranties related to mortgage loan sales to government-sponsored agencies. Although these agreements often do not specify limitations, the Company does not believe that any payments related to these representations and warranties would materially change the financial condition or results of operations of the Company. At March 31, 2021 and December 31, 2020, the Company had $3.0 million and $2.7 million, respectively, of reserves in accrued expenses and other liabilities on the Company’s Unaudited Condensed Consolidated Balance Sheets related to potential losses from loans sold. 37
Table of Contents Legal and Regulatory Proceedings In the ordinary course of business, the Company is subject to legal proceedings, including claims, litigation, investigations and administrative proceedings, all of which are considered incidental to the normal conduct of business. The Company believes it has substantial defenses to the claims asserted against it in its currently outstanding legal proceedings and, with respect to such legal proceedings, intends to defend itself vigorously. Set forth below are descriptions of certain of the Company’s legal proceedings. In January 2014, the Bank was named as a defendant in a lawsuit filed in the District Court of Dallas County, Texas, David Bagwell, individually and as Trustee of the David S. Bagwell Trust, et al. v. BBVA USA, et al., wherein the plaintiffs (who are the borrowers and guarantors of the underlying loans) allege that BBVA USA wrongfully sold their loans to a third party after representing that it would not do so. The plaintiffs seek unspecified monetary relief. Following trial in December 2017, the jury rendered a verdict in favor of the plaintiffs totaling $98 million. On June 27, 2018, the court entered a judgment in favor of the plaintiffs in the amount of $96 million, which includes prejudgment interest. The Bank appealed and on December 14, 2020, the appellate court issued an opinion reversing the jury verdict and entering a plaintiffs take nothing judgment in the Company’s favor on all claims. Plaintiffs are seeking further review of the appellate court’s decision. The Company believes there are substantial defenses to these claims and intends to defend them vigorously. In October 2016, BSI was named as a defendant in a putative class action lawsuit filed in the District Court of Harris County, Texas, St. Lucie County Fire District Firefighters' Pension Trust, individually and on behalf of all others similarly situated v. Southwestern Energy Company, et al., wherein the plaintiffs allege that Southwestern Energy Company, its officers and directors, and the underwriting defendants (including BSI) made inaccurate and misleading statements in the registration statement and prospectus related to a securities offering. The plaintiffs seek unspecified monetary relief. The Company believes there are substantial defenses to these claims and intends to defend them vigorously. In March 2019, the Company and its subsidiary, Simple Finance Technology Corp., were named as defendants in a putative class action lawsuit filed in the United States District Court for the Northern District of California, Amitahbo Chattopadhyay v. BBVA USA Bancshares, Inc., et al. Plaintiff claims that Simple and the Company only permit United States citizens to open Simple accounts (which are exclusively originated through online channels). Plaintiff later amended the complaint to also take issue with BBVA USA’s practice of directing non-citizen applicants to complete the online account origination processes in a physical branch location. Plaintiff alleges that these practices constitute alienage discrimination and violations of California's Unruh Act. BBVA USA’s motion to dismiss was granted on November 2, 2020 and the plaintiffs are pursuing an appeal of that ruling. The Company believes that there are substantial defenses to these claims and intends to defend them vigorously. In July 2019, the Company was named as a defendant in a putative class action lawsuit filed in the United States District Court for the Northern District of Alabama, Ferguson v. BBVA USA Bancshares, Inc., wherein the plaintiffs allege certain investment options within the Company’s employee retirement plan violate provisions of ERISA. The plaintiffs seek unspecified monetary relief. The Company believes there are substantial defenses to these claims and intends to defend them vigorously. In April 2020, the Bank was named in a putative class action lawsuit filed in the District Court of Bexar County, Texas styled Zamora-Orduna Realty Group LLC v. BBVA USA, wherein plaintiffs allege the Bank tortiously failed to process certain loan requests submitted in connection with the federal Paycheck Protection Program. The plaintiffs seek an amount not less than $10 million along with other demands for unspecified monetary relief. The court recently entered an order granting the Company’s motion to dismiss with prejudice. Appellate options for the plaintiffs currently exist. The Company believes there are substantial defenses to these claims and intends to defend them vigorously. In April 2020, BBVA USA was named as a defendant in a lawsuit filed in the United States District Court for the Eastern District of Texas, Marshall Division originally styled Estech Systems, Inc. v. BBVA USA Bancshares, Inc., alleging that BBVA USA has violated intellectual property rights owned by the plaintiff in connection with various patents regarding voice-over-internet protocols (VoIP). The plaintiff alleges that BBVA USA’s use of certain phone 38

Table of Contents systems and technologies violate its claimed patent rights. The plaintiff seeks unspecified monetary relief. The Company believes there are substantial defenses to these claims and intends to defend them vigorously. In June 2020, BBVA USA was named as a defendant in a putative class action lawsuit filed in the United States District Court for the Southern District of California styled Sarah Hill v. BBVA USA, challenging BBVA USA’s assessment of certain overdraft fees. The plaintiffs seek unspecified monetary relief. The Company believes there are substantial defenses to these claims and intends to defend them vigorously. In July 2020, BSI was named as a defendant in a putative class action lawsuit filed in the Supreme Court of the State of New York, County of New York, City of Miami Fire Fighters’ and Police Officers’ Retirement Trust, individually and on behalf of all others similarly situated v. Occidental Petroleum Corporation, et al., wherein the plaintiffs allege that Occidental Petroleum Corporation, its officers and directors, and the underwriting defendants (including BSI) made inaccurate and misleading statements in the registration statement and prospectus related to a securities offering. The plaintiffs seek unspecified monetary relief. The court recently entered an order granting the Company’s motion to dismiss. Appellate options for the plaintiffs currently exist. The Company believes there are substantial defenses to these claims and intends to defend them vigorously. In October 2020, BBVA USA was joined in a Delaware state court action styled Yatra Online v. Ebix, et al., alleging breach of contract and tortious interference with a prospective transaction between Yatra Online and Ebix. The plaintiff seeks unspecified monetary relief. The Company believes there are substantial defenses to these claims and intends to defend them vigorously. In December 2020, BBVA USA was named as a defendant in a putative class action lawsuit filed in the United States District Court for the Southern District of California styled Eisenberg v. BBVA USA, challenging BBVA USA’s assessment of certain overdraft fees. The plaintiffs seek unspecified monetary relief. The Company believes there are substantial defenses to these claims and intends to defend them vigorously. In December 2020, the Company was named as a defendant in a putative class action lawsuit filed in the United States District Court for the Northern District of Alabama, Drake v. BBVA USA Bancshares, Inc., et al., wherein the plaintiff alleges certain investment options within the Company’s employee retirement plan violate provisions of ERISA. The plaintiffs seek unspecified monetary relief. The Company believes there are substantial defenses to these claims and intends to defend them vigorously. The Company is or may become involved from time to time in information-gathering requests, reviews, investigations and proceedings (both formal and informal) by various governmental regulatory agencies, law enforcement authorities and self-regulatory bodies regarding the Company’s business. Such matters may result in material adverse consequences, including without limitation adverse judgments, settlements, fines, penalties, orders, injunctions, alterations in the Company’s business practices or other actions, and could result in additional expenses and collateral costs, including reputational damage, which could have a material adverse impact on the Company’s business, consolidated financial position, results of operations or cash flows. The Company assesses its liabilities and contingencies in connection with outstanding legal proceedings utilizing the latest information available. Where it is probable that the Company will incur a loss and the amount of the loss can be reasonably estimated, the Company records a liability in its consolidated financial statements. These legal reserves may be increased or decreased to reflect any relevant developments. Where a loss is not probable or the amount of a probable loss is not reasonably estimable, the Company does not accrue legal reserves. At March 31, 2021, the Company had accrued legal reserves in the amount of $3 million. Additionally, for those matters where a loss is reasonably possible and the amount of loss is reasonably estimable, the Company estimates the amount of losses that it could incur beyond the accrued legal reserves, if any. Under U.S. GAAP, an event is “reasonably possible” if “the chance of the future event or events occurring is more than remote but less than likely” and an event is “remote" if “the chance of the future event or events occurring is slight.” Based on information available at March 31, 2021, management estimates no reasonably possible losses in excess of related reserves. The matters underlying this estimate will change from time to time, and the actual results may vary significantly from this estimate. Those matters for which an estimate is not possible are not included within this estimate; therefore, this estimate does not represent the Company’s maximum loss exposure. 39

Table of Contents While the outcome of legal proceedings and the timing of the ultimate resolution are inherently difficult to predict, based on information currently available, advice of counsel and available insurance coverage, the Company believes that it has established adequate legal reserves. Further, based upon available information, the Company is of the opinion that these legal proceedings, individually or in the aggregate, will not have a material adverse effect on the Company’s financial condition or results of operations. However, in the event of unexpected future developments, it is possible that the ultimate resolution of those matters, if unfavorable, may be material to the Company’s results of operations for any particular period, depending, in part, upon the size of the loss or liability imposed and the operating results for the applicable period. Income Tax Review The Company is subject to review and examination from various tax authorities. The Company is currently under examination by the IRS for the tax year 2018 and a number of states, and has received notices of proposed adjustments related to state income taxes due for prior years. Management believes that adequate provisions for income taxes have been recorded. 40
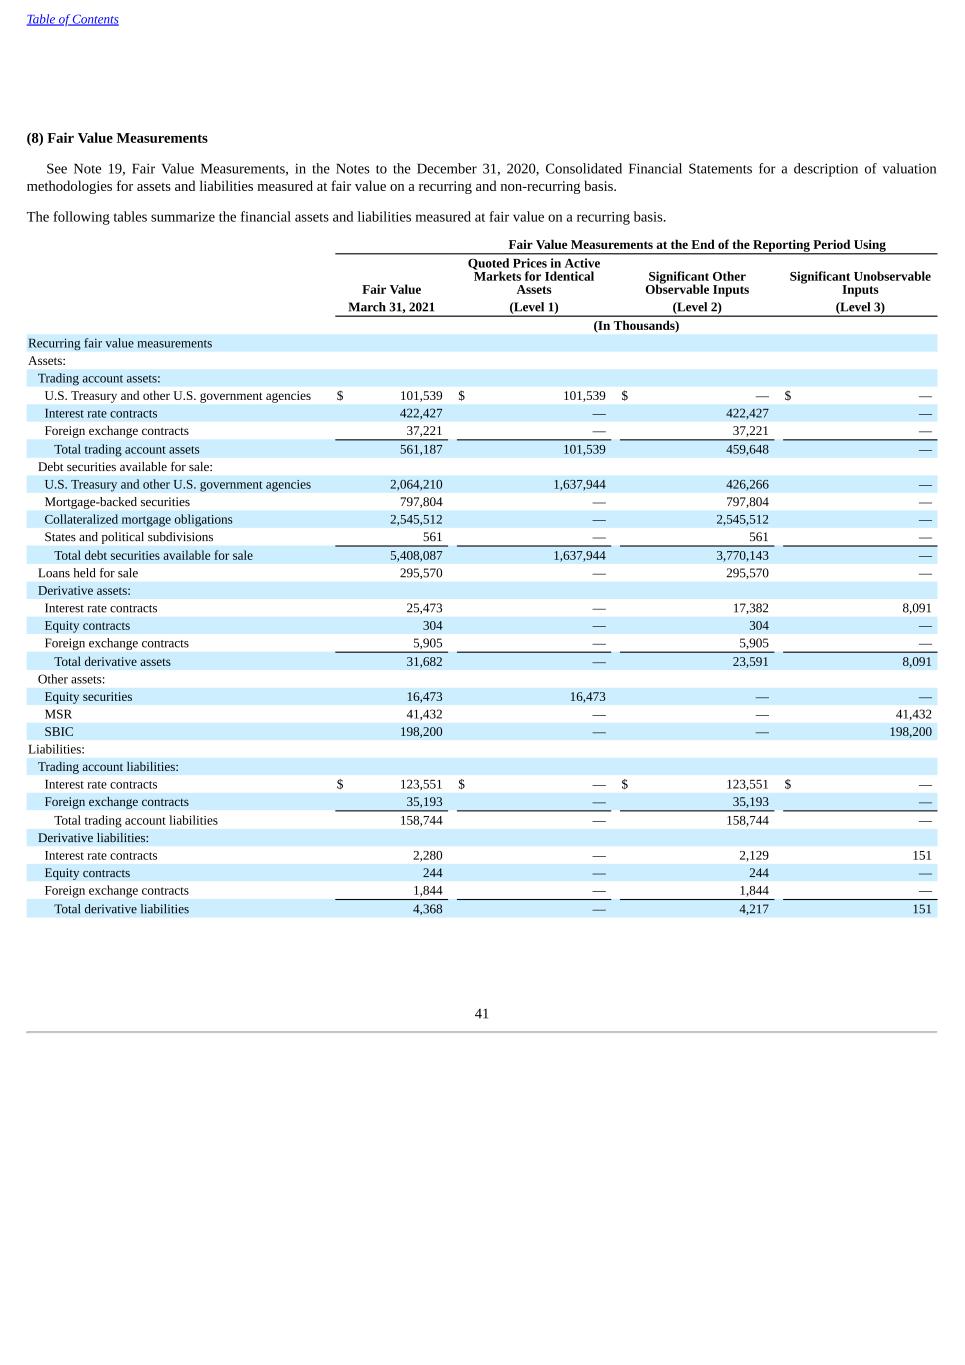
Table of Contents (8) Fair Value Measurements See Note 19, Fair Value Measurements, in the Notes to the December 31, 2020, Consolidated Financial Statements for a description of valuation methodologies for assets and liabilities measured at fair value on a recurring and non-recurring basis. The following tables summarize the financial assets and liabilities measured at fair value on a recurring basis. Fair Value Measurements at the End of the Reporting Period Using Fair Value Quoted Prices in Active Markets for Identical Assets Significant Other Observable Inputs Significant Unobservable Inputs March 31, 2021 (Level 1) (Level 2) (Level 3) (In Thousands) Recurring fair value measurements Assets: Trading account assets: U.S. Treasury and other U.S. government agencies $ 101,539 $ 101,539 $ — $ — Interest rate contracts 422,427 — 422,427 — Foreign exchange contracts 37,221 — 37,221 — Total trading account assets 561,187 101,539 459,648 — Debt securities available for sale: U.S. Treasury and other U.S. government agencies 2,064,210 1,637,944 426,266 — Mortgage-backed securities 797,804 — 797,804 — Collateralized mortgage obligations 2,545,512 — 2,545,512 — States and political subdivisions 561 — 561 — Total debt securities available for sale 5,408,087 1,637,944 3,770,143 — Loans held for sale 295,570 — 295,570 — Derivative assets: Interest rate contracts 25,473 — 17,382 8,091 Equity contracts 304 — 304 — Foreign exchange contracts 5,905 — 5,905 — Total derivative assets 31,682 — 23,591 8,091 Other assets: Equity securities 16,473 16,473 — — MSR 41,432 — — 41,432 SBIC 198,200 — — 198,200 Liabilities: Trading account liabilities: Interest rate contracts $ 123,551 $ — $ 123,551 $ — Foreign exchange contracts 35,193 — 35,193 — Total trading account liabilities 158,744 — 158,744 — Derivative liabilities: Interest rate contracts 2,280 — 2,129 151 Equity contracts 244 — 244 — Foreign exchange contracts 1,844 — 1,844 — Total derivative liabilities 4,368 — 4,217 151 41
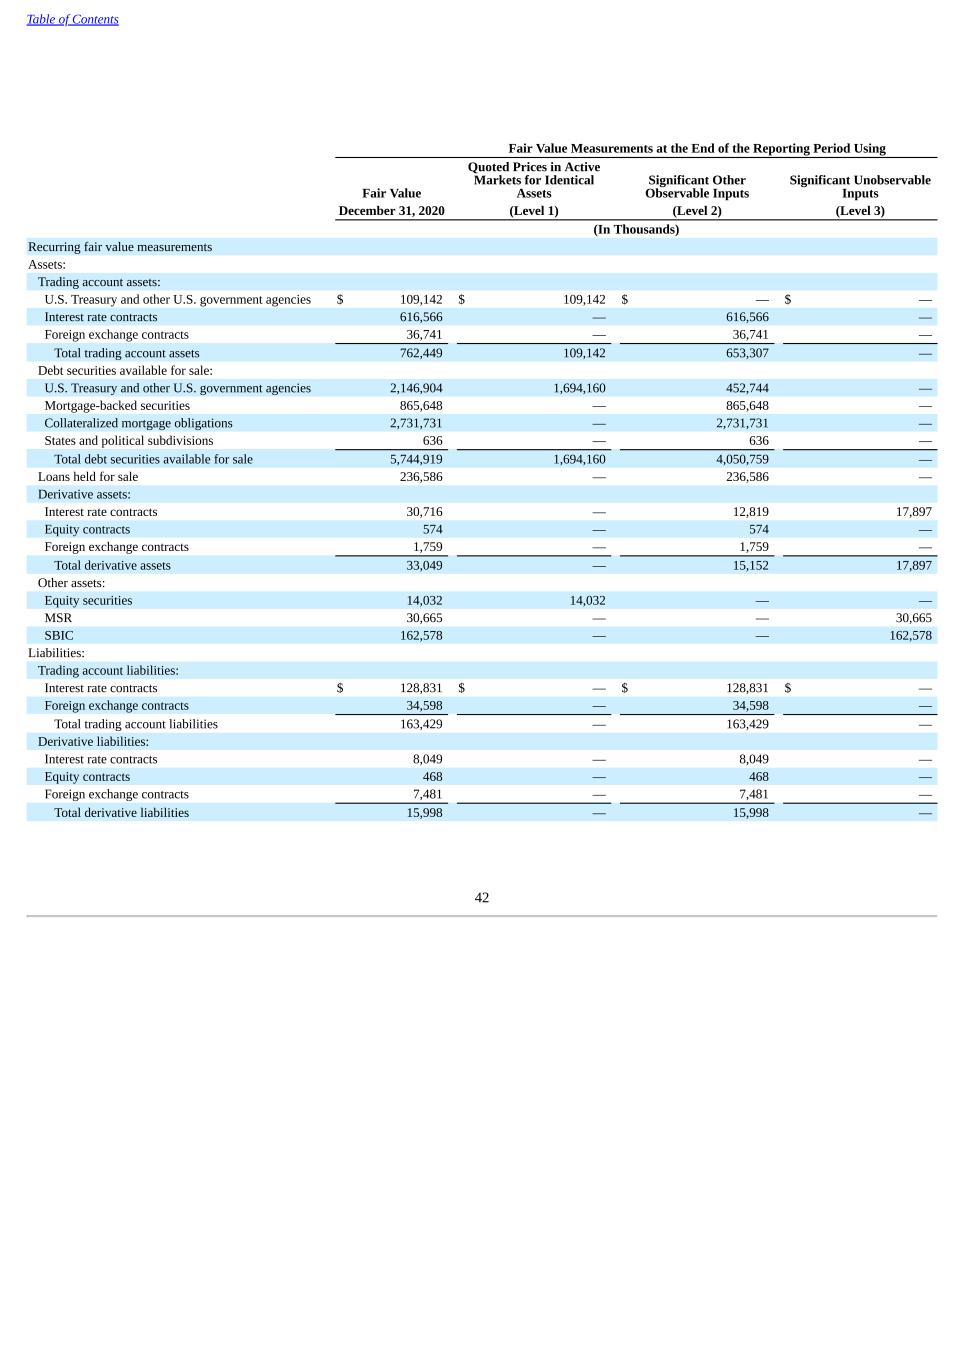
Table of Contents Fair Value Measurements at the End of the Reporting Period Using Fair Value Quoted Prices in Active Markets for Identical Assets Significant Other Observable Inputs Significant Unobservable Inputs December 31, 2020 (Level 1) (Level 2) (Level 3) (In Thousands) Recurring fair value measurements Assets: Trading account assets: U.S. Treasury and other U.S. government agencies $ 109,142 $ 109,142 $ — $ — Interest rate contracts 616,566 — 616,566 — Foreign exchange contracts 36,741 — 36,741 — Total trading account assets 762,449 109,142 653,307 — Debt securities available for sale: U.S. Treasury and other U.S. government agencies 2,146,904 1,694,160 452,744 — Mortgage-backed securities 865,648 — 865,648 — Collateralized mortgage obligations 2,731,731 — 2,731,731 — States and political subdivisions 636 — 636 — Total debt securities available for sale 5,744,919 1,694,160 4,050,759 — Loans held for sale 236,586 — 236,586 — Derivative assets: Interest rate contracts 30,716 — 12,819 17,897 Equity contracts 574 — 574 — Foreign exchange contracts 1,759 — 1,759 — Total derivative assets 33,049 — 15,152 17,897 Other assets: Equity securities 14,032 14,032 — — MSR 30,665 — — 30,665 SBIC 162,578 — — 162,578 Liabilities: Trading account liabilities: Interest rate contracts $ 128,831 $ — $ 128,831 $ — Foreign exchange contracts 34,598 — 34,598 — Total trading account liabilities 163,429 — 163,429 — Derivative liabilities: Interest rate contracts 8,049 — 8,049 — Equity contracts 468 — 468 — Foreign exchange contracts 7,481 — 7,481 — Total derivative liabilities 15,998 — 15,998 — 42
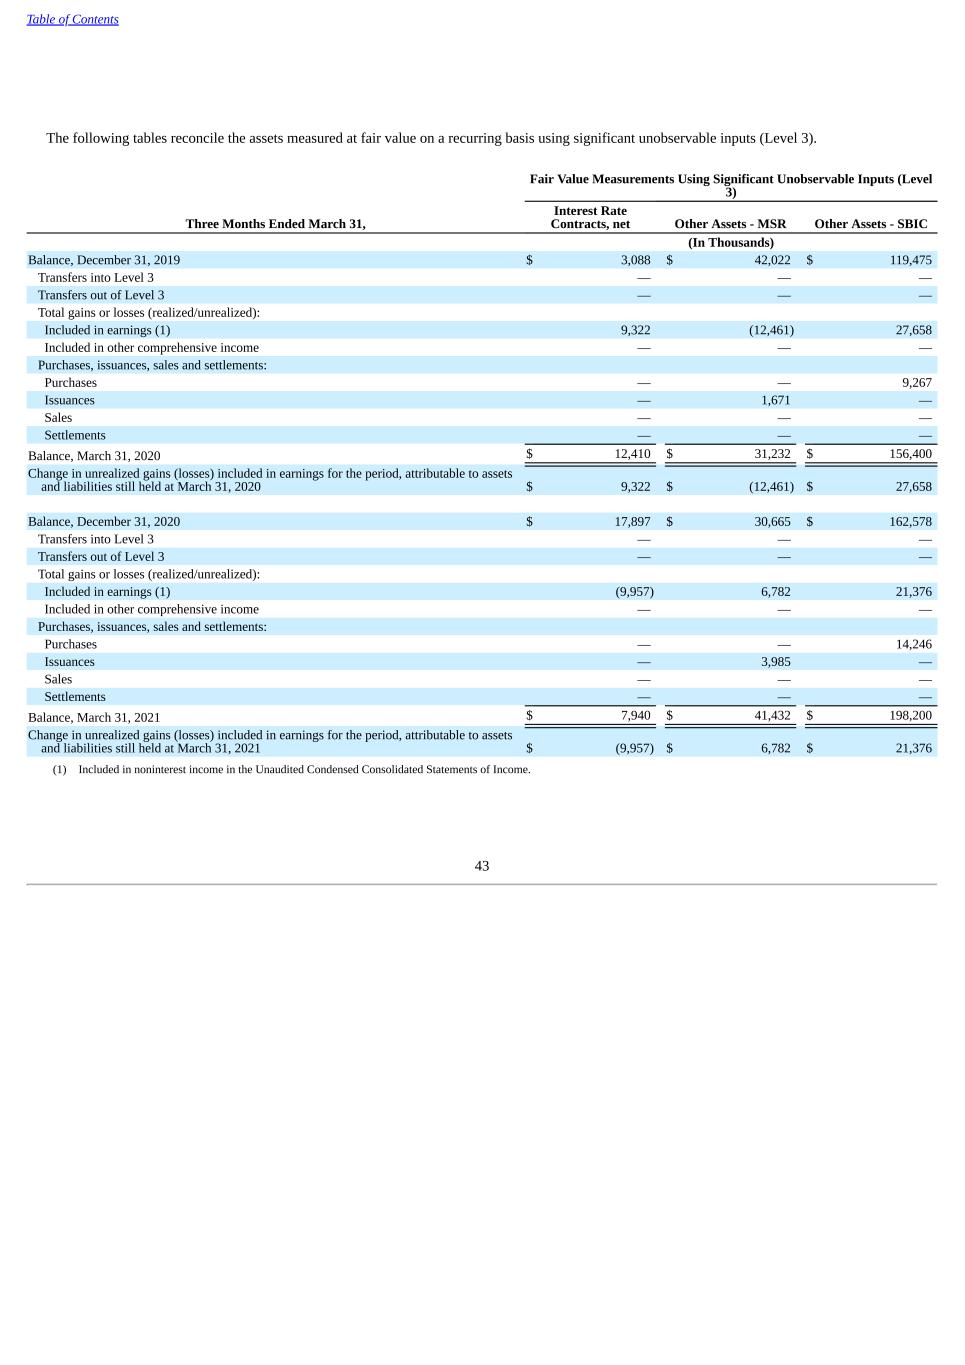
Table of Contents The following tables reconcile the assets measured at fair value on a recurring basis using significant unobservable inputs (Level 3). Fair Value Measurements Using Significant Unobservable Inputs (Level 3) Three Months Ended March 31, Interest Rate Contracts, net Other Assets - MSR Other Assets - SBIC (In Thousands) Balance, December 31, 2019 $ 3,088 $ 42,022 $ 119,475 Transfers into Level 3 — — — Transfers out of Level 3 — — — Total gains or losses (realized/unrealized): Included in earnings (1) 9,322 (12,461) 27,658 Included in other comprehensive income — — — Purchases, issuances, sales and settlements: Purchases — — 9,267 Issuances — 1,671 — Sales — — — Settlements — — — Balance, March 31, 2020 $ 12,410 $ 31,232 $ 156,400 Change in unrealized gains (losses) included in earnings for the period, attributable to assets and liabilities still held at March 31, 2020 $ 9,322 $ (12,461) $ 27,658 Balance, December 31, 2020 $ 17,897 $ 30,665 $ 162,578 Transfers into Level 3 — — — Transfers out of Level 3 — — — Total gains or losses (realized/unrealized): Included in earnings (1) (9,957) 6,782 21,376 Included in other comprehensive income — — — Purchases, issuances, sales and settlements: Purchases — — 14,246 Issuances — 3,985 — Sales — — — Settlements — — — Balance, March 31, 2021 $ 7,940 $ 41,432 $ 198,200 Change in unrealized gains (losses) included in earnings for the period, attributable to assets and liabilities still held at March 31, 2021 $ (9,957) $ 6,782 $ 21,376 (1) Included in noninterest income in the Unaudited Condensed Consolidated Statements of Income. 43
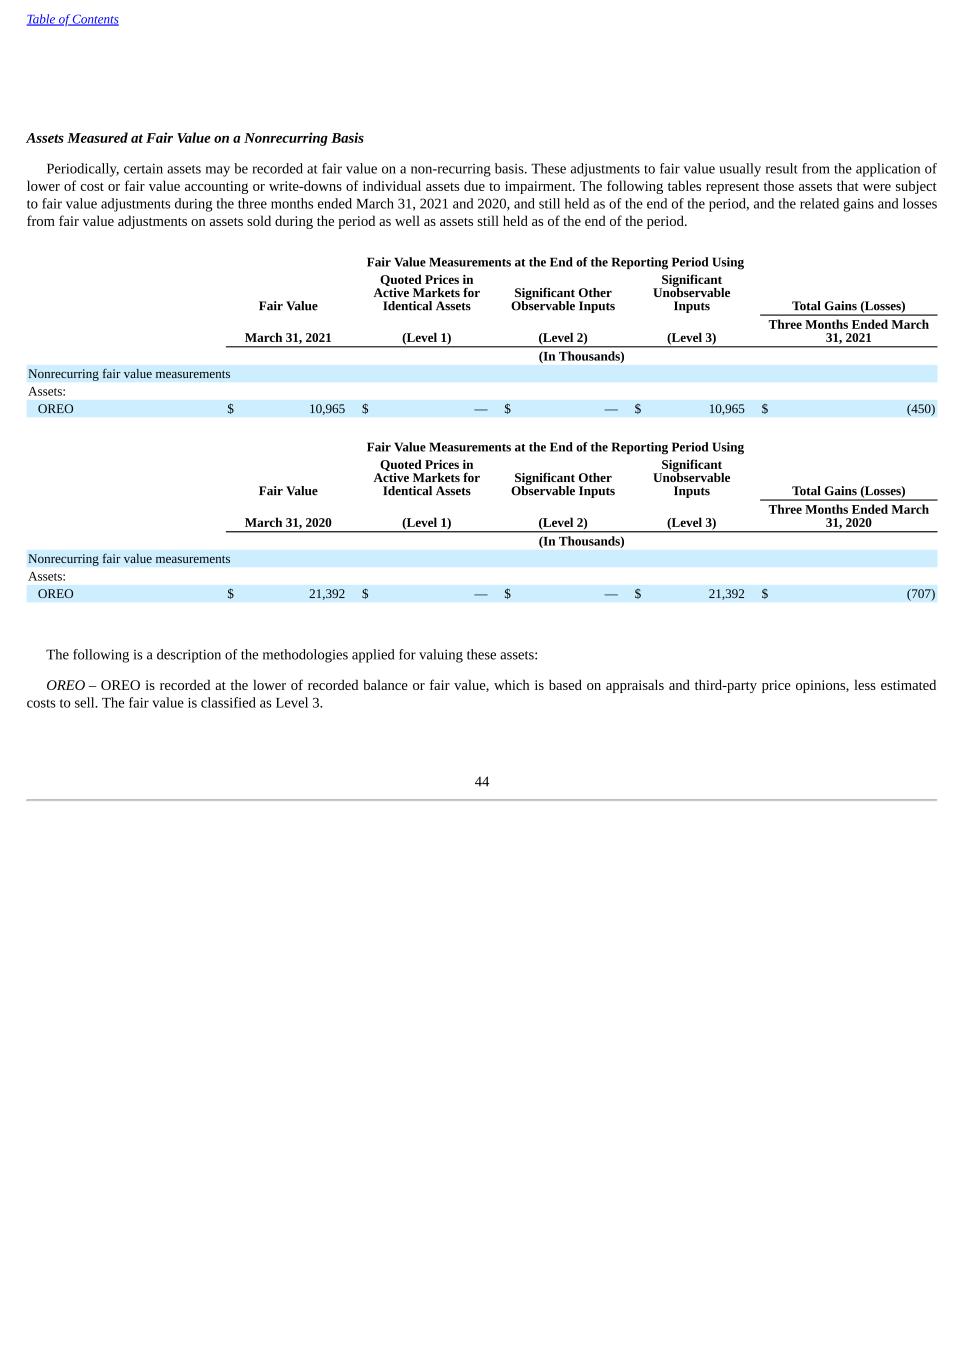
Table of Contents Assets Measured at Fair Value on a Nonrecurring Basis Periodically, certain assets may be recorded at fair value on a non-recurring basis. These adjustments to fair value usually result from the application of lower of cost or fair value accounting or write-downs of individual assets due to impairment. The following tables represent those assets that were subject to fair value adjustments during the three months ended March 31, 2021 and 2020, and still held as of the end of the period, and the related gains and losses from fair value adjustments on assets sold during the period as well as assets still held as of the end of the period. Fair Value Measurements at the End of the Reporting Period Using Fair Value Quoted Prices in Active Markets for Identical Assets Significant Other Observable Inputs Significant Unobservable Inputs Total Gains (Losses) March 31, 2021 (Level 1) (Level 2) (Level 3) Three Months Ended March 31, 2021 (In Thousands) Nonrecurring fair value measurements Assets: OREO $ 10,965 $ — $ — $ 10,965 $ (450) Fair Value Measurements at the End of the Reporting Period Using Fair Value Quoted Prices in Active Markets for Identical Assets Significant Other Observable Inputs Significant Unobservable Inputs Total Gains (Losses) March 31, 2020 (Level 1) (Level 2) (Level 3) Three Months Ended March 31, 2020 (In Thousands) Nonrecurring fair value measurements Assets: OREO $ 21,392 $ — $ — $ 21,392 $ (707) The following is a description of the methodologies applied for valuing these assets: OREO – OREO is recorded at the lower of recorded balance or fair value, which is based on appraisals and third-party price opinions, less estimated costs to sell. The fair value is classified as Level 3. 44
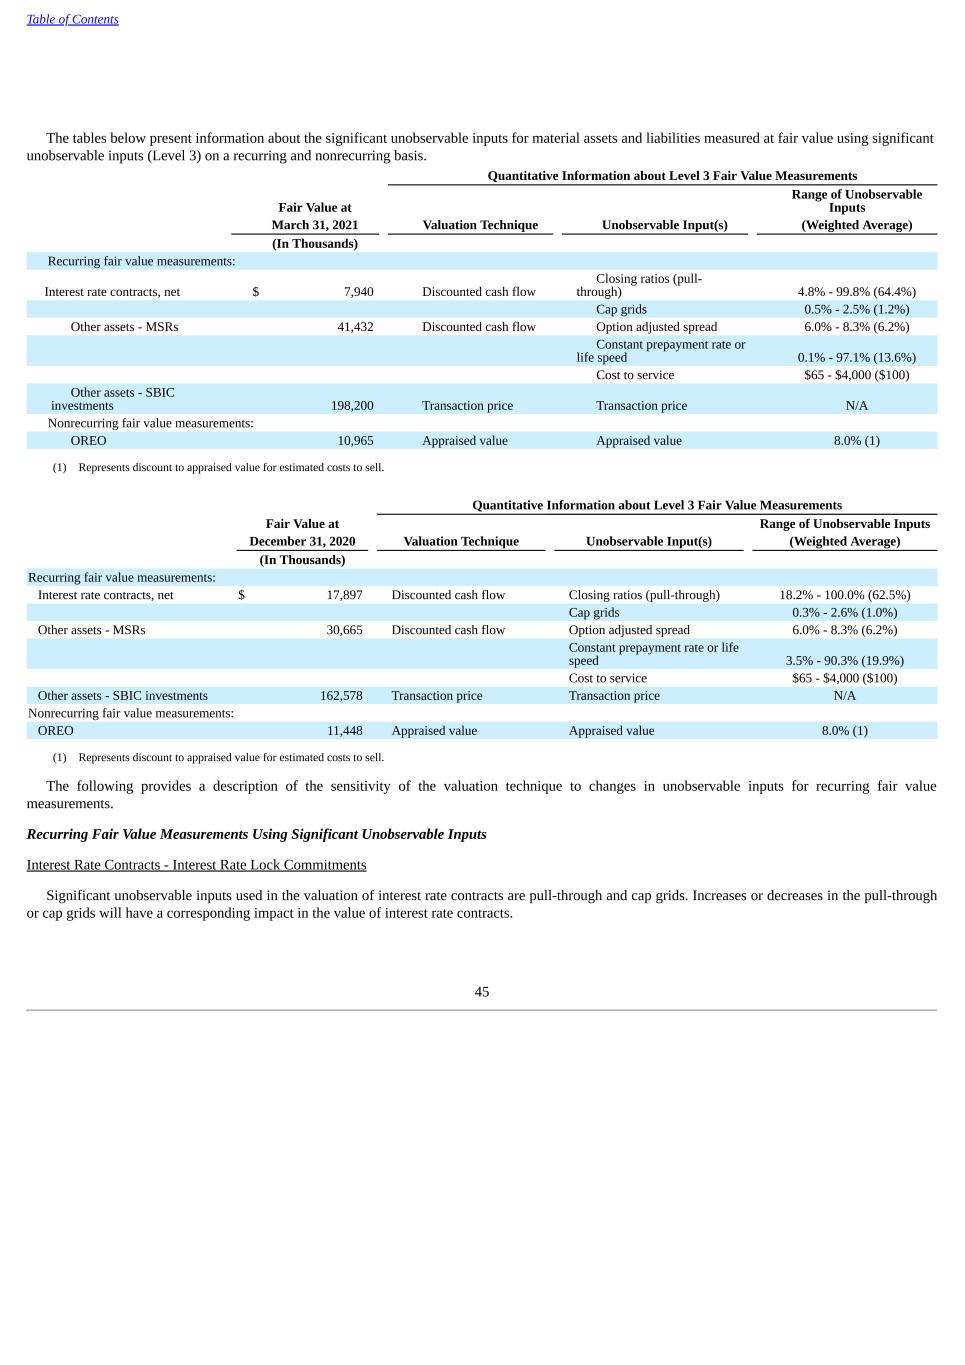
Table of Contents The tables below present information about the significant unobservable inputs for material assets and liabilities measured at fair value using significant unobservable inputs (Level 3) on a recurring and nonrecurring basis. Quantitative Information about Level 3 Fair Value Measurements Fair Value at Range of Unobservable Inputs March 31, 2021 Valuation Technique Unobservable Input(s) (Weighted Average) (In Thousands) Recurring fair value measurements: Interest rate contracts, net $ 7,940 Discounted cash flow Closing ratios (pull- through) 4.8% - 99.8% (64.4%) Cap grids 0.5% - 2.5% (1.2%) Other assets - MSRs 41,432 Discounted cash flow Option adjusted spread 6.0% - 8.3% (6.2%) Constant prepayment rate or life speed 0.1% - 97.1% (13.6%) Cost to service $65 - $4,000 ($100) Other assets - SBIC investments 198,200 Transaction price Transaction price N/A Nonrecurring fair value measurements: OREO 10,965 Appraised value Appraised value 8.0% (1) (1) Represents discount to appraised value for estimated costs to sell. Quantitative Information about Level 3 Fair Value Measurements Fair Value at Range of Unobservable Inputs December 31, 2020 Valuation Technique Unobservable Input(s) (Weighted Average) (In Thousands) Recurring fair value measurements: Interest rate contracts, net $ 17,897 Discounted cash flow Closing ratios (pull-through) 18.2% - 100.0% (62.5%) Cap grids 0.3% - 2.6% (1.0%) Other assets - MSRs 30,665 Discounted cash flow Option adjusted spread 6.0% - 8.3% (6.2%) Constant prepayment rate or life speed 3.5% - 90.3% (19.9%) Cost to service $65 - $4,000 ($100) Other assets - SBIC investments 162,578 Transaction price Transaction price N/A Nonrecurring fair value measurements: OREO 11,448 Appraised value Appraised value 8.0% (1) (1) Represents discount to appraised value for estimated costs to sell. The following provides a description of the sensitivity of the valuation technique to changes in unobservable inputs for recurring fair value measurements. Recurring Fair Value Measurements Using Significant Unobservable Inputs Interest Rate Contracts - Interest Rate Lock Commitments Significant unobservable inputs used in the valuation of interest rate contracts are pull-through and cap grids. Increases or decreases in the pull-through or cap grids will have a corresponding impact in the value of interest rate contracts. 45
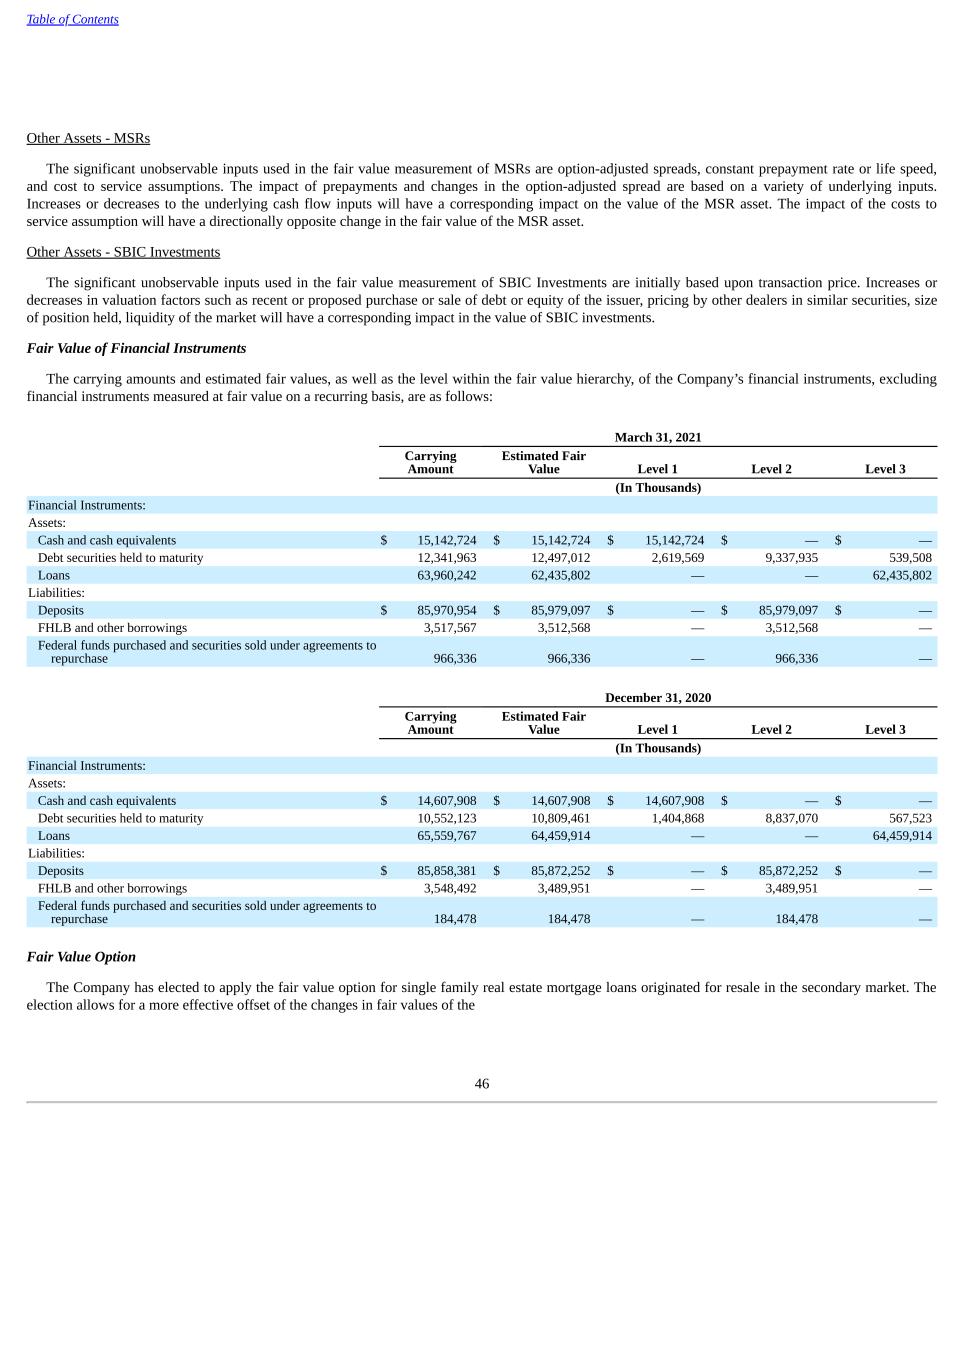
Table of Contents Other Assets - MSRs The significant unobservable inputs used in the fair value measurement of MSRs are option-adjusted spreads, constant prepayment rate or life speed, and cost to service assumptions. The impact of prepayments and changes in the option-adjusted spread are based on a variety of underlying inputs. Increases or decreases to the underlying cash flow inputs will have a corresponding impact on the value of the MSR asset. The impact of the costs to service assumption will have a directionally opposite change in the fair value of the MSR asset. Other Assets - SBIC Investments The significant unobservable inputs used in the fair value measurement of SBIC Investments are initially based upon transaction price. Increases or decreases in valuation factors such as recent or proposed purchase or sale of debt or equity of the issuer, pricing by other dealers in similar securities, size of position held, liquidity of the market will have a corresponding impact in the value of SBIC investments. Fair Value of Financial Instruments The carrying amounts and estimated fair values, as well as the level within the fair value hierarchy, of the Company’s financial instruments, excluding financial instruments measured at fair value on a recurring basis, are as follows: March 31, 2021 Carrying Amount Estimated Fair Value Level 1 Level 2 Level 3 (In Thousands) Financial Instruments: Assets: Cash and cash equivalents $ 15,142,724 $ 15,142,724 $ 15,142,724 $ — $ — Debt securities held to maturity 12,341,963 12,497,012 2,619,569 9,337,935 539,508 Loans 63,960,242 62,435,802 — — 62,435,802 Liabilities: Deposits $ 85,970,954 $ 85,979,097 $ — $ 85,979,097 $ — FHLB and other borrowings 3,517,567 3,512,568 — 3,512,568 — Federal funds purchased and securities sold under agreements to repurchase 966,336 966,336 — 966,336 — December 31, 2020 Carrying Amount Estimated Fair Value Level 1 Level 2 Level 3 (In Thousands) Financial Instruments: Assets: Cash and cash equivalents $ 14,607,908 $ 14,607,908 $ 14,607,908 $ — $ — Debt securities held to maturity 10,552,123 10,809,461 1,404,868 8,837,070 567,523 Loans 65,559,767 64,459,914 — — 64,459,914 Liabilities: Deposits $ 85,858,381 $ 85,872,252 $ — $ 85,872,252 $ — FHLB and other borrowings 3,548,492 3,489,951 — 3,489,951 — Federal funds purchased and securities sold under agreements to repurchase 184,478 184,478 — 184,478 — Fair Value Option The Company has elected to apply the fair value option for single family real estate mortgage loans originated for resale in the secondary market. The election allows for a more effective offset of the changes in fair values of the 46
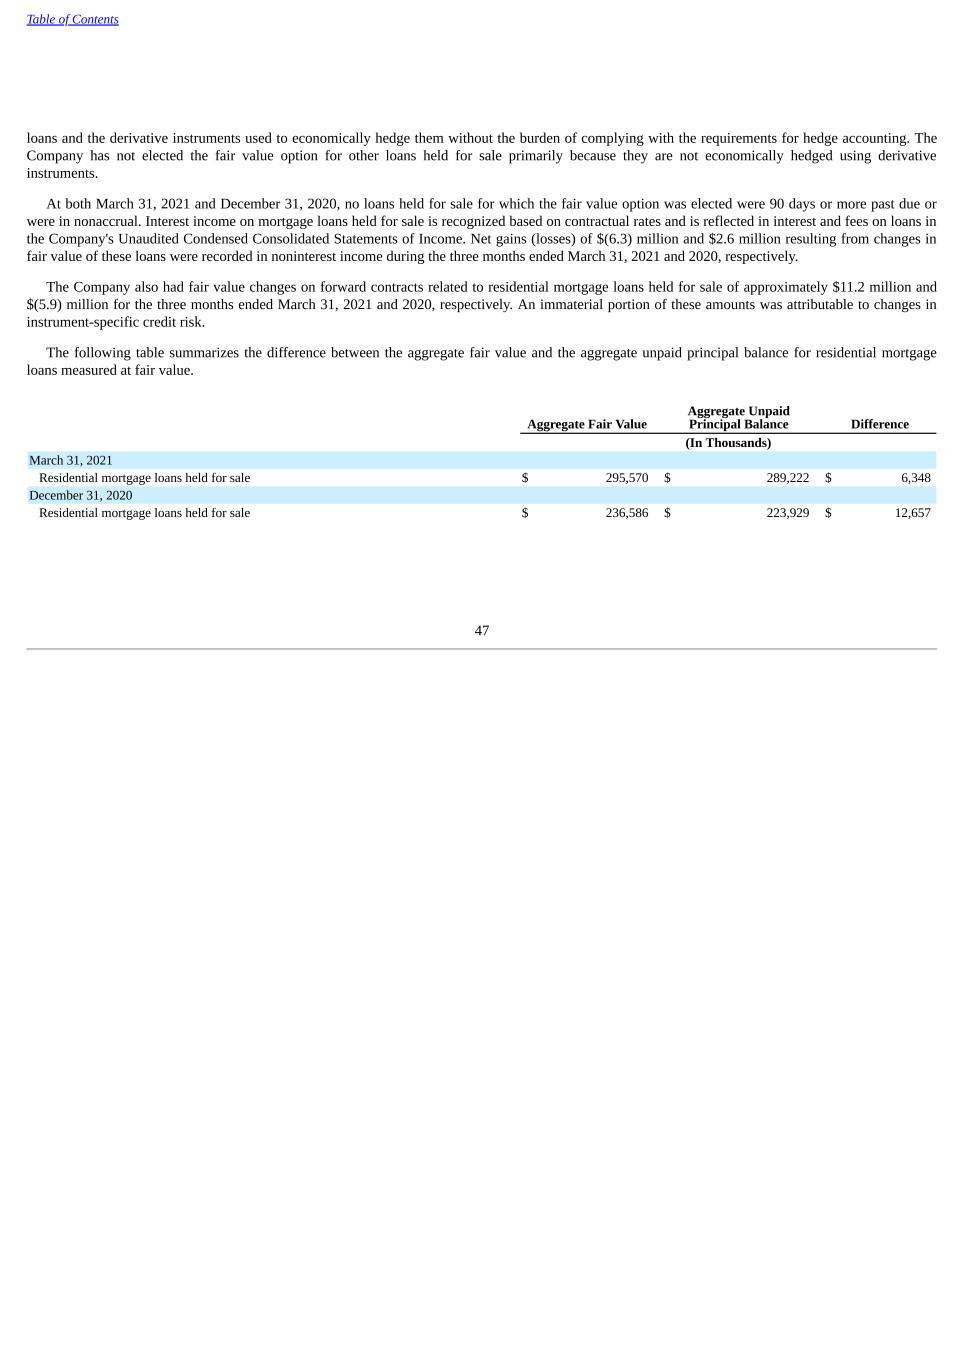
Table of Contents loans and the derivative instruments used to economically hedge them without the burden of complying with the requirements for hedge accounting. The Company has not elected the fair value option for other loans held for sale primarily because they are not economically hedged using derivative instruments. At both March 31, 2021 and December 31, 2020, no loans held for sale for which the fair value option was elected were 90 days or more past due or were in nonaccrual. Interest income on mortgage loans held for sale is recognized based on contractual rates and is reflected in interest and fees on loans in the Company's Unaudited Condensed Consolidated Statements of Income. Net gains (losses) of $(6.3) million and $2.6 million resulting from changes in fair value of these loans were recorded in noninterest income during the three months ended March 31, 2021 and 2020, respectively. The Company also had fair value changes on forward contracts related to residential mortgage loans held for sale of approximately $11.2 million and $(5.9) million for the three months ended March 31, 2021 and 2020, respectively. An immaterial portion of these amounts was attributable to changes in instrument-specific credit risk. The following table summarizes the difference between the aggregate fair value and the aggregate unpaid principal balance for residential mortgage loans measured at fair value. Aggregate Fair Value Aggregate Unpaid Principal Balance Difference (In Thousands) March 31, 2021 Residential mortgage loans held for sale $ 295,570 $ 289,222 $ 6,348 December 31, 2020 Residential mortgage loans held for sale $ 236,586 $ 223,929 $ 12,657 47
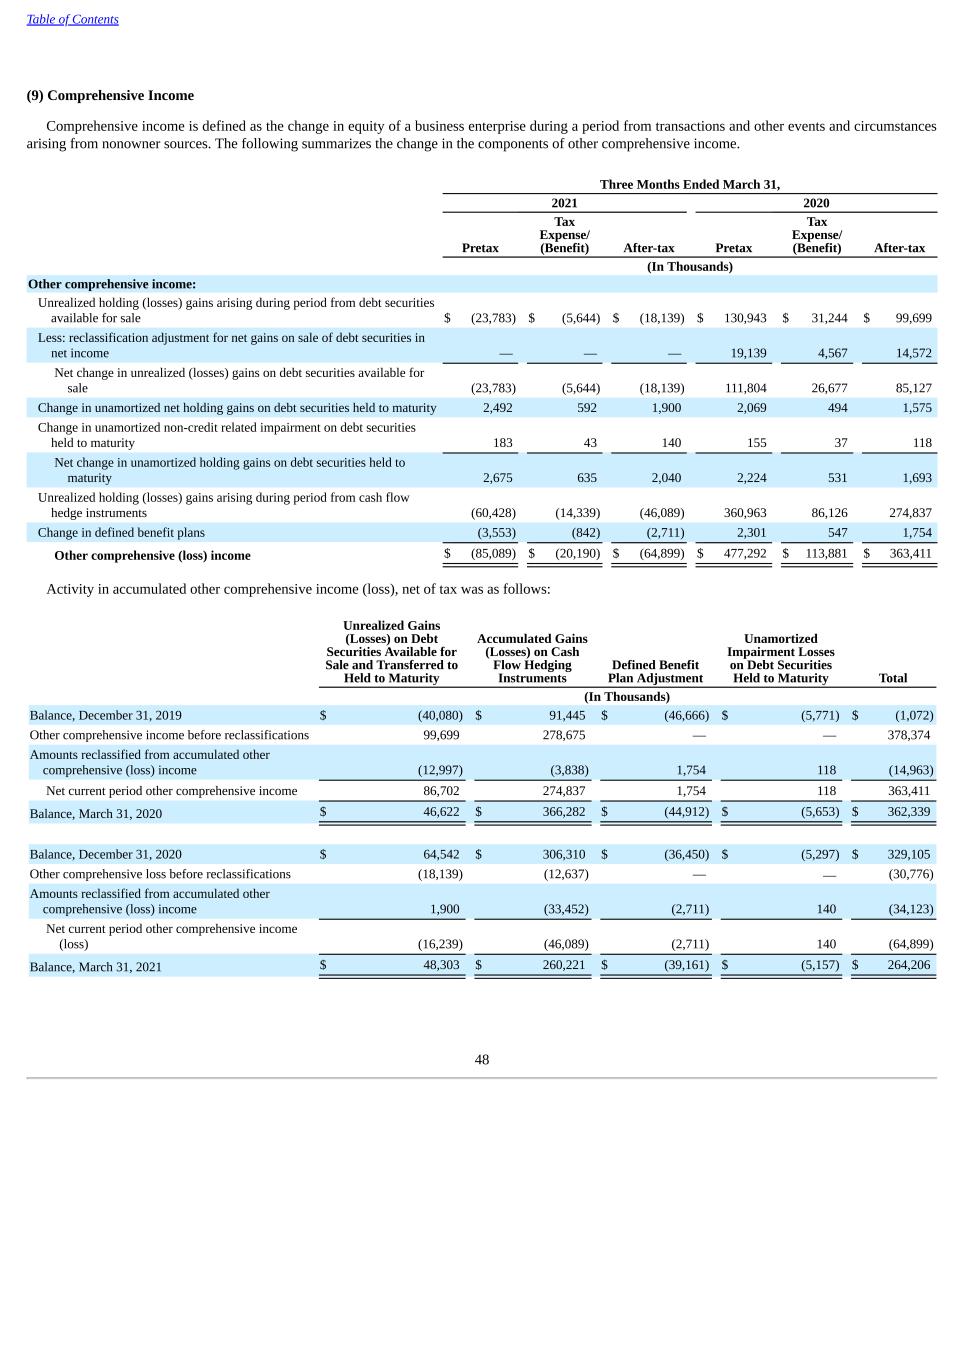
Table of Contents (9) Comprehensive Income Comprehensive income is defined as the change in equity of a business enterprise during a period from transactions and other events and circumstances arising from nonowner sources. The following summarizes the change in the components of other comprehensive income. Three Months Ended March 31, 2021 2020 Pretax Tax Expense/ (Benefit) After-tax Pretax Tax Expense/ (Benefit) After-tax (In Thousands) Other comprehensive income: Unrealized holding (losses) gains arising during period from debt securities available for sale $ (23,783) $ (5,644) $ (18,139) $ 130,943 $ 31,244 $ 99,699 Less: reclassification adjustment for net gains on sale of debt securities in net income — — — 19,139 4,567 14,572 Net change in unrealized (losses) gains on debt securities available for sale (23,783) (5,644) (18,139) 111,804 26,677 85,127 Change in unamortized net holding gains on debt securities held to maturity 2,492 592 1,900 2,069 494 1,575 Change in unamortized non-credit related impairment on debt securities held to maturity 183 43 140 155 37 118 Net change in unamortized holding gains on debt securities held to maturity 2,675 635 2,040 2,224 531 1,693 Unrealized holding (losses) gains arising during period from cash flow hedge instruments (60,428) (14,339) (46,089) 360,963 86,126 274,837 Change in defined benefit plans (3,553) (842) (2,711) 2,301 547 1,754 Other comprehensive (loss) income $ (85,089) $ (20,190) $ (64,899) $ 477,292 $ 113,881 $ 363,411 Activity in accumulated other comprehensive income (loss), net of tax was as follows: Unrealized Gains (Losses) on Debt Securities Available for Sale and Transferred to Held to Maturity Accumulated Gains (Losses) on Cash Flow Hedging Instruments Defined Benefit Plan Adjustment Unamortized Impairment Losses on Debt Securities Held to Maturity Total (In Thousands) Balance, December 31, 2019 $ (40,080) $ 91,445 $ (46,666) $ (5,771) $ (1,072) Other comprehensive income before reclassifications 99,699 278,675 — — 378,374 Amounts reclassified from accumulated other comprehensive (loss) income (12,997) (3,838) 1,754 118 (14,963) Net current period other comprehensive income 86,702 274,837 1,754 118 363,411 Balance, March 31, 2020 $ 46,622 $ 366,282 $ (44,912) $ (5,653) $ 362,339 Balance, December 31, 2020 $ 64,542 $ 306,310 $ (36,450) $ (5,297) $ 329,105 Other comprehensive loss before reclassifications (18,139) (12,637) — — (30,776) Amounts reclassified from accumulated other comprehensive (loss) income 1,900 (33,452) (2,711) 140 (34,123) Net current period other comprehensive income (loss) (16,239) (46,089) (2,711) 140 (64,899) Balance, March 31, 2021 $ 48,303 $ 260,221 $ (39,161) $ (5,157) $ 264,206 48
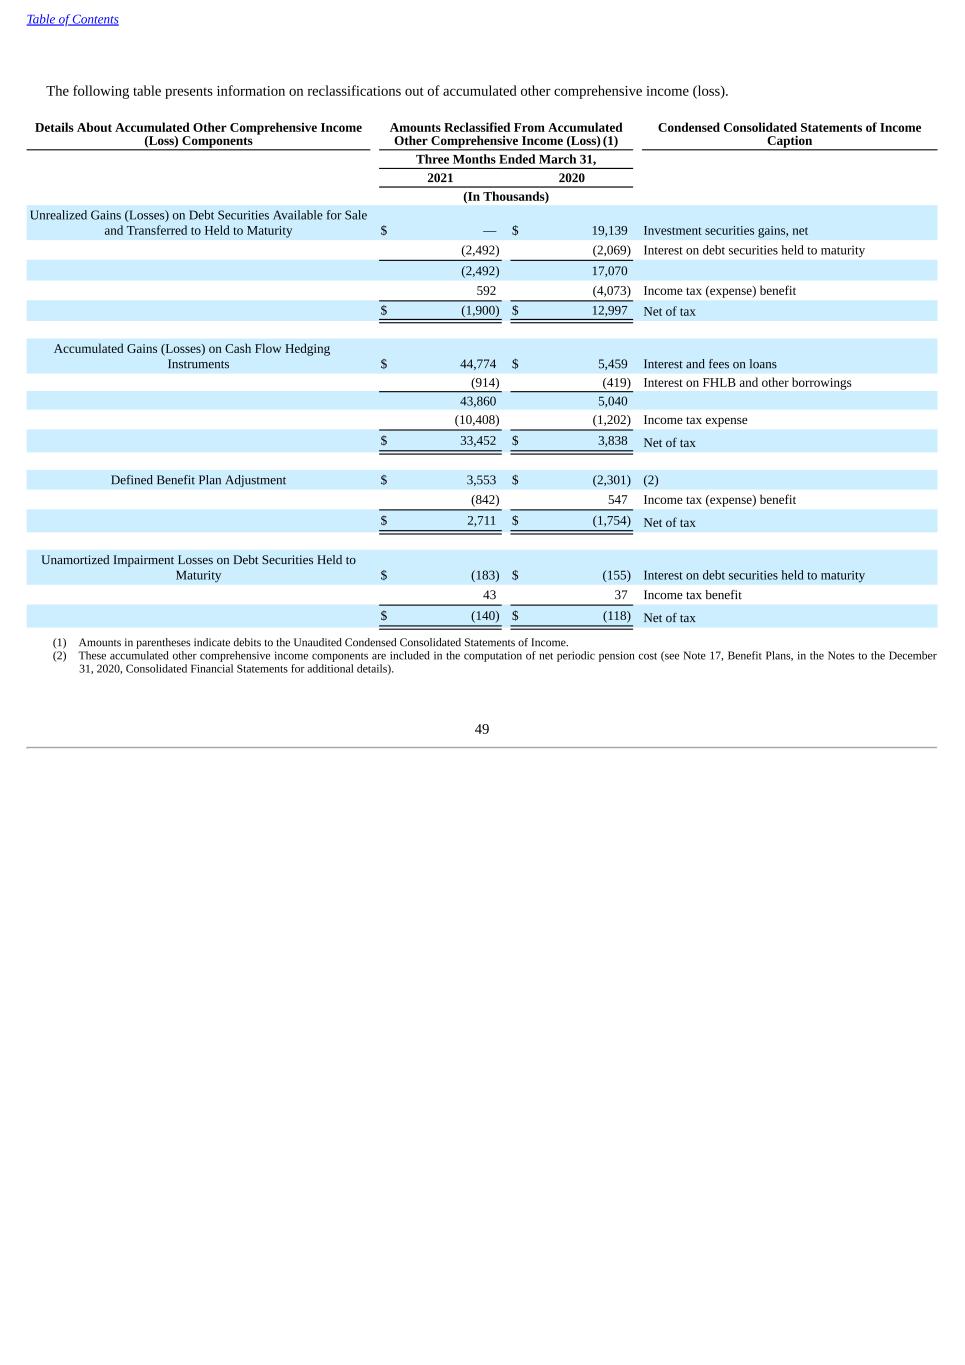
Table of Contents The following table presents information on reclassifications out of accumulated other comprehensive income (loss). Details About Accumulated Other Comprehensive Income (Loss) Components Amounts Reclassified From Accumulated Other Comprehensive Income (Loss) (1) Condensed Consolidated Statements of Income Caption Three Months Ended March 31, 2021 2020 (In Thousands) Unrealized Gains (Losses) on Debt Securities Available for Sale and Transferred to Held to Maturity $ — $ 19,139 Investment securities gains, net (2,492) (2,069) Interest on debt securities held to maturity (2,492) 17,070 592 (4,073) Income tax (expense) benefit $ (1,900) $ 12,997 Net of tax Accumulated Gains (Losses) on Cash Flow Hedging Instruments $ 44,774 $ 5,459 Interest and fees on loans (914) (419) Interest on FHLB and other borrowings 43,860 5,040 (10,408) (1,202) Income tax expense $ 33,452 $ 3,838 Net of tax Defined Benefit Plan Adjustment $ 3,553 $ (2,301) (2) (842) 547 Income tax (expense) benefit $ 2,711 $ (1,754) Net of tax Unamortized Impairment Losses on Debt Securities Held to Maturity $ (183) $ (155) Interest on debt securities held to maturity 43 37 Income tax benefit $ (140) $ (118) Net of tax (1) Amounts in parentheses indicate debits to the Unaudited Condensed Consolidated Statements of Income. (2) These accumulated other comprehensive income components are included in the computation of net periodic pension cost (see Note 17, Benefit Plans, in the Notes to the December 31, 2020, Consolidated Financial Statements for additional details). 49
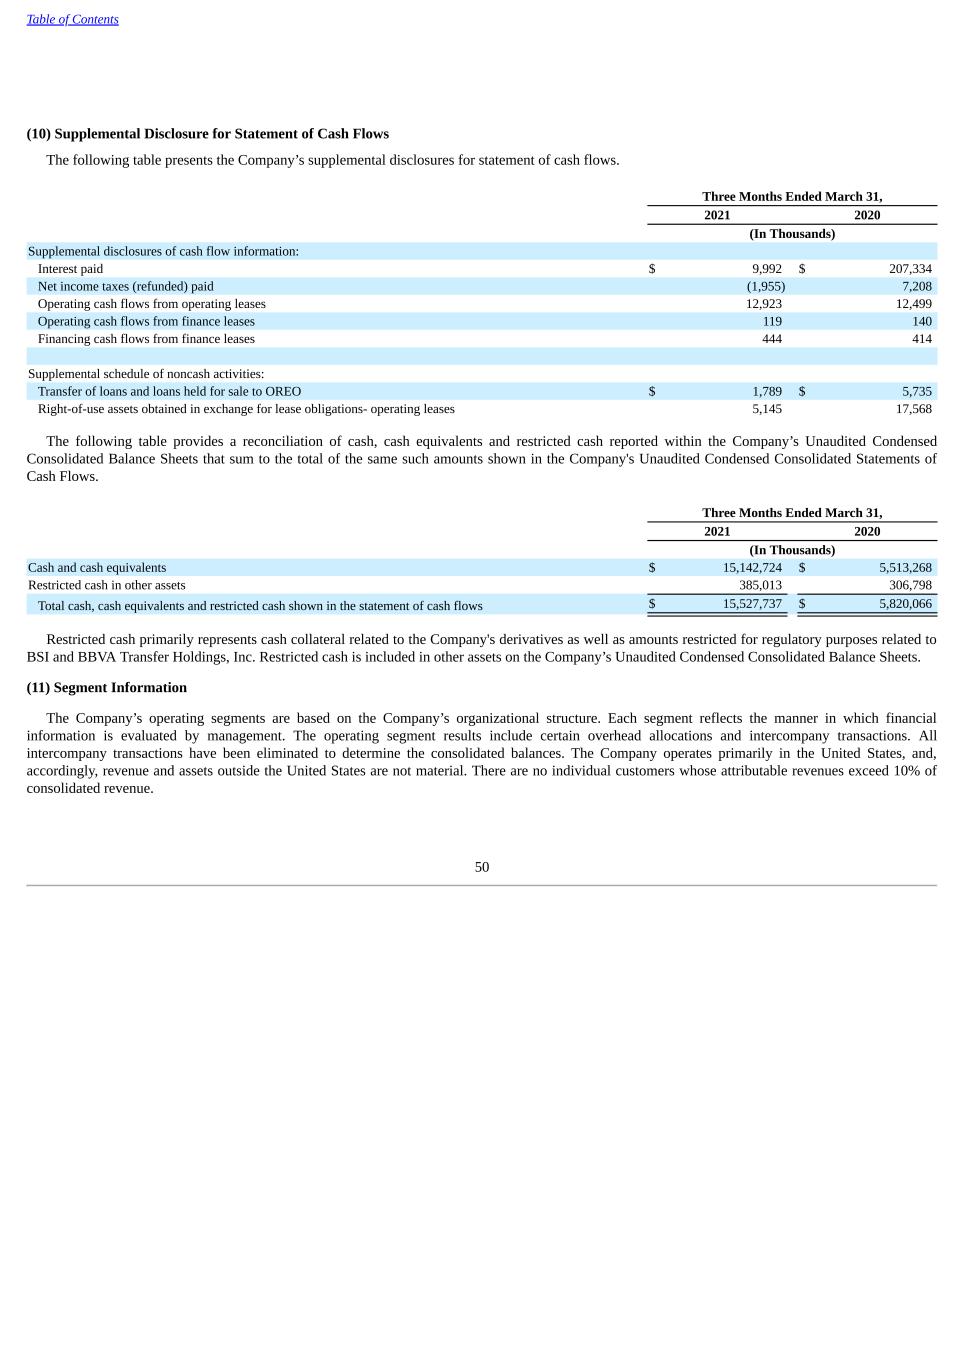
Table of Contents (10) Supplemental Disclosure for Statement of Cash Flows The following table presents the Company’s supplemental disclosures for statement of cash flows. Three Months Ended March 31, 2021 2020 (In Thousands) Supplemental disclosures of cash flow information: Interest paid $ 9,992 $ 207,334 Net income taxes (refunded) paid (1,955) 7,208 Operating cash flows from operating leases 12,923 12,499 Operating cash flows from finance leases 119 140 Financing cash flows from finance leases 444 414 Supplemental schedule of noncash activities: Transfer of loans and loans held for sale to OREO $ 1,789 $ 5,735 Right-of-use assets obtained in exchange for lease obligations- operating leases 5,145 17,568 The following table provides a reconciliation of cash, cash equivalents and restricted cash reported within the Company’s Unaudited Condensed Consolidated Balance Sheets that sum to the total of the same such amounts shown in the Company's Unaudited Condensed Consolidated Statements of Cash Flows. Three Months Ended March 31, 2021 2020 (In Thousands) Cash and cash equivalents $ 15,142,724 $ 5,513,268 Restricted cash in other assets 385,013 306,798 Total cash, cash equivalents and restricted cash shown in the statement of cash flows $ 15,527,737 $ 5,820,066 Restricted cash primarily represents cash collateral related to the Company's derivatives as well as amounts restricted for regulatory purposes related to BSI and BBVA Transfer Holdings, Inc. Restricted cash is included in other assets on the Company’s Unaudited Condensed Consolidated Balance Sheets. (11) Segment Information The Company’s operating segments are based on the Company’s organizational structure. Each segment reflects the manner in which financial information is evaluated by management. The operating segment results include certain overhead allocations and intercompany transactions. All intercompany transactions have been eliminated to determine the consolidated balances. The Company operates primarily in the United States, and, accordingly, revenue and assets outside the United States are not material. There are no individual customers whose attributable revenues exceed 10% of consolidated revenue. 50
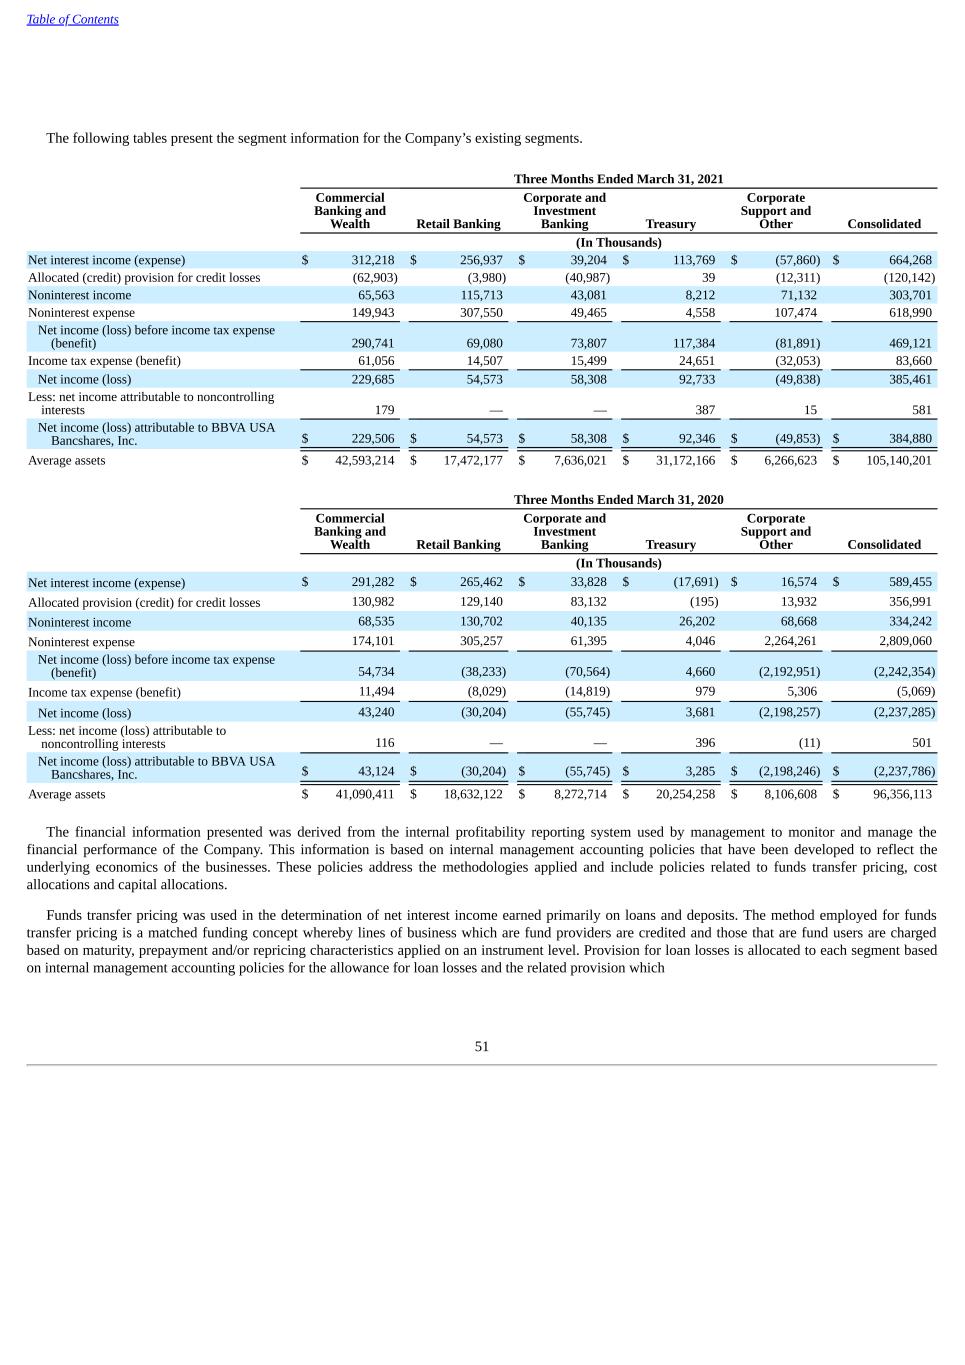
Table of Contents The following tables present the segment information for the Company’s existing segments. Three Months Ended March 31, 2021 Commercial Banking and Wealth Retail Banking Corporate and Investment Banking Treasury Corporate Support and Other Consolidated (In Thousands) Net interest income (expense) $ 312,218 $ 256,937 $ 39,204 $ 113,769 $ (57,860) $ 664,268 Allocated (credit) provision for credit losses (62,903) (3,980) (40,987) 39 (12,311) (120,142) Noninterest income 65,563 115,713 43,081 8,212 71,132 303,701 Noninterest expense 149,943 307,550 49,465 4,558 107,474 618,990 Net income (loss) before income tax expense (benefit) 290,741 69,080 73,807 117,384 (81,891) 469,121 Income tax expense (benefit) 61,056 14,507 15,499 24,651 (32,053) 83,660 Net income (loss) 229,685 54,573 58,308 92,733 (49,838) 385,461 Less: net income attributable to noncontrolling interests 179 — — 387 15 581 Net income (loss) attributable to BBVA USA Bancshares, Inc. $ 229,506 $ 54,573 $ 58,308 $ 92,346 $ (49,853) $ 384,880 Average assets $ 42,593,214 $ 17,472,177 $ 7,636,021 $ 31,172,166 $ 6,266,623 $ 105,140,201 Three Months Ended March 31, 2020 Commercial Banking and Wealth Retail Banking Corporate and Investment Banking Treasury Corporate Support and Other Consolidated (In Thousands) Net interest income (expense) $ 291,282 $ 265,462 $ 33,828 $ (17,691) $ 16,574 $ 589,455 Allocated provision (credit) for credit losses 130,982 129,140 83,132 (195) 13,932 356,991 Noninterest income 68,535 130,702 40,135 26,202 68,668 334,242 Noninterest expense 174,101 305,257 61,395 4,046 2,264,261 2,809,060 Net income (loss) before income tax expense (benefit) 54,734 (38,233) (70,564) 4,660 (2,192,951) (2,242,354) Income tax expense (benefit) 11,494 (8,029) (14,819) 979 5,306 (5,069) Net income (loss) 43,240 (30,204) (55,745) 3,681 (2,198,257) (2,237,285) Less: net income (loss) attributable to noncontrolling interests 116 — — 396 (11) 501 Net income (loss) attributable to BBVA USA Bancshares, Inc. $ 43,124 $ (30,204) $ (55,745) $ 3,285 $ (2,198,246) $ (2,237,786) Average assets $ 41,090,411 $ 18,632,122 $ 8,272,714 $ 20,254,258 $ 8,106,608 $ 96,356,113 The financial information presented was derived from the internal profitability reporting system used by management to monitor and manage the financial performance of the Company. This information is based on internal management accounting policies that have been developed to reflect the underlying economics of the businesses. These policies address the methodologies applied and include policies related to funds transfer pricing, cost allocations and capital allocations. Funds transfer pricing was used in the determination of net interest income earned primarily on loans and deposits. The method employed for funds transfer pricing is a matched funding concept whereby lines of business which are fund providers are credited and those that are fund users are charged based on maturity, prepayment and/or repricing characteristics applied on an instrument level. Provision for loan losses is allocated to each segment based on internal management accounting policies for the allowance for loan losses and the related provision which 51
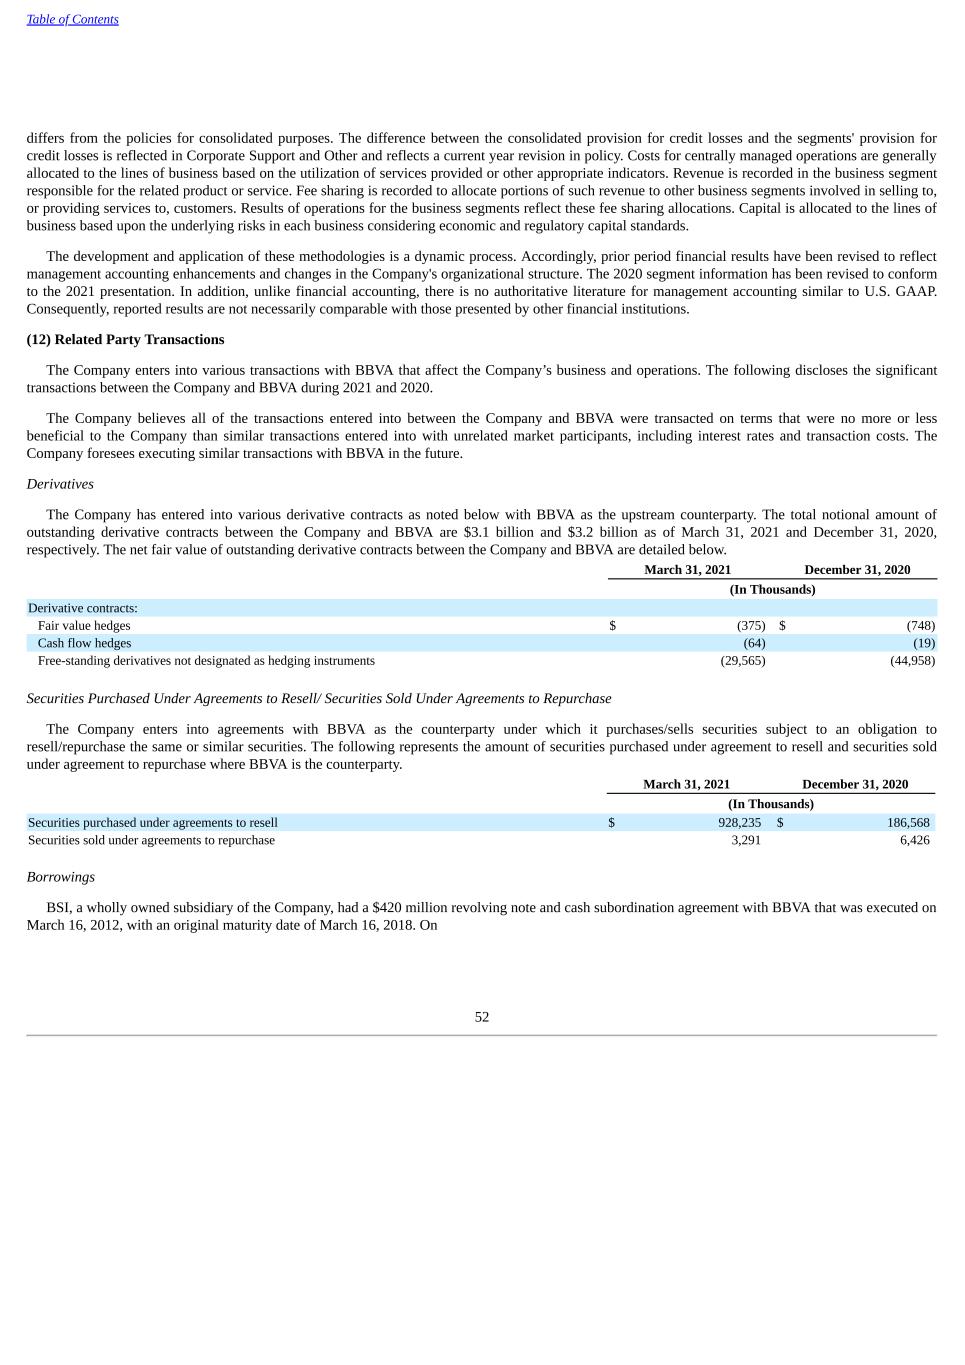
Table of Contents differs from the policies for consolidated purposes. The difference between the consolidated provision for credit losses and the segments' provision for credit losses is reflected in Corporate Support and Other and reflects a current year revision in policy. Costs for centrally managed operations are generally allocated to the lines of business based on the utilization of services provided or other appropriate indicators. Revenue is recorded in the business segment responsible for the related product or service. Fee sharing is recorded to allocate portions of such revenue to other business segments involved in selling to, or providing services to, customers. Results of operations for the business segments reflect these fee sharing allocations. Capital is allocated to the lines of business based upon the underlying risks in each business considering economic and regulatory capital standards. The development and application of these methodologies is a dynamic process. Accordingly, prior period financial results have been revised to reflect management accounting enhancements and changes in the Company's organizational structure. The 2020 segment information has been revised to conform to the 2021 presentation. In addition, unlike financial accounting, there is no authoritative literature for management accounting similar to U.S. GAAP. Consequently, reported results are not necessarily comparable with those presented by other financial institutions. (12) Related Party Transactions The Company enters into various transactions with BBVA that affect the Company’s business and operations. The following discloses the significant transactions between the Company and BBVA during 2021 and 2020. The Company believes all of the transactions entered into between the Company and BBVA were transacted on terms that were no more or less beneficial to the Company than similar transactions entered into with unrelated market participants, including interest rates and transaction costs. The Company foresees executing similar transactions with BBVA in the future. Derivatives The Company has entered into various derivative contracts as noted below with BBVA as the upstream counterparty. The total notional amount of outstanding derivative contracts between the Company and BBVA are $3.1 billion and $3.2 billion as of March 31, 2021 and December 31, 2020, respectively. The net fair value of outstanding derivative contracts between the Company and BBVA are detailed below. March 31, 2021 December 31, 2020 (In Thousands) Derivative contracts: Fair value hedges $ (375) $ (748) Cash flow hedges (64) (19) Free-standing derivatives not designated as hedging instruments (29,565) (44,958) Securities Purchased Under Agreements to Resell/ Securities Sold Under Agreements to Repurchase The Company enters into agreements with BBVA as the counterparty under which it purchases/sells securities subject to an obligation to resell/repurchase the same or similar securities. The following represents the amount of securities purchased under agreement to resell and securities sold under agreement to repurchase where BBVA is the counterparty. March 31, 2021 December 31, 2020 (In Thousands) Securities purchased under agreements to resell $ 928,235 $ 186,568 Securities sold under agreements to repurchase 3,291 6,426 Borrowings BSI, a wholly owned subsidiary of the Company, had a $420 million revolving note and cash subordination agreement with BBVA that was executed on March 16, 2012, with an original maturity date of March 16, 2018. On 52
Table of Contents March 16, 2017, the agreement was amended to increase the available amount to $450 million and the maturity date was extended to March 16, 2023. On March 16, 2017, BSI entered into an uncommitted demand facility agreement with BBVA for a revolving loan facility up to $1 billion to be used for trade settlement purposes. BSI has not drawn against this facility in 2021. At both March 31, 2021 and December 31, 2020 there was no amount outstanding under the revolving note and cash subordination agreement. There was $29 thousand in interest expense related to these agreements for the three months ended March 31, 2021 and $55 thousand interest expense for the three months ended March 31, 2020 and are included in interest on other short-term borrowings within the Company's Unaudited Condensed Consolidated Statements of Income. Service and Referral Agreements The Company and its affiliates entered into or were subject to various service and referral agreements with BBVA and its affiliates. Each of the agreements was done in the ordinary course of business and on market terms. Income associated with these agreements was $5.0 million and $4.1 million for the three months ended March 31, 2021 and 2020, respectively, and is recorded as a component of noninterest income within the Company's Unaudited Condensed Consolidated Statements of Income. Expenses associated with these agreements was $10.5 million and $9.9 million for the three months ended March 31, 2021 and 2020, respectively, and is recorded as a component of noninterest expense within the Company's Unaudited Condensed Consolidated Statements of Income. Series A Preferred Stock BBVA is the sole holder of the Series A Preferred Stock that the Company issued in December 2015. At both March 31, 2021 and December 31, 2020, the carrying amount of the Series A Preferred Stock was approximately $229 million. During the three months ended March 31, 2021 and 2020, the Company paid $3.1 million and $4.2 million, respectively, of preferred stock dividends to BBVA. 53