EXHIBIT 99..1
Published on March 1, 2019
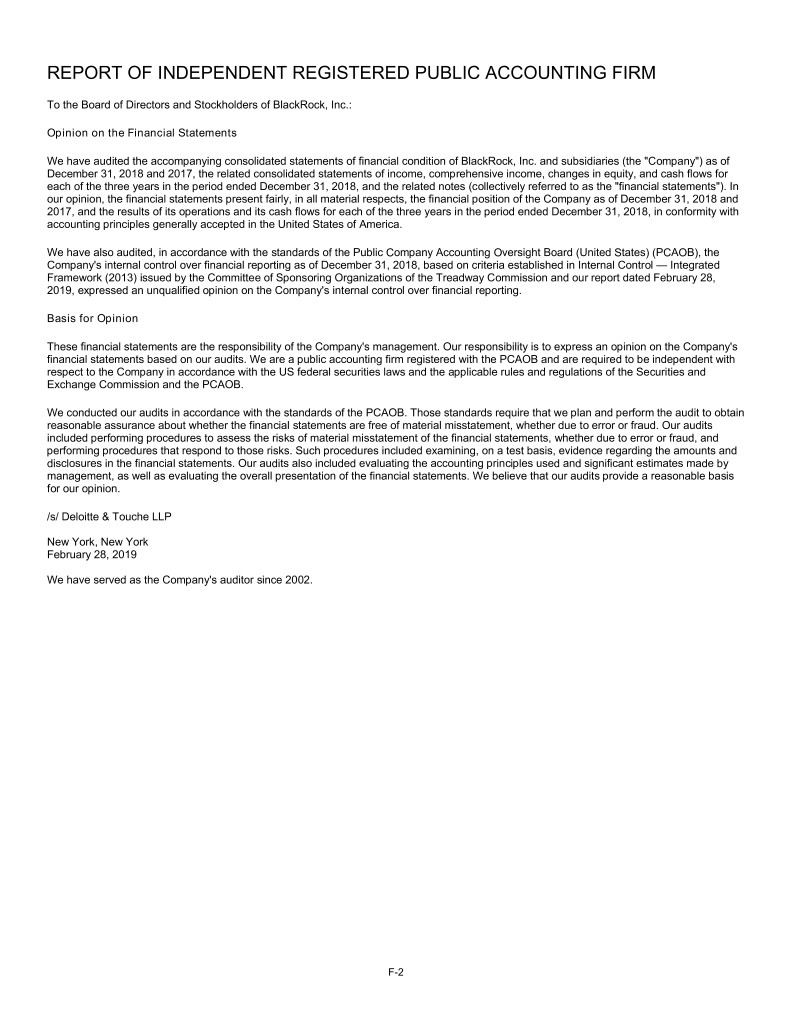
REPORT OF INDEPENDENT REGISTERED PUBLIC ACCOUNTING FIRM To the Board of Directors and Stockholders of BlackRock, Inc.: Opinion on the Financial Statements We have audited the accompanying consolidated statements of financial condition of BlackRock, Inc. and subsidiaries (the "Company") as of December 31, 2018 and 2017, the related consolidated statements of income, comprehensive income, changes in equity, and cash flows for each of the three years in the period ended December 31, 2018, and the related notes (collectively referred to as the "financial statements"). In our opinion, the financial statements present fairly, in all material respects, the financial position of the Company as of December 31, 2018 and 2017, and the results of its operations and its cash flows for each of the three years in the period ended December 31, 2018, in conformity with accounting principles generally accepted in the United States of America. We have also audited, in accordance with the standards of the Public Company Accounting Oversight Board (United States) (PCAOB), the Company's internal control over financial reporting as of December 31, 2018, based on criteria established in Internal Control — Integrated Framework (2013) issued by the Committee of Sponsoring Organizations of the Treadway Commission and our report dated February 28, 2019, expressed an unqualified opinion on the Company's internal control over financial reporting. Basis for Opinion These financial statements are the responsibility of the Company's management. Our responsibility is to express an opinion on the Company's financial statements based on our audits. We are a public accounting firm registered with the PCAOB and are required to be independent with respect to the Company in accordance with the US federal securities laws and the applicable rules and regulations of the Securities and Exchange Commission and the PCAOB. We conducted our audits in accordance with the standards of the PCAOB. Those standards require that we plan and perform the audit to obtain reasonable assurance about whether the financial statements are free of material misstatement, whether due to error or fraud. Our audits included performing procedures to assess the risks of material misstatement of the financial statements, whether due to error or fraud, and performing procedures that respond to those risks. Such procedures included examining, on a test basis, evidence regarding the amounts and disclosures in the financial statements. Our audits also included evaluating the accounting principles used and significant estimates made by management, as well as evaluating the overall presentation of the financial statements. We believe that our audits provide a reasonable basis for our opinion. /s/ Deloitte & Touche LLP New York, New York February 28, 2019 We have served as the Company's auditor since 2002. F-2
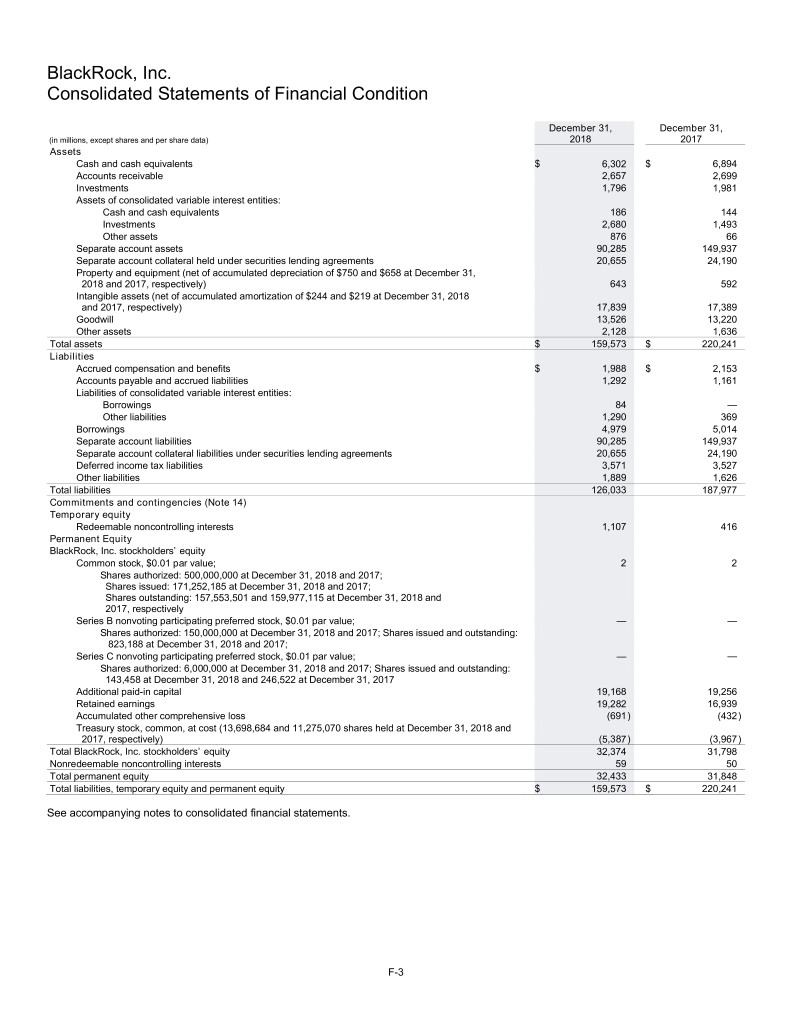
BlackRock, Inc. Consolidated Statements of Financial Condition December 31, December 31, (in millions, except shares and per share data) 2018 2017 Assets Cash and cash equivalents $ 6,302 $ 6,894 Accounts receivable 2,657 2,699 Investments 1,796 1,981 Assets of consolidated variable interest entities: Cash and cash equivalents 186 144 Investments 2,680 1,493 Other assets 876 66 Separate account assets 90,285 149,937 Separate account collateral held under securities lending agreements 20,655 24,190 Property and equipment (net of accumulated depreciation of $750 and $658 at December 31, 2018 and 2017, respectively) 643 592 Intangible assets (net of accumulated amortization of $244 and $219 at December 31, 2018 and 2017, respectively) 17,839 17,389 Goodwill 13,526 13,220 Other assets 2,128 1,636 Total assets $ 159,573 $ 220,241 Liabilities Accrued compensation and benefits $ 1,988 $ 2,153 Accounts payable and accrued liabilities 1,292 1,161 Liabilities of consolidated variable interest entities: Borrowings 84 — Other liabilities 1,290 369 Borrowings 4,979 5,014 Separate account liabilities 90,285 149,937 Separate account collateral liabilities under securities lending agreements 20,655 24,190 Deferred income tax liabilities 3,571 3,527 Other liabilities 1,889 1,626 Total liabilities 126,033 187,977 Commitments and contingencies (Note 14) Temporary equity Redeemable noncontrolling interests 1,107 416 Permanent Equity BlackRock, Inc. stockholders’ equity Common stock, $0.01 par value; 2 2 Shares authorized: 500,000,000 at December 31, 2018 and 2017; Shares issued: 171,252,185 at December 31, 2018 and 2017; Shares outstanding: 157,553,501 and 159,977,115 at December 31, 2018 and 2017, respectively Series B nonvoting participating preferred stock, $0.01 par value; — — Shares authorized: 150,000,000 at December 31, 2018 and 2017; Shares issued and outstanding: 823,188 at December 31, 2018 and 2017; Series C nonvoting participating preferred stock, $0.01 par value; — — Shares authorized: 6,000,000 at December 31, 2018 and 2017; Shares issued and outstanding: 143,458 at December 31, 2018 and 246,522 at December 31, 2017 Additional paid-in capital 19,168 19,256 Retained earnings 19,282 16,939 Accumulated other comprehensive loss (691 ) (432 ) Treasury stock, common, at cost (13,698,684 and 11,275,070 shares held at December 31, 2018 and 2017, respectively) (5,387 ) (3,967 ) Total BlackRock, Inc. stockholders’ equity 32,374 31,798 Nonredeemable noncontrolling interests 59 50 Total permanent equity 32,433 31,848 Total liabilities, temporary equity and permanent equity $ 159,573 $ 220,241 See accompanying notes to consolidated financial statements. F-3
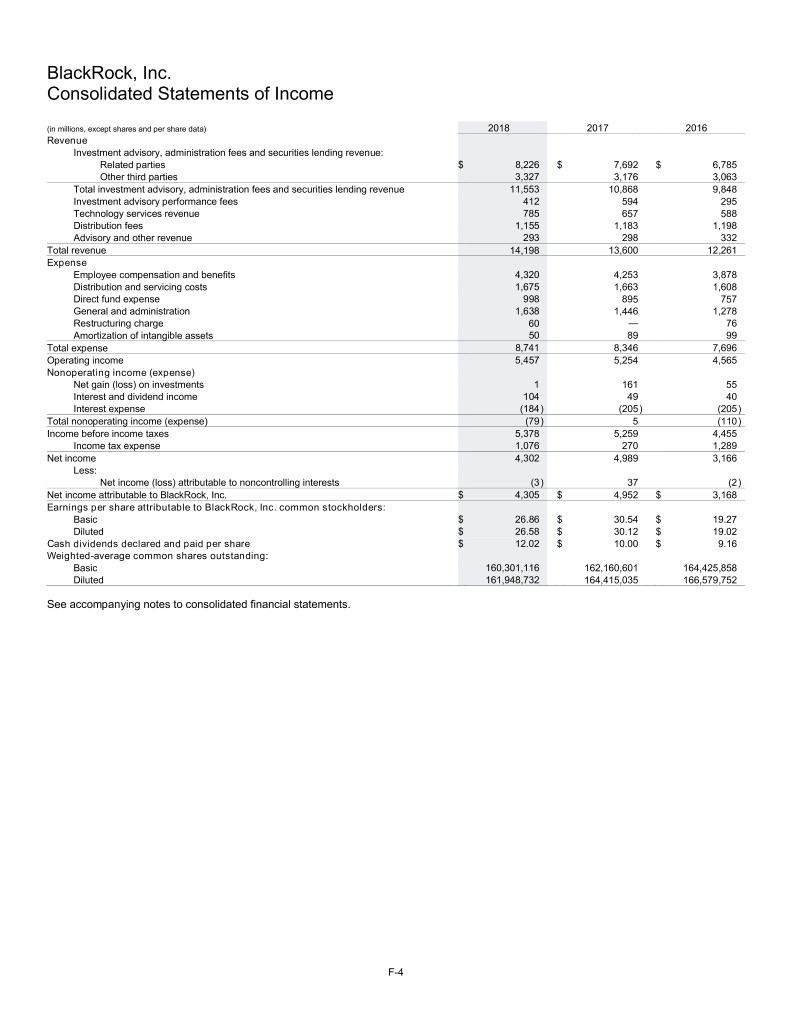
BlackRock, Inc. Consolidated Statements of Income (in millions, except shares and per share data) 2018 2017 2016 Revenue Investment advisory, administration fees and securities lending revenue: Related parties $ 8,226 $ 7,692 $ 6,785 Other third parties 3,327 3,176 3,063 Total investment advisory, administration fees and securities lending revenue 11,553 10,868 9,848 Investment advisory performance fees 412 594 295 Technology services revenue 785 657 588 Distribution fees 1,155 1,183 1,198 Advisory and other revenue 293 298 332 Total revenue 14,198 13,600 12,261 Expense Employee compensation and benefits 4,320 4,253 3,878 Distribution and servicing costs 1,675 1,663 1,608 Direct fund expense 998 895 757 General and administration 1,638 1,446 1,278 Restructuring charge 60 — 76 Amortization of intangible assets 50 89 99 Total expense 8,741 8,346 7,696 Operating income 5,457 5,254 4,565 Nonoperating income (expense) Net gain (loss) on investments 1 161 55 Interest and dividend income 104 49 40 Interest expense (184 ) (205 ) (205 ) Total nonoperating income (expense) (79 ) 5 (110 ) Income before income taxes 5,378 5,259 4,455 Income tax expense 1,076 270 1,289 Net income 4,302 4,989 3,166 Less: Net income (loss) attributable to noncontrolling interests (3 ) 37 (2 ) Net income attributable to BlackRock, Inc. $ 4,305 $ 4,952 $ 3,168 Earnings per share attributable to BlackRock, Inc. common stockholders: Basic $ 26.86 $ 30.54 $ 19.27 Diluted $ 26.58 $ 30.12 $ 19.02 Cash dividends declared and paid per share $ 12.02 $ 10.00 $ 9.16 Weighted-average common shares outstanding: Basic 160,301,116 162,160,601 164,425,858 Diluted 161,948,732 164,415,035 166,579,752 See accompanying notes to consolidated financial statements. F-4
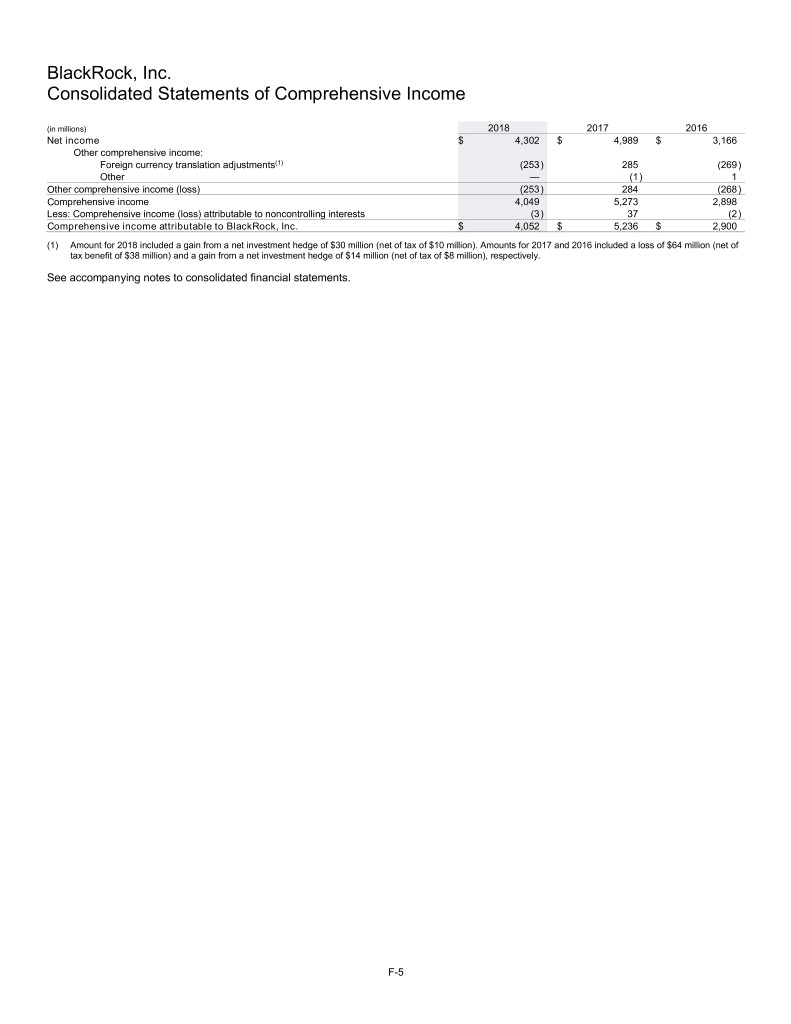
BlackRock, Inc. Consolidated Statements of Comprehensive Income (in millions) 2018 2017 2016 Net income $ 4,302 $ 4,989 $ 3,166 Other comprehensive income: Foreign currency translation adjustments(1) (253 ) 285 (269 ) Other — (1 ) 1 Other comprehensive income (loss) (253 ) 284 (268 ) Comprehensive income 4,049 5,273 2,898 Less: Comprehensive income (loss) attributable to noncontrolling interests (3 ) 37 (2 ) Comprehensive income attributable to BlackRock, Inc. $ 4,052 $ 5,236 $ 2,900 (1) Amount for 2018 included a gain from a net investment hedge of $30 million (net of tax of $10 million). Amounts for 2017 and 2016 included a loss of $64 million (net of tax benefit of $38 million) and a gain from a net investment hedge of $14 million (net of tax of $8 million), respectively. See accompanying notes to consolidated financial statements. F-5
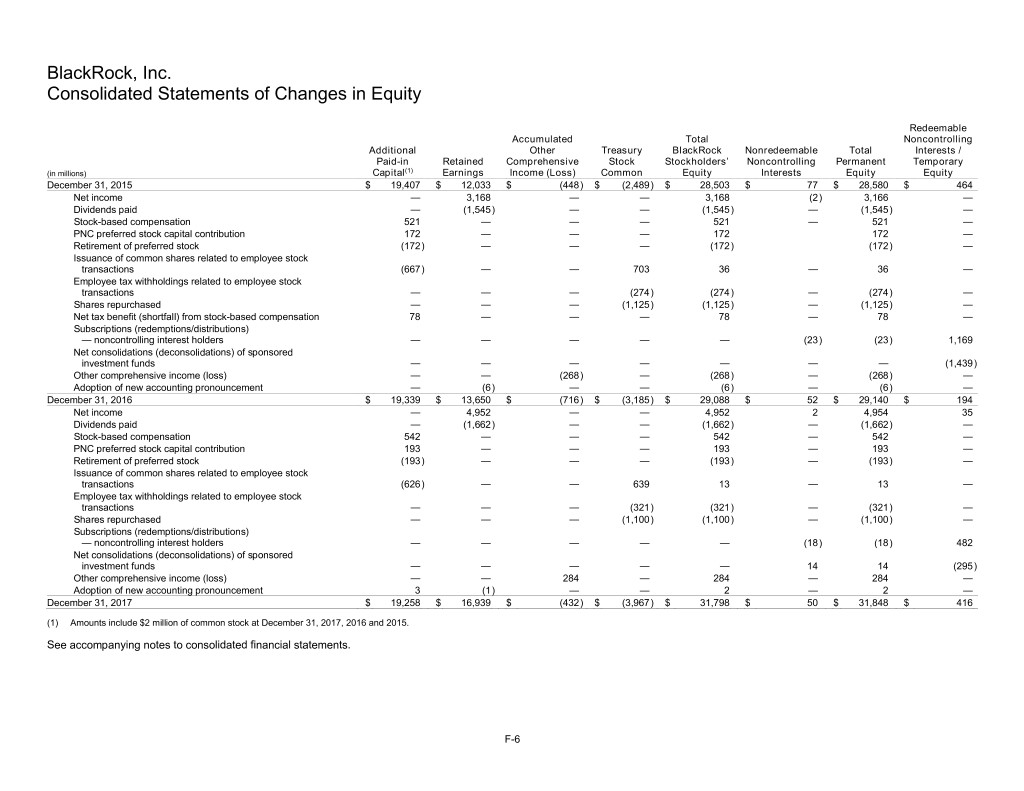
BlackRock, Inc. Consolidated Statements of Changes in Equity Redeemable Accumulated Total Noncontrolling Additional Other Treasury BlackRock Nonredeemable Total Interests / Paid-in Retained Comprehensive Stock Stockholders’ Noncontrolling Permanent Temporary (in millions) Capital(1) Earnings Income (Loss) Common Equity Interests Equity Equity December 31, 2015 $ 19,407 $ 12,033 $ (448 ) $ (2,489 ) $ 28,503 $ 77 $ 28,580 $ 464 Net income — 3,168 — — 3,168 (2 ) 3,166 — Dividends paid — (1,545 ) — — (1,545 ) — (1,545 ) — Stock-based compensation 521 — — — 521 — 521 — PNC preferred stock capital contribution 172 — — — 172 172 — Retirement of preferred stock (172 ) — — — (172 ) (172 ) — Issuance of common shares related to employee stock transactions (667 ) — — 703 36 — 36 — Employee tax withholdings related to employee stock transactions — — — (274 ) (274 ) — (274 ) — Shares repurchased — — — (1,125 ) (1,125 ) — (1,125 ) — Net tax benefit (shortfall) from stock-based compensation 78 — — — 78 — 78 — Subscriptions (redemptions/distributions) — noncontrolling interest holders — — — — — (23 ) (23 ) 1,169 Net consolidations (deconsolidations) of sponsored investment funds — — — — — — — (1,439 ) Other comprehensive income (loss) — — (268 ) — (268 ) — (268 ) — Adoption of new accounting pronouncement — (6 ) — — (6 ) — (6 ) — December 31, 2016 $ 19,339 $ 13,650 $ (716 ) $ (3,185 ) $ 29,088 $ 52 $ 29,140 $ 194 Net income — 4,952 — — 4,952 2 4,954 35 Dividends paid — (1,662 ) — — (1,662 ) — (1,662 ) — Stock-based compensation 542 — — — 542 — 542 — PNC preferred stock capital contribution 193 — — — 193 — 193 — Retirement of preferred stock (193 ) — — — (193 ) — (193 ) — Issuance of common shares related to employee stock transactions (626 ) — — 639 13 — 13 — Employee tax withholdings related to employee stock transactions — — — (321 ) (321 ) — (321 ) — Shares repurchased — — — (1,100 ) (1,100 ) — (1,100 ) — Subscriptions (redemptions/distributions) — noncontrolling interest holders — — — — — (18 ) (18 ) 482 Net consolidations (deconsolidations) of sponsored investment funds — — — — — 14 14 (295 ) Other comprehensive income (loss) — — 284 — 284 — 284 — Adoption of new accounting pronouncement 3 (1 ) — — 2 — 2 — December 31, 2017 $ 19,258 $ 16,939 $ (432 ) $ (3,967 ) $ 31,798 $ 50 $ 31,848 $ 416 (1) Amounts include $2 million of common stock at December 31, 2017, 2016 and 2015. See accompanying notes to consolidated financial statements. F-6
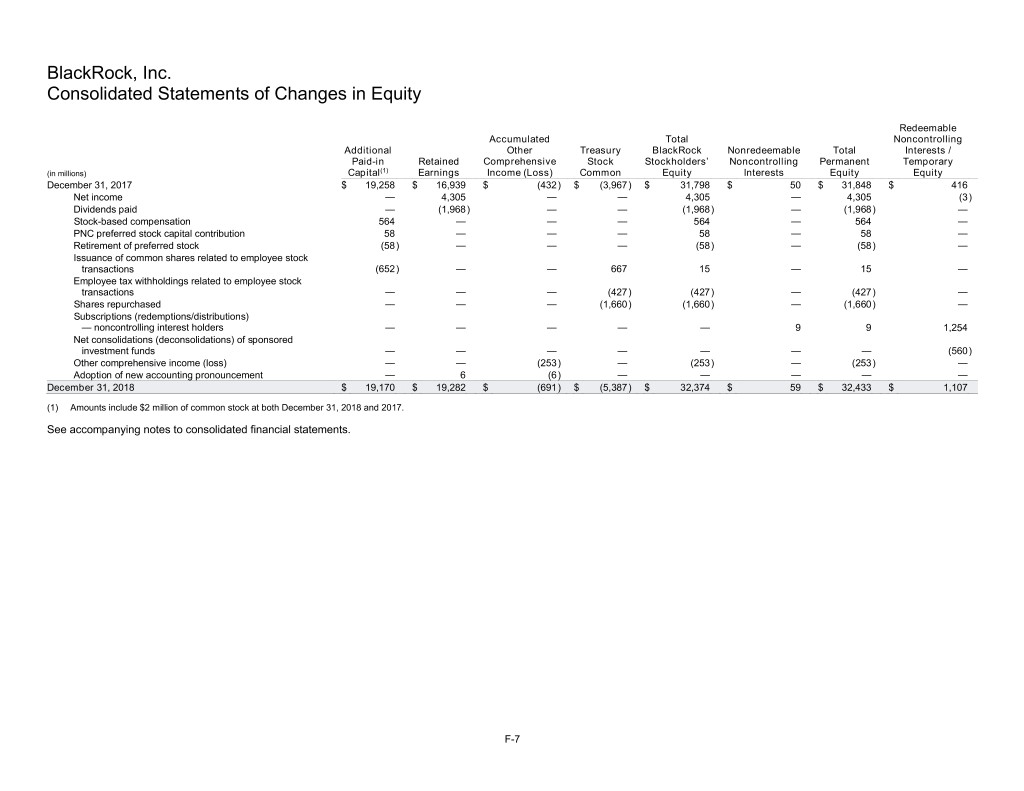
BlackRock, Inc. Consolidated Statements of Changes in Equity Redeemable Accumulated Total Noncontrolling Additional Other Treasury BlackRock Nonredeemable Total Interests / Paid-in Retained Comprehensive Stock Stockholders’ Noncontrolling Permanent Temporary (in millions) Capital(1) Earnings Income (Loss) Common Equity Interests Equity Equity December 31, 2017 $ 19,258 $ 16,939 $ (432 ) $ (3,967 ) $ 31,798 $ 50 $ 31,848 $ 416 Net income — 4,305 — — 4,305 — 4,305 (3 ) Dividends paid — (1,968 ) — — (1,968 ) — (1,968 ) — Stock-based compensation 564 — — — 564 — 564 — PNC preferred stock capital contribution 58 — — — 58 — 58 — Retirement of preferred stock (58 ) — — — (58 ) — (58 ) — Issuance of common shares related to employee stock transactions (652 ) — — 667 15 — 15 — Employee tax withholdings related to employee stock transactions — — — (427 ) (427 ) — (427 ) — Shares repurchased — — — (1,660 ) (1,660 ) — (1,660 ) — Subscriptions (redemptions/distributions) — noncontrolling interest holders — — — — — 9 9 1,254 Net consolidations (deconsolidations) of sponsored investment funds — — — — — — — (560 ) Other comprehensive income (loss) — — (253 ) — (253 ) — (253 ) — Adoption of new accounting pronouncement — 6 (6 ) — — — — — December 31, 2018 $ 19,170 $ 19,282 $ (691 ) $ (5,387 ) $ 32,374 $ 59 $ 32,433 $ 1,107 (1) Amounts include $2 million of common stock at both December 31, 2018 and 2017. See accompanying notes to consolidated financial statements. F-7
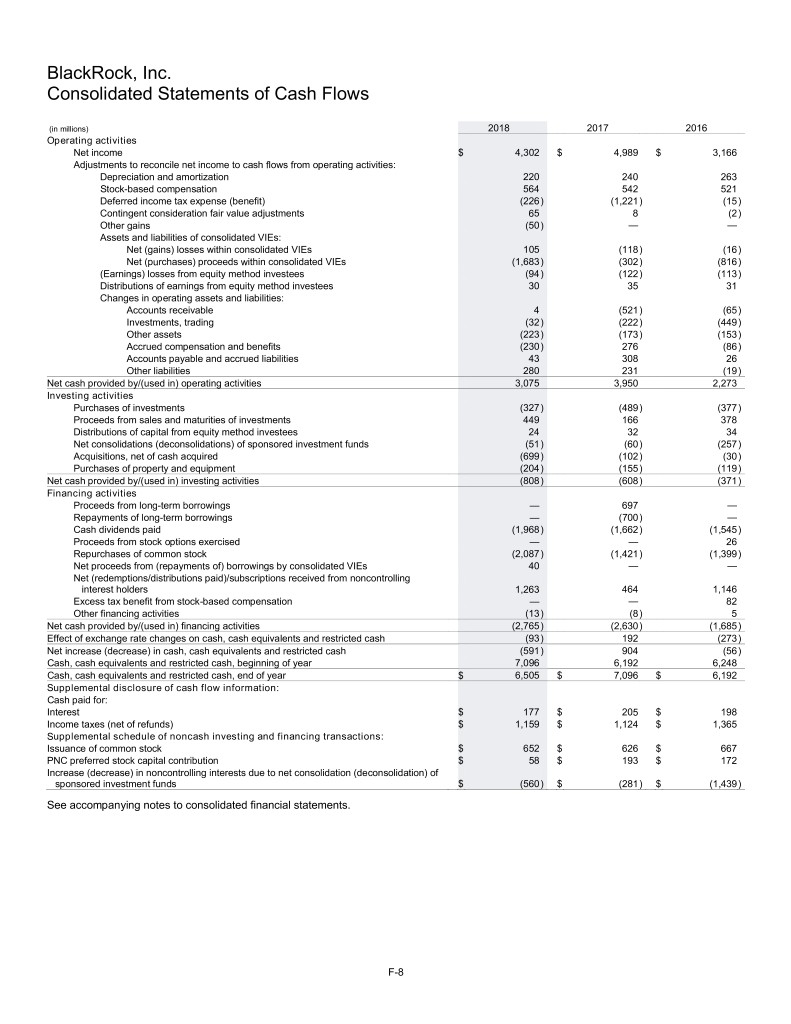
BlackRock, Inc. Consolidated Statements of Cash Flows (in millions) 2018 2017 2016 Operating activities Net income $ 4,302 $ 4,989 $ 3,166 Adjustments to reconcile net income to cash flows from operating activities: Depreciation and amortization 220 240 263 Stock-based compensation 564 542 521 Deferred income tax expense (benefit) (226 ) (1,221 ) (15 ) Contingent consideration fair value adjustments 65 8 (2 ) Other gains (50 ) — — Assets and liabilities of consolidated VIEs: Net (gains) losses within consolidated VIEs 105 (118 ) (16 ) Net (purchases) proceeds within consolidated VIEs (1,683 ) (302 ) (816 ) (Earnings) losses from equity method investees (94 ) (122 ) (113 ) Distributions of earnings from equity method investees 30 35 31 Changes in operating assets and liabilities: Accounts receivable 4 (521 ) (65 ) Investments, trading (32 ) (222 ) (449 ) Other assets (223 ) (173 ) (153 ) Accrued compensation and benefits (230 ) 276 (86 ) Accounts payable and accrued liabilities 43 308 26 Other liabilities 280 231 (19 ) Net cash provided by/(used in) operating activities 3,075 3,950 2,273 Investing activities Purchases of investments (327 ) (489 ) (377 ) Proceeds from sales and maturities of investments 449 166 378 Distributions of capital from equity method investees 24 32 34 Net consolidations (deconsolidations) of sponsored investment funds (51 ) (60 ) (257 ) Acquisitions, net of cash acquired (699 ) (102 ) (30 ) Purchases of property and equipment (204 ) (155 ) (119 ) Net cash provided by/(used in) investing activities (808 ) (608 ) (371 ) Financing activities Proceeds from long-term borrowings — 697 — Repayments of long-term borrowings — (700 ) — Cash dividends paid (1,968 ) (1,662 ) (1,545 ) Proceeds from stock options exercised — — 26 Repurchases of common stock (2,087 ) (1,421 ) (1,399 ) Net proceeds from (repayments of) borrowings by consolidated VIEs 40 — — Net (redemptions/distributions paid)/subscriptions received from noncontrolling interest holders 1,263 464 1,146 Excess tax benefit from stock-based compensation — — 82 Other financing activities (13 ) (8 ) 5 Net cash provided by/(used in) financing activities (2,765 ) (2,630 ) (1,685 ) Effect of exchange rate changes on cash, cash equivalents and restricted cash (93 ) 192 (273 ) Net increase (decrease) in cash, cash equivalents and restricted cash (591 ) 904 (56 ) Cash, cash equivalents and restricted cash, beginning of year 7,096 6,192 6,248 Cash, cash equivalents and restricted cash, end of year $ 6,505 $ 7,096 $ 6,192 Supplemental disclosure of cash flow information: Cash paid for: Interest $ 177 $ 205 $ 198 Income taxes (net of refunds) $ 1,159 $ 1,124 $ 1,365 Supplemental schedule of noncash investing and financing transactions: Issuance of common stock $ 652 $ 626 $ 667 PNC preferred stock capital contribution $ 58 $ 193 $ 172 Increase (decrease) in noncontrolling interests due to net consolidation (deconsolidation) of sponsored investment funds $ (560 ) $ (281 ) $ (1,439 ) See accompanying notes to consolidated financial statements. F-8
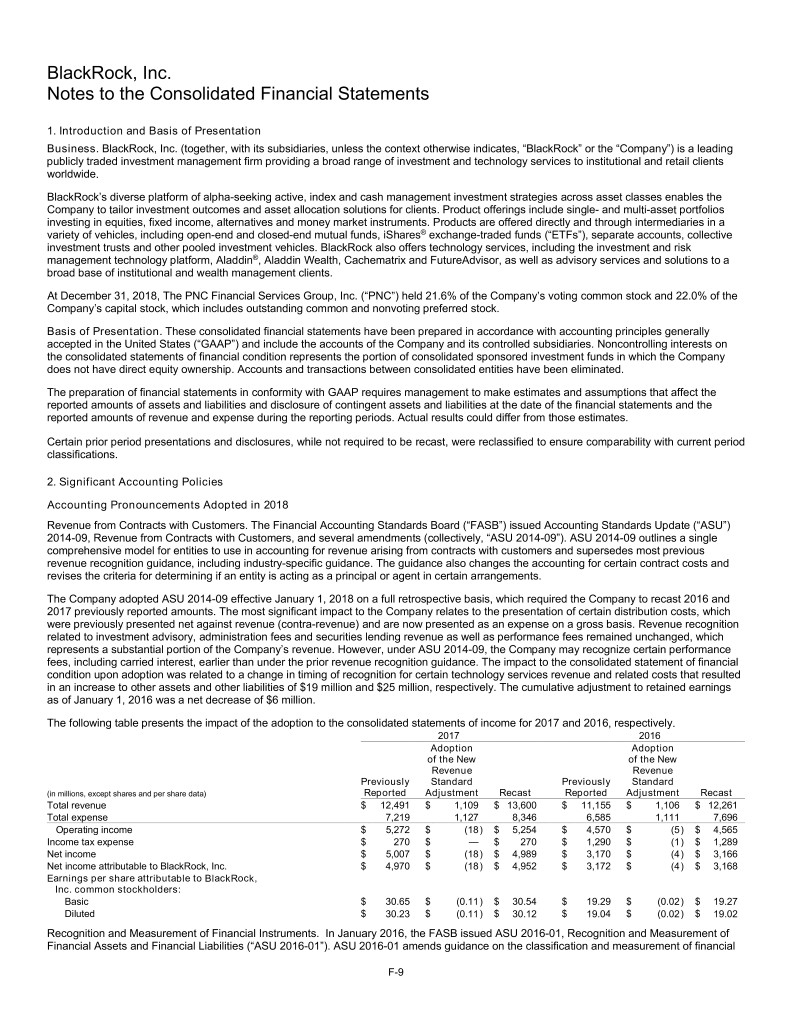
BlackRock, Inc. Notes to the Consolidated Financial Statements 1. Introduction and Basis of Presentation Business. BlackRock, Inc. (together, with its subsidiaries, unless the context otherwise indicates, “BlackRock” or the “Company”) is a leading publicly traded investment management firm providing a broad range of investment and technology services to institutional and retail clients worldwide. BlackRock’s diverse platform of alpha-seeking active, index and cash management investment strategies across asset classes enables the Company to tailor investment outcomes and asset allocation solutions for clients. Product offerings include single- and multi-asset portfolios investing in equities, fixed income, alternatives and money market instruments. Products are offered directly and through intermediaries in a variety of vehicles, including open-end and closed-end mutual funds, iShares® exchange-traded funds (“ETFs”), separate accounts, collective investment trusts and other pooled investment vehicles. BlackRock also offers technology services, including the investment and risk management technology platform, Aladdin®, Aladdin Wealth, Cachematrix and FutureAdvisor, as well as advisory services and solutions to a broad base of institutional and wealth management clients. At December 31, 2018, The PNC Financial Services Group, Inc. (“PNC”) held 21.6% of the Company’s voting common stock and 22.0% of the Company’s capital stock, which includes outstanding common and nonvoting preferred stock. Basis of Presentation. These consolidated financial statements have been prepared in accordance with accounting principles generally accepted in the United States (“GAAP”) and include the accounts of the Company and its controlled subsidiaries. Noncontrolling interests on the consolidated statements of financial condition represents the portion of consolidated sponsored investment funds in which the Company does not have direct equity ownership. Accounts and transactions between consolidated entities have been eliminated. The preparation of financial statements in conformity with GAAP requires management to make estimates and assumptions that affect the reported amounts of assets and liabilities and disclosure of contingent assets and liabilities at the date of the financial statements and the reported amounts of revenue and expense during the reporting periods. Actual results could differ from those estimates. Certain prior period presentations and disclosures, while not required to be recast, were reclassified to ensure comparability with current period classifications. 2. Significant Accounting Policies Accounting Pronouncements Adopted in 2018 Revenue from Contracts with Customers. The Financial Accounting Standards Board (“FASB”) issued Accounting Standards Update (“ASU”) 2014-09, Revenue from Contracts with Customers, and several amendments (collectively, “ASU 2014-09”). ASU 2014-09 outlines a single comprehensive model for entities to use in accounting for revenue arising from contracts with customers and supersedes most previous revenue recognition guidance, including industry-specific guidance. The guidance also changes the accounting for certain contract costs and revises the criteria for determining if an entity is acting as a principal or agent in certain arrangements. The Company adopted ASU 2014-09 effective January 1, 2018 on a full retrospective basis, which required the Company to recast 2016 and 2017 previously reported amounts. The most significant impact to the Company relates to the presentation of certain distribution costs, which were previously presented net against revenue (contra-revenue) and are now presented as an expense on a gross basis. Revenue recognition related to investment advisory, administration fees and securities lending revenue as well as performance fees remained unchanged, which represents a substantial portion of the Company’s revenue. However, under ASU 2014-09, the Company may recognize certain performance fees, including carried interest, earlier than under the prior revenue recognition guidance. The impact to the consolidated statement of financial condition upon adoption was related to a change in timing of recognition for certain technology services revenue and related costs that resulted in an increase to other assets and other liabilities of $19 million and $25 million, respectively. The cumulative adjustment to retained earnings as of January 1, 2016 was a net decrease of $6 million. The following table presents the impact of the adoption to the consolidated statements of income for 2017 and 2016, respectively. 2017 2016 Adoption Adoption of the New of the New Revenue Revenue Previously Standard Previously Standard (in millions, except shares and per share data) Reported Adjustment Recast Reported Adjustment Recast Total revenue $ 12,491 $ 1,109 $ 13,600 $ 11,155 $ 1,106 $ 12,261 Total expense 7,219 1,127 8,346 6,585 1,111 7,696 Operating income $ 5,272 $ (18 ) $ 5,254 $ 4,570 $ (5 ) $ 4,565 Income tax expense $ 270 $ — $ 270 $ 1,290 $ (1 ) $ 1,289 Net income $ 5,007 $ (18 ) $ 4,989 $ 3,170 $ (4 ) $ 3,166 Net income attributable to BlackRock, Inc. $ 4,970 $ (18 ) $ 4,952 $ 3,172 $ (4 ) $ 3,168 Earnings per share attributable to BlackRock, Inc. common stockholders: Basic $ 30.65 $ (0.11 ) $ 30.54 $ 19.29 $ (0.02 ) $ 19.27 Diluted $ 30.23 $ (0.11 ) $ 30.12 $ 19.04 $ (0.02 ) $ 19.02 Recognition and Measurement of Financial Instruments. In January 2016, the FASB issued ASU 2016-01, Recognition and Measurement of Financial Assets and Financial Liabilities (“ASU 2016-01”). ASU 2016-01 amends guidance on the classification and measurement of financial F-9
instruments, including requiring an entity to measure substantially all equity securities (other than those accounted for under the equity method of accounting) at fair value through earnings. ASU 2016-01 also amends certain disclosures associated with the fair value of financial instruments. The Company adopted ASU 2016-01 using a modified retrospective approach on January 1, 2018. The reclassification of unrealized gains (losses) on equity securities within accumulated other comprehensive income (“AOCI”) to retained earnings was not material upon adoption. Cash Flow Classification. In August 2016, the FASB issued ASU 2016-15, Classification of Certain Cash Receipts and Cash Payments (“ASU 2016-15”), which amends and clarifies the current guidance to reduce diversity in practice of the classification of certain cash receipts and payments in the consolidated statement of cash flows. The Company adopted ASU 2016-15 on January 1, 2018 retrospectively to all periods presented. The adoption of ASU 2016-15 did not have a material impact on the consolidated statements of cash flows. Restricted Cash. In November 2016, the FASB issued 2016-18, Restricted Cash (“ASU 2016-18”), which clarifies the classification and presentation of restricted cash in the consolidated statement of cash flows. The Company adopted ASU 2016-18 on January 1, 2018 retrospectively to all periods presented. The adoption of ASU 2016-18 did not have a material impact on the consolidated statements of cash flows. See Note 3, Cash, Cash Equivalents and Restricted Cash, for additional disclosures related to restricted cash. Reclassifications from Accumulated Other Comprehensive Income. In February 2018, the FASB issued ASU 2018-02, Reclassification of Certain Tax Effects from Accumulated Other Comprehensive Income (“ASU 2018-02”). ASU 2018-02 allows reclassification from AOCI to retained earnings for stranded tax effects resulting from the Tax Cuts and Jobs Act. The Company adopted ASU 2018-02 prospectively on January 1, 2018. The adoption of ASU 2018-02 did not have a material impact on the consolidated statement of financial condition. Fair Value Disclosure Requirements. In August 2018, the FASB issued ASU 2018-13, Changes to the Disclosure Requirements for Fair Value Measurement (“ASU 2018-13”), which adds, modifies and removes certain disclosure requirements for fair value measurements. The Company early adopted the provisions of ASU 2018-13 that remove and modify disclosure requirements effective July 1, 2018, which included the removal of the estimated liquidation periods for investments measured at net asset value on a retrospective basis and removal of the valuation processes discussion for Level 3 fair value measurements. The additional disclosure requirements under ASU 2018-13 are required to be applied prospectively and are effective for the Company on January 1, 2020. The Company does not expect the additional disclosure requirements to have a material impact on its consolidated financial statements. Cash and Cash Equivalents. Cash and cash equivalents primarily consists of cash, money market funds and short-term, highly liquid investments with original maturities of three months or less in which the Company is exposed to market and credit risk. Cash and cash equivalent balances that are legally restricted from use by the Company are recorded in other assets on the consolidated statements of financial condition. Cash balances maintained by consolidated voting rights entities (“VREs”) are not considered legally restricted and are included in cash and cash equivalents on the consolidated statements of financial condition. Cash balances maintained by consolidated variable interest entities (“VIEs”) are included in assets of consolidated VIE on the consolidated statements of financial condition. Investments Investments in Debt Securities. The Company classifies debt investments as available-for-sale, held-to-maturity or trading based on the Company’s intent to sell the security or, its intent and ability to hold the debt security to maturity. Available-for-sale securities are those securities that are not classified as trading or held-to-maturity. Available-for-sale securities include certain investments in collateralized loan obligations (“CLOs”) and are carried at fair value on the consolidated statements of financial condition with changes in fair value recorded in AOCI within stockholders’ equity in the period of the change. Upon the disposition of an available-for-sale security, the Company reclassifies the gain or loss on the security from AOCI to nonoperating income (expense) on the consolidated statements of income. Held-to-maturity securities are purchased with the positive intent and ability to be held to maturity and are recorded at amortized cost on the consolidated statements of financial condition. Trading securities are those investments that are purchased principally for the purpose of selling them in the near term. Trading securities are carried at fair value on the consolidated statements of financial condition with changes in fair value recorded in nonoperating income (expense) on the consolidated statements of income. Trading securities include certain investments in CLOs for which the fair value option is elected in order to reduce operational complexity of bifurcating embedded derivatives. Investments in Equity Securities. Equity securities are generally carried at fair value on the consolidated statements of financial condition with changes in the fair value recorded through net income (“FVTNI”) within nonoperating income (expense). For nonmarketable equity securities, the Company generally elects to apply the practicality exception to fair value measurement, under which such securities will be measured at cost, less impairment, plus or minus observable price changes for identical or similar securities of the same issuer with such changes recorded in the consolidated statements of income. Dividends received are recorded as dividend income within nonoperating income (expense). Equity Method. The Company applies the equity method of accounting for equity investments where the Company does not consolidate the investee, but can exert significant influence over the financial and operating policies of the investee. The Company’s share of the investee’s underlying net income or loss is recorded as net gain (loss) on investments within nonoperating income (expense) and as other revenue for certain strategic investments since such companies are considered to be an extension of the Company’s core business. The Company’s share of net income of the investee is recorded based upon the most current information available at the time, which may precede the date of the consolidated statement of financial condition. Distributions received reduce the Company’s carrying value of the investee and the cost basis if deemed to be a return of capital. Impairments of Investments. Management periodically assesses equity method, available-for-sale and held-to-maturity investments for other- than-temporary impairment (“OTTI”). If an OTTI exists, an impairment charge would be recorded for the excess of the carrying amount of the investment over its estimated fair value in the consolidated statements of income. F-10
For equity method investments and held-to-maturity investments, if circumstances indicate that an OTTI may exist, the investments are evaluated using market values, where available, or the expected future cash flows of the investment. For the Company’s investments in CLOs, the Company reviews cash flow estimates over the life of each CLO investment. On a quarterly basis, if the present value of the estimated future cash flows is lower than the carrying value of the investment and there is an adverse change in estimated cash flows, an impairment is considered to be other-than-temporary. In addition, for nonmarketable equity securities that are accounted for under the measurement alternative to fair value, the Company applies the impairment model that does not require the Company to consider whether the impairment is other-than-temporary. Consolidation. The Company performs an analysis for investment products to determine if the product is a VIE or a VRE. Assessing whether an entity is a VIE or a VRE involves judgment and analysis. Factors considered in this assessment include the entity’s legal organization, the entity’s capital structure and equity ownership, and any related party or de facto agent implications of the Company’s involvement with the entity. Investments that are determined to be VIEs are consolidated if the Company is the primary beneficiary (“PB”) of the entity. VREs are typically consolidated if the Company holds the majority voting interest. Upon the occurrence of certain events (such as contributions and redemptions, either by the Company, or third parties, or amendments to the governing documents of the Company’s investment products), management reviews and reconsiders its previous conclusion regarding the status of an entity as a VIE or a VRE. Additionally, management continually reconsiders whether the Company is deemed to be a VIE’s PB that consolidates such entity. Consolidation of Variable Interest Entities. Certain investment products for which a controlling financial interest is achieved through arrangements that do not involve or are not directly linked to voting interests are deemed VIEs. BlackRock reviews factors, including whether or not i) the entity has equity that is sufficient to permit the entity to finance its activities without additional subordinated support from other parties and ii) the equity holders at risk have the obligation to absorb losses, the right to receive residual returns, and the right to direct the activities of the entity that most significantly impact the entity’s economic performance, to determine if the investment product is a VIE. BlackRock re- evaluates such factors as facts and circumstances change. The PB of a VIE is defined as the variable interest holder that has a controlling financial interest in the VIE. A controlling financial interest is defined as (i) the power to direct the activities of the VIE that most significantly impact its economic performance and (ii) the obligation to absorb losses of the entity or the right to receive benefits from the entity that potentially could be significant to the VIE. The Company generally consolidates VIEs in which it holds an equity ownership interest of 10% or greater and deconsolidates such VIEs once equity ownership falls below 10%. Consolidation of Voting Rights Entities. BlackRock is required to consolidate an investee to the extent that BlackRock can exert control over the financial and operating policies of the investee, which generally exists if there is a greater than 50% voting equity interest. Retention of Specialized Investment Company Accounting Principles. Upon consolidation of sponsored investment funds, the Company retains the specialized investment company accounting principles of the underlying funds. All of the underlying investments held by such consolidated sponsored investment funds are carried at fair value with corresponding changes in the investments’ fair values reflected in nonoperating income (expense) on the consolidated statements of income. When the Company no longer controls these funds due to reduced ownership percentage or other reasons, the funds are deconsolidated and accounted for as an equity method investment or equity securities FVTNI if the Company still maintains an investment. Money Market Fee Waivers. The Company may voluntarily waive a portion of its management fees on certain money market funds to ensure that they maintain a targeted level of daily net investment income (the “Yield Support waivers”). During 2018, 2017 and 2016, these waivers resulted in a reduction of management fees of approximately $0 million, $6 million and $56 million, respectively. Approximately 0% and 35% of Yield Support waivers for 2017 and 2016, respectively, were offset by a reduction of BlackRock’s distribution and servicing costs paid to a financial intermediary. BlackRock may increase or decrease the level of fee waivers in future periods. Separate Account Assets and Liabilities. Separate account assets are maintained by BlackRock Life Limited, a wholly owned subsidiary of the Company, which is a registered life insurance company in the United Kingdom, and represent segregated assets held for purposes of funding individual and group pension contracts. The life insurance company does not underwrite any insurance contracts that involve any insurance risk transfer from the insured to the life insurance company. The separate account assets primarily include equity securities, debt securities, money market funds and derivatives. The separate account assets are not subject to general claims of the creditors of BlackRock. These separate account assets and the related equal and offsetting liabilities are recorded as separate account assets and separate account liabilities on the consolidated statements of financial condition. The net investment income attributable to separate account assets supporting individual and group pension contracts accrues directly to the contract owner and is not reported on the consolidated statements of income. While BlackRock has no economic interest in these separate account assets and liabilities, BlackRock earns policy administration and management fees associated with these products, which are included in investment advisory, administration fees and securities lending revenue on the consolidated statements of income. Separate Account Collateral Assets Held and Liabilities Under Securities Lending Agreements. The Company facilitates securities lending arrangements whereby securities held by separate accounts maintained by BlackRock Life Limited are lent to third parties under global master securities lending agreements. In exchange, the Company receives legal title to the collateral with minimum values generally ranging from approximately 102% to 112% of the value of the securities lent in order to reduce counterparty risk. The required collateral value is calculated on a daily basis. The global master securities lending agreements provide the Company the right to request additional collateral or, in the event of borrower default, the right to liquidate collateral. The securities lending transactions entered into by the Company are accompanied by an agreement that entitles the Company to request the borrower to return the securities at any time; therefore, these transactions are not reported as sales. The Company records on the consolidated statements of financial condition the cash and noncash collateral received under these BlackRock Life Limited securities lending arrangements as its own asset in addition to an equal and offsetting collateral liability for the obligation to return the collateral. The securities lending revenue earned from lending securities held by the separate accounts is included in investment advisory, F-11
administration fees and securities lending revenue on the consolidated statements of income. During 2018 and 2017, the Company had not resold or repledged any of the collateral received under these arrangements. At December 31, 2018 and 2017, the fair value of loaned securities held by separate accounts was approximately $18.9 billion and $22.3 billion, respectively, and the fair value of the collateral held under these securities lending agreements was approximately $20.7 billion and $24.2 billion, respectively. Property and Equipment. Property and equipment are recorded at cost less accumulated depreciation. Depreciation is generally determined by cost less any estimated residual value using the straight-line method over the estimated useful lives of the various classes of property and equipment. Leasehold improvements are amortized using the straight-line method over the shorter of the estimated useful life or the remaining lease term. BlackRock develops a variety of risk management, investment analytic and investment system services for internal use, utilizing proprietary software that is hosted and maintained by BlackRock. The Company capitalizes certain costs incurred in connection with developing or obtaining software for internal use. Capitalized software costs are included within property and equipment on the consolidated statements of financial condition and are amortized, beginning when the software project is ready for its intended use, over the estimated useful life of the software of approximately three years. Goodwill and Intangible Assets. Goodwill represents the cost of a business acquisition in excess of the fair value of the net assets acquired. The Company has determined that it has one reporting unit for goodwill impairment testing purposes, the consolidated BlackRock single operating segment, which is consistent with internal management reporting and management's oversight of operations. In its assessment of goodwill for impairment, the Company considers such factors as the book value and market capitalization of the Company. On a quarterly basis, the Company considers if triggering events have occurred that may indicate a potential goodwill impairment. If a triggering event has occurred, the Company performs assessments, which may include reviews of significant valuation assumptions, to determine if goodwill may be impaired. The Company performs an impairment assessment of its goodwill at least annually as of July 31st. Intangible assets are comprised of indefinite-lived intangible assets and finite-lived intangible assets acquired in a business acquisition. The value of contracts to manage assets in proprietary open-end funds and collective trust funds and certain other commingled products without a specified termination date is generally classified as indefinite-lived intangible assets. The assignment of indefinite lives to such contracts primarily is based upon the following: (i) the assumption that there is no foreseeable limit on the contract period to manage these products; (ii) the Company expects to, and has the ability to, continue to operate these products indefinitely; (iii) the products have multiple investors and are not reliant on a single investor or small group of investors for their continued operation; (iv) current competitive factors and economic conditions do not indicate a finite life; and (v) there is a high likelihood of continued renewal based on historical experience. In addition, trade names/trademarks are considered indefinite-lived intangible assets when they are expected to generate cash flows indefinitely. Indefinite-lived intangible assets and goodwill are not amortized. Finite-lived management contracts, which relate to acquired separate accounts and funds and investor/customer relationships with a specified termination date, are amortized over their remaining useful lives. The Company performs assessments to determine if any intangible assets are potentially impaired and whether the indefinite-lived and finite- lived classifications are still appropriate. The carrying value of finite-lived assets and their remaining useful lives are reviewed at least annually to determine if circumstances exist which may indicate a potential impairment or revisions to the amortization period. The Company performs impairment assessments of all of its intangible assets at least annually, as of July 31st. In evaluating whether it is more likely than not that the fair value of indefinite-lived intangibles is less than its carrying value, BlackRock assesses various significant qualitative factors, including assets under management (“AUM”), revenue basis points, projected AUM growth rates, operating margins, tax rates and discount rates. In addition, the Company considers other factors, including (i) macroeconomic conditions such as a deterioration in general economic conditions, limitations on accessing capital, fluctuations in foreign exchange rates, or other developments in equity and credit markets; (ii) industry and market considerations such as a deterioration in the environment in which the entity operates, an increased competitive environment, a decline in market-dependent multiples or metrics, a change in the market for an entity’s services, or regulatory, legal or political developments; and (iii) entity-specific events, such as a change in management or key personnel, overall financial performance and litigation that could affect significant inputs used to determine the fair value of the indefinite-lived intangible asset. If an indefinite-lived intangible is determined to be more likely than not impaired, then the fair value of the asset is compared with its carrying value and any excess of the carrying value over the fair value would be recognized as an expense in the period in which the impairment occurs. For finite-lived intangible assets, if potential impairment circumstances are considered to exist, the Company will perform a recoverability test using an undiscounted cash flow analysis. Actual results could differ from these cash flow estimates, which could materially impact the impairment conclusion. If the carrying value of the asset is determined not to be recoverable based on the undiscounted cash flow test, the difference between the carrying value of the asset and its current fair value would be recognized as an expense in the period in which the impairment occurs. Noncontrolling Interests. The Company reports noncontrolling interests as equity, separate from the parent’s equity, on the consolidated statements of financial condition. In addition, the Company’s consolidated net income on the consolidated statements of income includes the income (loss) attributable to noncontrolling interest holders of the Company’s consolidated investment products. Income (loss) attributable to noncontrolling interests is not adjusted for income taxes for consolidated investment products that are treated as pass-through entities for tax purposes. Classification and Measurement of Redeemable Securities. The Company includes redeemable noncontrolling interests related to certain consolidated investment products in temporary equity on the consolidated statements of financial condition. Treasury Stock. The Company records common stock purchased for treasury at cost. At the date of subsequent reissuance, the treasury stock account is reduced by the cost of such stock using the average cost method. F-12
Revenue Recognition. Revenue is recognized upon transfer of control of promised services to customers in an amount to which the Company expects to be entitled in exchange for those services. The Company enters into contracts that can include multiple services, which are accounted for separately if they are determined to be distinct. Consideration for the Company’s services is generally in the form of variable consideration because the amount of fees is subject to market conditions that are outside of the Company’s influence. The Company includes variable consideration in revenue when it is no longer probable of significant reversal, i.e. when the associated uncertainty is resolved. For some contracts with customers, the Company has discretion to involve a third party in providing services to the customer. Generally, the Company is deemed to be the principal in these arrangements because the Company controls the promised services before they are transferred to customers, and accordingly presents the revenue gross of related costs. Investment Advisory, Administration Fees and Securities Lending Revenue. Investment advisory and administration fees are recognized as the services are performed over time because the customer is receiving and consuming the benefits as they are provided by the Company. Fees are primarily based on agreed-upon percentages of AUM and recognized for services provided during the period, which are distinct from services provided in other periods. Such fees are affected by changes in AUM, including market appreciation or depreciation, foreign exchange translation and net inflows or outflows. Investment advisory and administration fees for investment funds are shown net of fee waivers. In addition, the Company may contract with third parties to provide sub-advisory services on its behalf. The Company presents the investment advisory fees and associated costs to such third-party advisors on a gross basis where it is deemed to be the principal and on a net basis where it is deemed to be the agent. Management judgment involved in making these assessments is focused on ascertaining whether the Company is primarily responsible for fulfilling the promised service. The Company earns revenue by lending securities on behalf of clients, primarily to highly rated banks and broker-dealers. Revenue is recognized over time as services are performed. Generally, the securities lending fees are shared between the Company and the funds or other third-party accounts managed by the Company from which the securities are borrowed. Investment Advisory Performance Fees / Carried Interest. The Company receives investment advisory performance fees, including incentive allocations (carried interest) from certain actively managed investment funds and certain separately managed accounts. These performance fees are dependent upon exceeding specified relative or absolute investment return thresholds, which may vary by product or account, and include monthly, quarterly, annual or longer measurement periods. Performance fees, including carried interest, are recognized when it is determined that they are no longer probable of significant reversal (such as upon the sale of a fund’s investment or when the amount of AUM becomes known as of the end of a specified measurement period). Given the unique nature of each fee arrangement, contracts with customers are evaluated on an individual basis to determine the timing of revenue recognition. Significant judgement is involved in making such determination. Performance fees typically arise from investment management services that began in prior reporting periods. Consequently, a portion of the fees the Company recognizes may be partially related to the services performed in prior periods that meet the recognition criteria in the current period. At each reporting date, the Company considers various factors in estimating performance fees to be recognized, including carried interest. These factors include but are not limited to whether: (1) the fees are dependent on the market and thus are highly susceptible to factors outside the Company’s influence; (2) the fees have a large number and a broad range of possible amounts; and (3) the funds or separately managed accounts have the ability to invest or reinvest their sales proceeds. The Company is allocated carried interest from certain alternative investment products upon exceeding performance thresholds. The Company may be required to reverse/return all, or part, of such carried interest allocations/distributions depending upon future performance of these funds. Therefore, carried interest subject to such clawback provisions is recorded in investments/investments of consolidated VIEs or cash/cash of consolidated VIEs to the extent that it is distributed, on its consolidated statements of financial condition. The Company records a liability for deferred carried interest to the extent it receives cash or capital allocations related to carried interest prior to meeting the revenue recognition criteria. A portion of the deferred carried interest may also be paid to certain employees. The ultimate timing of the recognition of performance fee revenue and related compensation expense, if any, for these products is unknown. Technology services revenue. The Company offers investment management technology systems, risk management services, wealth management and digital distribution tools on a fee basis. Clients include banks, insurance companies, official institutions, pension funds, asset managers, retail distributors and other investors. Fees earned for technology services are recorded as services are performed over time and are generally determined using the value of positions on the Aladdin platform or on a fixed-rate basis. Distribution Fees. The Company accounts for fund distribution services and shareholder servicing as distinct services, separate from fund management services, because customers can benefit from each of the services on their own and because the services are separately identifiable (that is, the nature of the promised services is to transfer each service individually). The Company records upfront and ongoing sales commissions as distribution fee revenue for serving as the principal underwriter and/or distributor for certain managed mutual funds. Fund distribution services are satisfied at the point in time when an investor makes an investment in a share class of the managed mutual funds. Accordingly, the Company recognizes the upfront fees for front-end load funds on a trade date basis when the services are performed and the amount is known. However, the on-going distribution fees (e.g., 12b-1 fees) from the back-end load funds are based on net asset values over the investment period and are recognized when the amount is known. Consequently, a portion of the on-going distribution fees the Company recognized may be related to the services performed in prior periods that meet the recognition criteria in the current period. Generally, retail products offered outside of the United States do not generate a separate distribution fee as the quoted management fee rate is inclusive of these services. The Company recognizes ongoing shareholder servicing fee revenue as shareholder services are performed over time. On- going distribution fees are largely passed through as a distribution expense to third-party client intermediaries who distribute the funds. The Company contracts with third parties for various fund distribution services and shareholder servicing of certain funds to be performed on its behalf. These arrangements are generally priced as a portion of the fee paid to the Company by the fund or as an agreed-upon percentage of net asset value. The Company presents its distribution fees and distribution and servicing costs incurred on a gross basis in the consolidated statements of income because it has primary responsibility for fulfilling the promise to provide the specified services. F-13
Advisory and other revenue. Advisory and other revenue primarily includes fees earned for advisory services, fees earned for transition management services primarily comprised of commissions recognized in connection with buying and selling securities on behalf of customers, and equity method investment earnings related to certain strategic investments. Advisory services fees are determined using fixed-rate fees and are recognized over time as the related services are completed. Commissions related to transition management services are recorded on a trade-date basis as securities transactions occur. Stock-based Compensation. In March 2016, the FASB issued ASU 2016-09, Improvements to Employee Share-Based Payment Accounting (“ASU 2016-09”). ASU 2016-09 simplifies accounting for employee share-based payment transactions, including the accounting for income taxes, forfeitures, and statutory tax withholding requirements, as well as classification in the consolidated statements of cash flows. The Company adopted ASU 2016-09 as of January 1, 2017. ASU 2016-09 requires all excess tax benefits and deficiencies to be recognized in income tax expense on the consolidated statements of income. Accordingly, the Company recorded a discrete income tax benefit of $64 million and $151 million during 2018 and 2017, respectively, for vested restricted stock units (“RSUs”) where the grant date stock price was lower than the vesting date stock price. The new guidance could result in more volatility of income tax expense as a result of fluctuations in the Company’s stock price. Upon adoption, the Company elected to account for forfeitures as they occur, which did not have a material impact on the consolidated financial statements. In addition, the Company elected to present excess tax benefits and deficiencies prospectively in operating activities on the consolidated statements of cash flows. The Company recognizes compensation cost for equity classified awards based on the grant-date fair value of the award. The compensation cost is recognized over the period during which an employee is required to provide service (usually the vesting period) in exchange for the stock-based award. The Company measures the grant-date fair value of RSUs using the Company’s share price on the date of grant. For employee share options and instruments with market conditions, the Company uses pricing models. Stock option awards may have performance, market and/or service conditions. If an equity award is modified after the grant-date, incremental compensation cost is recognized for an amount equal to the excess of the fair value of the modified award over the fair value of the original award immediately before the modification. Awards under the Company’s stock-based compensation plans vest over various periods. Compensation cost is recorded by the Company on a straight-line basis over the requisite service period for each separate vesting portion of the award as if the award is, in-substance, multiple awards and is adjusted for actual forfeitures as they occur during 2018 and 2017. For 2016, forfeitures were estimated prior to vesting. The Company amortizes the grant-date fair value of stock-based compensation awards made to retirement-eligible employees over the requisite service period. Upon notification of retirement, the Company accelerates the unamortized portion of the award over the contractually required retirement notification period. Distribution and Servicing Costs. Distribution and servicing costs include payments to third parties, primarily associated with distribution and servicing of client investments in certain BlackRock products. Distribution and servicing costs are expensed when incurred. Direct Fund Expense. Direct fund expense, which is expensed as incurred, primarily consists of third-party nonadvisory expense incurred by BlackRock related to certain funds for the use of certain index trademarks, reference data for certain indices, custodial services, fund administration, fund accounting, transfer agent services, shareholder reporting services, audit and tax services as well as other fund-related expense directly attributable to the nonadvisory operations of the fund. Leases. The Company accounts for its office facilities leases as operating leases, which may include escalation clauses. The Company expenses the lease payments associated with operating leases evenly during the lease term (including rent-free periods) commencing when the Company obtains the right to control the use of the leased property. Foreign Exchange. Foreign currency transactions are recorded at the exchange rates prevailing on the dates of the transactions. Monetary assets and liabilities that are denominated in foreign currencies are subsequently remeasured into the functional currencies of the Company's subsidiaries at the rates prevailing at each balance sheet date. Gains and losses arising on remeasurement are included in general and administration expense on the consolidated statements of income. Revenue and expenses are translated at average exchange rates during the period. Gains or losses resulting from translating foreign currency financial statements into US dollars are included in AOCI, a separate component of stockholders’ equity, on the consolidated statements of financial condition. Income Taxes. Deferred income tax assets and liabilities are recognized for the future tax consequences attributable to temporary differences between the financial statement carrying amounts of existing assets and liabilities and their respective tax bases using currently enacted tax rates in effect for the year in which the differences are expected to reverse. The effect of a change in tax rates on deferred income tax assets and liabilities is recognized on the consolidated statements of income in the period that includes the enactment date. Management periodically assesses the recoverability of its deferred income tax assets based upon expected future earnings, taxable income in prior carryback years, future deductibility of the asset, changes in applicable tax laws and other factors. If management determines that it is not more likely than not that the deferred tax asset will be fully recoverable in the future, a valuation allowance will be established for the difference between the asset balance and the amount expected to be recoverable in the future. This allowance will result in additional income tax expense. Further, the Company records its income taxes receivable and payable based upon its estimated income tax position. In 2018 and 2017, excess tax benefits related to stock-based compensation were recognized as an income tax benefit on the consolidated statements of income and are reflected as operating cash flows on the consolidated statements of cash flows. For 2016, excess tax benefits were recognized as additional paid-in capital and financing cash flows. Earnings per Share (“EPS”). Basic EPS is calculated by dividing net income applicable to common shareholders by the weighted-average number of shares outstanding during the period. Diluted EPS includes the determinants of basic EPS and common stock equivalents outstanding during the period. Diluted EPS is computed using the treasury stock method. F-14
Due to the similarities in terms between BlackRock’s nonvoting participating preferred stock and the Company’s common stock, the Company considers its nonvoting participating preferred stock to be a common stock equivalent for purposes of EPS calculations. As such, the Company has included the outstanding nonvoting participating preferred stock in the calculation of average basic and diluted shares outstanding. Business Segments. The Company’s management directs BlackRock’s operations as one business, the asset management business. The Company utilizes a consolidated approach to assess performance and allocate resources. As such, the Company operates in one business segment. Fair Value Measurements Hierarchy of Fair Value Inputs. The Company uses a fair value hierarchy that prioritizes inputs to valuation approaches used to measure fair value. The fair value hierarchy gives the highest priority to quoted prices (unadjusted) in active markets for identical assets or liabilities and the lowest priority to unobservable inputs. Assets and liabilities measured and reported at fair value are classified and disclosed in one of the following categories: Level 1 Inputs: Quoted prices (unadjusted) in active markets for identical assets or liabilities at the reporting date. • Level 1 assets may include listed mutual funds, ETFs, listed equities and certain exchange-traded derivatives. Level 2 Inputs: Quoted prices for similar assets or liabilities in active markets; quoted prices for identical or similar assets or liabilities that are not active; quotes from pricing services or brokers for which the Company can determine that orderly transactions took place at the quoted price or that the inputs used to arrive at the price are observable; and inputs other than quoted prices that are observable, such as models or other valuation methodologies. • Level 2 assets may include debt securities, investments in CLOs, bank loans, short-term floating-rate notes, asset- backed securities, securities held within consolidated hedge funds, restricted public securities valued at a discount, as well as over-the-counter derivatives, including interest and inflation rate swaps and foreign currency exchange contracts that have inputs to the valuations that generally can be corroborated by observable market data. Level 3 Inputs: Unobservable inputs for the valuation of the asset or liability, which may include nonbinding broker quotes. Level 3 assets include investments for which there is little, if any, market activity. These inputs require significant management judgment or estimation. • Level 3 assets may include direct private equity investments held within consolidated funds, investments in CLOs and bank loans of consolidated CLOs. • Level 3 liabilities include contingent liabilities related to acquisitions valued based upon discounted cash flow analyses using unobservable market data and borrowings of a consolidated CLO. Significance of Inputs. The Company’s assessment of the significance of a particular input to the fair value measurement in its entirety requires judgment and considers factors specific to the financial instrument. Valuation Approaches. The fair values of certain Level 3 assets and liabilities were determined using various valuation approaches as appropriate, including third-party pricing vendors, broker quotes and market and income approaches. A significant number of inputs used to value equity, debt securities, investments in CLOs and bank loans is sourced from third-party pricing vendors. Generally, prices obtained from pricing vendors are categorized as Level 1 inputs for identical securities traded in active markets and as Level 2 for other similar securities if the vendor uses observable inputs in determining the price. In addition, quotes obtained from brokers generally are nonbinding and categorized as Level 3 inputs. However, if the Company is able to determine that market participants have transacted for the asset in an orderly manner near the quoted price or if the Company can determine that the inputs used by the broker are observable, the quote is classified as a Level 2 input. Investments Measured at Net Asset Values. As a practical expedient, the Company uses net asset value (“NAV”) as the fair value for certain investments. The inputs to value these investments may include the Company’s capital accounts for its partnership interests in various alternative investments, including hedge funds, real assets and private equity funds, which may be adjusted by using the returns of certain market indices. The various partnerships generally are investment companies, which record their underlying investments at fair value based on fair value policies established by management of the underlying fund. Fair value policies at the underlying fund generally require the fund to utilize pricing/valuation information from third-party sources, including independent appraisals. However, in some instances, current valuation information for illiquid securities or securities in markets that are not active may not be available from any third-party source or fund management may conclude that the valuations that are available from third-party sources are not reliable. In these instances, fund management may perform model-based analytical valuations that could be used as an input to value these investments. Fair Value of Asset and Liabilities of Consolidated CLO. The Company applies the fair value option provisions for eligible assets, including bank loans, held by a consolidated CLO. As the fair value of the financial assets of the consolidated CLO is more observable than the fair value of the borrowings of the consolidated CLO, the Company measures the fair value of the borrowings of the consolidated CLO as the fair value of the assets of the consolidated CLO less the fair value of the Company’s economic interest in the CLO. Derivative Instruments and Hedging Activities. The Company does not use derivative financial instruments for trading or speculative purposes. The Company uses derivative financial instruments primarily for purposes of hedging exposures to fluctuations in foreign currency exchange rates of certain assets and liabilities, and market exposures for certain seed investments. However, certain consolidated sponsored investment funds may also utilize derivatives as a part of their investment strategy. Changes in the fair value of the Company’s derivative financial instruments are recognized in earnings and, where applicable, are offset by the corresponding gain or loss on the related foreign-denominated assets or liabilities or hedged investments, on the consolidated statements of income. F-15
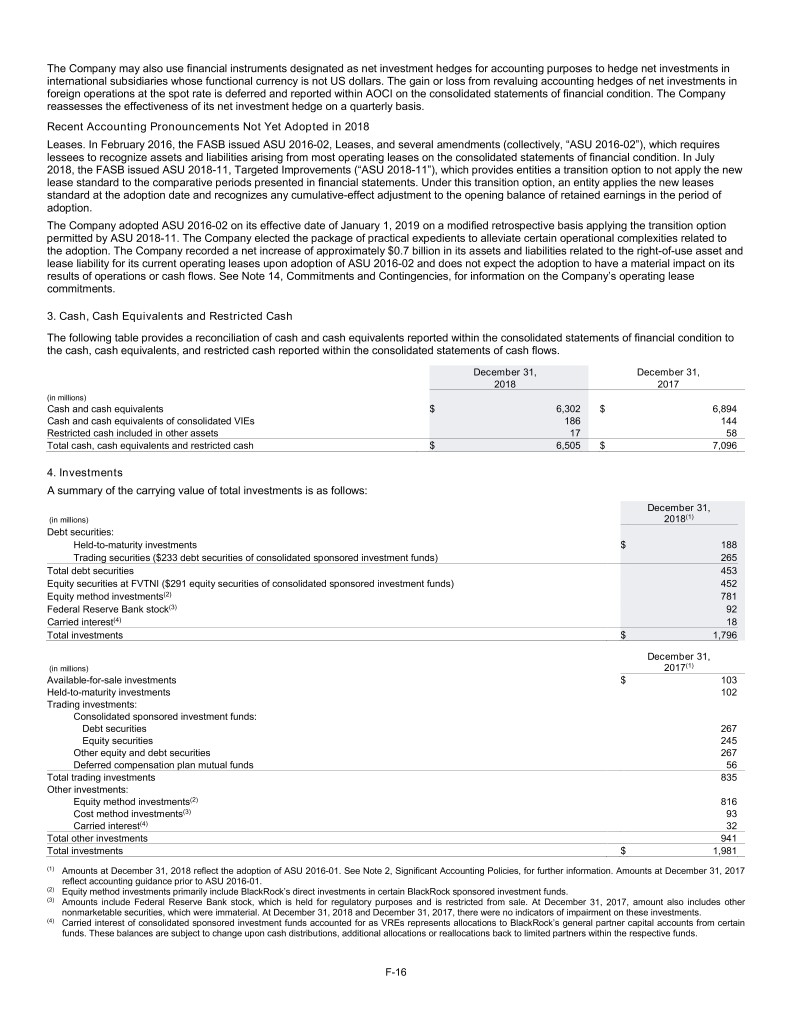
The Company may also use financial instruments designated as net investment hedges for accounting purposes to hedge net investments in international subsidiaries whose functional currency is not US dollars. The gain or loss from revaluing accounting hedges of net investments in foreign operations at the spot rate is deferred and reported within AOCI on the consolidated statements of financial condition. The Company reassesses the effectiveness of its net investment hedge on a quarterly basis. Recent Accounting Pronouncements Not Yet Adopted in 2018 Leases. In February 2016, the FASB issued ASU 2016-02, Leases, and several amendments (collectively, “ASU 2016-02”), which requires lessees to recognize assets and liabilities arising from most operating leases on the consolidated statements of financial condition. In July 2018, the FASB issued ASU 2018-11, Targeted Improvements (“ASU 2018-11”), which provides entities a transition option to not apply the new lease standard to the comparative periods presented in financial statements. Under this transition option, an entity applies the new leases standard at the adoption date and recognizes any cumulative-effect adjustment to the opening balance of retained earnings in the period of adoption. The Company adopted ASU 2016-02 on its effective date of January 1, 2019 on a modified retrospective basis applying the transition option permitted by ASU 2018-11. The Company elected the package of practical expedients to alleviate certain operational complexities related to the adoption. The Company recorded a net increase of approximately $0.7 billion in its assets and liabilities related to the right-of-use asset and lease liability for its current operating leases upon adoption of ASU 2016-02 and does not expect the adoption to have a material impact on its results of operations or cash flows. See Note 14, Commitments and Contingencies, for information on the Company’s operating lease commitments. 3. Cash, Cash Equivalents and Restricted Cash The following table provides a reconciliation of cash and cash equivalents reported within the consolidated statements of financial condition to the cash, cash equivalents, and restricted cash reported within the consolidated statements of cash flows. December 31, December 31, 2018 2017 (in millions) Cash and cash equivalents $ 6,302 $ 6,894 Cash and cash equivalents of consolidated VIEs 186 144 Restricted cash included in other assets 17 58 Total cash, cash equivalents and restricted cash $ 6,505 $ 7,096 4. Investments A summary of the carrying value of total investments is as follows: December 31, (in millions) 2018(1) Debt securities: Held-to-maturity investments $ 188 Trading securities ($233 debt securities of consolidated sponsored investment funds) 265 Total debt securities 453 Equity securities at FVTNI ($291 equity securities of consolidated sponsored investment funds) 452 Equity method investments(2) 781 Federal Reserve Bank stock(3) 92 Carried interest(4) 18 Total investments $ 1,796 December 31, (in millions) 2017(1) Available-for-sale investments $ 103 Held-to-maturity investments 102 Trading investments: Consolidated sponsored investment funds: Debt securities 267 Equity securities 245 Other equity and debt securities 267 Deferred compensation plan mutual funds 56 Total trading investments 835 Other investments: Equity method investments(2) 816 Cost method investments(3) 93 Carried interest(4) 32 Total other investments 941 Total investments $ 1,981 (1) Amounts at December 31, 2018 reflect the adoption of ASU 2016-01. See Note 2, Significant Accounting Policies, for further information. Amounts at December 31, 2017 reflect accounting guidance prior to ASU 2016-01. (2) Equity method investments primarily include BlackRock’s direct investments in certain BlackRock sponsored investment funds. (3) Amounts include Federal Reserve Bank stock, which is held for regulatory purposes and is restricted from sale. At December 31, 2017, amount also includes other nonmarketable securities, which were immaterial. At December 31, 2018 and December 31, 2017, there were no indicators of impairment on these investments. (4) Carried interest of consolidated sponsored investment funds accounted for as VREs represents allocations to BlackRock’s general partner capital accounts from certain funds. These balances are subject to change upon cash distributions, additional allocations or reallocations back to limited partners within the respective funds. F-16
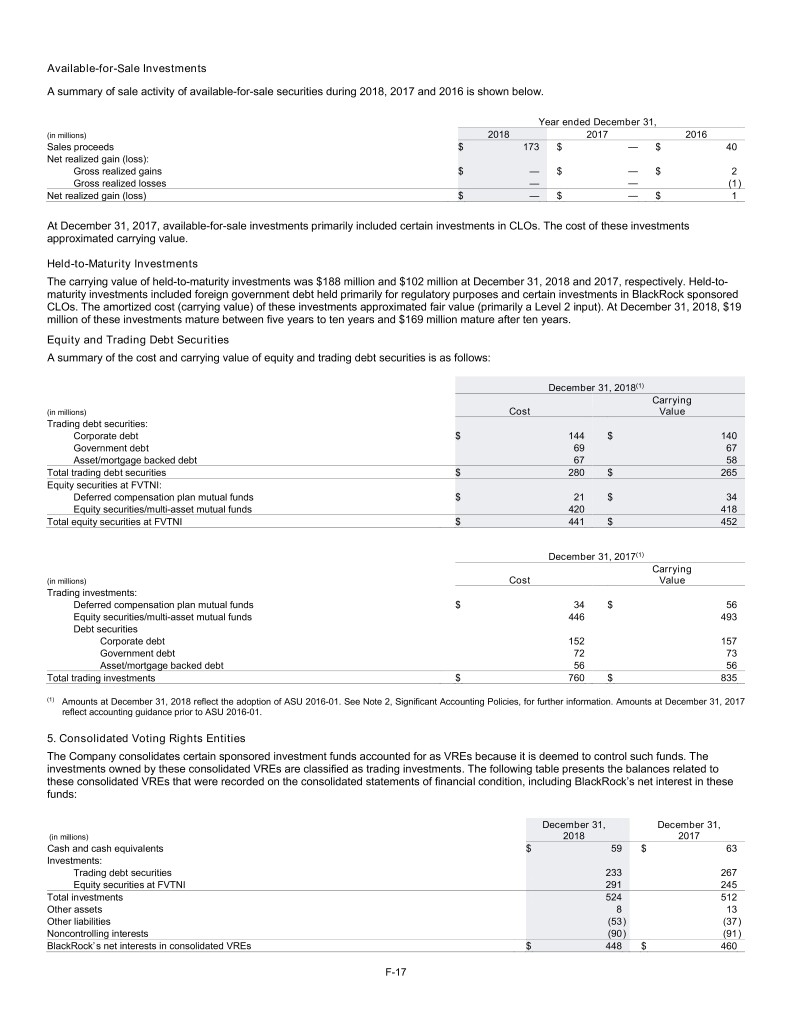
Available-for-Sale Investments A summary of sale activity of available-for-sale securities during 2018, 2017 and 2016 is shown below. Year ended December 31, (in millions) 2018 2017 2016 Sales proceeds $ 173 $ — $ 40 Net realized gain (loss): Gross realized gains $ — $ — $ 2 Gross realized losses — — (1 ) Net realized gain (loss) $ — $ — $ 1 At December 31, 2017, available-for-sale investments primarily included certain investments in CLOs. The cost of these investments approximated carrying value. Held-to-Maturity Investments The carrying value of held-to-maturity investments was $188 million and $102 million at December 31, 2018 and 2017, respectively. Held-to- maturity investments included foreign government debt held primarily for regulatory purposes and certain investments in BlackRock sponsored CLOs. The amortized cost (carrying value) of these investments approximated fair value (primarily a Level 2 input). At December 31, 2018, $19 million of these investments mature between five years to ten years and $169 million mature after ten years. Equity and Trading Debt Securities A summary of the cost and carrying value of equity and trading debt securities is as follows: December 31, 2018(1) Carrying (in millions) Cost Value Trading debt securities: Corporate debt $ 144 $ 140 Government debt 69 67 Asset/mortgage backed debt 67 58 Total trading debt securities $ 280 $ 265 Equity securities at FVTNI: Deferred compensation plan mutual funds $ 21 $ 34 Equity securities/multi-asset mutual funds 420 418 Total equity securities at FVTNI $ 441 $ 452 December 31, 2017(1) Carrying (in millions) Cost Value Trading investments: Deferred compensation plan mutual funds $ 34 $ 56 Equity securities/multi-asset mutual funds 446 493 Debt securities Corporate debt 152 157 Government debt 72 73 Asset/mortgage backed debt 56 56 Total trading investments $ 760 $ 835 (1) Amounts at December 31, 2018 reflect the adoption of ASU 2016-01. See Note 2, Significant Accounting Policies, for further information. Amounts at December 31, 2017 reflect accounting guidance prior to ASU 2016-01. 5. Consolidated Voting Rights Entities The Company consolidates certain sponsored investment funds accounted for as VREs because it is deemed to control such funds. The investments owned by these consolidated VREs are classified as trading investments. The following table presents the balances related to these consolidated VREs that were recorded on the consolidated statements of financial condition, including BlackRock’s net interest in these funds: December 31, December 31, (in millions) 2018 2017 Cash and cash equivalents $ 59 $ 63 Investments: Trading debt securities 233 267 Equity securities at FVTNI 291 245 Total investments 524 512 Other assets 8 13 Other liabilities (53 ) (37 ) Noncontrolling interests (90 ) (91 ) BlackRock’s net interests in consolidated VREs $ 448 $ 460 F-17
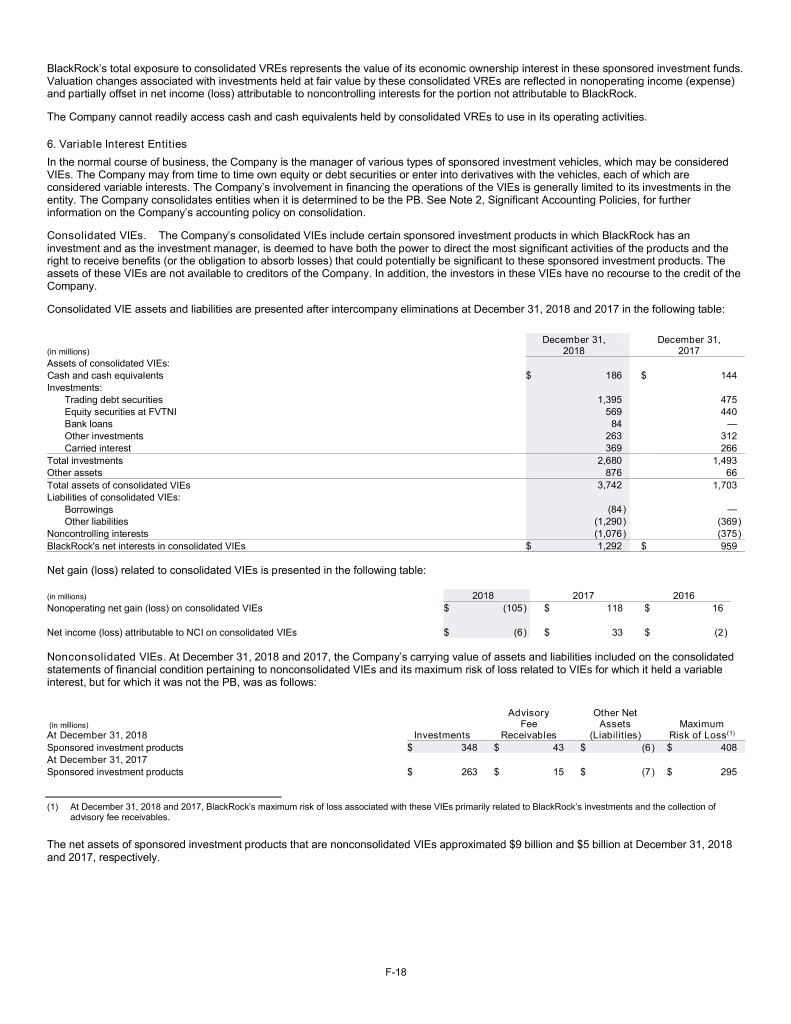
BlackRock’s total exposure to consolidated VREs represents the value of its economic ownership interest in these sponsored investment funds. Valuation changes associated with investments held at fair value by these consolidated VREs are reflected in nonoperating income (expense) and partially offset in net income (loss) attributable to noncontrolling interests for the portion not attributable to BlackRock. The Company cannot readily access cash and cash equivalents held by consolidated VREs to use in its operating activities. 6. Variable Interest Entities In the normal course of business, the Company is the manager of various types of sponsored investment vehicles, which may be considered VIEs. The Company may from time to time own equity or debt securities or enter into derivatives with the vehicles, each of which are considered variable interests. The Company’s involvement in financing the operations of the VIEs is generally limited to its investments in the entity. The Company consolidates entities when it is determined to be the PB. See Note 2, Significant Accounting Policies, for further information on the Company’s accounting policy on consolidation. Consolidated VIEs. The Company’s consolidated VIEs include certain sponsored investment products in which BlackRock has an investment and as the investment manager, is deemed to have both the power to direct the most significant activities of the products and the right to receive benefits (or the obligation to absorb losses) that could potentially be significant to these sponsored investment products. The assets of these VIEs are not available to creditors of the Company. In addition, the investors in these VIEs have no recourse to the credit of the Company. Consolidated VIE assets and liabilities are presented after intercompany eliminations at December 31, 2018 and 2017 in the following table: December 31, December 31, (in millions) 2018 2017 Assets of consolidated VIEs: Cash and cash equivalents $ 186 $ 144 Investments: Trading debt securities 1,395 475 Equity securities at FVTNI 569 440 Bank loans 84 — Other investments 263 312 Carried interest 369 266 Total investments 2,680 1,493 Other assets 876 66 Total assets of consolidated VIEs 3,742 1,703 Liabilities of consolidated VIEs: Borrowings (84 ) — Other liabilities (1,290 ) (369 ) Noncontrolling interests (1,076 ) (375 ) BlackRock's net interests in consolidated VIEs $ 1,292 $ 959 Net gain (loss) related to consolidated VIEs is presented in the following table: (in millions) 2018 2017 2016 Nonoperating net gain (loss) on consolidated VIEs $ (105 ) $ 118 $ 16 Net income (loss) attributable to NCI on consolidated VIEs $ (6 ) $ 33 $ (2 ) Nonconsolidated VIEs. At December 31, 2018 and 2017, the Company’s carrying value of assets and liabilities included on the consolidated statements of financial condition pertaining to nonconsolidated VIEs and its maximum risk of loss related to VIEs for which it held a variable interest, but for which it was not the PB, was as follows: Advisory Other Net (in millions) Fee Assets Maximum At December 31, 2018 Investments Receivables (Liabilities) Risk of Loss(1) Sponsored investment products $ 348 $ 43 $ (6 ) $ 408 At December 31, 2017 Sponsored investment products $ 263 $ 15 $ (7 ) $ 295 (1) At December 31, 2018 and 2017, BlackRock’s maximum risk of loss associated with these VIEs primarily related to BlackRock’s investments and the collection of advisory fee receivables. The net assets of sponsored investment products that are nonconsolidated VIEs approximated $9 billion and $5 billion at December 31, 2018 and 2017, respectively. F-18
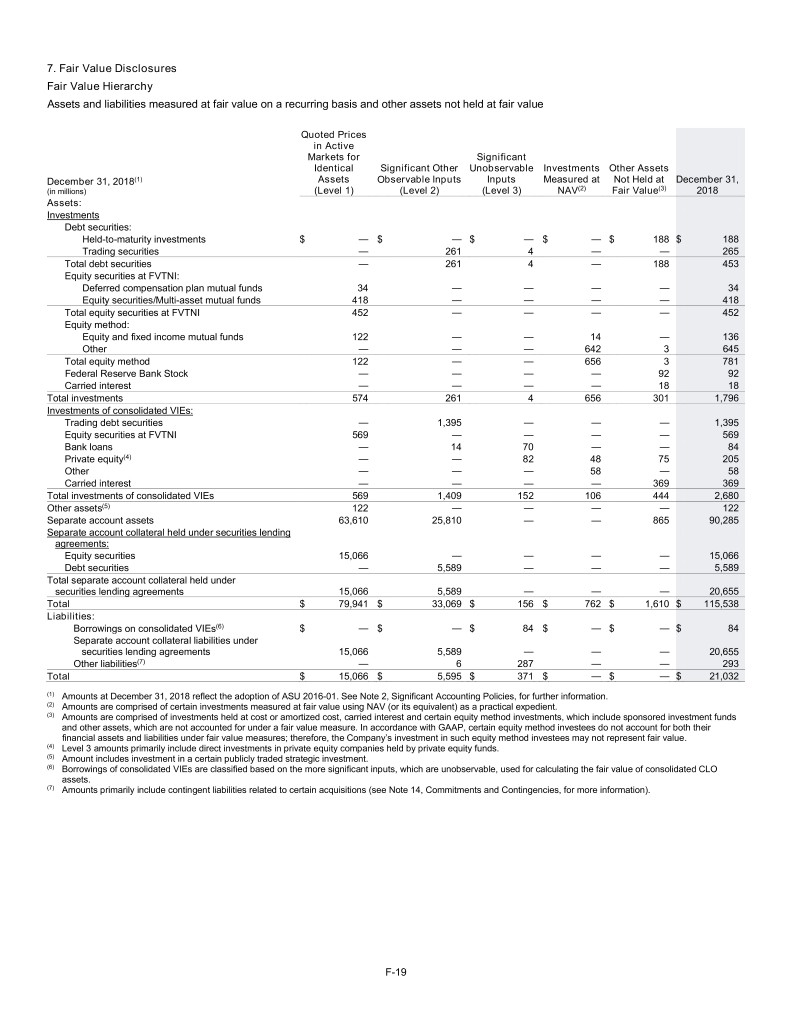
7. Fair Value Disclosures Fair Value Hierarchy Assets and liabilities measured at fair value on a recurring basis and other assets not held at fair value Quoted Prices in Active Markets for Significant Identical Significant Other Unobservable Investments Other Assets December 31, 2018(1) Assets Observable Inputs Inputs Measured at Not Held at December 31, (in millions) (Level 1) (Level 2) (Level 3) NAV(2) Fair Value(3) 2018 Assets: Investments Debt securities: Held-to-maturity investments $ — $ — $ — $ — $ 188 $ 188 Trading securities — 261 4 — — 265 Total debt securities — 261 4 — 188 453 Equity securities at FVTNI: Deferred compensation plan mutual funds 34 — — — — 34 Equity securities/Multi-asset mutual funds 418 — — — — 418 Total equity securities at FVTNI 452 — — — — 452 Equity method: Equity and fixed income mutual funds 122 — — 14 — 136 Other — — — 642 3 645 Total equity method 122 — — 656 3 781 Federal Reserve Bank Stock — — — — 92 92 Carried interest — — — — 18 18 Total investments 574 261 4 656 301 1,796 Investments of consolidated VIEs: Trading debt securities — 1,395 — — — 1,395 Equity securities at FVTNI 569 — — — — 569 Bank loans — 14 70 — — 84 Private equity(4) — — 82 48 75 205 Other — — — 58 — 58 Carried interest — — — — 369 369 Total investments of consolidated VIEs 569 1,409 152 106 444 2,680 Other assets(5) 122 — — — — 122 Separate account assets 63,610 25,810 — — 865 90,285 Separate account collateral held under securities lending agreements: Equity securities 15,066 — — — — 15,066 Debt securities — 5,589 — — — 5,589 Total separate account collateral held under securities lending agreements 15,066 5,589 — — — 20,655 Total $ 79,941 $ 33,069 $ 156 $ 762 $ 1,610 $ 115,538 Liabilities: Borrowings on consolidated VIEs(6) $ — $ — $ 84 $ — $ — $ 84 Separate account collateral liabilities under securities lending agreements 15,066 5,589 — — — 20,655 Other liabilities(7) — 6 287 — — 293 Total $ 15,066 $ 5,595 $ 371 $ — $ — $ 21,032 (1) Amounts at December 31, 2018 reflect the adoption of ASU 2016-01. See Note 2, Significant Accounting Policies, for further information. (2) Amounts are comprised of certain investments measured at fair value using NAV (or its equivalent) as a practical expedient. (3) Amounts are comprised of investments held at cost or amortized cost, carried interest and certain equity method investments, which include sponsored investment funds and other assets, which are not accounted for under a fair value measure. In accordance with GAAP, certain equity method investees do not account for both their financial assets and liabilities under fair value measures; therefore, the Company’s investment in such equity method investees may not represent fair value. (4) Level 3 amounts primarily include direct investments in private equity companies held by private equity funds. (5) Amount includes investment in a certain publicly traded strategic investment. (6) Borrowings of consolidated VIEs are classified based on the more significant inputs, which are unobservable, used for calculating the fair value of consolidated CLO assets. (7) Amounts primarily include contingent liabilities related to certain acquisitions (see Note 14, Commitments and Contingencies, for more information). F-19
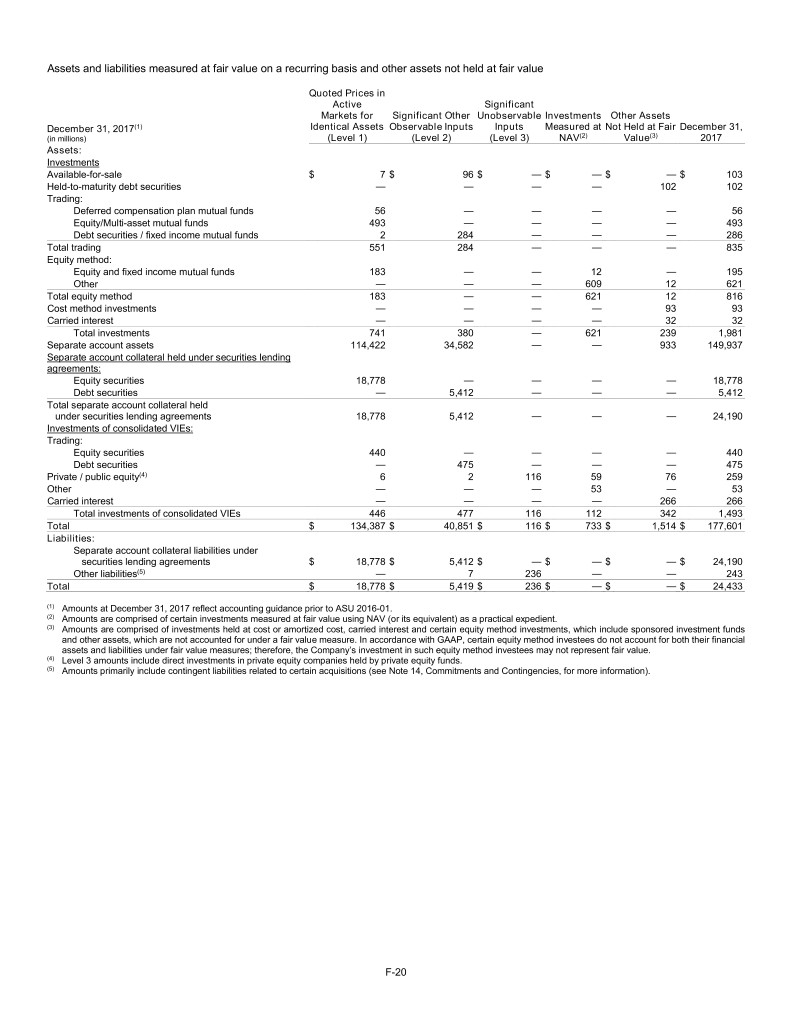
Assets and liabilities measured at fair value on a recurring basis and other assets not held at fair value Quoted Prices in Active Significant Markets for Significant Other Unobservable Investments Other Assets December 31, 2017(1) Identical Assets Observable Inputs Inputs Measured at Not Held at Fair December 31, (in millions) (Level 1) (Level 2) (Level 3) NAV(2) Value(3) 2017 Assets: Investments Available-for-sale $ 7 $ 96 $ — $ — $ — $ 103 Held-to-maturity debt securities — — — — 102 102 Trading: Deferred compensation plan mutual funds 56 — — — — 56 Equity/Multi-asset mutual funds 493 — — — — 493 Debt securities / fixed income mutual funds 2 284 — — — 286 Total trading 551 284 — — — 835 Equity method: Equity and fixed income mutual funds 183 — — 12 — 195 Other — — — 609 12 621 Total equity method 183 — — 621 12 816 Cost method investments — — — — 93 93 Carried interest — — — — 32 32 Total investments 741 380 — 621 239 1,981 Separate account assets 114,422 34,582 — — 933 149,937 Separate account collateral held under securities lending agreements: Equity securities 18,778 — — — — 18,778 Debt securities — 5,412 — — — 5,412 Total separate account collateral held under securities lending agreements 18,778 5,412 — — — 24,190 Investments of consolidated VIEs: Trading: Equity securities 440 — — — — 440 Debt securities — 475 — — — 475 Private / public equity(4) 6 2 116 59 76 259 Other — — — 53 — 53 Carried interest — — — — 266 266 Total investments of consolidated VIEs 446 477 116 112 342 1,493 Total $ 134,387 $ 40,851 $ 116 $ 733 $ 1,514 $ 177,601 Liabilities: Separate account collateral liabilities under securities lending agreements $ 18,778 $ 5,412 $ — $ — $ — $ 24,190 Other liabilities(5) — 7 236 — — 243 Total $ 18,778 $ 5,419 $ 236 $ — $ — $ 24,433 (1) Amounts at December 31, 2017 reflect accounting guidance prior to ASU 2016-01. (2) Amounts are comprised of certain investments measured at fair value using NAV (or its equivalent) as a practical expedient. (3) Amounts are comprised of investments held at cost or amortized cost, carried interest and certain equity method investments, which include sponsored investment funds and other assets, which are not accounted for under a fair value measure. In accordance with GAAP, certain equity method investees do not account for both their financial assets and liabilities under fair value measures; therefore, the Company’s investment in such equity method investees may not represent fair value. (4) Level 3 amounts include direct investments in private equity companies held by private equity funds. (5) Amounts primarily include contingent liabilities related to certain acquisitions (see Note 14, Commitments and Contingencies, for more information). F-20
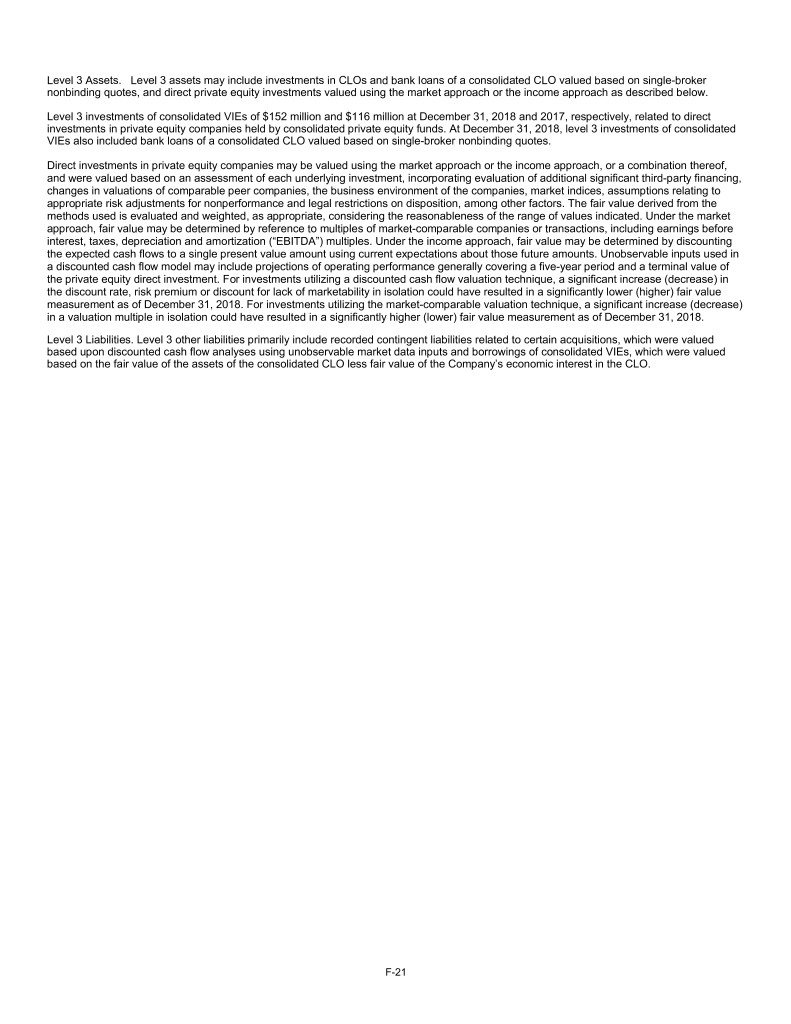
Level 3 Assets. Level 3 assets may include investments in CLOs and bank loans of a consolidated CLO valued based on single-broker nonbinding quotes, and direct private equity investments valued using the market approach or the income approach as described below. Level 3 investments of consolidated VIEs of $152 million and $116 million at December 31, 2018 and 2017, respectively, related to direct investments in private equity companies held by consolidated private equity funds. At December 31, 2018, level 3 investments of consolidated VIEs also included bank loans of a consolidated CLO valued based on single-broker nonbinding quotes. Direct investments in private equity companies may be valued using the market approach or the income approach, or a combination thereof, and were valued based on an assessment of each underlying investment, incorporating evaluation of additional significant third-party financing, changes in valuations of comparable peer companies, the business environment of the companies, market indices, assumptions relating to appropriate risk adjustments for nonperformance and legal restrictions on disposition, among other factors. The fair value derived from the methods used is evaluated and weighted, as appropriate, considering the reasonableness of the range of values indicated. Under the market approach, fair value may be determined by reference to multiples of market-comparable companies or transactions, including earnings before interest, taxes, depreciation and amortization (“EBITDA”) multiples. Under the income approach, fair value may be determined by discounting the expected cash flows to a single present value amount using current expectations about those future amounts. Unobservable inputs used in a discounted cash flow model may include projections of operating performance generally covering a five-year period and a terminal value of the private equity direct investment. For investments utilizing a discounted cash flow valuation technique, a significant increase (decrease) in the discount rate, risk premium or discount for lack of marketability in isolation could have resulted in a significantly lower (higher) fair value measurement as of December 31, 2018. For investments utilizing the market-comparable valuation technique, a significant increase (decrease) in a valuation multiple in isolation could have resulted in a significantly higher (lower) fair value measurement as of December 31, 2018. Level 3 Liabilities. Level 3 other liabilities primarily include recorded contingent liabilities related to certain acquisitions, which were valued based upon discounted cash flow analyses using unobservable market data inputs and borrowings of consolidated VIEs, which were valued based on the fair value of the assets of the consolidated CLO less fair value of the Company’s economic interest in the CLO. F-21
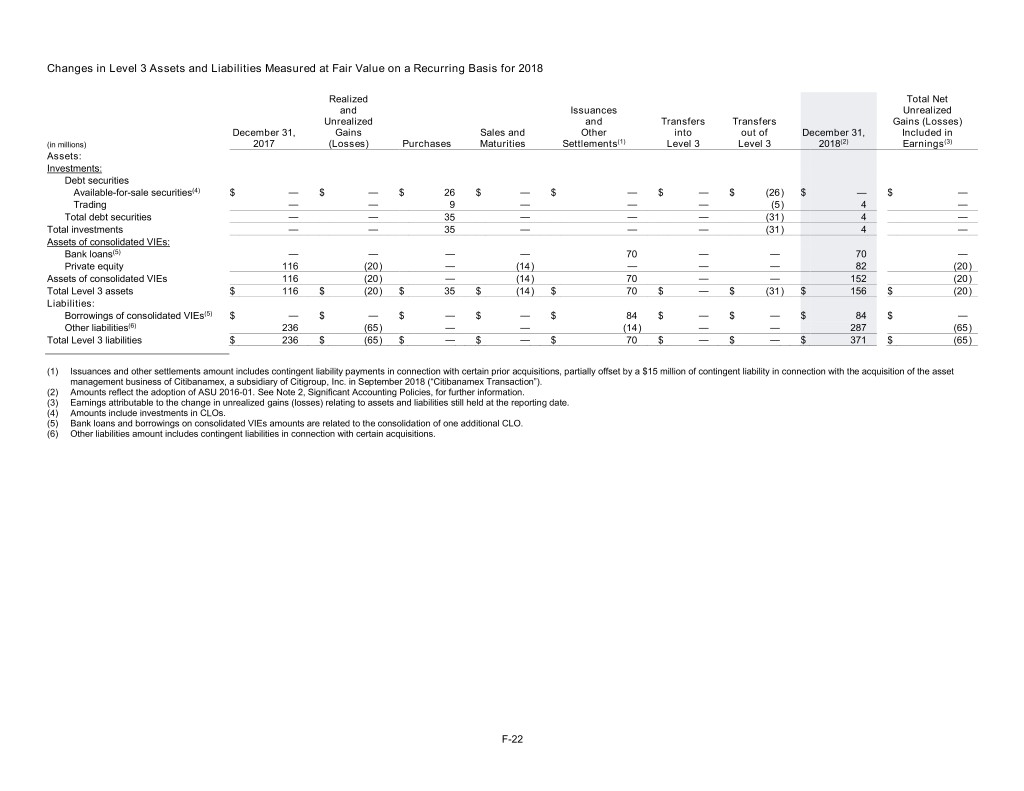
Changes in Level 3 Assets and Liabilities Measured at Fair Value on a Recurring Basis for 2018 Realized Total Net and Issuances Unrealized Unrealized and Transfers Transfers Gains (Losses) December 31, Gains Sales and Other into out of December 31, Included in (in millions) 2017 (Losses) Purchases Maturities Settlements(1) Level 3 Level 3 2018(2) Earnings(3) Assets: Investments: Debt securities Available-for-sale securities(4) $ — $ — $ 26 $ — $ — $ — $ (26 ) $ — $ — Trading — — 9 — — — (5 ) 4 — Total debt securities — — 35 — — — (31 ) 4 — Total investments — — 35 — — — (31 ) 4 — Assets of consolidated VIEs: Bank loans(5) — — — — 70 — — 70 — Private equity 116 (20 ) — (14 ) — — — 82 (20 ) Assets of consolidated VIEs 116 (20 ) — (14 ) 70 — — 152 (20 ) Total Level 3 assets $ 116 $ (20 ) $ 35 $ (14 ) $ 70 $ — $ (31 ) $ 156 $ (20 ) Liabilities: Borrowings of consolidated VIEs(5) $ — $ — $ — $ — $ 84 $ — $ — $ 84 $ — Other liabilities(6) 236 (65 ) — — (14 ) — — 287 (65 ) Total Level 3 liabilities $ 236 $ (65 ) $ — $ — $ 70 $ — $ — $ 371 $ (65 ) (1) Issuances and other settlements amount includes contingent liability payments in connection with certain prior acquisitions, partially offset by a $15 million of contingent liability in connection with the acquisition of the asset management business of Citibanamex, a subsidiary of Citigroup, Inc. in September 2018 (“Citibanamex Transaction”). (2) Amounts reflect the adoption of ASU 2016-01. See Note 2, Significant Accounting Policies, for further information. (3) Earnings attributable to the change in unrealized gains (losses) relating to assets and liabilities still held at the reporting date. (4) Amounts include investments in CLOs. (5) Bank loans and borrowings on consolidated VIEs amounts are related to the consolidation of one additional CLO. (6) Other liabilities amount includes contingent liabilities in connection with certain acquisitions. F-22
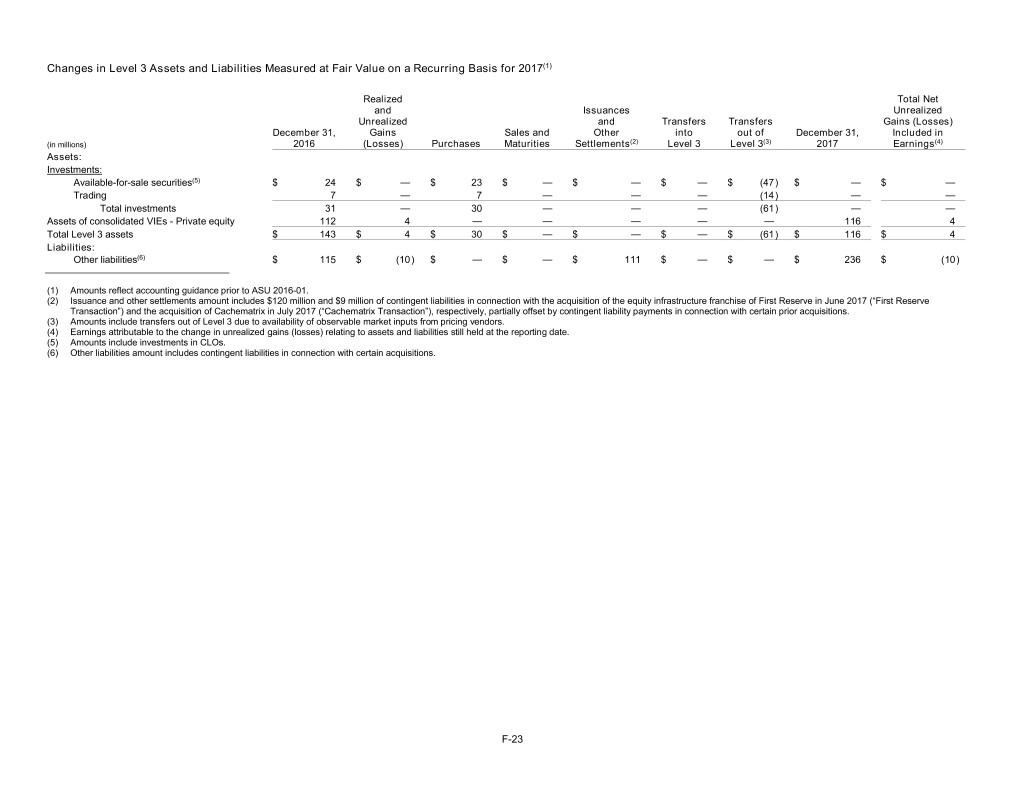
Changes in Level 3 Assets and Liabilities Measured at Fair Value on a Recurring Basis for 2017(1) Realized Total Net and Issuances Unrealized Unrealized and Transfers Transfers Gains (Losses) December 31, Gains Sales and Other into out of December 31, Included in (in millions) 2016 (Losses) Purchases Maturities Settlements(2) Level 3 Level 3(3) 2017 Earnings(4) Assets: Investments: Available-for-sale securities(5) $ 24 $ — $ 23 $ — $ — $ — $ (47 ) $ — $ — Trading 7 — 7 — — — (14 ) — — Total investments 31 — 30 — — — (61 ) — — Assets of consolidated VIEs - Private equity 112 4 — — — — — 116 4 Total Level 3 assets $ 143 $ 4 $ 30 $ — $ — $ — $ (61 ) $ 116 $ 4 Liabilities: Other liabilities(6) $ 115 $ (10 ) $ — $ — $ 111 $ — $ — $ 236 $ (10 ) (1) Amounts reflect accounting guidance prior to ASU 2016-01. (2) Issuance and other settlements amount includes $120 million and $9 million of contingent liabilities in connection with the acquisition of the equity infrastructure franchise of First Reserve in June 2017 (“First Reserve Transaction”) and the acquisition of Cachematrix in July 2017 (“Cachematrix Transaction”), respectively, partially offset by contingent liability payments in connection with certain prior acquisitions. (3) Amounts include transfers out of Level 3 due to availability of observable market inputs from pricing vendors. (4) Earnings attributable to the change in unrealized gains (losses) relating to assets and liabilities still held at the reporting date. (5) Amounts include investments in CLOs. (6) Other liabilities amount includes contingent liabilities in connection with certain acquisitions. F-23
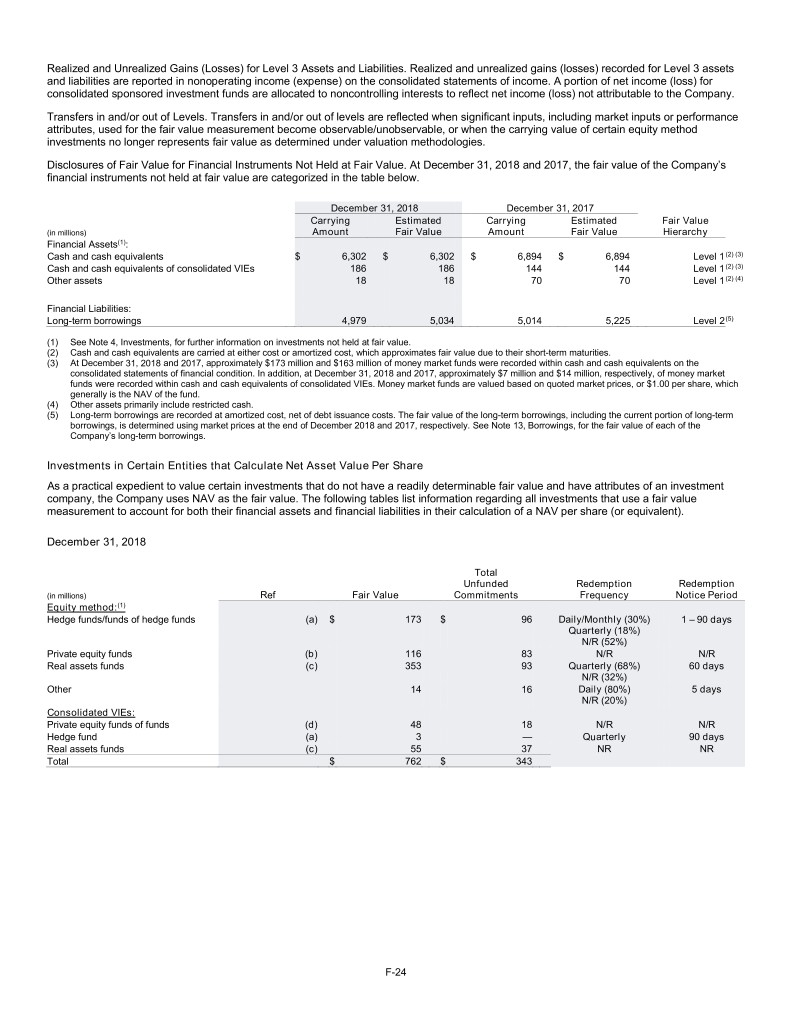
Realized and Unrealized Gains (Losses) for Level 3 Assets and Liabilities. Realized and unrealized gains (losses) recorded for Level 3 assets and liabilities are reported in nonoperating income (expense) on the consolidated statements of income. A portion of net income (loss) for consolidated sponsored investment funds are allocated to noncontrolling interests to reflect net income (loss) not attributable to the Company. Transfers in and/or out of Levels. Transfers in and/or out of levels are reflected when significant inputs, including market inputs or performance attributes, used for the fair value measurement become observable/unobservable, or when the carrying value of certain equity method investments no longer represents fair value as determined under valuation methodologies. Disclosures of Fair Value for Financial Instruments Not Held at Fair Value. At December 31, 2018 and 2017, the fair value of the Company’s financial instruments not held at fair value are categorized in the table below. December 31, 2018 December 31, 2017 Carrying Estimated Carrying Estimated Fair Value (in millions) Amount Fair Value Amount Fair Value Hierarchy Financial Assets(1): Cash and cash equivalents $ 6,302 $ 6,302 $ 6,894 $ 6,894 Level 1 (2) (3) Cash and cash equivalents of consolidated VIEs 186 186 144 144 Level 1 (2) (3) Other assets 18 18 70 70 Level 1 (2) (4) Financial Liabilities: Long-term borrowings 4,979 5,034 5,014 5,225 Level 2 (5) (1) See Note 4, Investments, for further information on investments not held at fair value. (2) Cash and cash equivalents are carried at either cost or amortized cost, which approximates fair value due to their short-term maturities. (3) At December 31, 2018 and 2017, approximately $173 million and $163 million of money market funds were recorded within cash and cash equivalents on the consolidated statements of financial condition. In addition, at December 31, 2018 and 2017, approximately $7 million and $14 million, respectively, of money market funds were recorded within cash and cash equivalents of consolidated VIEs. Money market funds are valued based on quoted market prices, or $1.00 per share, which generally is the NAV of the fund. (4) Other assets primarily include restricted cash. (5) Long-term borrowings are recorded at amortized cost, net of debt issuance costs. The fair value of the long-term borrowings, including the current portion of long-term borrowings, is determined using market prices at the end of December 2018 and 2017, respectively. See Note 13, Borrowings, for the fair value of each of the Company’s long-term borrowings. Investments in Certain Entities that Calculate Net Asset Value Per Share As a practical expedient to value certain investments that do not have a readily determinable fair value and have attributes of an investment company, the Company uses NAV as the fair value. The following tables list information regarding all investments that use a fair value measurement to account for both their financial assets and financial liabilities in their calculation of a NAV per share (or equivalent). December 31, 2018 Total Unfunded Redemption Redemption (in millions) Ref Fair Value Commitments Frequency Notice Period Equity method:(1) Hedge funds/funds of hedge funds (a) $ 173 $ 96 Daily/Monthly (30%) 1 – 90 days Quarterly (18%) N/R (52%) Private equity funds (b) 116 83 N/R N/R Real assets funds (c) 353 93 Quarterly (68%) 60 days N/R (32%) Other 14 16 Daily (80%) 5 days N/R (20%) Consolidated VIEs: Private equity funds of funds (d) 48 18 N/R N/R Hedge fund (a) 3 — Quarterly 90 days Real assets funds (c) 55 37 NR NR Total $ 762 $ 343 F-24
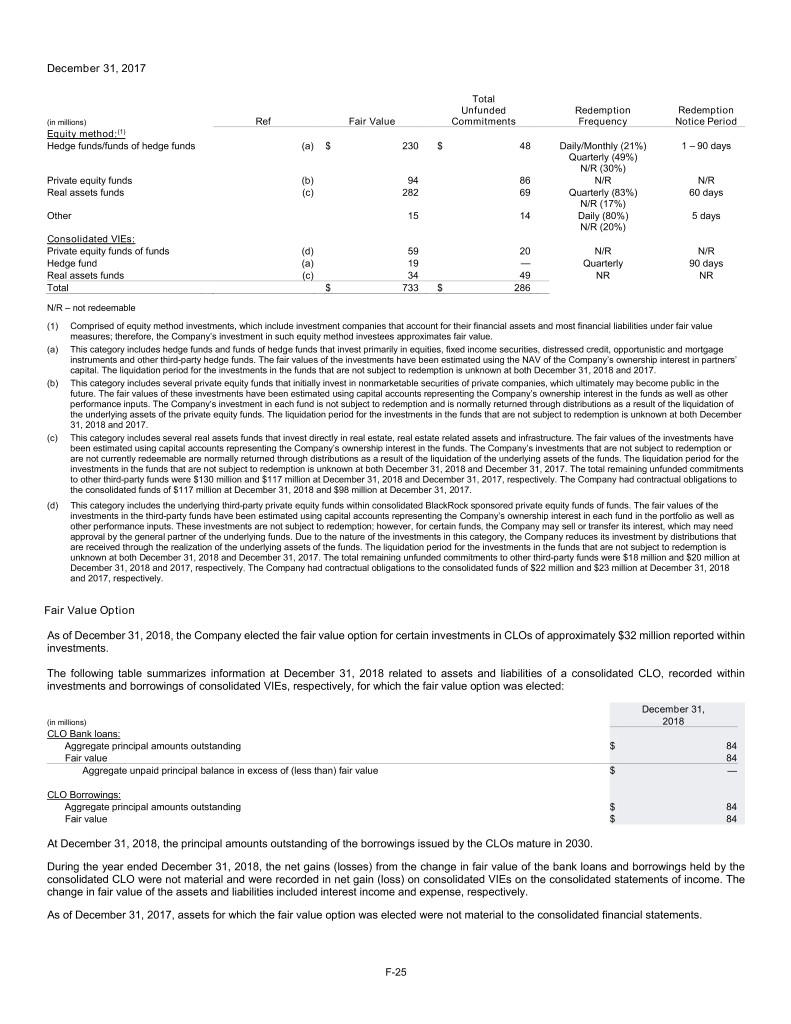
December 31, 2017 Total Unfunded Redemption Redemption (in millions) Ref Fair Value Commitments Frequency Notice Period Equity method:(1) Hedge funds/funds of hedge funds (a) $ 230 $ 48 Daily/Monthly (21%) 1 – 90 days Quarterly (49%) N/R (30%) Private equity funds (b) 94 86 N/R N/R Real assets funds (c) 282 69 Quarterly (83%) 60 days N/R (17%) Other 15 14 Daily (80%) 5 days N/R (20%) Consolidated VIEs: Private equity funds of funds (d) 59 20 N/R N/R Hedge fund (a) 19 — Quarterly 90 days Real assets funds (c) 34 49 NR NR Total $ 733 $ 286 N/R – not redeemable (1) Comprised of equity method investments, which include investment companies that account for their financial assets and most financial liabilities under fair value measures; therefore, the Company’s investment in such equity method investees approximates fair value. (a) This category includes hedge funds and funds of hedge funds that invest primarily in equities, fixed income securities, distressed credit, opportunistic and mortgage instruments and other third-party hedge funds. The fair values of the investments have been estimated using the NAV of the Company’s ownership interest in partners’ capital. The liquidation period for the investments in the funds that are not subject to redemption is unknown at both December 31, 2018 and 2017. (b) This category includes several private equity funds that initially invest in nonmarketable securities of private companies, which ultimately may become public in the future. The fair values of these investments have been estimated using capital accounts representing the Company’s ownership interest in the funds as well as other performance inputs. The Company’s investment in each fund is not subject to redemption and is normally returned through distributions as a result of the liquidation of the underlying assets of the private equity funds. The liquidation period for the investments in the funds that are not subject to redemption is unknown at both December 31, 2018 and 2017. (c) This category includes several real assets funds that invest directly in real estate, real estate related assets and infrastructure. The fair values of the investments have been estimated using capital accounts representing the Company’s ownership interest in the funds. The Company’s investments that are not subject to redemption or are not currently redeemable are normally returned through distributions as a result of the liquidation of the underlying assets of the funds. The liquidation period for the investments in the funds that are not subject to redemption is unknown at both December 31, 2018 and December 31, 2017. The total remaining unfunded commitments to other third-party funds were $130 million and $117 million at December 31, 2018 and December 31, 2017, respectively. The Company had contractual obligations to the consolidated funds of $117 million at December 31, 2018 and $98 million at December 31, 2017. (d) This category includes the underlying third-party private equity funds within consolidated BlackRock sponsored private equity funds of funds. The fair values of the investments in the third-party funds have been estimated using capital accounts representing the Company’s ownership interest in each fund in the portfolio as well as other performance inputs. These investments are not subject to redemption; however, for certain funds, the Company may sell or transfer its interest, which may need approval by the general partner of the underlying funds. Due to the nature of the investments in this category, the Company reduces its investment by distributions that are received through the realization of the underlying assets of the funds. The liquidation period for the investments in the funds that are not subject to redemption is unknown at both December 31, 2018 and December 31, 2017. The total remaining unfunded commitments to other third-party funds were $18 million and $20 million at December 31, 2018 and 2017, respectively. The Company had contractual obligations to the consolidated funds of $22 million and $23 million at December 31, 2018 and 2017, respectively. Fair Value Option As of December 31, 2018, the Company elected the fair value option for certain investments in CLOs of approximately $32 million reported within investments. The following table summarizes information at December 31, 2018 related to assets and liabilities of a consolidated CLO, recorded within investments and borrowings of consolidated VIEs, respectively, for which the fair value option was elected: December 31, (in millions) 2018 CLO Bank loans: Aggregate principal amounts outstanding $ 84 Fair value 84 Aggregate unpaid principal balance in excess of (less than) fair value $ — CLO Borrowings: Aggregate principal amounts outstanding $ 84 Fair value $ 84 At December 31, 2018, the principal amounts outstanding of the borrowings issued by the CLOs mature in 2030. During the year ended December 31, 2018, the net gains (losses) from the change in fair value of the bank loans and borrowings held by the consolidated CLO were not material and were recorded in net gain (loss) on consolidated VIEs on the consolidated statements of income. The change in fair value of the assets and liabilities included interest income and expense, respectively. As of December 31, 2017, assets for which the fair value option was elected were not material to the consolidated financial statements. F-25
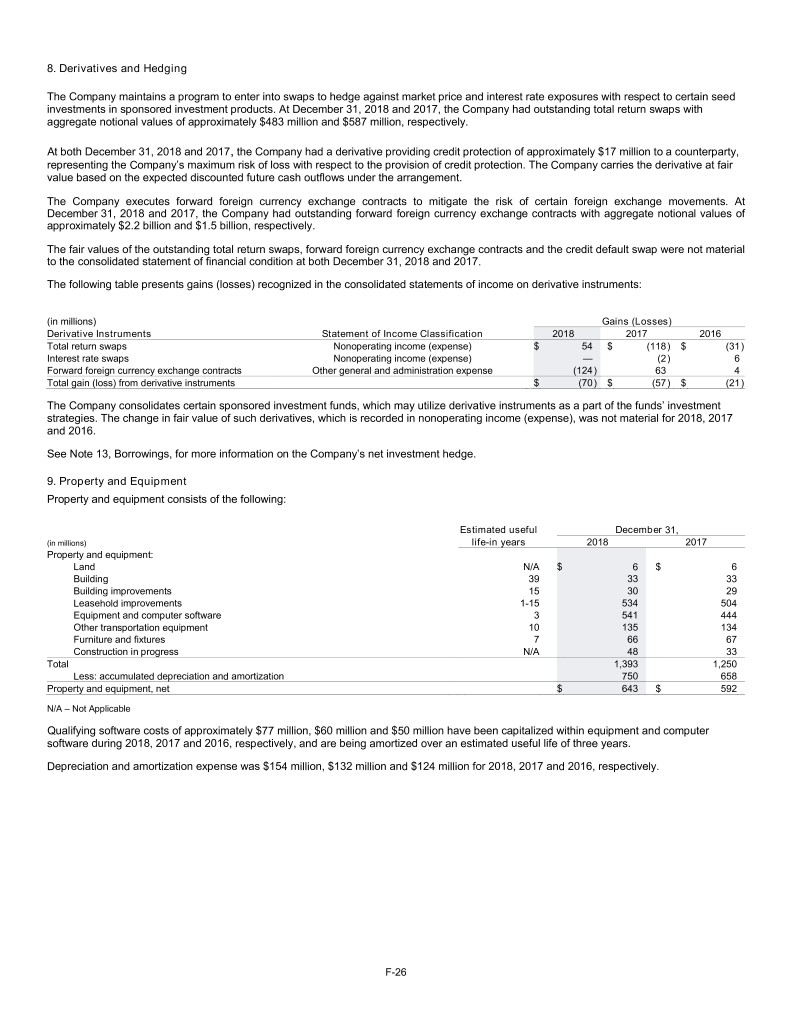
8. Derivatives and Hedging The Company maintains a program to enter into swaps to hedge against market price and interest rate exposures with respect to certain seed investments in sponsored investment products. At December 31, 2018 and 2017, the Company had outstanding total return swaps with aggregate notional values of approximately $483 million and $587 million, respectively. At both December 31, 2018 and 2017, the Company had a derivative providing credit protection of approximately $17 million to a counterparty, representing the Company’s maximum risk of loss with respect to the provision of credit protection. The Company carries the derivative at fair value based on the expected discounted future cash outflows under the arrangement. The Company executes forward foreign currency exchange contracts to mitigate the risk of certain foreign exchange movements. At December 31, 2018 and 2017, the Company had outstanding forward foreign currency exchange contracts with aggregate notional values of approximately $2.2 billion and $1.5 billion, respectively. The fair values of the outstanding total return swaps, forward foreign currency exchange contracts and the credit default swap were not material to the consolidated statement of financial condition at both December 31, 2018 and 2017. The following table presents gains (losses) recognized in the consolidated statements of income on derivative instruments: (in millions) Gains (Losses) Derivative Instruments Statement of Income Classification 2018 2017 2016 Total return swaps Nonoperating income (expense) $ 54 $ (118 ) $ (31 ) Interest rate swaps Nonoperating income (expense) — (2 ) 6 Forward foreign currency exchange contracts Other general and administration expense (124 ) 63 4 Total gain (loss) from derivative instruments $ (70 ) $ (57 ) $ (21 ) The Company consolidates certain sponsored investment funds, which may utilize derivative instruments as a part of the funds’ investment strategies. The change in fair value of such derivatives, which is recorded in nonoperating income (expense), was not material for 2018, 2017 and 2016. See Note 13, Borrowings, for more information on the Company’s net investment hedge. 9. Property and Equipment Property and equipment consists of the following: Estimated useful December 31, (in millions) life-in years 2018 2017 Property and equipment: Land N/A $ 6 $ 6 Building 39 33 33 Building improvements 15 30 29 Leasehold improvements 1-15 534 504 Equipment and computer software 3 541 444 Other transportation equipment 10 135 134 Furniture and fixtures 7 66 67 Construction in progress N/A 48 33 Total 1,393 1,250 Less: accumulated depreciation and amortization 750 658 Property and equipment, net $ 643 $ 592 N/A – Not Applicable Qualifying software costs of approximately $77 million, $60 million and $50 million have been capitalized within equipment and computer software during 2018, 2017 and 2016, respectively, and are being amortized over an estimated useful life of three years. Depreciation and amortization expense was $154 million, $132 million and $124 million for 2018, 2017 and 2016, respectively. F-26
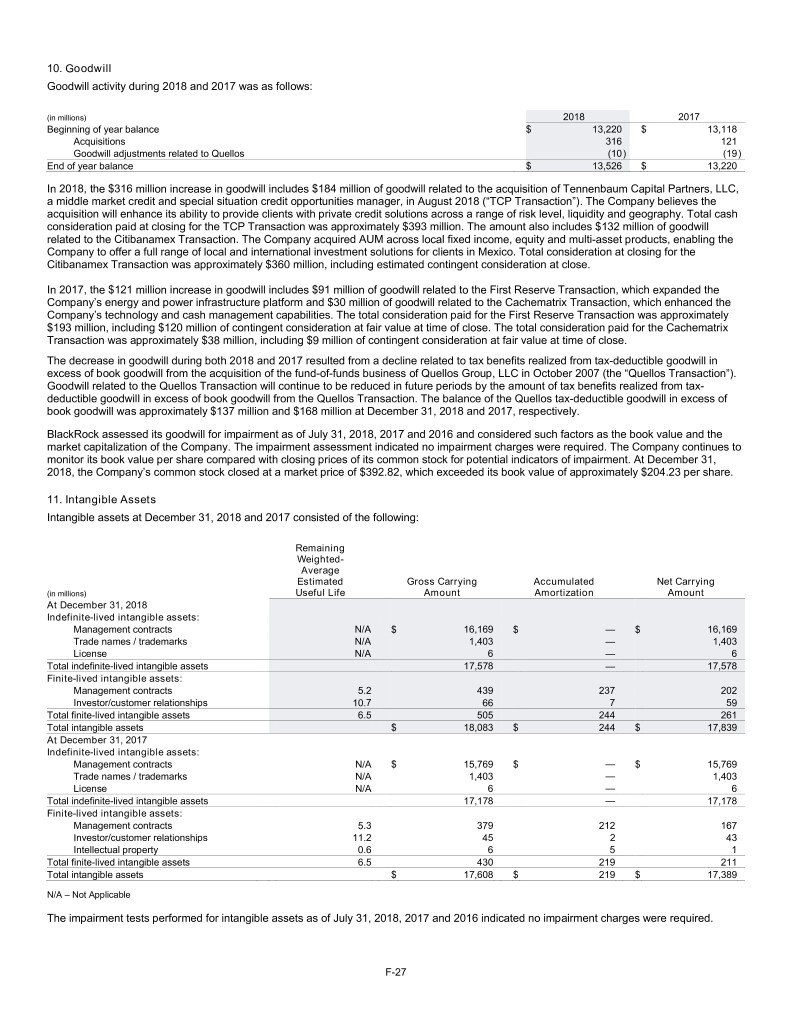
10. Goodwill Goodwill activity during 2018 and 2017 was as follows: (in millions) 2018 2017 Beginning of year balance $ 13,220 $ 13,118 Acquisitions 316 121 Goodwill adjustments related to Quellos (10 ) (19 ) End of year balance $ 13,526 $ 13,220 In 2018, the $316 million increase in goodwill includes $184 million of goodwill related to the acquisition of Tennenbaum Capital Partners, LLC, a middle market credit and special situation credit opportunities manager, in August 2018 (“TCP Transaction”). The Company believes the acquisition will enhance its ability to provide clients with private credit solutions across a range of risk level, liquidity and geography. Total cash consideration paid at closing for the TCP Transaction was approximately $393 million. The amount also includes $132 million of goodwill related to the Citibanamex Transaction. The Company acquired AUM across local fixed income, equity and multi-asset products, enabling the Company to offer a full range of local and international investment solutions for clients in Mexico. Total consideration at closing for the Citibanamex Transaction was approximately $360 million, including estimated contingent consideration at close. In 2017, the $121 million increase in goodwill includes $91 million of goodwill related to the First Reserve Transaction, which expanded the Company’s energy and power infrastructure platform and $30 million of goodwill related to the Cachematrix Transaction, which enhanced the Company’s technology and cash management capabilities. The total consideration paid for the First Reserve Transaction was approximately $193 million, including $120 million of contingent consideration at fair value at time of close. The total consideration paid for the Cachematrix Transaction was approximately $38 million, including $9 million of contingent consideration at fair value at time of close. The decrease in goodwill during both 2018 and 2017 resulted from a decline related to tax benefits realized from tax-deductible goodwill in excess of book goodwill from the acquisition of the fund-of-funds business of Quellos Group, LLC in October 2007 (the “Quellos Transaction”). Goodwill related to the Quellos Transaction will continue to be reduced in future periods by the amount of tax benefits realized from tax- deductible goodwill in excess of book goodwill from the Quellos Transaction. The balance of the Quellos tax-deductible goodwill in excess of book goodwill was approximately $137 million and $168 million at December 31, 2018 and 2017, respectively. BlackRock assessed its goodwill for impairment as of July 31, 2018, 2017 and 2016 and considered such factors as the book value and the market capitalization of the Company. The impairment assessment indicated no impairment charges were required. The Company continues to monitor its book value per share compared with closing prices of its common stock for potential indicators of impairment. At December 31, 2018, the Company’s common stock closed at a market price of $392.82, which exceeded its book value of approximately $204.23 per share. 11. Intangible Assets Intangible assets at December 31, 2018 and 2017 consisted of the following: Remaining Weighted- Average Estimated Gross Carrying Accumulated Net Carrying (in millions) Useful Life Amount Amortization Amount At December 31, 2018 Indefinite-lived intangible assets: Management contracts N/A $ 16,169 $ — $ 16,169 Trade names / trademarks N/A 1,403 — 1,403 License N/A 6 — 6 Total indefinite-lived intangible assets 17,578 — 17,578 Finite-lived intangible assets: Management contracts 5.2 439 237 202 Investor/customer relationships 10.7 66 7 59 Total finite-lived intangible assets 6.5 505 244 261 Total intangible assets $ 18,083 $ 244 $ 17,839 At December 31, 2017 Indefinite-lived intangible assets: Management contracts N/A $ 15,769 $ — $ 15,769 Trade names / trademarks N/A 1,403 — 1,403 License N/A 6 — 6 Total indefinite-lived intangible assets 17,178 — 17,178 Finite-lived intangible assets: Management contracts 5.3 379 212 167 Investor/customer relationships 11.2 45 2 43 Intellectual property 0.6 6 5 1 Total finite-lived intangible assets 6.5 430 219 211 Total intangible assets $ 17,608 $ 219 $ 17,389 N/A – Not Applicable The impairment tests performed for intangible assets as of July 31, 2018, 2017 and 2016 indicated no impairment charges were required. F-27
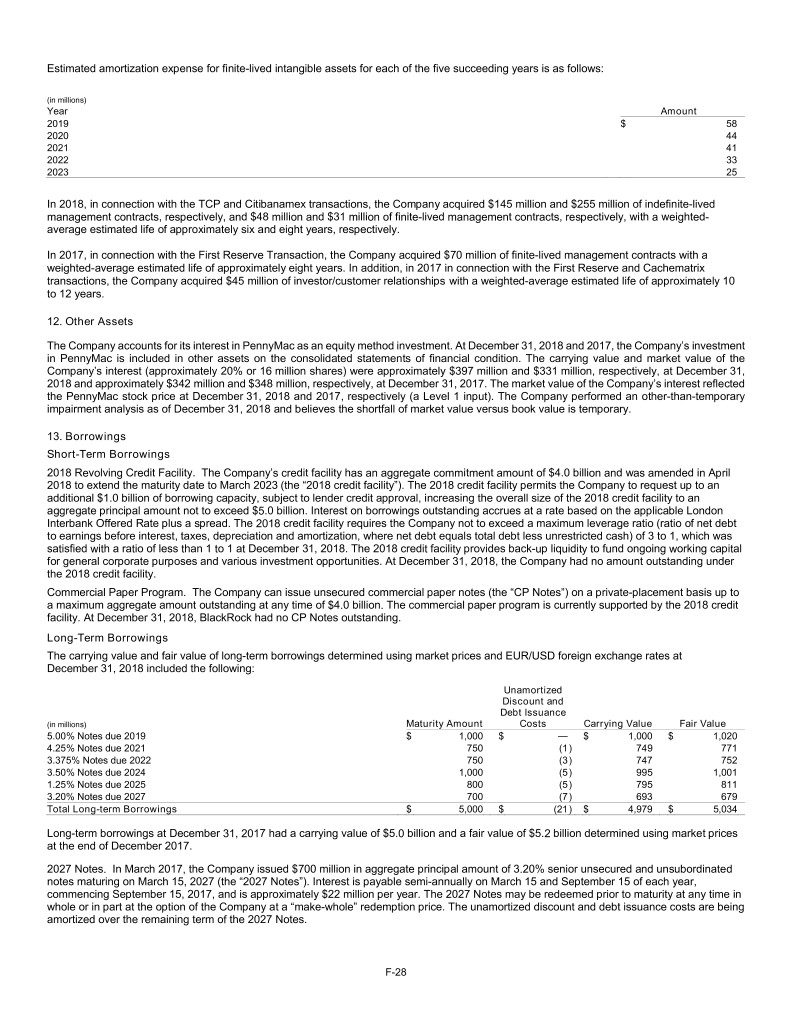
Estimated amortization expense for finite-lived intangible assets for each of the five succeeding years is as follows: (in millions) Year Amount 2019 $ 58 2020 44 2021 41 2022 33 2023 25 In 2018, in connection with the TCP and Citibanamex transactions, the Company acquired $145 million and $255 million of indefinite-lived management contracts, respectively, and $48 million and $31 million of finite-lived management contracts, respectively, with a weighted- average estimated life of approximately six and eight years, respectively. In 2017, in connection with the First Reserve Transaction, the Company acquired $70 million of finite-lived management contracts with a weighted-average estimated life of approximately eight years. In addition, in 2017 in connection with the First Reserve and Cachematrix transactions, the Company acquired $45 million of investor/customer relationships with a weighted-average estimated life of approximately 10 to 12 years. 12. Other Assets The Company accounts for its interest in PennyMac as an equity method investment. At December 31, 2018 and 2017, the Company’s investment in PennyMac is included in other assets on the consolidated statements of financial condition. The carrying value and market value of the Company’s interest (approximately 20% or 16 million shares) were approximately $397 million and $331 million, respectively, at December 31, 2018 and approximately $342 million and $348 million, respectively, at December 31, 2017. The market value of the Company’s interest reflected the PennyMac stock price at December 31, 2018 and 2017, respectively (a Level 1 input). The Company performed an other-than-temporary impairment analysis as of December 31, 2018 and believes the shortfall of market value versus book value is temporary. 13. Borrowings Short-Term Borrowings 2018 Revolving Credit Facility. The Company’s credit facility has an aggregate commitment amount of $4.0 billion and was amended in April 2018 to extend the maturity date to March 2023 (the “2018 credit facility”). The 2018 credit facility permits the Company to request up to an additional $1.0 billion of borrowing capacity, subject to lender credit approval, increasing the overall size of the 2018 credit facility to an aggregate principal amount not to exceed $5.0 billion. Interest on borrowings outstanding accrues at a rate based on the applicable London Interbank Offered Rate plus a spread. The 2018 credit facility requires the Company not to exceed a maximum leverage ratio (ratio of net debt to earnings before interest, taxes, depreciation and amortization, where net debt equals total debt less unrestricted cash) of 3 to 1, which was satisfied with a ratio of less than 1 to 1 at December 31, 2018. The 2018 credit facility provides back-up liquidity to fund ongoing working capital for general corporate purposes and various investment opportunities. At December 31, 2018, the Company had no amount outstanding under the 2018 credit facility. Commercial Paper Program. The Company can issue unsecured commercial paper notes (the “CP Notes”) on a private-placement basis up to a maximum aggregate amount outstanding at any time of $4.0 billion. The commercial paper program is currently supported by the 2018 credit facility. At December 31, 2018, BlackRock had no CP Notes outstanding. Long-Term Borrowings The carrying value and fair value of long-term borrowings determined using market prices and EUR/USD foreign exchange rates at December 31, 2018 included the following: Unamortized Discount and Debt Issuance (in millions) Maturity Amount Costs Carrying Value Fair Value 5.00% Notes due 2019 $ 1,000 $ — $ 1,000 $ 1,020 4.25% Notes due 2021 750 (1 ) 749 771 3.375% Notes due 2022 750 (3 ) 747 752 3.50% Notes due 2024 1,000 (5 ) 995 1,001 1.25% Notes due 2025 800 (5 ) 795 811 3.20% Notes due 2027 700 (7 ) 693 679 Total Long-term Borrowings $ 5,000 $ (21 ) $ 4,979 $ 5,034 Long-term borrowings at December 31, 2017 had a carrying value of $5.0 billion and a fair value of $5.2 billion determined using market prices at the end of December 2017. 2027 Notes. In March 2017, the Company issued $700 million in aggregate principal amount of 3.20% senior unsecured and unsubordinated notes maturing on March 15, 2027 (the “2027 Notes”). Interest is payable semi-annually on March 15 and September 15 of each year, commencing September 15, 2017, and is approximately $22 million per year. The 2027 Notes may be redeemed prior to maturity at any time in whole or in part at the option of the Company at a “make-whole” redemption price. The unamortized discount and debt issuance costs are being amortized over the remaining term of the 2027 Notes. F-28
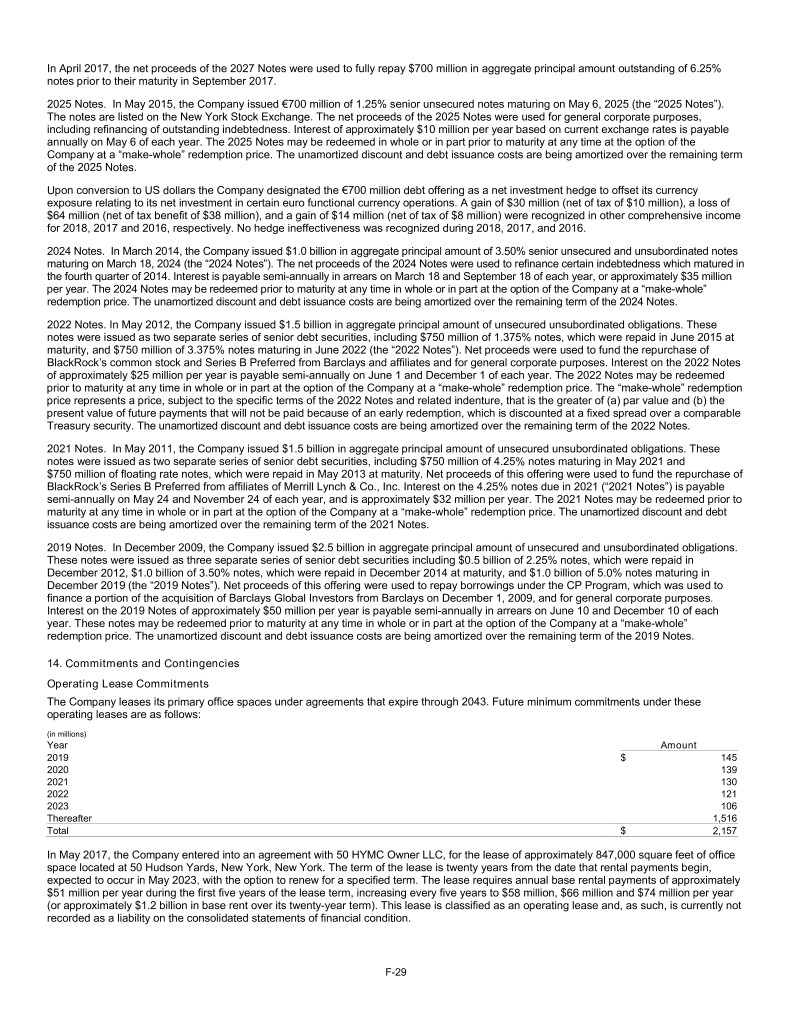
In April 2017, the net proceeds of the 2027 Notes were used to fully repay $700 million in aggregate principal amount outstanding of 6.25% notes prior to their maturity in September 2017. 2025 Notes. In May 2015, the Company issued €700 million of 1.25% senior unsecured notes maturing on May 6, 2025 (the “2025 Notes”). The notes are listed on the New York Stock Exchange. The net proceeds of the 2025 Notes were used for general corporate purposes, including refinancing of outstanding indebtedness. Interest of approximately $10 million per year based on current exchange rates is payable annually on May 6 of each year. The 2025 Notes may be redeemed in whole or in part prior to maturity at any time at the option of the Company at a “make-whole” redemption price. The unamortized discount and debt issuance costs are being amortized over the remaining term of the 2025 Notes. Upon conversion to US dollars the Company designated the €700 million debt offering as a net investment hedge to offset its currency exposure relating to its net investment in certain euro functional currency operations. A gain of $30 million (net of tax of $10 million), a loss of $64 million (net of tax benefit of $38 million), and a gain of $14 million (net of tax of $8 million) were recognized in other comprehensive income for 2018, 2017 and 2016, respectively. No hedge ineffectiveness was recognized during 2018, 2017, and 2016. 2024 Notes. In March 2014, the Company issued $1.0 billion in aggregate principal amount of 3.50% senior unsecured and unsubordinated notes maturing on March 18, 2024 (the “2024 Notes”). The net proceeds of the 2024 Notes were used to refinance certain indebtedness which matured in the fourth quarter of 2014. Interest is payable semi-annually in arrears on March 18 and September 18 of each year, or approximately $35 million per year. The 2024 Notes may be redeemed prior to maturity at any time in whole or in part at the option of the Company at a “make-whole” redemption price. The unamortized discount and debt issuance costs are being amortized over the remaining term of the 2024 Notes. 2022 Notes. In May 2012, the Company issued $1.5 billion in aggregate principal amount of unsecured unsubordinated obligations. These notes were issued as two separate series of senior debt securities, including $750 million of 1.375% notes, which were repaid in June 2015 at maturity, and $750 million of 3.375% notes maturing in June 2022 (the “2022 Notes”). Net proceeds were used to fund the repurchase of BlackRock’s common stock and Series B Preferred from Barclays and affiliates and for general corporate purposes. Interest on the 2022 Notes of approximately $25 million per year is payable semi-annually on June 1 and December 1 of each year. The 2022 Notes may be redeemed prior to maturity at any time in whole or in part at the option of the Company at a “make-whole” redemption price. The “make-whole” redemption price represents a price, subject to the specific terms of the 2022 Notes and related indenture, that is the greater of (a) par value and (b) the present value of future payments that will not be paid because of an early redemption, which is discounted at a fixed spread over a comparable Treasury security. The unamortized discount and debt issuance costs are being amortized over the remaining term of the 2022 Notes. 2021 Notes. In May 2011, the Company issued $1.5 billion in aggregate principal amount of unsecured unsubordinated obligations. These notes were issued as two separate series of senior debt securities, including $750 million of 4.25% notes maturing in May 2021 and $750 million of floating rate notes, which were repaid in May 2013 at maturity. Net proceeds of this offering were used to fund the repurchase of BlackRock’s Series B Preferred from affiliates of Merrill Lynch & Co., Inc. Interest on the 4.25% notes due in 2021 (“2021 Notes”) is payable semi-annually on May 24 and November 24 of each year, and is approximately $32 million per year. The 2021 Notes may be redeemed prior to maturity at any time in whole or in part at the option of the Company at a “make-whole” redemption price. The unamortized discount and debt issuance costs are being amortized over the remaining term of the 2021 Notes. 2019 Notes. In December 2009, the Company issued $2.5 billion in aggregate principal amount of unsecured and unsubordinated obligations. These notes were issued as three separate series of senior debt securities including $0.5 billion of 2.25% notes, which were repaid in December 2012, $1.0 billion of 3.50% notes, which were repaid in December 2014 at maturity, and $1.0 billion of 5.0% notes maturing in December 2019 (the “2019 Notes”). Net proceeds of this offering were used to repay borrowings under the CP Program, which was used to finance a portion of the acquisition of Barclays Global Investors from Barclays on December 1, 2009, and for general corporate purposes. Interest on the 2019 Notes of approximately $50 million per year is payable semi-annually in arrears on June 10 and December 10 of each year. These notes may be redeemed prior to maturity at any time in whole or in part at the option of the Company at a “make-whole” redemption price. The unamortized discount and debt issuance costs are being amortized over the remaining term of the 2019 Notes. 14. Commitments and Contingencies Operating Lease Commitments The Company leases its primary office spaces under agreements that expire through 2043. Future minimum commitments under these operating leases are as follows: (in millions) Year Amount 2019 $ 145 2020 139 2021 130 2022 121 2023 106 Thereafter 1,516 Total $ 2,157 In May 2017, the Company entered into an agreement with 50 HYMC Owner LLC, for the lease of approximately 847,000 square feet of office space located at 50 Hudson Yards, New York, New York. The term of the lease is twenty years from the date that rental payments begin, expected to occur in May 2023, with the option to renew for a specified term. The lease requires annual base rental payments of approximately $51 million per year during the first five years of the lease term, increasing every five years to $58 million, $66 million and $74 million per year (or approximately $1.2 billion in base rent over its twenty-year term). This lease is classified as an operating lease and, as such, is currently not recorded as a liability on the consolidated statements of financial condition. F-29
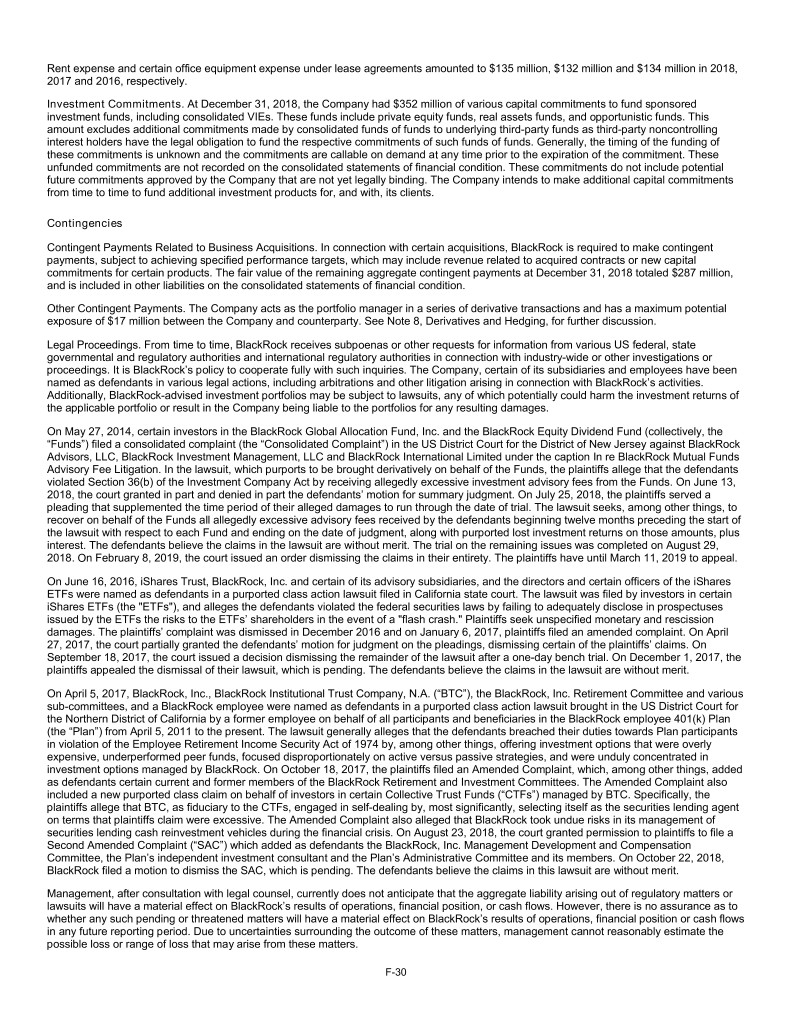
Rent expense and certain office equipment expense under lease agreements amounted to $135 million, $132 million and $134 million in 2018, 2017 and 2016, respectively. Investment Commitments. At December 31, 2018, the Company had $352 million of various capital commitments to fund sponsored investment funds, including consolidated VIEs. These funds include private equity funds, real assets funds, and opportunistic funds. This amount excludes additional commitments made by consolidated funds of funds to underlying third-party funds as third-party noncontrolling interest holders have the legal obligation to fund the respective commitments of such funds of funds. Generally, the timing of the funding of these commitments is unknown and the commitments are callable on demand at any time prior to the expiration of the commitment. These unfunded commitments are not recorded on the consolidated statements of financial condition. These commitments do not include potential future commitments approved by the Company that are not yet legally binding. The Company intends to make additional capital commitments from time to time to fund additional investment products for, and with, its clients. Contingencies Contingent Payments Related to Business Acquisitions. In connection with certain acquisitions, BlackRock is required to make contingent payments, subject to achieving specified performance targets, which may include revenue related to acquired contracts or new capital commitments for certain products. The fair value of the remaining aggregate contingent payments at December 31, 2018 totaled $287 million, and is included in other liabilities on the consolidated statements of financial condition. Other Contingent Payments. The Company acts as the portfolio manager in a series of derivative transactions and has a maximum potential exposure of $17 million between the Company and counterparty. See Note 8, Derivatives and Hedging, for further discussion. Legal Proceedings. From time to time, BlackRock receives subpoenas or other requests for information from various US federal, state governmental and regulatory authorities and international regulatory authorities in connection with industry-wide or other investigations or proceedings. It is BlackRock’s policy to cooperate fully with such inquiries. The Company, certain of its subsidiaries and employees have been named as defendants in various legal actions, including arbitrations and other litigation arising in connection with BlackRock’s activities. Additionally, BlackRock-advised investment portfolios may be subject to lawsuits, any of which potentially could harm the investment returns of the applicable portfolio or result in the Company being liable to the portfolios for any resulting damages. On May 27, 2014, certain investors in the BlackRock Global Allocation Fund, Inc. and the BlackRock Equity Dividend Fund (collectively, the “Funds”) filed a consolidated complaint (the “Consolidated Complaint”) in the US District Court for the District of New Jersey against BlackRock Advisors, LLC, BlackRock Investment Management, LLC and BlackRock International Limited under the caption In re BlackRock Mutual Funds Advisory Fee Litigation. In the lawsuit, which purports to be brought derivatively on behalf of the Funds, the plaintiffs allege that the defendants violated Section 36(b) of the Investment Company Act by receiving allegedly excessive investment advisory fees from the Funds. On June 13, 2018, the court granted in part and denied in part the defendants’ motion for summary judgment. On July 25, 2018, the plaintiffs served a pleading that supplemented the time period of their alleged damages to run through the date of trial. The lawsuit seeks, among other things, to recover on behalf of the Funds all allegedly excessive advisory fees received by the defendants beginning twelve months preceding the start of the lawsuit with respect to each Fund and ending on the date of judgment, along with purported lost investment returns on those amounts, plus interest. The defendants believe the claims in the lawsuit are without merit. The trial on the remaining issues was completed on August 29, 2018. On February 8, 2019, the court issued an order dismissing the claims in their entirety. The plaintiffs have until March 11, 2019 to appeal. On June 16, 2016, iShares Trust, BlackRock, Inc. and certain of its advisory subsidiaries, and the directors and certain officers of the iShares ETFs were named as defendants in a purported class action lawsuit filed in California state court. The lawsuit was filed by investors in certain iShares ETFs (the "ETFs"), and alleges the defendants violated the federal securities laws by failing to adequately disclose in prospectuses issued by the ETFs the risks to the ETFs’ shareholders in the event of a "flash crash." Plaintiffs seek unspecified monetary and rescission damages. The plaintiffs’ complaint was dismissed in December 2016 and on January 6, 2017, plaintiffs filed an amended complaint. On April 27, 2017, the court partially granted the defendants’ motion for judgment on the pleadings, dismissing certain of the plaintiffs’ claims. On September 18, 2017, the court issued a decision dismissing the remainder of the lawsuit after a one-day bench trial. On December 1, 2017, the plaintiffs appealed the dismissal of their lawsuit, which is pending. The defendants believe the claims in the lawsuit are without merit. On April 5, 2017, BlackRock, Inc., BlackRock Institutional Trust Company, N.A. (“BTC”), the BlackRock, Inc. Retirement Committee and various sub-committees, and a BlackRock employee were named as defendants in a purported class action lawsuit brought in the US District Court for the Northern District of California by a former employee on behalf of all participants and beneficiaries in the BlackRock employee 401(k) Plan (the “Plan”) from April 5, 2011 to the present. The lawsuit generally alleges that the defendants breached their duties towards Plan participants in violation of the Employee Retirement Income Security Act of 1974 by, among other things, offering investment options that were overly expensive, underperformed peer funds, focused disproportionately on active versus passive strategies, and were unduly concentrated in investment options managed by BlackRock. On October 18, 2017, the plaintiffs filed an Amended Complaint, which, among other things, added as defendants certain current and former members of the BlackRock Retirement and Investment Committees. The Amended Complaint also included a new purported class claim on behalf of investors in certain Collective Trust Funds (“CTFs”) managed by BTC. Specifically, the plaintiffs allege that BTC, as fiduciary to the CTFs, engaged in self-dealing by, most significantly, selecting itself as the securities lending agent on terms that plaintiffs claim were excessive. The Amended Complaint also alleged that BlackRock took undue risks in its management of securities lending cash reinvestment vehicles during the financial crisis. On August 23, 2018, the court granted permission to plaintiffs to file a Second Amended Complaint (“SAC”) which added as defendants the BlackRock, Inc. Management Development and Compensation Committee, the Plan’s independent investment consultant and the Plan’s Administrative Committee and its members. On October 22, 2018, BlackRock filed a motion to dismiss the SAC, which is pending. The defendants believe the claims in this lawsuit are without merit. Management, after consultation with legal counsel, currently does not anticipate that the aggregate liability arising out of regulatory matters or lawsuits will have a material effect on BlackRock’s results of operations, financial position, or cash flows. However, there is no assurance as to whether any such pending or threatened matters will have a material effect on BlackRock’s results of operations, financial position or cash flows in any future reporting period. Due to uncertainties surrounding the outcome of these matters, management cannot reasonably estimate the possible loss or range of loss that may arise from these matters. F-30
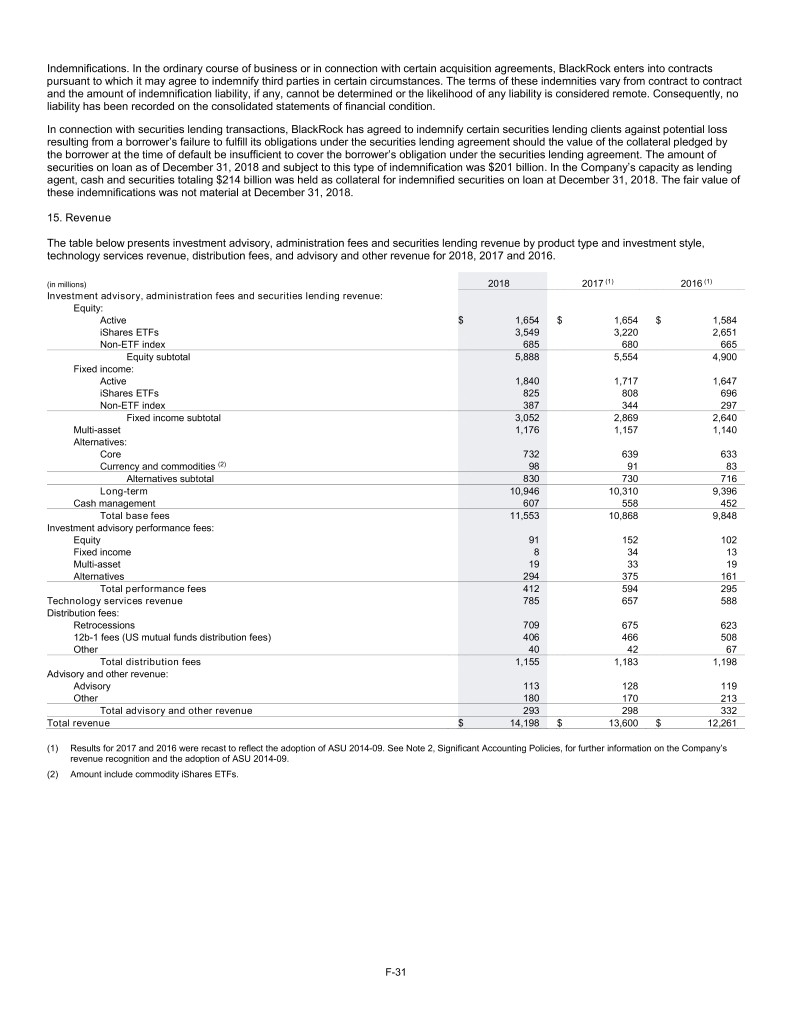
Indemnifications. In the ordinary course of business or in connection with certain acquisition agreements, BlackRock enters into contracts pursuant to which it may agree to indemnify third parties in certain circumstances. The terms of these indemnities vary from contract to contract and the amount of indemnification liability, if any, cannot be determined or the likelihood of any liability is considered remote. Consequently, no liability has been recorded on the consolidated statements of financial condition. In connection with securities lending transactions, BlackRock has agreed to indemnify certain securities lending clients against potential loss resulting from a borrower’s failure to fulfill its obligations under the securities lending agreement should the value of the collateral pledged by the borrower at the time of default be insufficient to cover the borrower’s obligation under the securities lending agreement. The amount of securities on loan as of December 31, 2018 and subject to this type of indemnification was $201 billion. In the Company’s capacity as lending agent, cash and securities totaling $214 billion was held as collateral for indemnified securities on loan at December 31, 2018. The fair value of these indemnifications was not material at December 31, 2018. 15. Revenue The table below presents investment advisory, administration fees and securities lending revenue by product type and investment style, technology services revenue, distribution fees, and advisory and other revenue for 2018, 2017 and 2016. (in millions) 2018 2017 (1) 2016 (1) Investment advisory, administration fees and securities lending revenue: Equity: Active $ 1,654 $ 1,654 $ 1,584 iShares ETFs 3,549 3,220 2,651 Non-ETF index 685 680 665 Equity subtotal 5,888 5,554 4,900 Fixed income: Active 1,840 1,717 1,647 iShares ETFs 825 808 696 Non-ETF index 387 344 297 Fixed income subtotal 3,052 2,869 2,640 Multi-asset 1,176 1,157 1,140 Alternatives: Core 732 639 633 Currency and commodities (2) 98 91 83 Alternatives subtotal 830 730 716 Long-term 10,946 10,310 9,396 Cash management 607 558 452 Total base fees 11,553 10,868 9,848 Investment advisory performance fees: Equity 91 152 102 Fixed income 8 34 13 Multi-asset 19 33 19 Alternatives 294 375 161 Total performance fees 412 594 295 Technology services revenue 785 657 588 Distribution fees: Retrocessions 709 675 623 12b-1 fees (US mutual funds distribution fees) 406 466 508 Other 40 42 67 Total distribution fees 1,155 1,183 1,198 Advisory and other revenue: Advisory 113 128 119 Other 180 170 213 Total advisory and other revenue 293 298 332 Total revenue $ 14,198 $ 13,600 $ 12,261 (1) Results for 2017 and 2016 were recast to reflect the adoption of ASU 2014-09. See Note 2, Significant Accounting Policies, for further information on the Company’s revenue recognition and the adoption of ASU 2014-09. (2) Amount include commodity iShares ETFs. F-31
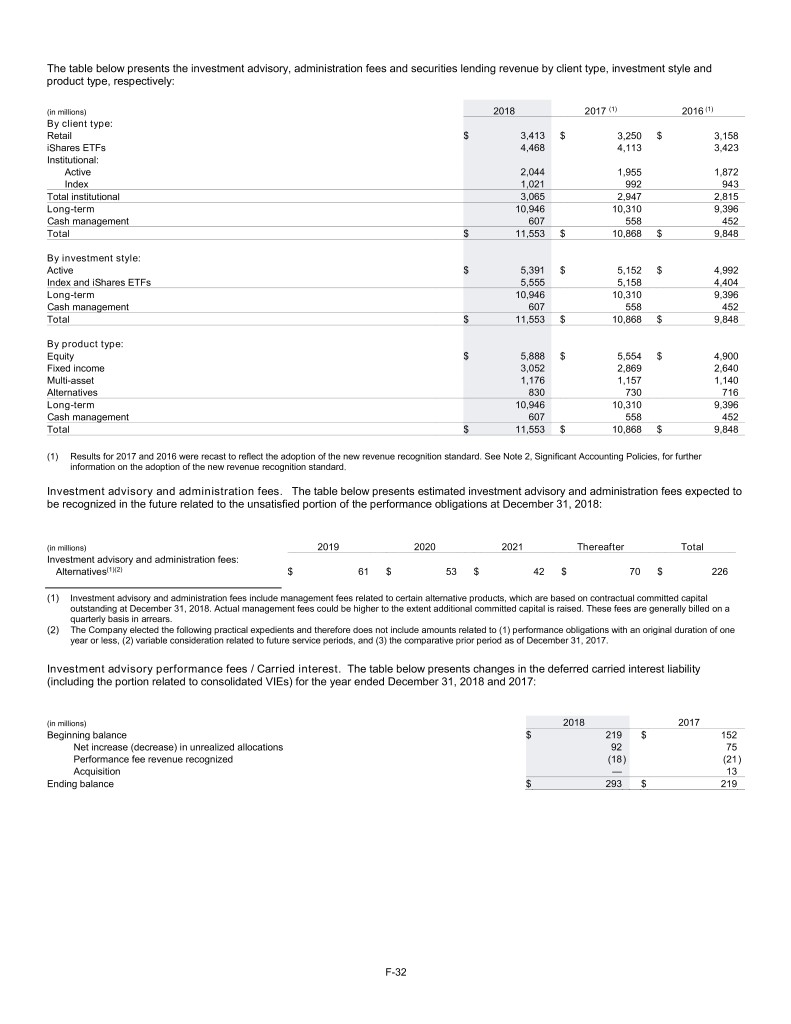
The table below presents the investment advisory, administration fees and securities lending revenue by client type, investment style and product type, respectively: (in millions) 2018 2017 (1) 2016 (1) By client type: Retail $ 3,413 $ 3,250 $ 3,158 iShares ETFs 4,468 4,113 3,423 Institutional: Active 2,044 1,955 1,872 Index 1,021 992 943 Total institutional 3,065 2,947 2,815 Long-term 10,946 10,310 9,396 Cash management 607 558 452 Total $ 11,553 $ 10,868 $ 9,848 By investment style: Active $ 5,391 $ 5,152 $ 4,992 Index and iShares ETFs 5,555 5,158 4,404 Long-term 10,946 10,310 9,396 Cash management 607 558 452 Total $ 11,553 $ 10,868 $ 9,848 By product type: Equity $ 5,888 $ 5,554 $ 4,900 Fixed income 3,052 2,869 2,640 Multi-asset 1,176 1,157 1,140 Alternatives 830 730 716 Long-term 10,946 10,310 9,396 Cash management 607 558 452 Total $ 11,553 $ 10,868 $ 9,848 (1) Results for 2017 and 2016 were recast to reflect the adoption of the new revenue recognition standard. See Note 2, Significant Accounting Policies, for further information on the adoption of the new revenue recognition standard. Investment advisory and administration fees. The table below presents estimated investment advisory and administration fees expected to be recognized in the future related to the unsatisfied portion of the performance obligations at December 31, 2018: (in millions) 2019 2020 2021 Thereafter Total Investment advisory and administration fees: Alternatives(1)(2) $ 61 $ 53 $ 42 $ 70 $ 226 (1) Investment advisory and administration fees include management fees related to certain alternative products, which are based on contractual committed capital outstanding at December 31, 2018. Actual management fees could be higher to the extent additional committed capital is raised. These fees are generally billed on a quarterly basis in arrears. (2) The Company elected the following practical expedients and therefore does not include amounts related to (1) performance obligations with an original duration of one year or less, (2) variable consideration related to future service periods, and (3) the comparative prior period as of December 31, 2017. Investment advisory performance fees / Carried interest. The table below presents changes in the deferred carried interest liability (including the portion related to consolidated VIEs) for the year ended December 31, 2018 and 2017: (in millions) 2018 2017 Beginning balance $ 219 $ 152 Net increase (decrease) in unrealized allocations 92 75 Performance fee revenue recognized (18 ) (21 ) Acquisition — 13 Ending balance $ 293 $ 219 F-32
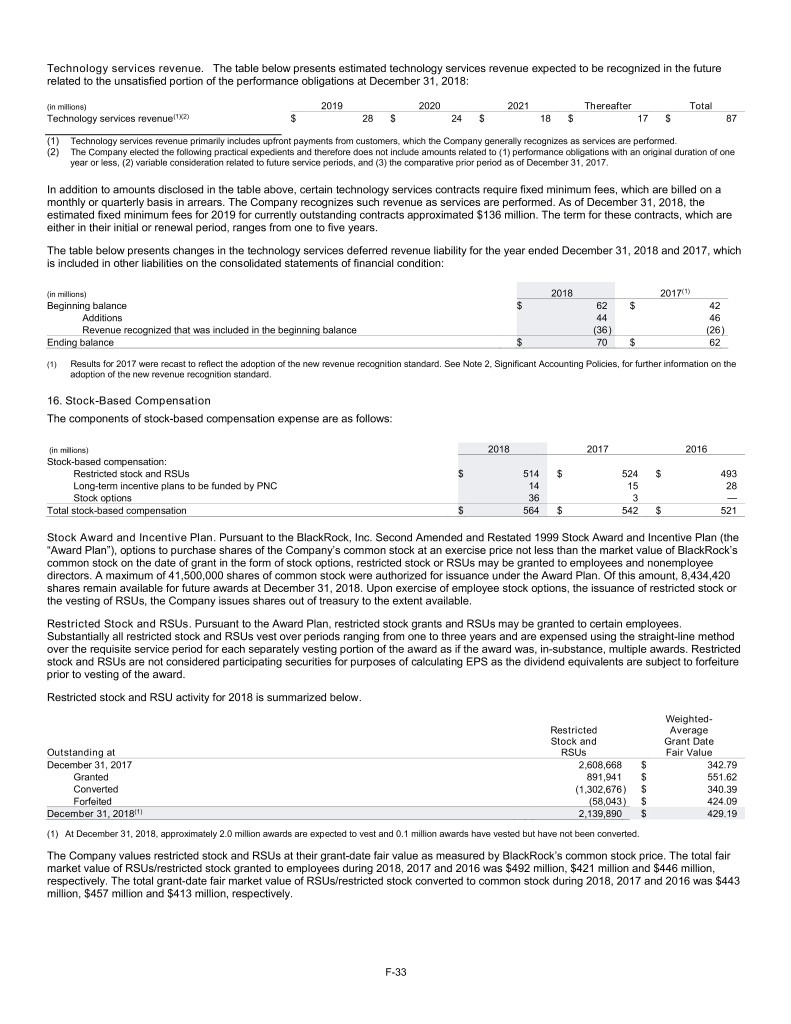
Technology services revenue. The table below presents estimated technology services revenue expected to be recognized in the future related to the unsatisfied portion of the performance obligations at December 31, 2018: (in millions) 2019 2020 2021 Thereafter Total (1)(2) Technology services revenue $ 28 $ 24 $ 18 $ 17 $ 87 (1) Technology services revenue primarily includes upfront payments from customers, which the Company generally recognizes as services are performed. (2) The Company elected the following practical expedients and therefore does not include amounts related to (1) performance obligations with an original duration of one year or less, (2) variable consideration related to future service periods, and (3) the comparative prior period as of December 31, 2017. In addition to amounts disclosed in the table above, certain technology services contracts require fixed minimum fees, which are billed on a monthly or quarterly basis in arrears. The Company recognizes such revenue as services are performed. As of December 31, 2018, the estimated fixed minimum fees for 2019 for currently outstanding contracts approximated $136 million. The term for these contracts, which are either in their initial or renewal period, ranges from one to five years. The table below presents changes in the technology services deferred revenue liability for the year ended December 31, 2018 and 2017, which is included in other liabilities on the consolidated statements of financial condition: (in millions) 2018 2017(1) Beginning balance $ 62 $ 42 Additions 44 46 Revenue recognized that was included in the beginning balance (36 ) (26 ) Ending balance $ 70 $ 62 (1) Results for 2017 were recast to reflect the adoption of the new revenue recognition standard. See Note 2, Significant Accounting Policies, for further information on the adoption of the new revenue recognition standard. 16. Stock-Based Compensation The components of stock-based compensation expense are as follows: (in millions) 2018 2017 2016 Stock-based compensation: Restricted stock and RSUs $ 514 $ 524 $ 493 Long-term incentive plans to be funded by PNC 14 15 28 Stock options 36 3 — Total stock-based compensation $ 564 $ 542 $ 521 Stock Award and Incentive Plan. Pursuant to the BlackRock, Inc. Second Amended and Restated 1999 Stock Award and Incentive Plan (the “Award Plan”), options to purchase shares of the Company’s common stock at an exercise price not less than the market value of BlackRock’s common stock on the date of grant in the form of stock options, restricted stock or RSUs may be granted to employees and nonemployee directors. A maximum of 41,500,000 shares of common stock were authorized for issuance under the Award Plan. Of this amount, 8,434,420 shares remain available for future awards at December 31, 2018. Upon exercise of employee stock options, the issuance of restricted stock or the vesting of RSUs, the Company issues shares out of treasury to the extent available. Restricted Stock and RSUs. Pursuant to the Award Plan, restricted stock grants and RSUs may be granted to certain employees. Substantially all restricted stock and RSUs vest over periods ranging from one to three years and are expensed using the straight-line method over the requisite service period for each separately vesting portion of the award as if the award was, in-substance, multiple awards. Restricted stock and RSUs are not considered participating securities for purposes of calculating EPS as the dividend equivalents are subject to forfeiture prior to vesting of the award. Restricted stock and RSU activity for 2018 is summarized below. Weighted- Restricted Average Stock and Grant Date Outstanding at RSUs Fair Value December 31, 2017 2,608,668 $ 342.79 Granted 891,941 $ 551.62 Converted (1,302,676 ) $ 340.39 Forfeited (58,043 ) $ 424.09 (1) December 31, 2018 2,139,890 $ 429.19 (1) At December 31, 2018, approximately 2.0 million awards are expected to vest and 0.1 million awards have vested but have not been converted. The Company values restricted stock and RSUs at their grant-date fair value as measured by BlackRock’s common stock price. The total fair market value of RSUs/restricted stock granted to employees during 2018, 2017 and 2016 was $492 million, $421 million and $446 million, respectively. The total grant-date fair market value of RSUs/restricted stock converted to common stock during 2018, 2017 and 2016 was $443 million, $457 million and $413 million, respectively. F-33
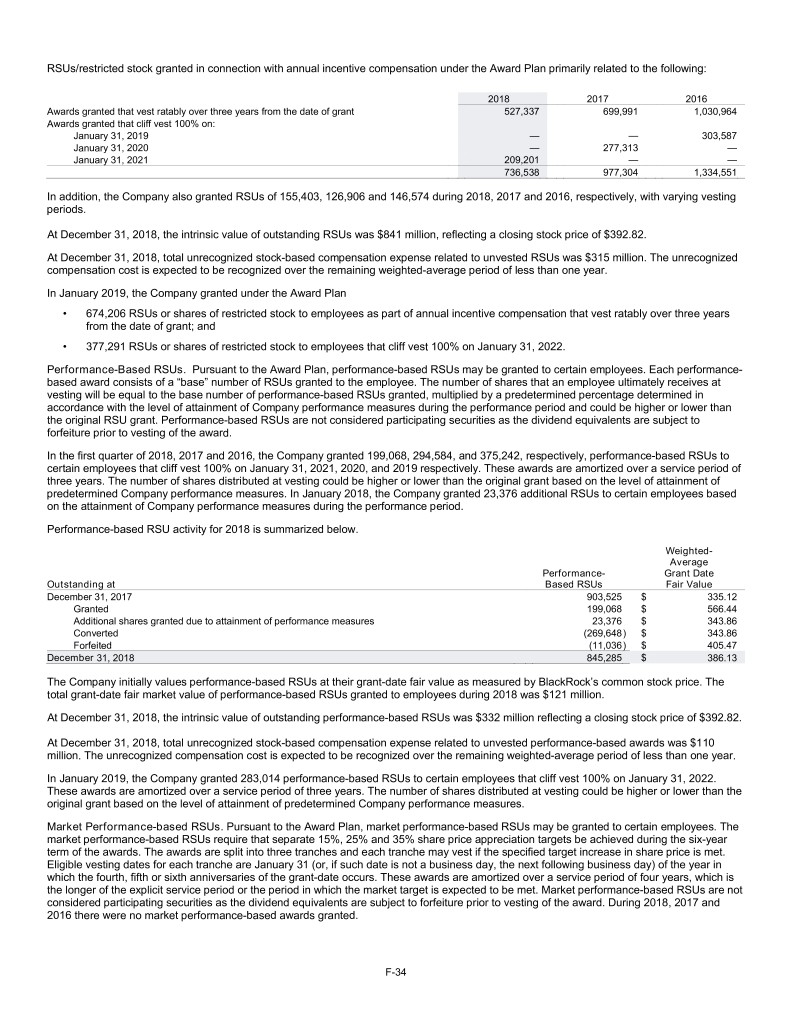
RSUs/restricted stock granted in connection with annual incentive compensation under the Award Plan primarily related to the following: 2018 2017 2016 Awards granted that vest ratably over three years from the date of grant 527,337 699,991 1,030,964 Awards granted that cliff vest 100% on: January 31, 2019 — — 303,587 January 31, 2020 — 277,313 — January 31, 2021 209,201 — — 736,538 977,304 1,334,551 In addition, the Company also granted RSUs of 155,403, 126,906 and 146,574 during 2018, 2017 and 2016, respectively, with varying vesting periods. At December 31, 2018, the intrinsic value of outstanding RSUs was $841 million, reflecting a closing stock price of $392.82. At December 31, 2018, total unrecognized stock-based compensation expense related to unvested RSUs was $315 million. The unrecognized compensation cost is expected to be recognized over the remaining weighted-average period of less than one year. In January 2019, the Company granted under the Award Plan • 674,206 RSUs or shares of restricted stock to employees as part of annual incentive compensation that vest ratably over three years from the date of grant; and • 377,291 RSUs or shares of restricted stock to employees that cliff vest 100% on January 31, 2022. Performance-Based RSUs. Pursuant to the Award Plan, performance-based RSUs may be granted to certain employees. Each performance- based award consists of a “base” number of RSUs granted to the employee. The number of shares that an employee ultimately receives at vesting will be equal to the base number of performance-based RSUs granted, multiplied by a predetermined percentage determined in accordance with the level of attainment of Company performance measures during the performance period and could be higher or lower than the original RSU grant. Performance-based RSUs are not considered participating securities as the dividend equivalents are subject to forfeiture prior to vesting of the award. In the first quarter of 2018, 2017 and 2016, the Company granted 199,068, 294,584, and 375,242, respectively, performance-based RSUs to certain employees that cliff vest 100% on January 31, 2021, 2020, and 2019 respectively. These awards are amortized over a service period of three years. The number of shares distributed at vesting could be higher or lower than the original grant based on the level of attainment of predetermined Company performance measures. In January 2018, the Company granted 23,376 additional RSUs to certain employees based on the attainment of Company performance measures during the performance period. Performance-based RSU activity for 2018 is summarized below. Weighted- Average Performance- Grant Date Outstanding at Based RSUs Fair Value December 31, 2017 903,525 $ 335.12 Granted 199,068 $ 566.44 Additional shares granted due to attainment of performance measures 23,376 $ 343.86 Converted (269,648 ) $ 343.86 Forfeited (11,036 ) $ 405.47 December 31, 2018 845,285 $ 386.13 The Company initially values performance-based RSUs at their grant-date fair value as measured by BlackRock’s common stock price. The total grant-date fair market value of performance-based RSUs granted to employees during 2018 was $121 million. At December 31, 2018, the intrinsic value of outstanding performance-based RSUs was $332 million reflecting a closing stock price of $392.82. At December 31, 2018, total unrecognized stock-based compensation expense related to unvested performance-based awards was $110 million. The unrecognized compensation cost is expected to be recognized over the remaining weighted-average period of less than one year. In January 2019, the Company granted 283,014 performance-based RSUs to certain employees that cliff vest 100% on January 31, 2022. These awards are amortized over a service period of three years. The number of shares distributed at vesting could be higher or lower than the original grant based on the level of attainment of predetermined Company performance measures. Market Performance-based RSUs. Pursuant to the Award Plan, market performance-based RSUs may be granted to certain employees. The market performance-based RSUs require that separate 15%, 25% and 35% share price appreciation targets be achieved during the six-year term of the awards. The awards are split into three tranches and each tranche may vest if the specified target increase in share price is met. Eligible vesting dates for each tranche are January 31 (or, if such date is not a business day, the next following business day) of the year in which the fourth, fifth or sixth anniversaries of the grant-date occurs. These awards are amortized over a service period of four years, which is the longer of the explicit service period or the period in which the market target is expected to be met. Market performance-based RSUs are not considered participating securities as the dividend equivalents are subject to forfeiture prior to vesting of the award. During 2018, 2017 and 2016 there were no market performance-based awards granted. F-34
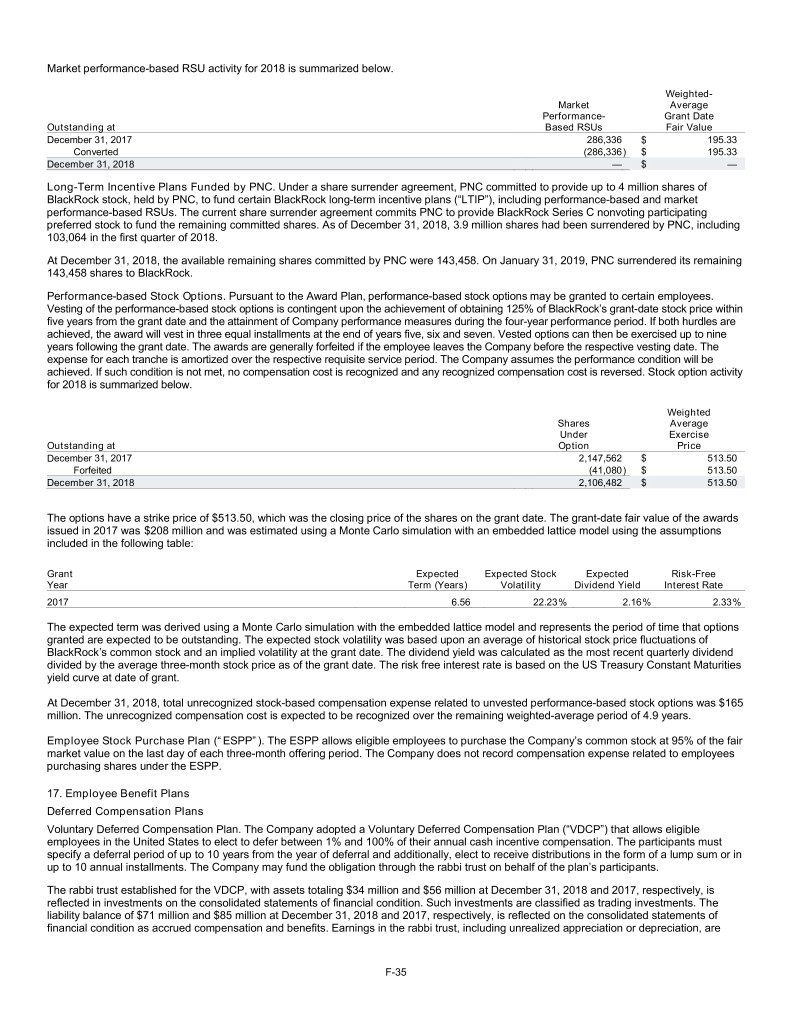
Market performance-based RSU activity for 2018 is summarized below. Weighted- Market Average Performance- Grant Date Outstanding at Based RSUs Fair Value December 31, 2017 286,336 $ 195.33 Converted (286,336 ) $ 195.33 December 31, 2018 — $ — Long-Term Incentive Plans Funded by PNC. Under a share surrender agreement, PNC committed to provide up to 4 million shares of BlackRock stock, held by PNC, to fund certain BlackRock long-term incentive plans (“LTIP”), including performance-based and market performance-based RSUs. The current share surrender agreement commits PNC to provide BlackRock Series C nonvoting participating preferred stock to fund the remaining committed shares. As of December 31, 2018, 3.9 million shares had been surrendered by PNC, including 103,064 in the first quarter of 2018. At December 31, 2018, the available remaining shares committed by PNC were 143,458. On January 31, 2019, PNC surrendered its remaining 143,458 shares to BlackRock. Performance-based Stock Options. Pursuant to the Award Plan, performance-based stock options may be granted to certain employees. Vesting of the performance-based stock options is contingent upon the achievement of obtaining 125% of BlackRock’s grant-date stock price within five years from the grant date and the attainment of Company performance measures during the four-year performance period. If both hurdles are achieved, the award will vest in three equal installments at the end of years five, six and seven. Vested options can then be exercised up to nine years following the grant date. The awards are generally forfeited if the employee leaves the Company before the respective vesting date. The expense for each tranche is amortized over the respective requisite service period. The Company assumes the performance condition will be achieved. If such condition is not met, no compensation cost is recognized and any recognized compensation cost is reversed. Stock option activity for 2018 is summarized below. Weighted Shares Average Under Exercise Outstanding at Option Price December 31, 2017 2,147,562 $ 513.50 Forfeited (41,080 ) $ 513.50 December 31, 2018 2,106,482 $ 513.50 The options have a strike price of $513.50, which was the closing price of the shares on the grant date. The grant-date fair value of the awards issued in 2017 was $208 million and was estimated using a Monte Carlo simulation with an embedded lattice model using the assumptions included in the following table: Grant Expected Expected Stock Expected Risk-Free Year Term (Years) Volatility Dividend Yield Interest Rate 2017 6.56 22.23 % 2.16 % 2.33 % The expected term was derived using a Monte Carlo simulation with the embedded lattice model and represents the period of time that options granted are expected to be outstanding. The expected stock volatility was based upon an average of historical stock price fluctuations of BlackRock’s common stock and an implied volatility at the grant date. The dividend yield was calculated as the most recent quarterly dividend divided by the average three-month stock price as of the grant date. The risk free interest rate is based on the US Treasury Constant Maturities yield curve at date of grant. At December 31, 2018, total unrecognized stock-based compensation expense related to unvested performance-based stock options was $165 million. The unrecognized compensation cost is expected to be recognized over the remaining weighted-average period of 4.9 years. Employee Stock Purchase Plan (“ESPP”). The ESPP allows eligible employees to purchase the Company’s common stock at 95% of the fair market value on the last day of each three-month offering period. The Company does not record compensation expense related to employees purchasing shares under the ESPP. 17. Employee Benefit Plans Deferred Compensation Plans Voluntary Deferred Compensation Plan. The Company adopted a Voluntary Deferred Compensation Plan (“VDCP”) that allows eligible employees in the United States to elect to defer between 1% and 100% of their annual cash incentive compensation. The participants must specify a deferral period of up to 10 years from the year of deferral and additionally, elect to receive distributions in the form of a lump sum or in up to 10 annual installments. The Company may fund the obligation through the rabbi trust on behalf of the plan’s participants. The rabbi trust established for the VDCP, with assets totaling $34 million and $56 million at December 31, 2018 and 2017, respectively, is reflected in investments on the consolidated statements of financial condition. Such investments are classified as trading investments. The liability balance of $71 million and $85 million at December 31, 2018 and 2017, respectively, is reflected on the consolidated statements of financial condition as accrued compensation and benefits. Earnings in the rabbi trust, including unrealized appreciation or depreciation, are F-35
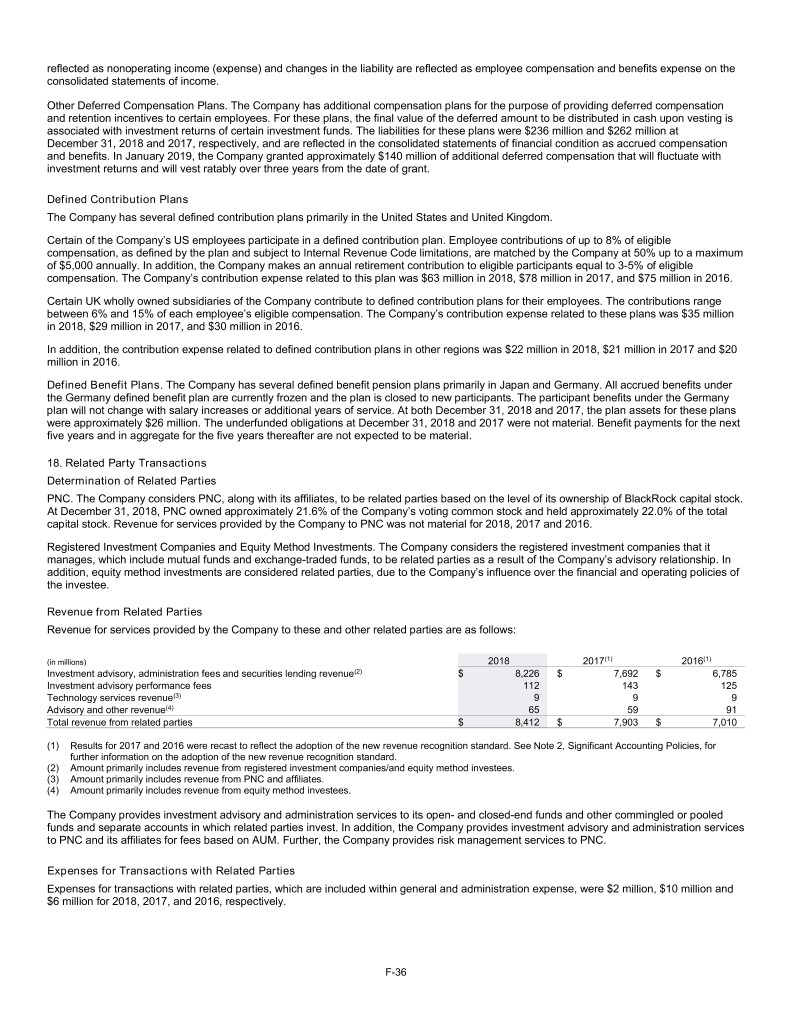
reflected as nonoperating income (expense) and changes in the liability are reflected as employee compensation and benefits expense on the consolidated statements of income. Other Deferred Compensation Plans. The Company has additional compensation plans for the purpose of providing deferred compensation and retention incentives to certain employees. For these plans, the final value of the deferred amount to be distributed in cash upon vesting is associated with investment returns of certain investment funds. The liabilities for these plans were $236 million and $262 million at December 31, 2018 and 2017, respectively, and are reflected in the consolidated statements of financial condition as accrued compensation and benefits. In January 2019, the Company granted approximately $140 million of additional deferred compensation that will fluctuate with investment returns and will vest ratably over three years from the date of grant. Defined Contribution Plans The Company has several defined contribution plans primarily in the United States and United Kingdom. Certain of the Company’s US employees participate in a defined contribution plan. Employee contributions of up to 8% of eligible compensation, as defined by the plan and subject to Internal Revenue Code limitations, are matched by the Company at 50% up to a maximum of $5,000 annually. In addition, the Company makes an annual retirement contribution to eligible participants equal to 3-5% of eligible compensation. The Company’s contribution expense related to this plan was $63 million in 2018, $78 million in 2017, and $75 million in 2016. Certain UK wholly owned subsidiaries of the Company contribute to defined contribution plans for their employees. The contributions range between 6% and 15% of each employee’s eligible compensation. The Company’s contribution expense related to these plans was $35 million in 2018, $29 million in 2017, and $30 million in 2016. In addition, the contribution expense related to defined contribution plans in other regions was $22 million in 2018, $21 million in 2017 and $20 million in 2016. Defined Benefit Plans. The Company has several defined benefit pension plans primarily in Japan and Germany. All accrued benefits under the Germany defined benefit plan are currently frozen and the plan is closed to new participants. The participant benefits under the Germany plan will not change with salary increases or additional years of service. At both December 31, 2018 and 2017, the plan assets for these plans were approximately $26 million. The underfunded obligations at December 31, 2018 and 2017 were not material. Benefit payments for the next five years and in aggregate for the five years thereafter are not expected to be material. 18. Related Party Transactions Determination of Related Parties PNC. The Company considers PNC, along with its affiliates, to be related parties based on the level of its ownership of BlackRock capital stock. At December 31, 2018, PNC owned approximately 21.6% of the Company’s voting common stock and held approximately 22.0% of the total capital stock. Revenue for services provided by the Company to PNC was not material for 2018, 2017 and 2016. Registered Investment Companies and Equity Method Investments. The Company considers the registered investment companies that it manages, which include mutual funds and exchange-traded funds, to be related parties as a result of the Company’s advisory relationship. In addition, equity method investments are considered related parties, due to the Company’s influence over the financial and operating policies of the investee. Revenue from Related Parties Revenue for services provided by the Company to these and other related parties are as follows: (in millions) 2018 2017(1) 2016(1) Investment advisory, administration fees and securities lending revenue(2) $ 8,226 $ 7,692 $ 6,785 Investment advisory performance fees 112 143 125 Technology services revenue(3) 9 9 9 Advisory and other revenue(4) 65 59 91 Total revenue from related parties $ 8,412 $ 7,903 $ 7,010 (1) Results for 2017 and 2016 were recast to reflect the adoption of the new revenue recognition standard. See Note 2, Significant Accounting Policies, for further information on the adoption of the new revenue recognition standard. (2) Amount primarily includes revenue from registered investment companies/and equity method investees. (3) Amount primarily includes revenue from PNC and affiliates. (4) Amount primarily includes revenue from equity method investees. The Company provides investment advisory and administration services to its open- and closed-end funds and other commingled or pooled funds and separate accounts in which related parties invest. In addition, the Company provides investment advisory and administration services to PNC and its affiliates for fees based on AUM. Further, the Company provides risk management services to PNC. Expenses for Transactions with Related Parties Expenses for transactions with related parties, which are included within general and administration expense, were $2 million, $10 million and $6 million for 2018, 2017, and 2016, respectively. F-36
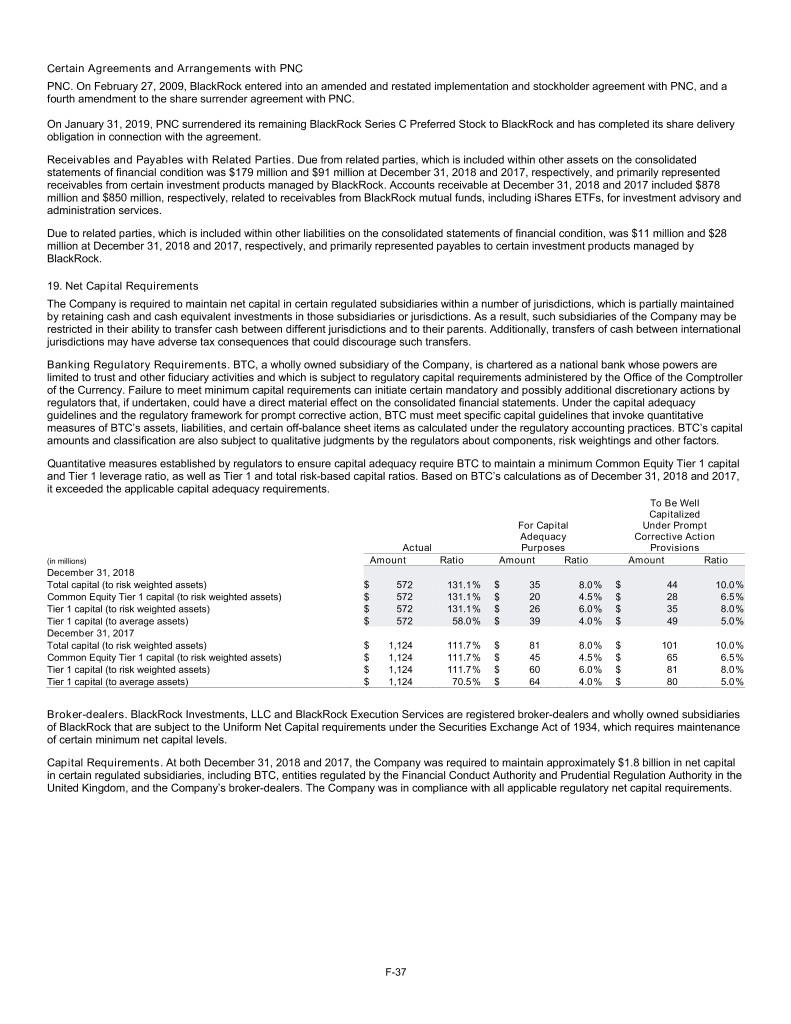
Certain Agreements and Arrangements with PNC PNC. On February 27, 2009, BlackRock entered into an amended and restated implementation and stockholder agreement with PNC, and a fourth amendment to the share surrender agreement with PNC. On January 31, 2019, PNC surrendered its remaining BlackRock Series C Preferred Stock to BlackRock and has completed its share delivery obligation in connection with the agreement. Receivables and Payables with Related Parties. Due from related parties, which is included within other assets on the consolidated statements of financial condition was $179 million and $91 million at December 31, 2018 and 2017, respectively, and primarily represented receivables from certain investment products managed by BlackRock. Accounts receivable at December 31, 2018 and 2017 included $878 million and $850 million, respectively, related to receivables from BlackRock mutual funds, including iShares ETFs, for investment advisory and administration services. Due to related parties, which is included within other liabilities on the consolidated statements of financial condition, was $11 million and $28 million at December 31, 2018 and 2017, respectively, and primarily represented payables to certain investment products managed by BlackRock. 19. Net Capital Requirements The Company is required to maintain net capital in certain regulated subsidiaries within a number of jurisdictions, which is partially maintained by retaining cash and cash equivalent investments in those subsidiaries or jurisdictions. As a result, such subsidiaries of the Company may be restricted in their ability to transfer cash between different jurisdictions and to their parents. Additionally, transfers of cash between international jurisdictions may have adverse tax consequences that could discourage such transfers. Banking Regulatory Requirements. BTC, a wholly owned subsidiary of the Company, is chartered as a national bank whose powers are limited to trust and other fiduciary activities and which is subject to regulatory capital requirements administered by the Office of the Comptroller of the Currency. Failure to meet minimum capital requirements can initiate certain mandatory and possibly additional discretionary actions by regulators that, if undertaken, could have a direct material effect on the consolidated financial statements. Under the capital adequacy guidelines and the regulatory framework for prompt corrective action, BTC must meet specific capital guidelines that invoke quantitative measures of BTC’s assets, liabilities, and certain off-balance sheet items as calculated under the regulatory accounting practices. BTC’s capital amounts and classification are also subject to qualitative judgments by the regulators about components, risk weightings and other factors. Quantitative measures established by regulators to ensure capital adequacy require BTC to maintain a minimum Common Equity Tier 1 capital and Tier 1 leverage ratio, as well as Tier 1 and total risk-based capital ratios. Based on BTC’s calculations as of December 31, 2018 and 2017, it exceeded the applicable capital adequacy requirements. To Be Well Capitalized For Capital Under Prompt Adequacy Corrective Action Actual Purposes Provisions (in millions) Amount Ratio Amount Ratio Amount Ratio December 31, 2018 Total capital (to risk weighted assets) $ 572 131.1 % $ 35 8.0 % $ 44 10.0 % Common Equity Tier 1 capital (to risk weighted assets) $ 572 131.1 % $ 20 4.5 % $ 28 6.5 % Tier 1 capital (to risk weighted assets) $ 572 131.1 % $ 26 6.0 % $ 35 8.0 % Tier 1 capital (to average assets) $ 572 58.0 % $ 39 4.0 % $ 49 5.0 % December 31, 2017 Total capital (to risk weighted assets) $ 1,124 111.7 % $ 81 8.0 % $ 101 10.0 % Common Equity Tier 1 capital (to risk weighted assets) $ 1,124 111.7 % $ 45 4.5 % $ 65 6.5 % Tier 1 capital (to risk weighted assets) $ 1,124 111.7 % $ 60 6.0 % $ 81 8.0 % Tier 1 capital (to average assets) $ 1,124 70.5 % $ 64 4.0 % $ 80 5.0 % Broker-dealers. BlackRock Investments, LLC and BlackRock Execution Services are registered broker-dealers and wholly owned subsidiaries of BlackRock that are subject to the Uniform Net Capital requirements under the Securities Exchange Act of 1934, which requires maintenance of certain minimum net capital levels. Capital Requirements. At both December 31, 2018 and 2017, the Company was required to maintain approximately $1.8 billion in net capital in certain regulated subsidiaries, including BTC, entities regulated by the Financial Conduct Authority and Prudential Regulation Authority in the United Kingdom, and the Company’s broker-dealers. The Company was in compliance with all applicable regulatory net capital requirements. F-37
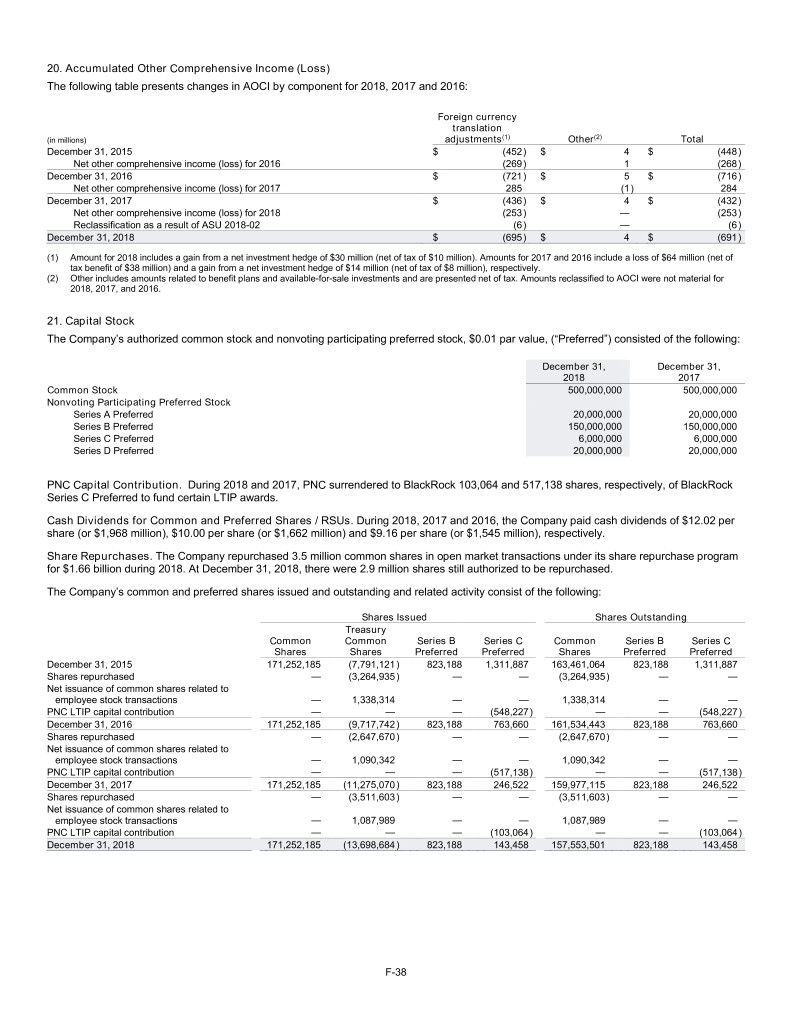
20. Accumulated Other Comprehensive Income (Loss) The following table presents changes in AOCI by component for 2018, 2017 and 2016: Foreign currency translation (in millions) adjustments(1) Other(2) Total December 31, 2015 $ (452 ) $ 4 $ (448 ) Net other comprehensive income (loss) for 2016 (269 ) 1 (268 ) December 31, 2016 $ (721 ) $ 5 $ (716 ) Net other comprehensive income (loss) for 2017 285 (1 ) 284 December 31, 2017 $ (436 ) $ 4 $ (432 ) Net other comprehensive income (loss) for 2018 (253 ) — (253 ) Reclassification as a result of ASU 2018-02 (6 ) — (6 ) December 31, 2018 $ (695 ) $ 4 $ (691 ) (1) Amount for 2018 includes a gain from a net investment hedge of $30 million (net of tax of $10 million). Amounts for 2017 and 2016 include a loss of $64 million (net of tax benefit of $38 million) and a gain from a net investment hedge of $14 million (net of tax of $8 million), respectively. (2) Other includes amounts related to benefit plans and available-for-sale investments and are presented net of tax. Amounts reclassified to AOCI were not material for 2018, 2017, and 2016. 21. Capital Stock The Company’s authorized common stock and nonvoting participating preferred stock, $0.01 par value, (“Preferred”) consisted of the following: December 31, December 31, 2018 2017 Common Stock 500,000,000 500,000,000 Nonvoting Participating Preferred Stock Series A Preferred 20,000,000 20,000,000 Series B Preferred 150,000,000 150,000,000 Series C Preferred 6,000,000 6,000,000 Series D Preferred 20,000,000 20,000,000 PNC Capital Contribution. During 2018 and 2017, PNC surrendered to BlackRock 103,064 and 517,138 shares, respectively, of BlackRock Series C Preferred to fund certain LTIP awards. Cash Dividends for Common and Preferred Shares / RSUs. During 2018, 2017 and 2016, the Company paid cash dividends of $12.02 per share (or $1,968 million), $10.00 per share (or $1,662 million) and $9.16 per share (or $1,545 million), respectively. Share Repurchases. The Company repurchased 3.5 million common shares in open market transactions under its share repurchase program for $1.66 billion during 2018. At December 31, 2018, there were 2.9 million shares still authorized to be repurchased. The Company’s common and preferred shares issued and outstanding and related activity consist of the following: Shares Issued Shares Outstanding Treasury Common Common Series B Series C Common Series B Series C Shares Shares Preferred Preferred Shares Preferred Preferred December 31, 2015 171,252,185 (7,791,121 ) 823,188 1,311,887 163,461,064 823,188 1,311,887 Shares repurchased — (3,264,935 ) — — (3,264,935 ) — — Net issuance of common shares related to employee stock transactions — 1,338,314 — — 1,338,314 — — PNC LTIP capital contribution — — — (548,227 ) — — (548,227 ) December 31, 2016 171,252,185 (9,717,742 ) 823,188 763,660 161,534,443 823,188 763,660 Shares repurchased — (2,647,670 ) — — (2,647,670 ) — — Net issuance of common shares related to employee stock transactions — 1,090,342 — — 1,090,342 — — PNC LTIP capital contribution — — — (517,138 ) — — (517,138 ) December 31, 2017 171,252,185 (11,275,070 ) 823,188 246,522 159,977,115 823,188 246,522 Shares repurchased — (3,511,603 ) — — (3,511,603 ) — — Net issuance of common shares related to employee stock transactions — 1,087,989 — — 1,087,989 — — PNC LTIP capital contribution — — — (103,064 ) — — (103,064 ) December 31, 2018 171,252,185 (13,698,684 ) 823,188 143,458 157,553,501 823,188 143,458 F-38
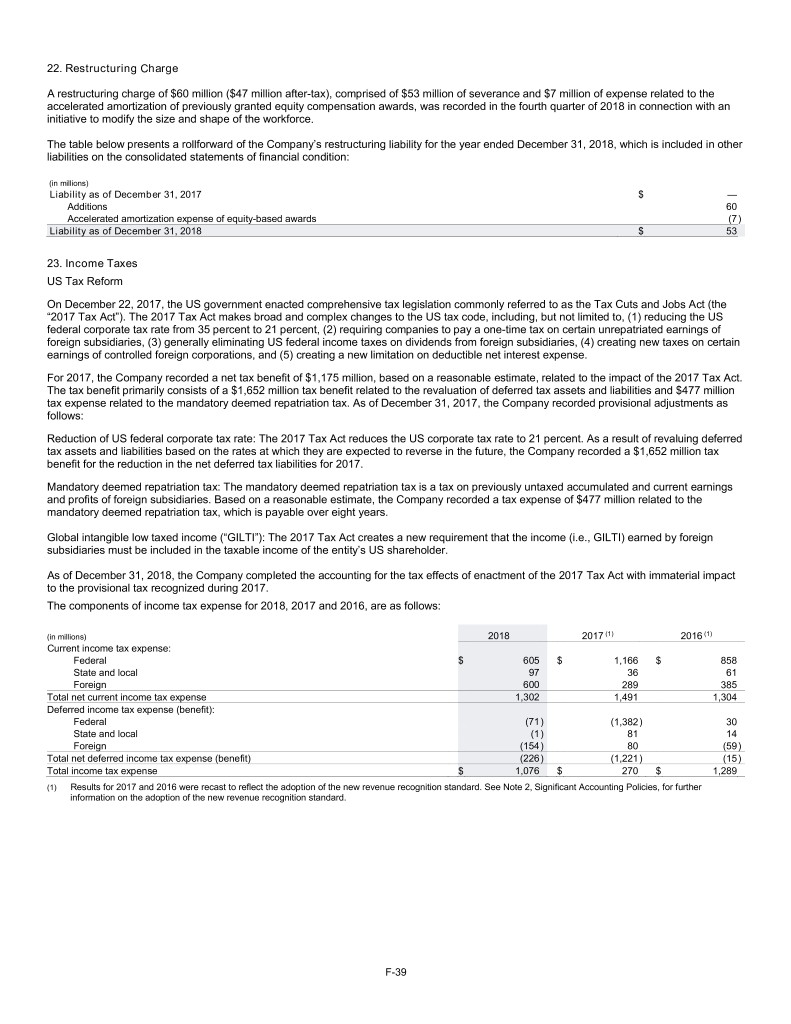
22. Restructuring Charge A restructuring charge of $60 million ($47 million after-tax), comprised of $53 million of severance and $7 million of expense related to the accelerated amortization of previously granted equity compensation awards, was recorded in the fourth quarter of 2018 in connection with an initiative to modify the size and shape of the workforce. The table below presents a rollforward of the Company’s restructuring liability for the year ended December 31, 2018, which is included in other liabilities on the consolidated statements of financial condition: (in millions) Liability as of December 31, 2017 $ — Additions 60 Accelerated amortization expense of equity-based awards (7 ) Liability as of December 31, 2018 $ 53 23. Income Taxes US Tax Reform On December 22, 2017, the US government enacted comprehensive tax legislation commonly referred to as the Tax Cuts and Jobs Act (the “2017 Tax Act”). The 2017 Tax Act makes broad and complex changes to the US tax code, including, but not limited to, (1) reducing the US federal corporate tax rate from 35 percent to 21 percent, (2) requiring companies to pay a one-time tax on certain unrepatriated earnings of foreign subsidiaries, (3) generally eliminating US federal income taxes on dividends from foreign subsidiaries, (4) creating new taxes on certain earnings of controlled foreign corporations, and (5) creating a new limitation on deductible net interest expense. For 2017, the Company recorded a net tax benefit of $1,175 million, based on a reasonable estimate, related to the impact of the 2017 Tax Act. The tax benefit primarily consists of a $1,652 million tax benefit related to the revaluation of deferred tax assets and liabilities and $477 million tax expense related to the mandatory deemed repatriation tax. As of December 31, 2017, the Company recorded provisional adjustments as follows: Reduction of US federal corporate tax rate: The 2017 Tax Act reduces the US corporate tax rate to 21 percent. As a result of revaluing deferred tax assets and liabilities based on the rates at which they are expected to reverse in the future, the Company recorded a $1,652 million tax benefit for the reduction in the net deferred tax liabilities for 2017. Mandatory deemed repatriation tax: The mandatory deemed repatriation tax is a tax on previously untaxed accumulated and current earnings and profits of foreign subsidiaries. Based on a reasonable estimate, the Company recorded a tax expense of $477 million related to the mandatory deemed repatriation tax, which is payable over eight years. Global intangible low taxed income (“GILTI”): The 2017 Tax Act creates a new requirement that the income (i.e., GILTI) earned by foreign subsidiaries must be included in the taxable income of the entity’s US shareholder. As of December 31, 2018, the Company completed the accounting for the tax effects of enactment of the 2017 Tax Act with immaterial impact to the provisional tax recognized during 2017. The components of income tax expense for 2018, 2017 and 2016, are as follows: (in millions) 2018 2017 (1) 2016 (1) Current income tax expense: Federal $ 605 $ 1,166 $ 858 State and local 97 36 61 Foreign 600 289 385 Total net current income tax expense 1,302 1,491 1,304 Deferred income tax expense (benefit): Federal (71 ) (1,382 ) 30 State and local (1 ) 81 14 Foreign (154 ) 80 (59 ) Total net deferred income tax expense (benefit) (226 ) (1,221 ) (15 ) Total income tax expense $ 1,076 $ 270 $ 1,289 (1) Results for 2017 and 2016 were recast to reflect the adoption of the new revenue recognition standard. See Note 2, Significant Accounting Policies, for further information on the adoption of the new revenue recognition standard. F-39
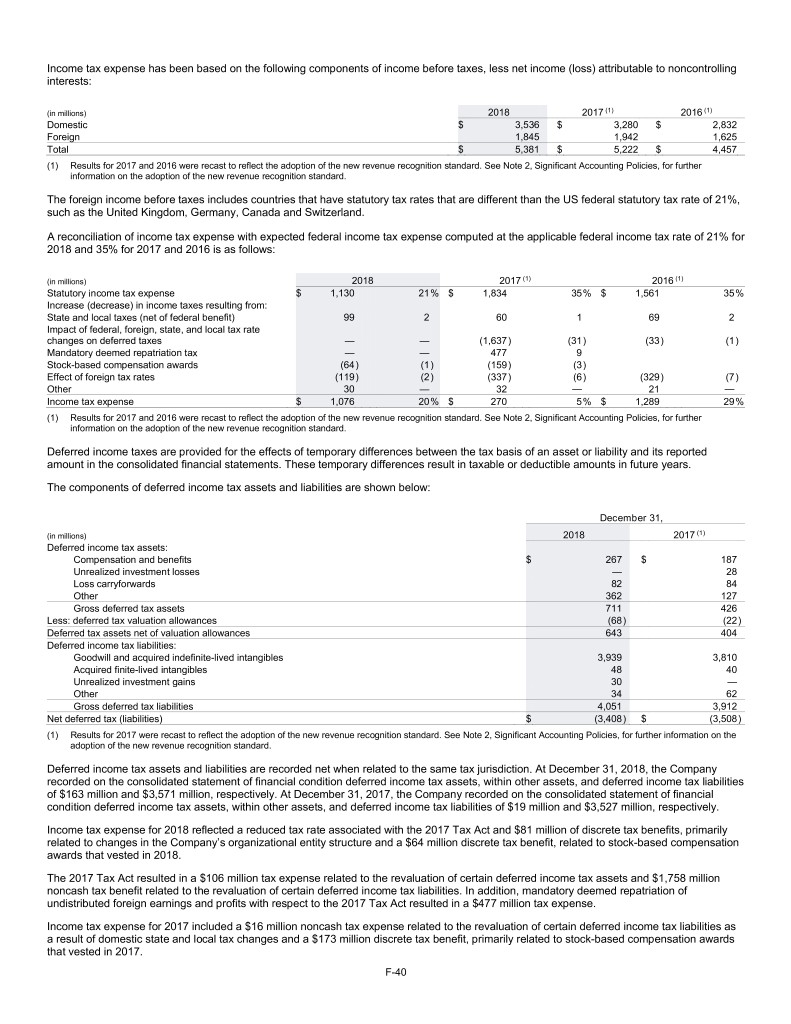
Income tax expense has been based on the following components of income before taxes, less net income (loss) attributable to noncontrolling interests: (in millions) 2018 2017 (1) 2016 (1) Domestic $ 3,536 $ 3,280 $ 2,832 Foreign 1,845 1,942 1,625 Total $ 5,381 $ 5,222 $ 4,457 (1) Results for 2017 and 2016 were recast to reflect the adoption of the new revenue recognition standard. See Note 2, Significant Accounting Policies, for further information on the adoption of the new revenue recognition standard. The foreign income before taxes includes countries that have statutory tax rates that are different than the US federal statutory tax rate of 21%, such as the United Kingdom, Germany, Canada and Switzerland. A reconciliation of income tax expense with expected federal income tax expense computed at the applicable federal income tax rate of 21% for 2018 and 35% for 2017 and 2016 is as follows: (in millions) 2018 2017 (1) 2016 (1) Statutory income tax expense $ 1,130 21 % $ 1,834 35 % $ 1,561 35 % Increase (decrease) in income taxes resulting from: State and local taxes (net of federal benefit) 99 2 60 1 69 2 Impact of federal, foreign, state, and local tax rate changes on deferred taxes — — (1,637 ) (31 ) (33 ) (1 ) Mandatory deemed repatriation tax — — 477 9 Stock-based compensation awards (64 ) (1 ) (159 ) (3 ) Effect of foreign tax rates (119 ) (2 ) (337 ) (6 ) (329 ) (7 ) Other 30 — 32 — 21 — Income tax expense $ 1,076 20 % $ 270 5 % $ 1,289 29 % (1) Results for 2017 and 2016 were recast to reflect the adoption of the new revenue recognition standard. See Note 2, Significant Accounting Policies, for further information on the adoption of the new revenue recognition standard. Deferred income taxes are provided for the effects of temporary differences between the tax basis of an asset or liability and its reported amount in the consolidated financial statements. These temporary differences result in taxable or deductible amounts in future years. The components of deferred income tax assets and liabilities are shown below: December 31, (in millions) 2018 2017 (1) Deferred income tax assets: Compensation and benefits $ 267 $ 187 Unrealized investment losses — 28 Loss carryforwards 82 84 Other 362 127 Gross deferred tax assets 711 426 Less: deferred tax valuation allowances (68 ) (22 ) Deferred tax assets net of valuation allowances 643 404 Deferred income tax liabilities: Goodwill and acquired indefinite-lived intangibles 3,939 3,810 Acquired finite-lived intangibles 48 40 Unrealized investment gains 30 — Other 34 62 Gross deferred tax liabilities 4,051 3,912 Net deferred tax (liabilities) $ (3,408 ) $ (3,508 ) (1) Results for 2017 were recast to reflect the adoption of the new revenue recognition standard. See Note 2, Significant Accounting Policies, for further information on the adoption of the new revenue recognition standard. Deferred income tax assets and liabilities are recorded net when related to the same tax jurisdiction. At December 31, 2018, the Company recorded on the consolidated statement of financial condition deferred income tax assets, within other assets, and deferred income tax liabilities of $163 million and $3,571 million, respectively. At December 31, 2017, the Company recorded on the consolidated statement of financial condition deferred income tax assets, within other assets, and deferred income tax liabilities of $19 million and $3,527 million, respectively. Income tax expense for 2018 reflected a reduced tax rate associated with the 2017 Tax Act and $81 million of discrete tax benefits, primarily related to changes in the Company’s organizational entity structure and a $64 million discrete tax benefit, related to stock-based compensation awards that vested in 2018. The 2017 Tax Act resulted in a $106 million tax expense related to the revaluation of certain deferred income tax assets and $1,758 million noncash tax benefit related to the revaluation of certain deferred income tax liabilities. In addition, mandatory deemed repatriation of undistributed foreign earnings and profits with respect to the 2017 Tax Act resulted in a $477 million tax expense. Income tax expense for 2017 included a $16 million noncash tax expense related to the revaluation of certain deferred income tax liabilities as a result of domestic state and local tax changes and a $173 million discrete tax benefit, primarily related to stock-based compensation awards that vested in 2017. F-40
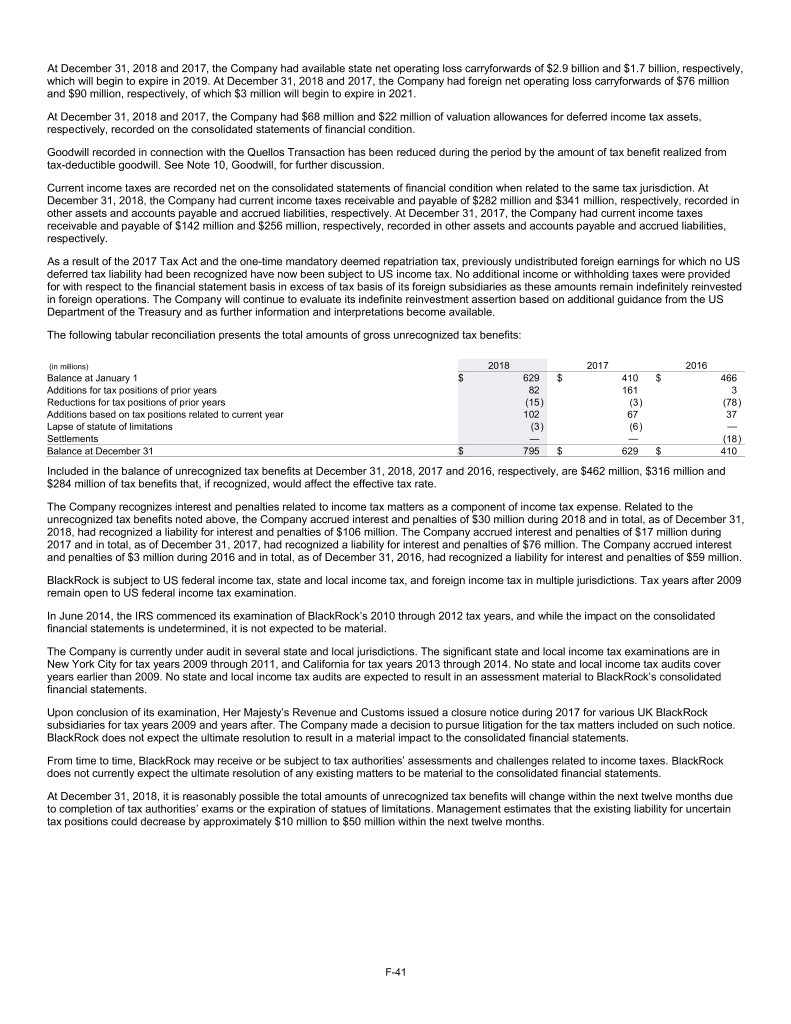
At December 31, 2018 and 2017, the Company had available state net operating loss carryforwards of $2.9 billion and $1.7 billion, respectively, which will begin to expire in 2019. At December 31, 2018 and 2017, the Company had foreign net operating loss carryforwards of $76 million and $90 million, respectively, of which $3 million will begin to expire in 2021. At December 31, 2018 and 2017, the Company had $68 million and $22 million of valuation allowances for deferred income tax assets, respectively, recorded on the consolidated statements of financial condition. Goodwill recorded in connection with the Quellos Transaction has been reduced during the period by the amount of tax benefit realized from tax-deductible goodwill. See Note 10, Goodwill, for further discussion. Current income taxes are recorded net on the consolidated statements of financial condition when related to the same tax jurisdiction. At December 31, 2018, the Company had current income taxes receivable and payable of $282 million and $341 million, respectively, recorded in other assets and accounts payable and accrued liabilities, respectively. At December 31, 2017, the Company had current income taxes receivable and payable of $142 million and $256 million, respectively, recorded in other assets and accounts payable and accrued liabilities, respectively. As a result of the 2017 Tax Act and the one-time mandatory deemed repatriation tax, previously undistributed foreign earnings for which no US deferred tax liability had been recognized have now been subject to US income tax. No additional income or withholding taxes were provided for with respect to the financial statement basis in excess of tax basis of its foreign subsidiaries as these amounts remain indefinitely reinvested in foreign operations. The Company will continue to evaluate its indefinite reinvestment assertion based on additional guidance from the US Department of the Treasury and as further information and interpretations become available. The following tabular reconciliation presents the total amounts of gross unrecognized tax benefits: (in millions) 2018 2017 2016 Balance at January 1 $ 629 $ 410 $ 466 Additions for tax positions of prior years 82 161 3 Reductions for tax positions of prior years (15 ) (3 ) (78 ) Additions based on tax positions related to current year 102 67 37 Lapse of statute of limitations (3 ) (6 ) — Settlements — — (18 ) Balance at December 31 $ 795 $ 629 $ 410 Included in the balance of unrecognized tax benefits at December 31, 2018, 2017 and 2016, respectively, are $462 million, $316 million and $284 million of tax benefits that, if recognized, would affect the effective tax rate. The Company recognizes interest and penalties related to income tax matters as a component of income tax expense. Related to the unrecognized tax benefits noted above, the Company accrued interest and penalties of $30 million during 2018 and in total, as of December 31, 2018, had recognized a liability for interest and penalties of $106 million. The Company accrued interest and penalties of $17 million during 2017 and in total, as of December 31, 2017, had recognized a liability for interest and penalties of $76 million. The Company accrued interest and penalties of $3 million during 2016 and in total, as of December 31, 2016, had recognized a liability for interest and penalties of $59 million. BlackRock is subject to US federal income tax, state and local income tax, and foreign income tax in multiple jurisdictions. Tax years after 2009 remain open to US federal income tax examination. In June 2014, the IRS commenced its examination of BlackRock’s 2010 through 2012 tax years, and while the impact on the consolidated financial statements is undetermined, it is not expected to be material. The Company is currently under audit in several state and local jurisdictions. The significant state and local income tax examinations are in New York City for tax years 2009 through 2011, and California for tax years 2013 through 2014. No state and local income tax audits cover years earlier than 2009. No state and local income tax audits are expected to result in an assessment material to BlackRock’s consolidated financial statements. Upon conclusion of its examination, Her Majesty’s Revenue and Customs issued a closure notice during 2017 for various UK BlackRock subsidiaries for tax years 2009 and years after. The Company made a decision to pursue litigation for the tax matters included on such notice. BlackRock does not expect the ultimate resolution to result in a material impact to the consolidated financial statements. From time to time, BlackRock may receive or be subject to tax authorities’ assessments and challenges related to income taxes. BlackRock does not currently expect the ultimate resolution of any existing matters to be material to the consolidated financial statements. At December 31, 2018, it is reasonably possible the total amounts of unrecognized tax benefits will change within the next twelve months due to completion of tax authorities’ exams or the expiration of statues of limitations. Management estimates that the existing liability for uncertain tax positions could decrease by approximately $10 million to $50 million within the next twelve months. F-41
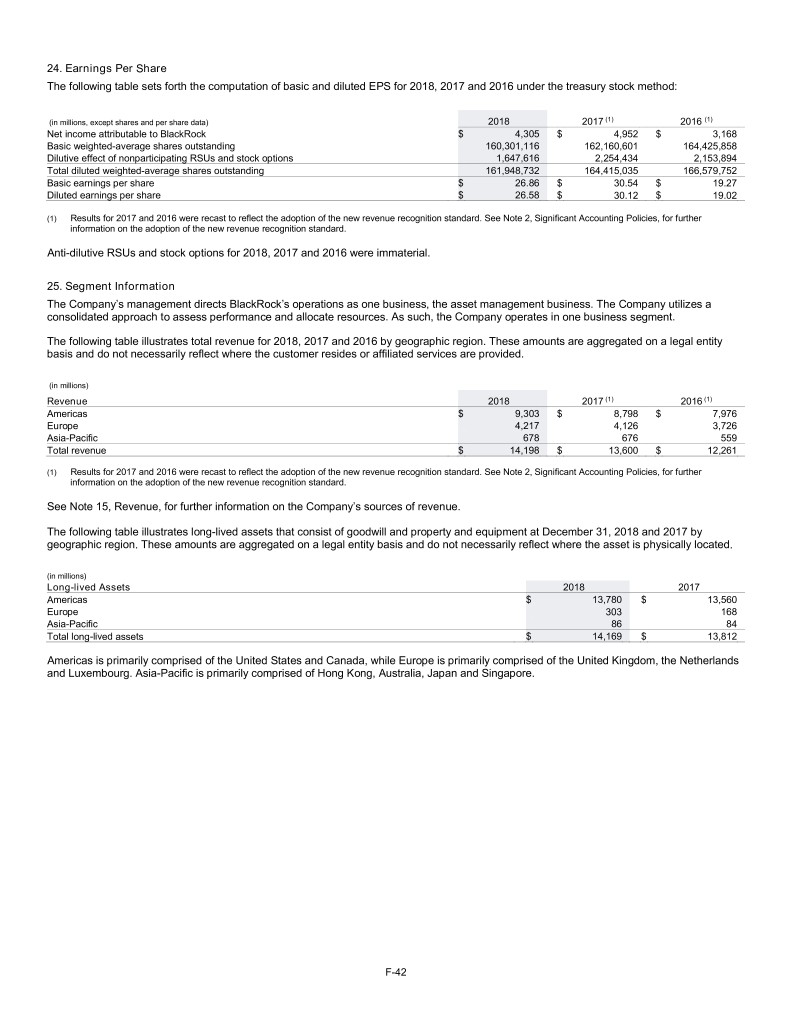
24. Earnings Per Share The following table sets forth the computation of basic and diluted EPS for 2018, 2017 and 2016 under the treasury stock method: (in millions, except shares and per share data) 2018 2017 (1) 2016 (1) Net income attributable to BlackRock $ 4,305 $ 4,952 $ 3,168 Basic weighted-average shares outstanding 160,301,116 162,160,601 164,425,858 Dilutive effect of nonparticipating RSUs and stock options 1,647,616 2,254,434 2,153,894 Total diluted weighted-average shares outstanding 161,948,732 164,415,035 166,579,752 Basic earnings per share $ 26.86 $ 30.54 $ 19.27 Diluted earnings per share $ 26.58 $ 30.12 $ 19.02 (1) Results for 2017 and 2016 were recast to reflect the adoption of the new revenue recognition standard. See Note 2, Significant Accounting Policies, for further information on the adoption of the new revenue recognition standard. Anti-dilutive RSUs and stock options for 2018, 2017 and 2016 were immaterial. 25. Segment Information The Company’s management directs BlackRock’s operations as one business, the asset management business. The Company utilizes a consolidated approach to assess performance and allocate resources. As such, the Company operates in one business segment. The following table illustrates total revenue for 2018, 2017 and 2016 by geographic region. These amounts are aggregated on a legal entity basis and do not necessarily reflect where the customer resides or affiliated services are provided. (in millions) Revenue 2018 2017 (1) 2016 (1) Americas $ 9,303 $ 8,798 $ 7,976 Europe 4,217 4,126 3,726 Asia-Pacific 678 676 559 Total revenue $ 14,198 $ 13,600 $ 12,261 (1) Results for 2017 and 2016 were recast to reflect the adoption of the new revenue recognition standard. See Note 2, Significant Accounting Policies, for further information on the adoption of the new revenue recognition standard. See Note 15, Revenue, for further information on the Company’s sources of revenue. The following table illustrates long-lived assets that consist of goodwill and property and equipment at December 31, 2018 and 2017 by geographic region. These amounts are aggregated on a legal entity basis and do not necessarily reflect where the asset is physically located. (in millions) Long-lived Assets 2018 2017 Americas $ 13,780 $ 13,560 Europe 303 168 Asia-Pacific 86 84 Total long-lived assets $ 14,169 $ 13,812 Americas is primarily comprised of the United States and Canada, while Europe is primarily comprised of the United Kingdom, the Netherlands and Luxembourg. Asia-Pacific is primarily comprised of Hong Kong, Australia, Japan and Singapore. F-42
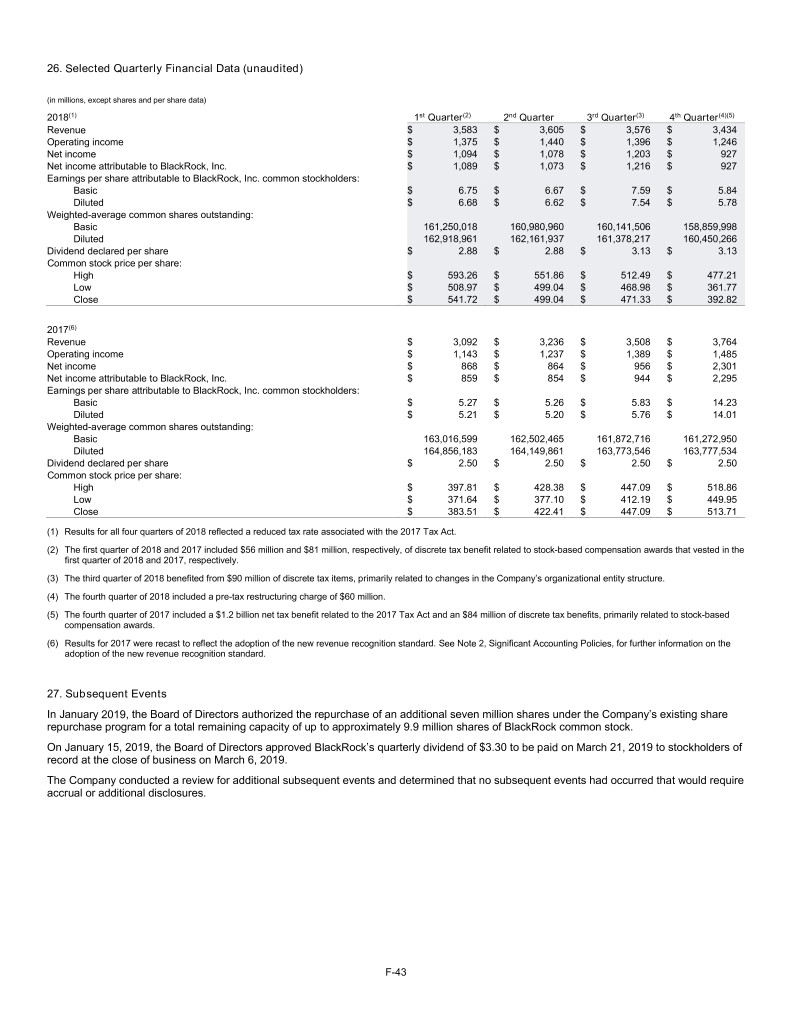
26. Selected Quarterly Financial Data (unaudited) (in millions, except shares and per share data) 2018(1) 1st Quarter(2) 2nd Quarter 3rd Quarter(3) 4th Quarter(4)(5) Revenue $ 3,583 $ 3,605 $ 3,576 $ 3,434 Operating income $ 1,375 $ 1,440 $ 1,396 $ 1,246 Net income $ 1,094 $ 1,078 $ 1,203 $ 927 Net income attributable to BlackRock, Inc. $ 1,089 $ 1,073 $ 1,216 $ 927 Earnings per share attributable to BlackRock, Inc. common stockholders: Basic $ 6.75 $ 6.67 $ 7.59 $ 5.84 Diluted $ 6.68 $ 6.62 $ 7.54 $ 5.78 Weighted-average common shares outstanding: Basic 161,250,018 160,980,960 160,141,506 158,859,998 Diluted 162,918,961 162,161,937 161,378,217 160,450,266 Dividend declared per share $ 2.88 $ 2.88 $ 3.13 $ 3.13 Common stock price per share: High $ 593.26 $ 551.86 $ 512.49 $ 477.21 Low $ 508.97 $ 499.04 $ 468.98 $ 361.77 Close $ 541.72 $ 499.04 $ 471.33 $ 392.82 2017(6) Revenue $ 3,092 $ 3,236 $ 3,508 $ 3,764 Operating income $ 1,143 $ 1,237 $ 1,389 $ 1,485 Net income $ 868 $ 864 $ 956 $ 2,301 Net income attributable to BlackRock, Inc. $ 859 $ 854 $ 944 $ 2,295 Earnings per share attributable to BlackRock, Inc. common stockholders: Basic $ 5.27 $ 5.26 $ 5.83 $ 14.23 Diluted $ 5.21 $ 5.20 $ 5.76 $ 14.01 Weighted-average common shares outstanding: Basic 163,016,599 162,502,465 161,872,716 161,272,950 Diluted 164,856,183 164,149,861 163,773,546 163,777,534 Dividend declared per share $ 2.50 $ 2.50 $ 2.50 $ 2.50 Common stock price per share: High $ 397.81 $ 428.38 $ 447.09 $ 518.86 Low $ 371.64 $ 377.10 $ 412.19 $ 449.95 Close $ 383.51 $ 422.41 $ 447.09 $ 513.71 (1) Results for all four quarters of 2018 reflected a reduced tax rate associated with the 2017 Tax Act. (2) The first quarter of 2018 and 2017 included $56 million and $81 million, respectively, of discrete tax benefit related to stock-based compensation awards that vested in the first quarter of 2018 and 2017, respectively. (3) The third quarter of 2018 benefited from $90 million of discrete tax items, primarily related to changes in the Company’s organizational entity structure. (4) The fourth quarter of 2018 included a pre-tax restructuring charge of $60 million. (5) The fourth quarter of 2017 included a $1.2 billion net tax benefit related to the 2017 Tax Act and an $84 million of discrete tax benefits, primarily related to stock-based compensation awards. (6) Results for 2017 were recast to reflect the adoption of the new revenue recognition standard. See Note 2, Significant Accounting Policies, for further information on the adoption of the new revenue recognition standard. 27. Subsequent Events In January 2019, the Board of Directors authorized the repurchase of an additional seven million shares under the Company’s existing share repurchase program for a total remaining capacity of up to approximately 9.9 million shares of BlackRock common stock. On January 15, 2019, the Board of Directors approved BlackRock’s quarterly dividend of $3.30 to be paid on March 21, 2019 to stockholders of record at the close of business on March 6, 2019. The Company conducted a review for additional subsequent events and determined that no subsequent events had occurred that would require accrual or additional disclosures. F-43