EX-99.1
Published on May 3, 2017
Exhibit 99.1
ITEM 7 MANAGEMENTS DISCUSSION AND ANALYSIS OF FINANCIAL CONDITION AND RESULTS OF OPERATIONS (MD&A)
Forward-Looking Statements: From time to time, The PNC Financial Services Group, Inc. (PNC or the Corporation) has made and may continue to make written or oral forward-looking statements regarding our outlook for earnings, revenues, expenses, capital and liquidity levels and ratios, asset levels, asset quality, financial position and other matters regarding or affecting us and our future business and operations or the impact of legal, regulatory or supervisory matters on our business operations or performance. This Report and our 2016 Annual Report on Form 10-K (2016 Form 10-K) also includes forward-looking statements. With respect to all such forward-looking statements, you should review our Risk Factors discussion in Item 1A of our 2016 Form 10-K, our Risk Management, Critical Accounting Estimates And Judgments, and Cautionary Statement Regarding Forward-Looking Information sections included in Item 7 of this Report, and Note 19 Legal Proceedings and Note 20 Commitments in the Notes To Consolidated Financial Statements included in Item 8 of this Report for factors that could cause actual results or future events to differ, perhaps materially, from historical performance and from those anticipated in the forward-looking statements included in this Report. See page 45 for a glossary of certain terms used in this Report. In this Report, PNC, we or us refers to The PNC Financial Services Group, Inc. and its subsidiaries on a consolidated basis. References to The PNC Financial Services Group, Inc. or to any of its subsidiaries are specifically made where applicable.
EXECUTIVE SUMMARY
Key Strategic Goals
At PNC we manage our company for the long term. We are focused on the fundamentals of growing customers, loans, deposits and revenue and improving profitability, while investing for the future and managing risk, expenses and capital. We continue to invest in our products, markets and brand, and embrace our commitments to our customers, shareholders, employees and the communities where we do business.
We strive to expand and deepen customer relationships by offering a broad range of deposit, fee-based and credit products and services. We are focused on delivering those products and services to our customers with the goal of addressing their financial objectives and putting customers needs first. Our business model is built on customer loyalty and engagement, understanding our customers financial goals and offering our diverse products and services to help them achieve financial wellbeing. Our approach is concentrated on organically growing and deepening client relationships across our lines of business that meet our risk/return measures.
Our strategic priorities are designed to enhance value over the long term. One of our priorities is to build a leading banking franchise in our underpenetrated geographic markets. We are focused on reinventing the retail banking experience by transforming the retail distribution network and the home lending process for a better customer experience and improved efficiency, and growing our consumer loan portfolio. In addition, we are seeking to attract more of the investable assets of new and existing clients and we continue to focus on expense management while investing in technology to bolster critical business infrastructure and streamline core processes.
Our capital priorities are to support client growth and business investment, maintain appropriate capital in light of economic conditions and the Basel III framework and return excess capital to shareholders, in accordance with the currently effective capital plan included in our Comprehensive Capital Analysis and Review (CCAR) submission to the Board of Governors of the Federal Reserve System (Federal Reserve). For more detail, see the Capital Highlights portion of this Executive Summary and the Liquidity and Capital Management portion of the Risk Management section of this Item 7 and the Supervision and Regulation section in Item 1 Business of our 2016 Form 10-K.
Key Factors Affecting Financial Performance
We face a variety of risks that may impact various aspects of our risk profile from time to time. The extent of such impacts may vary depending on factors such as the current economic, political and regulatory environment, merger and acquisition activity and operational challenges. Many of these risks and our risk management strategies are described in more detail elsewhere in this Report.
Our financial performance is substantially affected by a number of external factors outside of our control, including the following:
| | Domestic and global economic conditions, including the continuity, speed and stamina of the current U.S. economic expansion in general and its impact on our customers in particular; |
| | The monetary policy actions and statements of the Federal Reserve and the Federal Open Market Committee (FOMC); |
| | The level of, and direction, timing and magnitude of movement in, interest rates and the shape of the interest rate yield curve; |
| | The functioning and other performance of, and availability of liquidity in, the capital and other financial markets; |
| | Changes in the competitive and regulatory landscape and in counterparty creditworthiness and performance; |
| | The impact of legislative, regulatory and administrative initiatives and actions, including the form and timing of any further implementation, or changes to, certain reforms enacted by the Dodd-Frank legislation; |
| | The impact of market credit spreads on asset valuations; |
1
| | Asset quality and the ability of customers, counterparties and issuers to perform in accordance with contractual terms; |
| | Loan demand, utilization of credit commitments and standby letters of credit; and |
| | Customer demand for non-loan products and services. |
In addition, our success will depend upon, among other things:
| | Effectively managing capital and liquidity including: |
| | Continuing to maintain and grow our deposit base as a low-cost stable funding source; |
| | Prudent liquidity and capital management to meet evolving regulatory capital, capital planning, stress testing and liquidity standards; and |
| | Actions we take within the capital and other financial markets. |
| | Managing credit risk in our portfolio; |
| | Execution of our strategic priorities; |
| | Our ability to manage and implement strategic business objectives within the changing regulatory environment; |
| | The impact of legal and regulatory-related contingencies; and |
| | The appropriateness of reserves needed for critical accounting estimates and related contingencies. |
For additional information, see the Cautionary Statement Regarding Forward-Looking Information section in this Item 7 and Item 1A Risk Factors in our 2016 Form 10-K.
Income Statement Highlights
Net income for 2016 was $4.0 billion, or $7.30 per diluted common share, a decrease of 4% compared to $4.1 billion, or $7.39 per diluted common share, for 2015.
| | Total revenue decreased $63 million to $15.2 billion. |
| | Net interest income increased $113 million, or 1%, to $8.4 billion. |
| | Net interest margin declined slightly to 2.73% for 2016 compared to 2.74% for 2015. |
| | Noninterest income decreased $176 million, or 3%, to $6.8 billion as growth in fee income was more than offset by a decline in other noninterest income. Noninterest income as a percentage of total revenue was 45% for 2016 and 46% for 2015. |
| | Provision for credit losses increased to $433 million in 2016 compared to $255 million for 2015. |
| | Noninterest expense of $9.5 billion was essentially stable as we continued to focus on disciplined expense management. |
For additional detail, please see the Consolidated Income Statement Review section of this Item 7.
Balance Sheet Highlights
Our balance sheet was strong and well positioned at December 31, 2016 and December 31, 2015.
| | Total loans increased $4.1 billion, or 2%, to $210.8 billion. |
| | Total commercial lending grew $4.4 billion, or 3%. |
| | Total consumer lending decreased $.3 billion. |
| | Total deposits increased $8.2 billion, or 3%, to $257.2 billion. |
| | Investment securities increased $5.4 billion, or 8%, to $75.9 billion. |
For additional detail, see the Consolidated Balance Sheet Review section of this Item 7.
Credit Quality Highlights
Overall credit quality remained relatively stable in 2016 compared to 2015.
| | Nonperforming assets decreased $51 million, or 2%, to $2.4 billion at December 31, 2016 compared to December 31, 2015. |
| | Overall loan delinquencies of $1.6 billion at December 31, 2016 decreased $64 million, or 4%, compared with December 31, 2015. |
| | Net charge-offs of $543 million in 2016 increased compared to net charge-offs of $386 million for 2015. |
For additional detail, see the Credit Risk Management portion of the Risk Management section of this Item 7.
2
Capital Highlights
We maintained a strong capital position and continued to return capital to shareholders.
| | The Transitional Basel III common equity Tier 1 capital ratio was 10.6% at both December 31, 2016 and December 31, 2015. |
| | Pro forma fully phased-in Basel III common equity Tier 1 capital ratio, a non-GAAP financial measure, remained stable at an estimated 10.0% at December 31, 2016 and December 31, 2015 based on the standardized approach rules. |
| | For the full year 2016, we returned $3.1 billion of capital to shareholders through repurchases of 22.8 million common shares for $2.0 billion and dividends on common shares of $1.1 billion, which included an increase of 4 cents in our cash dividend on common stock to 55 cents per share in August 2016. |
See the Liquidity and Capital Management portion of the Risk Management section of this Item 7 for more detail on our 2016 capital and liquidity actions as well as our capital ratios.
Our ability to take certain capital actions, including plans to pay or increase common stock dividends or to repurchase shares under current or future programs, is subject to the results of the supervisory assessment of capital adequacy undertaken by the Federal Reserve as part of the CCAR process. For additional information, see the Supervision and Regulation section in Item 1 Business in our 2016 Form 10-K.
Business Outlook
Statements regarding our business outlook are forward-looking within the meaning of the Private Securities Litigation Reform Act of 1995. Our forward-looking statements are subject to the risk that economic and financial market conditions will be substantially different than those we are currently expecting and do not take into account potential legal and regulatory contingencies. These statements are based on our current view that the U.S. economy and the labor market will grow moderately in 2017, boosted by stable oil/energy prices, improving consumer spending and housing activity, and expanded federal fiscal policy stimulus as a result of the 2016 elections. Short-term interest rates and bond yields are expected to continue rising in 2017, along with inflation. Specifically, our business outlook reflects our expectation of two 25 basis point increases in short-term interest rates by the Federal Reserve in June and December of 2017. See the Cautionary Statement Regarding Forward-Looking Information section in this Item 7 and Item 1A Risk Factors in our 2016 Form 10-K for other factors that could cause future events to differ, perhaps materially, from those anticipated in these forward-looking statements.
For the full year 2017 compared to full year 2016, we expect:
| | Loan growth to be up mid-single digits, on a percentage basis; |
| | Revenue to increase mid-single digits, on a percentage basis; |
| | Purchase accounting accretion to decline $75 million; |
| | Noninterest expense to increase by low single digits, on a percentage basis; and |
| | The effective tax rate to be approximately 25% to 26%, absent any tax reform. |
In 2017, we expect quarterly other noninterest income to be between $250 million to $275 million, excluding debt securities gains and net Visa activity.
For the first quarter of 2017 compared to the fourth quarter of 2016, we expect:
| | Modest loan growth; |
| | Stable net interest income; |
| | Fee income to decrease by mid-single digits, on a percentage basis, mainly attributable to seasonality and lower first quarter client activity. Fee income consists of asset management, consumer services, corporate services, residential mortgage and service charges on deposits; |
| | Provision for credit losses to be between $75 million and $125 million; and |
| | Noninterest expense to decrease by low single digits, on a percentage basis. |
CONSOLIDATED INCOME STATEMENT REVIEW
Our Consolidated Income Statement is presented in Item 8 of this Report.
Net income for 2016 was $4.0 billion, or $7.30 per diluted common share, a decrease of 4% compared with $4.1 billion, or $7.39 per diluted common share, for 2015. The decrease was driven by higher provision for credit losses and a 3% decline in noninterest income, partially offset by 1% increase in net interest income.
3
Net Interest Income
| Table 1: Summarized Average Balances and Net Interest Income (a) | ||||||||||||||||||||||||
| 2016 | 2015 | |||||||||||||||||||||||
| Year Ended December 31 Dollars in millions |
Average Balances |
Average Yields/Rates |
Interest Income/ Expense |
Average Balances |
Average Yields/Rates |
Interest Income/ Expense |
||||||||||||||||||
| Assets |
||||||||||||||||||||||||
| Interest-earning assets |
||||||||||||||||||||||||
| Investment securities |
$ | 72,046 | 2.62 | % | $ | 1,889 | $ | 61,665 | 2.83 | % | $ | 1,744 | ||||||||||||
| Loans |
208,817 | 3.61 | % | 7,543 | 205,349 | 3.57 | % | 7,333 | ||||||||||||||||
| Interest-earning deposits with banks |
26,328 | .52 | % | 136 | 32,908 | .26 | % | 86 | ||||||||||||||||
| Other |
7,843 | 3.56 | % | 279 | 8,903 | 4.00 | % | 356 | ||||||||||||||||
|
|
|
|
|
|
|
|
|
|||||||||||||||||
| Total interest-earning assets/interest income |
$ | 315,034 | 3.13 | % | 9,847 | $ | 308,825 | 3.08 | % | 9,519 | ||||||||||||||
|
|
|
|
|
|
|
|
|
|||||||||||||||||
| Liabilities |
||||||||||||||||||||||||
| Interest-bearing liabilities |
||||||||||||||||||||||||
| Interest-bearing deposits |
$ | 172,764 | .25 | % | 430 | $ | 163,965 | .25 | % | 403 | ||||||||||||||
| Borrowed funds |
52,939 | 1.57 | % | 831 | 56,513 | 1.14 | % | 642 | ||||||||||||||||
|
|
|
|
|
|
|
|
|
|||||||||||||||||
| Total interest-bearing liabilities/interest expense |
$ | 225,703 | .56 | % | 1,261 | $ | 220,478 | .47 | % | 1,045 | ||||||||||||||
|
|
|
|
|
|
|
|
|
|
|
|
|
|||||||||||||
| Net interest income/margin (Non-GAAP) |
2.73 | % | 8,586 | 2.74 | % | 8,474 | ||||||||||||||||||
| Taxable-equivalent adjustments |
(195 | ) | (196 | ) | ||||||||||||||||||||
|
|
|
|
|
|||||||||||||||||||||
| Net interest income (GAAP) |
$ | 8,391 | $ | 8,278 | ||||||||||||||||||||
|
|
|
|
|
|||||||||||||||||||||
| (a) | Interest income calculated as taxable-equivalent interest income. The interest income earned on certain earning assets is completely or partially exempt from federal income tax. To provide more meaningful comparisons of interest income and yields for all interest-earning assets, as well as net interest margins, we use interest income on a taxable-equivalent basis in calculating average yields and net interest margins by increasing the interest income earned on tax-exempt assets to make it fully equivalent to interest income earned on taxable investments. This adjustment is not permitted under GAAP on the Consolidated Income Statement. For more information, see the Statistical Information (Unaudited) section in Item 8 of this Report. |
Changes in net interest income and margin result from the interaction of the volume and composition of interest-earning assets and related yields, interest-bearing liabilities and related rates paid, and noninterest-bearing sources of funding. See the Statistical Information (Unaudited) - Average Consolidated Balance Sheet And Net Interest Analysis and Analysis Of Year-To-Year Changes In Net Interest Income in Item 8 of this Report.
Net interest income increased $113 million, or 1%, in 2016 compared with 2015 due to increases in loan and securities balances and higher loan yields, partially offset by an increase in borrowing costs and lower securities yields.
Average investment securities increased due to higher average agency residential mortgage-backed securities and U.S. Treasury and government agency securities, partially offset by a decrease in average non-agency residential mortgage-backed securities. Total investment securities increased to 23% of average interest-earning assets in 2016 compared to 20% in 2015.
The increase in average loans was driven by growth in average commercial real estate loans of $3.6 billion and average commercial loans of $2.2 billion, partially offset by a decrease in consumer loans of $2.6 billion. The decline in consumer loans was primarily attributable to declines in certain run-off consumer loan portfolios. Loans represented 66% of average interest-earning assets in 2016 and 2015.
Average interest-bearing deposits increased $8.8 billion primarily due to higher average savings deposits, which largely reflected a shift from money market deposits to relationship-based savings products, as well as higher average interest-bearing demand deposits. Average interest-bearing deposits increased to 77% of average interest-bearing liabilities in 2016 compared to 74% in 2015.
4
Noninterest Income
Table 2: Noninterest Income
| Year ended December 31 | Change | |||||||||||||||
| Dollars in millions |
2016 | 2015 | $ | % | ||||||||||||
| Noninterest income |
||||||||||||||||
| Asset management |
$ | 1,521 | $ | 1,567 | $ | (46 | ) | (3 | )% | |||||||
| Consumer services |
1,388 | 1,335 | 53 | 4 | % | |||||||||||
| Corporate services |
1,504 | 1,491 | 13 | 1 | % | |||||||||||
| Residential mortgage |
567 | 566 | 1 | | ||||||||||||
| Service charges on deposits |
667 | 651 | 16 | 2 | % | |||||||||||
| Other |
1,124 | 1,337 | (213 | ) | (16 | )% | ||||||||||
|
|
|
|
|
|
|
|||||||||||
| Total noninterest income |
$ | 6,771 | $ | 6,947 | $ | (176 | ) | (3 | )% | |||||||
|
|
|
|
|
|
|
|||||||||||
Noninterest income as a percentage of total revenue was 45% for 2016 and 46% for 2015.
Asset management revenue decreased mainly due to lower earnings from BlackRock and the impact from a $30 million trust settlement in 2015 in our asset management business segment. Discretionary client assets under management in the Asset Management Group were $137 billion at December 31, 2016 compared with $134 billion at December 31, 2015.
Consumer service fees increased primarily from growth in payment-related products including debit card and credit card, as well as higher brokerage fees.
Corporate service fees increased reflecting higher treasury management fees and a higher benefit from commercial mortgage servicing rights valuation, net of economic hedge, partially offset by lower merger and acquisition advisory fees.
Other noninterest income decreased primarily attributable to the impact of lower net gains on sales of Visa Class B common shares and lower revenue from private equity investments. Net gains on the sale of Visa shares for 2016 were $32 million compared with $166 million in 2015. Net gains on Visa sales include derivative fair value adjustments related to swap agreements with purchasers of Visa shares in connection with all prior sales to date.
Other noninterest income typically fluctuates from period to period depending on the nature and magnitude of transactions completed. Further details regarding our customer-related trading activities are included in the Market Risk Management Customer-Related Trading Risk portion of the Risk Management section of this Item 7. Further details regarding private and other equity investments are included in the Market Risk Management Equity and Other Investment Risk section, and further details regarding gains or losses related to our equity investment in BlackRock are included in the Business Segments Review section of this Item 7.
Provision for Credit Losses
The provision for credit losses increased to $433 million in 2016 compared with $255 million in 2015, primarily attributable to a higher provision for energy related loans in the oil, gas, and coal sectors. Additionally, overall credit portfolio performance and loan growth contributed to the higher provision.
The Credit Risk Management portion of the Risk Management section of this Item 7 includes additional information regarding factors impacting the provision for credit losses.
Noninterest Expense
Table 3: Noninterest Expense
| Year ended December 31 | Change | |||||||||||||||
| Dollars in millions |
2016 | 2015 | $ | % | ||||||||||||
| Noninterest expense |
||||||||||||||||
| Personnel |
$ | 4,841 | $ | 4,831 | $ | 10 | | |||||||||
| Occupancy |
861 | 842 | 19 | 2 | % | |||||||||||
| Equipment |
974 | 925 | 49 | 5 | % | |||||||||||
| Marketing |
247 | 249 | (2 | ) | (1 | )% | ||||||||||
| Other |
2,553 | 2,616 | (63 | ) | (2 | )% | ||||||||||
|
|
|
|
|
|
|
|||||||||||
| Total noninterest expense |
$ | 9,476 | $ | 9,463 | $ | 13 | | |||||||||
|
|
|
|
|
|
|
|||||||||||
5
Noninterest expense increased slightly in the comparison to the prior year as we continued to focus on disciplined expense management. The increase reflected higher 2016 contributions to the PNC Foundation, a new FDIC deposit insurance surcharge and investments in technology and business infrastructure mostly offset by net lower contingency accruals.
During 2016, we completed actions and achieved our 2016 continuous improvement program savings goal of $400 million, which largely funded our investments in technology and business infrastructure. In 2017, we have a goal of $350 million in cost savings through our continuous improvement program, which we expect will substantially fund our 2017 business and technology investments.
Effective Income Tax Rate
The effective income tax rate was 24.1% for 2016 compared with 24.8% for 2015. The effective tax rate is generally lower than the statutory rate primarily due to tax credits we receive from our investments in low income housing and new markets investments, as well as earnings in other tax exempt investments. The decline in the comparison reflected the tax favorability of the 2016 PNC Foundation contributions.
CONSOLIDATED BALANCE SHEET REVIEW
Table 4: Summarized Balance Sheet Data
| December 31 | December 31 | Change | ||||||||||||||
| Dollars in millions |
2016 | 2015 | $ | % | ||||||||||||
| Assets |
||||||||||||||||
| Interest-earning deposits with banks |
$ | 25,711 | $ | 30,546 | $ | (4,835 | ) | (16 | )% | |||||||
| Loans held for sale |
2,504 | 1,540 | 964 | 63 | % | |||||||||||
| Investment securities |
75,947 | 70,528 | 5,419 | 8 | % | |||||||||||
| Loans |
210,833 | 206,696 | 4,137 | 2 | % | |||||||||||
| Allowance for loan and lease losses |
(2,589 | ) | (2,727 | ) | 138 | 5 | % | |||||||||
| Mortgage servicing rights |
1,758 | 1,589 | 169 | 11 | % | |||||||||||
| Goodwill |
9,103 | 9,103 | | | ||||||||||||
| Other, net |
43,113 | 41,218 | 1,895 | 5 | % | |||||||||||
|
|
|
|
|
|
|
|||||||||||
| Total assets |
$ | 366,380 | $ | 358,493 | $ | 7,887 | 2 | % | ||||||||
| Liabilities |
||||||||||||||||
| Deposits |
$ | 257,164 | $ | 249,002 | $ | 8,162 | 3 | % | ||||||||
| Borrowed funds |
52,706 | 54,532 | (1,826 | ) | (3 | )% | ||||||||||
| Other |
9,656 | 8,979 | 677 | 8 | % | |||||||||||
|
|
|
|
|
|
|
|||||||||||
| Total liabilities |
319,526 | 312,513 | 7,013 | 2 | % | |||||||||||
| Equity |
||||||||||||||||
| Total shareholders equity |
45,699 | 44,710 | 989 | 2 | % | |||||||||||
| Noncontrolling interests |
1,155 | 1,270 | (115 | ) | (9 | )% | ||||||||||
|
|
|
|
|
|
|
|||||||||||
| Total equity |
46,854 | 45,980 | 874 | 2 | % | |||||||||||
|
|
|
|
|
|
|
|||||||||||
| Total liabilities and equity |
$ | 366,380 | $ | 358,493 | $ | 7,887 | 2 | % | ||||||||
|
|
|
|
|
|
|
|||||||||||
The summarized balance sheet data in Table 4 is based upon our Consolidated Balance Sheet in Item 8 of this Report.
Our balance sheet reflected asset growth compared to December 31, 2015 and we maintained strong liquidity and capital positions at December 31, 2016.
| | Total assets increased primarily due to higher investment securities and loan balances, partially offset by lower interest-earning deposits with banks. |
| | Higher total liabilities were driven by deposit growth. |
| | The increase to total equity reflected increased retained earnings driven by net income, partially offset by share repurchases. |
The following discussion provides additional information about the major components of our balance sheet. Information regarding our capital and regulatory compliance is included in the Liquidity and Capital Management portion of the Risk Management section of this Item 7 and in Note 18 Regulatory Matters in our Notes To Consolidated Financial Statements included in this Report.
6
Loans
Table 5: Details of Loans
| December 31 | December 31 | Change | ||||||||||||||
| Dollars in millions |
2016 | 2015 | $ | % | ||||||||||||
| Commercial lending |
||||||||||||||||
| Commercial |
||||||||||||||||
| Manufacturing |
$ | 18,891 | $ | 19,014 | $ | (123 | ) | (1 | )% | |||||||
| Retail/wholesale trade |
16,752 | 16,661 | 91 | 1 | % | |||||||||||
| Service providers |
14,707 | 13,970 | 737 | 5 | % | |||||||||||
| Real estate related (a) |
11,920 | 11,659 | 261 | 2 | % | |||||||||||
| Health care |
9,491 | 9,210 | 281 | 3 | % | |||||||||||
| Financial services |
7,241 | 7,234 | 7 | | ||||||||||||
| Other industries |
22,362 | 20,860 | 1,502 | 7 | % | |||||||||||
|
|
|
|
|
|
|
|||||||||||
| Total commercial |
101,364 | 98,608 | 2,756 | 3 | % | |||||||||||
|
|
|
|
|
|
|
|||||||||||
| Commercial real estate |
29,010 | 27,468 | 1,542 | 6 | % | |||||||||||
| Equipment lease financing |
7,581 | 7,468 | 113 | 2 | % | |||||||||||
|
|
|
|
|
|
|
|||||||||||
| Total commercial lending |
137,955 | 133,544 | 4,411 | 3 | % | |||||||||||
|
|
|
|
|
|
|
|||||||||||
| Consumer lending |
||||||||||||||||
| Home equity |
29,949 | 32,133 | (2,184 | ) | (7 | )% | ||||||||||
| Residential real estate |
15,598 | 14,411 | 1,187 | 8 | % | |||||||||||
| Credit card |
5,282 | 4,862 | 420 | 9 | % | |||||||||||
| Other consumer |
||||||||||||||||
| Automobile |
12,380 | 11,157 | 1,223 | 11 | % | |||||||||||
| Education |
5,159 | 5,881 | (722 | ) | (12 | )% | ||||||||||
| Other |
4,510 | 4,708 | (198 | ) | (4 | )% | ||||||||||
|
|
|
|
|
|
|
|||||||||||
| Total consumer lending |
72,878 | 73,152 | (274 | ) | | |||||||||||
|
|
|
|
|
|
|
|||||||||||
| Total loans |
$ | 210,833 | $ | 206,696 | $ | 4,137 | 2 | % | ||||||||
|
|
|
|
|
|
|
|||||||||||
| (a) | Includes loans to customers in the real estate and construction industries. |
Loan growth was the result of an increase in total commercial lending from higher commercial and commercial real estate loans. Consumer lending declined due to lower home equity and education loans, partially offset by higher automobile loans, residential real estate loans and credit cards.
See the Credit Risk Management portion of the Risk Management section of this Item 7 and Note 1 Accounting Policies, Note 3 Asset Quality and Note 4 Allowances for Loan and Lease Losses in our Notes To Consolidated Financial Statements included in Item 8 of this Report for additional information regarding our loan portfolio.
7
Investment Securities
Table 6: Investment Securities
| December 31, 2016 | December 31, 2015 | Ratings (a) As of December 31, 2016 | ||||||||||||||||||||||||||||||||||
| Dollars in millions |
Amortized Cost |
Fair Value | Amortized Cost |
Fair Value |
AAA/ AA |
A | BBB | BB and Lower |
No Rating |
|||||||||||||||||||||||||||
| U.S. Treasury and government agencies |
$ | 13,627 | $ | 13,714 | $ | 10,022 | $ | 10,172 | 100 | % | ||||||||||||||||||||||||||
| Agency residential mortgage-backed |
37,319 | 37,109 | 34,250 | 34,408 | 100 | |||||||||||||||||||||||||||||||
| Non-agency residential mortgage-backed |
3,382 | 3,564 | 4,225 | 4,392 | 11 | 4 | % | 76 | % | 9 | % | |||||||||||||||||||||||||
| Agency commercial mortgage-backed |
3,053 | 3,046 | 3,045 | 3,086 | 100 | |||||||||||||||||||||||||||||||
| Non-agency commercial mortgage-backed (b) |
4,590 | 4,602 | 5,624 | 5,630 | 82 | 6 | % | 2 | 1 | 9 | ||||||||||||||||||||||||||
| Asset-backed (c) |
6,496 | 6,524 | 6,134 | 6,130 | 84 | 5 | 3 | 7 | 1 | |||||||||||||||||||||||||||
| Other debt (d) |
6,679 | 6,810 | 6,147 | 6,355 | 73 | 16 | 7 | 1 | 3 | |||||||||||||||||||||||||||
| Corporate stock and other |
603 | 601 | 590 | 589 | 100 | |||||||||||||||||||||||||||||||
|
|
|
|
|
|
|
|
|
|
|
|
|
|
|
|
|
|
|
|||||||||||||||||||
| Total investment securities (e) |
$ | 75,749 | $ | 75,970 | $ | 70,037 | $ | 70,762 | 91 | % | 2 | % | 1 | % | 4 | % | 2 | % | ||||||||||||||||||
|
|
|
|
|
|
|
|
|
|
|
|
|
|
|
|
|
|
|
|||||||||||||||||||
| (a) | Ratings percentages allocated based on amortized cost. |
| (b) | Collateralized primarily by retail properties, office buildings, lodging properties and multi-family housing. |
| (c) | Collateralized primarily by corporate debt, government guaranteed education loans and other consumer credit products. |
| (d) | Includes state and municipal securities. |
| (e) | Includes available for sale and held to maturity securities. |
Investment securities increased $5.4 billion at December 31, 2016 compared to December 31, 2015. Growth in investment securities was driven by net purchases of U.S. Treasury and government agencies and agency residential mortgage-backed securities, partially offset by prepayments of non-agency commercial mortgage-backed and non-agency residential mortgage-backed securities.
Table 6 presents the distribution of our investment securities portfolio by credit rating. We have included credit ratings information because we believe that the information is an indicator of the degree of credit risk to which we are exposed, which could affect our risk-weighted assets and, therefore, our risk-based regulatory capital ratios under the regulatory capital rules. Changes in credit ratings classifications could indicate increased or decreased credit risk and could be accompanied by a reduction or increase in the fair value of our investment securities portfolio.
At least quarterly, we conduct a comprehensive security-level impairment assessment on all securities. If economic conditions, including home prices, were to deteriorate from current levels, and if market volatility and liquidity were to deteriorate from current levels, or if market interest rates were to increase or credit spreads were to widen appreciably, the valuation of our investment securities portfolio would likely be adversely affected and we could incur additional OTTI credit losses that would impact our Consolidated Income Statement.
The duration of investment securities was 3.0 years at December 31, 2016. We estimate that at December 31, 2016 the effective duration of investment securities was 3.1 years for an immediate 50 basis points parallel increase in interest rates and 2.9 years for an immediate 50 basis points parallel decrease in interest rates. Comparable amounts at December 31, 2015 for the effective duration of investment securities were 2.8 years and 2.6 years, respectively.
Based on expected prepayment speeds, the weighted-average expected maturity of the investment securities portfolio (excluding corporate stock and other) was 5.0 years at December 31, 2016 compared to 4.8 years at December 31, 2015.
Table 7: Weighted-Average Expected Maturities of Mortgage and Other Asset-Backed Debt Securities
| December 31, 2016 |
Years | |||
| Agency residential mortgage-backed |
5.2 | |||
| Non-agency residential mortgage-backed |
5.8 | |||
| Agency commercial mortgage-backed |
3.5 | |||
| Non-agency commercial mortgage-backed |
3.5 | |||
| Asset-backed |
2.5 | |||
Additional information regarding our investment securities is included in Note 5 Investment Securities and Note 6 Fair Value in the Notes To Consolidated Financial Statements included in this Report.
8
Funding Sources
Table 8: Details of Funding Sources
| December 31 | December 31 | Change | ||||||||||||||
| Dollars in millions |
2016 | 2015 | $ | % | ||||||||||||
| Deposits |
||||||||||||||||
| Money market |
$ | 105,849 | $ | 118,079 | $ | (12,230 | ) | (10 | )% | |||||||
| Demand |
96,799 | 90,038 | 6,761 | 8 | % | |||||||||||
| Savings |
36,956 | 20,375 | 16,581 | 81 | % | |||||||||||
| Time deposits |
17,560 | 20,510 | (2,950 | ) | (14 | )% | ||||||||||
|
|
|
|
|
|
|
|||||||||||
| Total deposits |
257,164 | 249,002 | 8,162 | 3 | % | |||||||||||
|
|
|
|
|
|
|
|||||||||||
| Borrowed funds |
||||||||||||||||
| FHLB borrowings |
17,549 | 20,108 | (2,559 | ) | (13 | )% | ||||||||||
| Bank notes and senior debt |
22,972 | 21,298 | 1,674 | 8 | % | |||||||||||
| Subordinated debt |
8,009 | 8,556 | (547 | ) | (6 | )% | ||||||||||
| Other |
4,176 | 4,570 | (394 | ) | (9 | )% | ||||||||||
|
|
|
|
|
|
|
|||||||||||
| Total borrowed funds |
52,706 | 54,532 | (1,826 | ) | (3 | )% | ||||||||||
|
|
|
|
|
|
|
|||||||||||
| Total funding sources |
$ | 309,870 | $ | 303,534 | $ | 6,336 | 2 | % | ||||||||
|
|
|
|
|
|
|
|||||||||||
Total deposits increased in the comparison mainly due to strong growth in demand and savings deposits which reflected in part a shift from money market deposits to relationship-based savings products. Total borrowed funds decreased in the comparison due to maturities of FHLB borrowings, partially offset by higher bank notes and senior debt.
See the Liquidity and Capital Management portion of the Risk Management section of this Item 7 for additional information regarding our 2016 capital and liquidity activities.
Shareholders Equity
Total shareholders equity as of December 31, 2016 grew $1.0 billion compared to December 31, 2015 due to an increase in retained earnings and higher capital surplus, which included the issuance of Series S preferred stock, partially offset by common share repurchases of $2.0 billion and a decrease in accumulated other comprehensive income primarily related to net unrealized securities losses. The growth in retained earnings resulted from 2016 net income of $4.0 billion, reduced by $1.3 billion of common and preferred dividends declared. Common shares outstanding were 485 million and 504 million at December 31, 2016, and December 31, 2015, respectively, reflecting repurchases of 22.8 million shares during 2016.
BUSINESS SEGMENTS REVIEW
Effective for the first quarter of 2017, as a result of changes to how we manage our businesses, we realigned our segments and, accordingly, have changed the basis of presentation of our segments, resulting in four reportable business segments:
| | Retail Banking |
| | Corporate & Institutional Banking |
| | Asset Management Group |
| | BlackRock |
Our changes in business segment presentation resulting from the realignment included the following:
| | The Residential Mortgage Banking segment was combined into Retail Banking as a result of our strategic initiative to transform the home lending process by integrating mortgage and home equity lending to enhance product capability and speed of delivery for a better customer experience and to improve efficiency. In conjunction with this shift, residential mortgages previously reported within the Other category were also moved to Retail Banking. |
| | The Non-Strategic Assets Portfolio segment was eliminated. The segments remaining consumer assets were moved to the Other category as they are unrelated to the ongoing strategy of any segment, while its commercial assets were transferred to Corporate & Institutional Banking in order to continue the relationships we have with those customers. |
| | A portion of business banking clients was moved from Retail Banking to Corporate & Institutional Banking to facilitate enhanced product offerings to meet the financial needs of our business banking clients. |
Net interest income in business segment results reflects our internal funds transfer pricing methodology. Assets receive a funding charge and liabilities and capital receive a funding credit based on a transfer pricing methodology that incorporates product repricing characteristics, tenor and other factors. Effective for the first quarter of 2017, we made certain adjustments to our internal funds transfer pricing methodology primarily relating to weighted average lives of certain non-maturity deposits based on our recent historical experience. These changes in methodology affected business segment results, primarily adversely impacting net interest income for Corporate & Institutional Banking and Retail Banking, offset by increased net interest income in the Other category.
9
All periods presented were revised to conform to the new segment alignment and to our change in internal funds transfer pricing methodology.
Business segment results and a description of each business are included in Note 22 Segment Reporting included in the Notes To Consolidated Financial Statements in Item 8 of this Report. Certain amounts included in this Business Segments Review differ from those amounts shown in Note 22, primarily due to the presentation in this Item 7 of business net interest revenue on a taxable-equivalent basis. Note 22 presents results of businesses for 2016, 2015 and 2014.
Total business segment financial results differ from total consolidated net income. The impact of these differences is reflected in the Other category in the business segment tables. Other includes residual activities that do not meet the criteria for disclosure as a separate reportable business, such as gains or losses related to BlackRock transactions, integration costs, asset and liability management activities including net securities gains or losses, other-than-temporary impairment of investment securities and certain trading activities, exited businesses, certain non-strategic runoff consumer loan portfolios, private equity investments, intercompany eliminations, most corporate overhead, tax adjustments that are not allocated to business segments and differences between business segment performance reporting and financial statement reporting (GAAP), including the presentation of net income attributable to noncontrolling interests as the segments results exclude their portion of net income attributable to noncontrolling interests.
Retail Banking (Unaudited)
Table 9: Retail Banking Table
| Year ended December 31 | Change | |||||||||||||||
| Dollars in millions, except as noted |
2016 | 2015 | $ | % | ||||||||||||
| Income Statement |
||||||||||||||||
| Net interest income |
$ | 4,511 | $ | 4,308 | $ | 203 | 5 | % | ||||||||
| Noninterest income |
2,693 | 2,781 | (88 | ) | (3 | )% | ||||||||||
|
|
|
|
|
|
|
|||||||||||
| Total revenue |
7,204 | 7,089 | 115 | 2 | % | |||||||||||
| Provision for credit losses |
297 | 253 | 44 | 17 | % | |||||||||||
| Noninterest expense |
5,291 | 5,444 | (153 | ) | (3 | )% | ||||||||||
|
|
|
|
|
|
|
|||||||||||
| Pretax earnings |
1,616 | 1,392 | 224 | 16 | % | |||||||||||
| Income taxes |
593 | 508 | 85 | 17 | % | |||||||||||
|
|
|
|
|
|
|
|||||||||||
| Earnings |
$ | 1,023 | $ | 884 | $ | 139 | 16 | % | ||||||||
|
|
|
|
|
|
|
|
|
|||||||||
| Average Balance Sheet |
||||||||||||||||
| Loans held for sale |
$ | 942 | $ | 1,111 | $ | (169 | ) | (15 | )% | |||||||
| Loans |
||||||||||||||||
| Consumer |
||||||||||||||||
| Home equity |
$ | 26,204 | $ | 27,657 | $ | (1,453 | ) | (5 | )% | |||||||
| Automobile |
11,248 | 10,433 | 815 | 8 | % | |||||||||||
| Education |
5,562 | 6,307 | (745 | ) | (12 | )% | ||||||||||
| Credit cards |
4,889 | 4,527 | 362 | 8 | % | |||||||||||
| Other |
1,789 | 1,881 | (92 | ) | (5 | )% | ||||||||||
|
|
|
|
|
|
|
|||||||||||
| Total consumer |
49,692 | 50,805 | (1,113 | ) | (2 | )% | ||||||||||
| Commercial and commercial real estate |
11,410 | 12,011 | (601 | ) | (5 | )% | ||||||||||
| Residential mortgage |
10,682 | 9,618 | 1,064 | 11 | % | |||||||||||
|
|
|
|
|
|
|
|||||||||||
| Total loans |
$ | 71,784 | $ | 72,434 | $ | (650 | ) | (1 | )% | |||||||
| Total assets |
$ | 85,871 | $ | 86,977 | $ | (1,106 | ) | (1 | )% | |||||||
|
|
|
|
|
|
|
|
|
|||||||||
| Deposits |
||||||||||||||||
| Noninterest-bearing demand |
$ | 28,364 | $ | 25,106 | $ | 3,258 | 13 | % | ||||||||
| Interest-bearing demand |
38,584 | 36,005 | 2,579 | 7 | % | |||||||||||
| Money market |
44,855 | 53,520 | (8,665 | ) | (16 | )% | ||||||||||
| Savings |
27,340 | 14,358 | 12,982 | 90 | % | |||||||||||
| Certificates of deposit |
14,770 | 16,488 | (1,718 | ) | (10 | )% | ||||||||||
|
|
|
|
|
|
|
|||||||||||
| Total deposits |
$ | 153,913 | $ | 145,477 | $ | 8,436 | 6 | % | ||||||||
|
|
|
|
|
|
|
|||||||||||
| Performance Ratios |
||||||||||||||||
| Return on average assets |
1.19 | % | 1.02 | % | ||||||||||||
| Noninterest income to total revenue |
37 | % | 39 | % | ||||||||||||
| Efficiency |
73 | % | 77 | % | ||||||||||||
|
|
|
|
|
|||||||||||||
10
| Change | ||||||||||||||||
| Dollars in millions, except as noted |
2016 | 2015 | $ | % | ||||||||||||
| Supplemental Noninterest Income Information |
|
|||||||||||||||
| Consumer services |
$ | 1,061 | $ | 1,015 | $ | 46 | 5 | % | ||||||||
| Brokerage |
$ | 295 | $ | 284 | $ | 11 | 4 | % | ||||||||
| Residential mortgage |
$ | 567 | $ | 566 | $ | 1 | | |||||||||
| Service charges on deposits |
$ | 639 | $ | 623 | $ | 16 | 3 | % | ||||||||
|
|
|
|
|
|
|
|||||||||||
| Residential Mortgage Information |
||||||||||||||||
| Residential mortgage servicing statistics (in billions, except as noted) (a) |
||||||||||||||||
| Serviced portfolio balance (b) |
$ | 125 | $ | 123 | $ | 2 | 2 | % | ||||||||
| Serviced portfolio acquisitions |
$ | 19 | $ | 29 | $ | (10 | ) | (34 | )% | |||||||
| MSR asset value (b) |
$ | 1.2 | $ | 1.1 | $ | .1 | 9 | % | ||||||||
| MSR capitalization value (in basis points) (b) |
94 | 86 | 8 | 9 | % | |||||||||||
| Servicing income: (in millions) |
||||||||||||||||
| Servicing fees, net (c) |
$ | 192 | $ | 178 | $ | 14 | 8 | % | ||||||||
| Mortgage servicing rights valuation, net of economic hedge |
$ | 92 | $ | 89 | $ | 3 | 3 | % | ||||||||
| Residential mortgage loan statistics |
||||||||||||||||
| Loan origination volume (in billions) |
$ | 10.6 | $ | 10.5 | $ | .1 | 1 | % | ||||||||
| Loan sale margin percentage |
3.17 | % | 3.32 | % | ||||||||||||
| Percentage of originations represented by: |
||||||||||||||||
| Purchase volume (d) |
40 | % | 45 | % | ||||||||||||
| Refinance volume |
60 | % | 55 | % | ||||||||||||
|
|
|
|
|
|||||||||||||
| Other Information (b) |
||||||||||||||||
| Customer-related statistics (average) |
||||||||||||||||
| Non-teller deposit transactions (e) |
49 | % | 43 | % | ||||||||||||
| Digital consumer customers (f) |
58 | % | 52 | % | ||||||||||||
| Credit-related statistics |
||||||||||||||||
| Nonperforming assets (g) |
$ | 1,257 | $ | 1,325 | $ | (68 | ) | (5 | )% | |||||||
| Net charge-offs |
$ | 351 | $ | 347 | $ | 4 | 1 | % | ||||||||
| Other statistics |
||||||||||||||||
| ATMs |
9,024 | 8,956 | 68 | 1 | % | |||||||||||
| Branches (h) |
2,520 | 2,616 | (96 | ) | (4 | )% | ||||||||||
| Universal branches (i) |
526 | 359 | 167 | 47 | % | |||||||||||
| Brokerage account client assets (in billions) (j) |
$ | 44 | $ | 43 | $ | 1 | 2 | % | ||||||||
|
|
|
|
|
|
|
|||||||||||
| (a) | Represents mortgage loan servicing balances for third parties and the related income. |
| (b) | Presented as of December 31, except for customer-related statistics, which are averages for the year ended, and net charge-offs, which are for the year ended. |
| (c) | Servicing fees net of impact of decrease in MSR value due to passage of time, including the impact from both regularly scheduled loan prepayments and loans that were paid down or paid off during the period. |
| (d) | Mortgages with borrowers as part of residential real estate purchase transactions. |
| (e) | Percentage of total consumer and business banking deposit transactions processed at an ATM or through our mobile banking application. |
| (f) | Represents consumer checking relationships that process the majority of their transactions through non-teller channels. |
| (g) | Includes nonperforming loans of $1.2 billion at both December 31, 2016 and December 31, 2015. |
| (h) | Excludes stand-alone mortgage offices and satellite offices (e.g., drive-ups, electronic branches and retirement centers) that provide limited products and/or services. |
| (i) | Included in total branches, represents branches operating under our Universal model. |
| (j) | Includes cash and money market balances. |
11
Retail Banking earned $1.0 billion in 2016 compared with $884 million for 2015. The increase in earnings was driven by higher net interest income and a decrease in noninterest expense, partially offset by lower noninterest income and increased provision for credit losses.
Net interest income increased in 2016 compared to 2015 due to growth in deposit balances and improved interest rate spread on the value of deposits, partially offset by lower loan balances and interest rate spread compression on the value of loans.
The decline in noninterest income compared to the prior year reflected the impact of lower net gains on sales of Visa Class B common shares in 2016 of $32 million compared with net gains of $166 million in 2015. Net gains on Visa sales include derivative fair value adjustments related to swap agreements with purchasers of Visa Class B common shares in connection with all prior sales to date.
Other forms of noninterest income grew in the comparison, reflecting execution on our strategy to provide diverse product and service offerings. Higher transaction volumes in 2016 contributed to consumer service fee growth from payment-related products, specifically in debit and credit card, as well as increased service charges on deposits and brokerage fees.
The decline in noninterest expense in the comparison was due to lower legal reserves, a decrease in personnel expense, lower residential mortgage foreclosure-related expense, lower marketing expense, and reduced branch network expenses as a result of network transformation and transaction migration to lower cost digital and ATM channels.
Provision for credit losses increased compared to 2015, reflecting overall credit portfolio performance.
The deposit strategy of Retail Banking is to remain disciplined on pricing and focused on growing and retaining relationship-based balances, executing on market specific deposit growth strategies, and providing a source of low-cost funding and liquidity to PNC. In 2016, average total deposits increased compared to 2015, driven by growth in savings deposits reflecting in part a shift from money market deposits to relationship-based savings products. Additionally, demand deposit categories increased, partially offset by a decline in certificates of deposit due to the net runoff of maturing accounts.
Retail Banking continued to focus on a relationship-based lending strategy. The decrease in average total loans in 2016 compared to 2015 was due to a decline in home equity and commercial loans, as well as runoff of certain portions of the portfolios, as more fully described below.
| | Average home equity loans decreased as pay-downs and payoffs on loans exceeded new originated volume. Retail Bankings home equity loan portfolio is relationship based, with over 97% of the portfolio attributable to borrowers in our primary geographic footprint. The weighted-average updated FICO scores for this portfolio were 746 at December 31, 2016 and 752 at December 31, 2015. |
| | Average commercial and commercial real estate loans declined as pay-downs and payoffs on loans exceeded new volume. |
| | Average residential mortgages increased as a result of new volumes exceeding portfolio liquidations. |
| | Average automobile loans, which consisted of both direct and indirect auto loans, increased primarily due to portfolio growth in previously underpenetrated markets. |
| | Average credit card balances increased as a result of organic growth. |
| | In 2016, average loan balances for the education and other loan portfolios declined $837 million, or 10%, compared to 2015, driven by declines in the government guaranteed education and indirect other portfolios, which are primarily runoff portfolios. |
Nonperforming assets decreased compared to December 31, 2015 driven by declines in both consumer and commercial nonperforming loans.
Retail Banking continues to enhance the customer experience with refinements to product offerings that drive product value for consumers and small businesses. We are focused on meeting the financial needs of our customers by providing a broad range of liquidity, banking and investment products.
Retail Banking continued to focus on the strategic priority of transforming the customer experience through transaction migration, branch network transformation, home lending transformation, and multi-channel engagement and service strategies.
| | In 2016, approximately 58% of consumer customers used non-teller channels for the majority of their transactions compared with 52% for 2015. |
| | Deposit transactions via ATM and mobile channels increased to 49% of total deposit transactions in 2016 compared with 43% for 2015. |
| | We had a network of 2,520 branches and 9,024 ATMs at December 31, 2016. Approximately 21% of the branch network operates under the universal model. |
| | Instant debit card issuance, which enables us to print a customers debit card in minutes, was available in 2,207 branches, or 88% of the branch network, as of December 31, 2016. |
| | Mortgage loan originations increased 1% compared to 2015. Loans continue to be originated primarily through direct channels under Federal National Mortgage Association (FNMA), Federal Home Loan Mortgage Corporation (FHLMC) and Federal Housing Administration (FHA)/Department of Veterans Affairs agency guidelines. |
12
Corporate & Institutional Banking (Unaudited)
Table 10: Corporate & Institutional Banking Table
| Year ended December 31 | Change | |||||||||||||||
| Dollars in millions, except as noted |
2016 | 2015 | $ | % | ||||||||||||
| Income Statement |
||||||||||||||||
| Net interest income |
$ | 3,312 | $ | 3,274 | $ | 38 | 1 | % | ||||||||
| Noninterest income |
2,035 | 1,947 | 88 | 5 | % | |||||||||||
|
|
|
|
|
|
|
|||||||||||
| Total revenue |
5,347 | 5,221 | 126 | 2 | % | |||||||||||
| Provision for credit losses |
177 | 78 | 99 | 127 | % | |||||||||||
| Noninterest expense |
2,222 | 2,187 | 35 | 2 | % | |||||||||||
|
|
|
|
|
|
|
|||||||||||
| Pretax earnings |
2,948 | 2,956 | (8 | ) | | |||||||||||
| Income taxes |
1,039 | 1,064 | (25 | ) | (2 | )% | ||||||||||
|
|
|
|
|
|||||||||||||
| Earnings |
$ | 1,909 | $ | 1,892 | $ | 17 | 1 | % | ||||||||
|
|
|
|
|
|
|
|||||||||||
| Average Balance Sheet |
||||||||||||||||
| Loans held for sale |
$ | 868 | $ | 966 | $ | (98 | ) | (10 | )% | |||||||
| Loans |
||||||||||||||||
| Commercial |
$ | 88,934 | $ | 86,046 | $ | 2,888 | 3 | % | ||||||||
| Commercial real estate |
26,677 | 23,208 | 3,469 | 15 | % | |||||||||||
| Equipment lease financing |
7,463 | 7,570 | (107 | ) | (1 | )% | ||||||||||
|
|
|
|
|
|
|
|||||||||||
| Total commercial lending |
123,074 | 116,824 | 6,250 | 5 | % | |||||||||||
| Consumer |
424 | 869 | (445 | ) | (51 | )% | ||||||||||
|
|
|
|
|
|
|
|||||||||||
| Total loans |
$ | 123,498 | $ | 117,693 | $ | 5,805 | 5 | % | ||||||||
| Total assets |
$ | 140,309 | $ | 133,754 | $ | 6,555 | 5 | % | ||||||||
|
|
|
|
|
|
|
|||||||||||
| Deposits |
||||||||||||||||
| Noninterest-bearing demand |
$ | 48,072 | $ | 49,946 | $ | (1,874 | ) | (4 | )% | |||||||
| Money market |
22,543 | 23,241 | (698 | ) | (3 | )% | ||||||||||
| Interest-bearing demand and other |
13,943 | 10,403 | 3,540 | 34 | % | |||||||||||
|
|
|
|
|
|
|
|||||||||||
| Total deposits |
$ | 84,558 | $ | 83,590 | $ | 968 | 1 | % | ||||||||
|
|
|
|
|
|
|
|||||||||||
| Performance Ratios |
||||||||||||||||
| Return on average assets |
1.36 | % | 1.41 | % | ||||||||||||
| Noninterest income to total revenue |
38 | % | 37 | % | ||||||||||||
| Efficiency |
42 | % | 42 | % | ||||||||||||
|
|
|
|
|
|||||||||||||
| Other Information |
||||||||||||||||
| Commercial loan servicing portfolio (in billions) (a) (b) |
$ | 487 | $ | 447 | $ | 40 | 9 | % | ||||||||
| Consolidated revenue from: (c) |
||||||||||||||||
| Treasury Management (d) |
$ | 1,348 | $ | 1,166 | $ | 182 | 16 | % | ||||||||
| Capital Markets (d) |
$ | 808 | $ | 813 | $ | (5 | ) | (1 | )% | |||||||
| Commercial mortgage banking activities |
||||||||||||||||
| Commercial mortgage loans held for sale (e) |
$ | 127 | $ | 140 | $ | (13 | ) | (9 | )% | |||||||
| Commercial mortgage loan servicing income (f) |
248 | 250 | (2 | ) | (1 | )% | ||||||||||
| Commercial mortgage servicing rights valuation, net of economic hedge (g) |
44 | 28 | 16 | 57 | % | |||||||||||
|
|
|
|
|
|
|
|||||||||||
| Total |
$ | 419 | $ | 418 | $ | 1 | | |||||||||
| Net carrying amount of commercial mortgage servicing rights (a) |
$ | 576 | $ | 526 | $ | 50 | 10 | % | ||||||||
| Average Loans (by C&IB business) |
||||||||||||||||
| Corporate Banking |
$ | 51,392 | $ | 50,375 | $ | 1,017 | 2 | % | ||||||||
| Real Estate |
36,493 | 31,312 | 5,181 | 17 | % | |||||||||||
| Business Credit |
14,763 | 14,615 | 148 | 1 | % | |||||||||||
| Equipment Finance |
11,826 | 11,584 | 242 | 2 | % | |||||||||||
| Commercial Banking |
7,159 | 7,685 | (526 | ) | (7 | )% | ||||||||||
| Other |
1,865 | 2,122 | (257 | ) | (12 | )% | ||||||||||
|
|
|
|
|
|
|
|||||||||||
| Total average loans |
$ | 123,498 | $ | 117,693 | $ | 5,805 | 5 | % | ||||||||
| Credit-related statistics |
||||||||||||||||
| Nonperforming assets (a) (h) |
$ | 691 | $ | 584 | $ | 107 | 18 | % | ||||||||
| Net charge-offs |
$ | 180 | $ | 21 | $ | 159 | * | |||||||||
|
|
|
|
|
|
|
|||||||||||
* - Not meaningful.
| (a) | As of December 31. |
| (b) | Represents loans serviced for PNC and others. |
| (c) | Represents consolidated amounts. See the additional revenue discussion regarding treasury management, capital markets-related products and services, and commercial mortgage banking activities in the Product Revenue section of the Corporate & Institutional Banking portion of this Business Segments Review section. |
| (d) | Includes amounts reported in net interest income, corporate service fees and other noninterest income. |
| (e) | Includes other noninterest income for valuations on commercial mortgage loans held for sale and related commitments, derivative valuations, origination fees, gains on sale of loans held for sale and net interest income on loans held for sale. |
| (f) | Includes net interest income and noninterest income (primarily in corporate services fees) from loan servicing net of reduction in commercial mortgage servicing rights due to time decay and payoffs. Commercial mortgage servicing rights valuation, net of economic hedge is shown separately. |
| (g) | Amounts reported in corporate service fees. |
| (h) | Includes nonperforming loans of $.6 billion at December 31, 2016 and $.5 billion at December 31, 2015. |
13
Corporate & Institutional Banking earned $1.9 billion in both 2016 and 2015. Earnings remained stable as higher revenue was offset by an increase in the provision for credit losses. We continue to focus on building client relationships with appropriate risk-return profiles.
Net interest income increased modestly compared with 2015, reflecting the impacts of higher average loans and interest rate spread expansion on deposits, as well as interest rate spread compression on loans.
Growth in noninterest income in the comparison was driven by higher treasury management fees, an equity investment gain in 2016, increased fees from underwriting activities and higher structuring fees on asset securitizations. These increases were partially offset by lower merger and acquisition advisory fees.
Overall credit quality in 2016 remained relatively stable, except for deterioration related to certain energy related loans, which was the primary driver for the increase in provision for credit losses, net charge-offs and nonperforming assets in the year over year comparisons. Increased provision for credit losses also reflected the impact of continued loan growth.
Noninterest expense increased nominally in the comparison reflecting disciplined expense management.
Average loans increased in 2016 compared with 2015 due to strong growth in Real Estate:
| | PNC Real Estate provides banking, financing and servicing solutions for commercial real estate clients across the country. Higher average loans for this business were primarily due to growth in both commercial real estate and commercial lending. |
| | Corporate Banking provides lending, treasury management and capital markets-related products and services to midsized and large corporations, government and not-for-profit entities. Average loans for this business increased in the comparison reflecting increased lending to large corporate clients partially offset by the impact of capital and liquidity management activities. |
| | PNC Business Credit provides asset-based lending. The loan portfolio is relatively high yielding, with acceptable risk as the loans are mainly secured by short-term assets. Average loans for this business increased in the comparison due to new originations. |
| | PNC Equipment Finance provides equipment financing solutions for clients throughout the U.S. and Canada. Average loans, including commercial loans and finance leases, and operating leases were $12.6 billion in 2016, compared with $12.4 billion in 2015. |
| | Commercial Banking provides lending, treasury management and capital markets-related products and services to smaller corporations and businesses. Average loans for this business decreased in the comparison primarily due to the impact of capital management activities. |
Average deposits increased modestly compared with 2015, as growth in other deposits, driven by interest-bearing demand deposit growth, was mostly offset by decreases in noninterest-bearing demand deposits and money market deposits.
Growth in the commercial loan servicing portfolio was reflected by servicing additions from new and existing customers exceeding portfolio run-off.
Product Revenue
In addition to credit and deposit products for commercial customers, Corporate & Institutional Banking offers other services, for customers of all business segments, including treasury management, capital markets-related products and services, and commercial mortgage banking activities. On a consolidated basis, the revenue from these other services is included in net interest income, corporate service fees and other noninterest income. From a segment perspective, the majority of the revenue and expense related to these services is reflected in the Corporate & Institutional Banking segment results and the remainder is reflected in the results of other businesses. The Other Information section in Table 10 includes the consolidated revenue to PNC for these services. A discussion of the consolidated revenue from these services follows.
Treasury management revenue consists of fees and net interest income from customer deposit balances. Compared with 2015, revenue from treasury management increased driven by liquidity-related revenue associated with customer deposit balances and interest rate spread expansion.
Capital markets-related products and services include foreign exchange, derivatives, securities, loan syndications, mergers and acquisitions advisory and equity capital markets advisory related services. Revenue from capital markets-related products and services decreased slightly in the comparison as both lower merger and acquisition advisory fees and loan syndication fees were mostly offset by increased fees from underwriting activities and higher structuring fees on asset securitizations.
Commercial mortgage banking activities include revenue derived from commercial mortgage servicing (including net interest income and noninterest income) and revenue derived from commercial mortgage loans held for sale and related hedges. Total commercial mortgage banking activities increased marginally in the comparison as a higher benefit from commercial mortgage servicing rights valuation, net of economic hedge, was mostly offset by lower revenue from commercial mortgage loans held for sale.
14
Asset Management Group (Unaudited)
Table 11: Asset Management Group Table
| Year ended December 31 | Change | |||||||||||||||
| Dollars in millions, except as noted |
2016 | 2015 | $ | % | ||||||||||||
| Income Statement |
||||||||||||||||
| Net interest income |
$ | 300 | $ | 292 | $ | 8 | 3 | % | ||||||||
| Noninterest income |
851 | 869 | (18 | ) | (2 | )% | ||||||||||
|
|
|
|
|
|
|
|||||||||||
| Total revenue |
1,151 | 1,161 | (10 | ) | (1 | )% | ||||||||||
| Provision for credit losses (benefit) |
(6 | ) | 9 | (15 | ) | (167 | )% | |||||||||
| Noninterest expense |
825 | 846 | (21 | ) | (2 | )% | ||||||||||
|
|
|
|
|
|
|
|||||||||||
| Pretax earnings |
332 | 306 | 26 | 8 | % | |||||||||||
| Income taxes |
122 | 112 | 10 | 9 | % | |||||||||||
|
|
|
|
|
|
|
|||||||||||
| Earnings |
$ | 210 | $ | 194 | $ | 16 | 8 | % | ||||||||
|
|
|
|
|
|
|
|||||||||||
| Average Balance Sheet |
||||||||||||||||
| Loans |
||||||||||||||||
| Consumer |
$ | 5,436 | $ | 5,655 | $ | (219 | ) | (4 | )% | |||||||
| Commercial and commercial real estate |
754 | 880 | (126 | ) | (14 | )% | ||||||||||
| Residential mortgage |
1,058 | 919 | 139 | 15 | % | |||||||||||
|
|
|
|
|
|
|
|||||||||||
| Total loans |
$ | 7,248 | $ | 7,454 | $ | (206 | ) | (3 | )% | |||||||
| Total assets |
$ | 7,707 | $ | 7,920 | $ | (213 | ) | (3 | )% | |||||||
|
|
|
|
|
|
|
|||||||||||
| Deposits |
||||||||||||||||
| Noninterest-bearing demand |
$ | 1,431 | $ | 1,272 | $ | 159 | 13 | % | ||||||||
| Interest-bearing demand |
4,013 | 4,144 | (131 | ) | (3 | )% | ||||||||||
| Money market |
4,128 | 5,161 | (1,033 | ) | (20 | )% | ||||||||||
| Savings |
2,303 | 361 | 1,942 | 538 | % | |||||||||||
| Other |
275 | 277 | (2 | ) | (1 | )% | ||||||||||
|
|
|
|
|
|
|
|||||||||||
| Total deposits |
$ | 12,150 | $ | 11,215 | $ | 935 | 8 | % | ||||||||
|
|
|
|
|
|
|
|||||||||||
| Performance Ratios |
||||||||||||||||
| Return on average assets |
2.72 | % | 2.45 | % | ||||||||||||
| Noninterest income to total revenue |
74 | % | 75 | % | ||||||||||||
| Efficiency |
72 | % | 73 | % | ||||||||||||
|
|
|
|
|
|||||||||||||
| Other Information |
||||||||||||||||
| Nonperforming assets (a) (b) |
$ | 53 | $ | 53 | | | ||||||||||
| Net charge-offs |
$ | 9 | $ | 13 | $ | (4 | ) | (31 | )% | |||||||
|
|
|
|
|
|
|
|||||||||||
| Client Assets Under Administration (in billions) (a) (c) (d) |
||||||||||||||||
| Discretionary client assets under management |
$ | 137 | $ | 134 | $ | 3 | 2 | % | ||||||||
| Nondiscretionary client assets under administration |
129 | 125 | 4 | 3 | % | |||||||||||
|
|
|
|
|
|
|
|||||||||||
| Total |
$ | 266 | $ | 259 | $ | 7 | 3 | % | ||||||||
|
|
|
|
|
|
|
|||||||||||
| Discretionary client assets under management |
||||||||||||||||
| Personal |
$ | 85 | $ | 85 | | | ||||||||||
| Institutional |
52 | 49 | $ | 3 | 6 | % | ||||||||||
|
|
|
|
|
|
|
|||||||||||
| Total |
$ | 137 | $ | 134 | $ | 3 | 2 | % | ||||||||
|
|
|
|
|
|
|
|||||||||||
| Equity |
$ | 73 | $ | 72 | $ | 1 | 1 | % | ||||||||
| Fixed Income |
39 | 40 | (1 | ) | (3 | )% | ||||||||||
| Liquidity/Other |
25 | 22 | 3 | 14 | % | |||||||||||
|
|
|
|
|
|
|
|||||||||||
| Total |
$ | 137 | $ | 134 | $ | 3 | 2 | % | ||||||||
|
|
|
|
|
|
|
|||||||||||
| (a) | As of December 31. |
| (b) | Includes nonperforming loans of $46 million at December 31, 2016 and $48 million at December 31, 2015. |
| (c) | Excludes brokerage account client assets. |
| (d) | As a result of certain investment advisory services performed by one of our registered investment advisors, certain assets are reported as both discretionary client assets under management and nondiscretionary client assets under administration. The amount of such assets was approximately $9 billion at December 31, 2016 and $6 billion at December 31, 2015. |
Asset Management Group earned $210 million in 2016 compared to $194 million in 2015. Earnings increased due to declines in noninterest expense and provision for credit losses, as well as an increase in net interest income, partially offset by a decrease in noninterest income.
The decline in revenue in the comparison was driven by lower noninterest income, partially offset by higher net interest income. The decline in noninterest income reflected the impact from a $30 million trust settlement in 2015, which was partially offset by new sales production and stronger average equity markets. Increased net interest income in the comparison was primarily due to higher average deposit balances, partially offset by a decrease in loan balances.
15
The reduction in noninterest expense in 2016 compared to the prior year was primarily attributable to lower compensation expense. Asset Management Group remains focused on disciplined expense management as it invests in strategic growth opportunities.
Asset Management Groups strategy is focused on growing investable assets by continually evolving the client experience and products and services. The business offers an open architecture platform with a full array of investment products and banking solutions. Key growth opportunities include: maximizing front line productivity, ensuring a relationship-based approach with other lines of business partners, and optimizing market presence across our footprint.
Wealth Management and Hawthorn have nearly 100 offices operating in seven out of the ten most affluent states in the U.S. with a majority co-located with retail banking branches. The businesses provide customized investments, wealth planning, trust and estate administration and private banking solutions to affluent individuals and ultra-affluent families.
Institutional Asset Management provides advisory, custody, and retirement administration services to institutional clients such as corporations, unions, municipalities, non-profits, foundations, and endowments. The business also offers PNC proprietary mutual funds and investment strategies. Institutional Asset Management is strengthening its partnership with Corporate & Institutional Banking to drive growth and is focused on building retirement capabilities and expanding product solutions for all customers.
The increase in assets under administration in the comparison to the prior year reflected growth in discretionary client assets under management, which was driven by higher equity markets.
BlackRock (Unaudited)
Table 13: BlackRock Table
Information related to our equity investment in BlackRock follows:
| Year ended December 31 | ||||||||
| Dollars in millions |
2016 | 2015 | ||||||
| Business segment earnings (a) |
$ | 532 | $ | 548 | ||||
| PNCs economic interest in BlackRock (b) |
22 | % | 22 | % | ||||
| (a) | Includes our share of BlackRocks reported GAAP earnings and additional income taxes on those earnings incurred by us. |
| (b) | At December 31. |
| December 31 | December 31 | |||||||
| In billions |
2016 | 2015 | ||||||
| Carrying value of our investment in BlackRock (c) |
$ | 7.0 | $ | 6.7 | ||||
| Market value of our investment in BlackRock (d) |
13.4 | 12.0 | ||||||
| (c) | We account for our investment in BlackRock under the equity method of accounting, exclusive of a related deferred tax liability of $2.3 billion at December 31, 2016 and $2.2 billion at December 31, 2015. Our voting interest in BlackRock common stock was approximately 21% at December 31, 2016. |
| (d) | Does not include liquidity discount. |
In addition to our investment in BlackRock reflected in Table 13, at December 31, 2016, we held approximately .8 million shares of BlackRock Series C Preferred Stock valued at $232 million, which are available to fund our obligation in connection with certain BlackRock long-term incentive plan (LTIP) programs. We account for the BlackRock Series C Preferred Stock at fair value, which offsets the impact of marking-to-market the obligation to deliver these shares to BlackRock. The fair value amount of the BlackRock Series C Preferred Stock is included on our Consolidated Balance Sheet within Other assets. Additional information regarding the valuation of the BlackRock Series C Preferred Stock is included in Note 6 Fair Value, and additional information regarding our BlackRock LTIP share obligations is included in Note 12 Stock Based Compensation Plans, both of which are in the Notes To Consolidated Financial Statements in Item 8 of this Report.
See Note 23 Subsequent Events in Item 8 of this Report for information on our February 1, 2017 transfer of .5 million shares of Series C Preferred Stock to BlackRock to satisfy a portion of our LTIP obligation.
2015 VERSUS 2014
Consolidated Income Statement Review
Summary Results
Net income for 2015 of $4.1 billion, or $7.39 per diluted common share, decreased compared to 2014 net income of $4.2 billion, or $7.30 per diluted common share. A decrease in revenue of 1% was partially offset by reductions in noninterest expense and the provision for credit losses. Lower revenue was driven by a 3% decrease in net interest income, offset in part by a 1% increase in noninterest income reflecting strong fee income growth.
16
Net Interest Income
Net interest income was $8.3 billion in 2015 and decreased by $247 million, or 3%, compared with 2014 due to lower purchase accounting accretion and lower interest-earning asset yields driven by the low rate environment, partially offset by commercial and commercial real estate loan growth and higher securities balances. The decline also reflected the impact from the second quarter 2014 correction to reclassify certain commercial facility fees from net interest income to noninterest income.
Net interest margin was 2.74% in 2015 and 3.08% in 2014. The decrease was driven by a 32 basis point decline in the yield on total interest-earning assets, which was principally due to the impact of increasing the companys liquidity position, lower loan and securities yields, and lower benefit from purchase accounting accretion. The decline also included the impact of the second quarter 2014 correction to reclassify certain commercial facility fees.
Noninterest Income
Noninterest income was $6.9 billion for 2015 and 2014, as strong growth in consumer and corporate services fees and asset management revenue was partially offset by lower gains on asset sales and lower residential mortgage revenue. Noninterest income as a percentage of total revenue was 46% for 2015, up from 45% for 2014.
Asset management revenue increased $54 million, or 4%, in 2015 to $1.6 billion, compared to 2014, driven by new sales production and stronger average equity markets, as well as the benefit from a $30 million trust settlement in 2015. Discretionary client assets under management in the Asset Management Group were $134 billion at December 31, 2015 compared with $135 billion at December 31, 2014.
Consumer service fees increased $81 million, or 6%, in 2015 compared to 2014, primarily due to growth in customer-initiated transaction volumes related to debit card, credit card and merchant services activity, along with higher brokerage revenue.
Corporate service fees increased to $1.5 billion in 2015 compared to $1.4 billion in 2014, driven by higher treasury management, commercial mortgage servicing and equity capital markets advisory fees, partially offset by lower merger and acquisition advisory fees. The increase also reflected the impact of the correction to reclassify certain commercial facility fees from net interest income to noninterest income beginning in the second quarter of 2014.
Residential mortgage revenue decreased to $566 million in 2015 from $618 million in 2014, primarily due to lower loan sales and servicing revenue, partially offset by higher net hedging gains on residential mortgage servicing rights.
Other noninterest income decreased to $1.3 billion in 2015 compared to $1.4 billion in 2014. The decline was primarily attributable to lower gains on asset dispositions, including the impact of the 2014 gain of $94 million on the sale of our Washington, D.C. regional headquarters building and lower net gains on sales of Visa Class B common shares.
Net gains on sales of Visa Class B Common shares were $166 million in 2015 compared to $150 million in 2014. Net gains on Visa sales include derivative fair value adjustments related to swap agreements with purchasers of Visa shares in connection with all prior sales to date.
Provision For Credit Losses
The provision for credit losses totaled $255 million in 2015 compared with $273 million in 2014, reflecting improved credit quality.
Noninterest Expense
Noninterest expense decreased $25 million to $9.5 billion in 2015 compared to 2014, reflecting our focus on expense management. Higher personnel expense associated with higher business activity and investments in technology and business infrastructure were more than offset by lower legal and residential mortgage compliance costs and third party expenses, as well as the impact of the fourth quarter 2014 contribution to the PNC Foundation.
During 2015, we completed actions and exceeded our 2015 continuous improvement program goal of $500 million in cost savings. The program focused on reducing costs in part to fund investments in technology and business infrastructure.
Effective Income Tax Rate
The effective income tax rate was 24.8% for 2015 compared with 25.1% for 2014. The effective tax rate is generally lower than the statutory rate primarily due to tax credits we receive from our investments in low income housing and new markets investments, as well as earnings in other tax exempt investments.
The effective tax rate for 2015 included tax benefits attributable to settling acquired entity tax contingencies.
17
Consolidated Balance Sheet Review
Summary Results
Our balance sheet reflected asset growth and strong liquidity and capital positions at December 31, 2015. Total assets increased in 2015 compared to 2014 primarily due to an increase of $14.7 billion in investment securities driven by deposit growth. Total liabilities increased in 2015 compared to 2014 mainly due to an increase in deposits. Total equity in 2015 remained relatively stable compared to 2014 mainly due to increased retained earnings driven by net income, offset by share repurchases and redemption of preferred stock.
Loans
Loans increased $1.9 billion to $206.7 billion as of December 31, 2015 compared with December 31, 2014. Loan growth was the result of an increase in total commercial lending driven by commercial real estate loans, partially offset by a decline in consumer lending due to lower home equity, education and automobile loans.
Average total loans increased by $5.7 billion to $205.3 billion in 2015, which was driven by increases in average commercial loans of $5.7 billion and average commercial real estate loans of $2.5 billion. These increases were partially offset by a decrease in consumer loans of $2.4 billion primarily attributable to lower home equity and education loans.
Investment Securities
Investment securities increased $14.7 billion to $70.5 billion at December 31, 2015 compared to December 31, 2014, due to deposit growth. The majority of increases were in U.S. Treasury and government agency securities and agency residential mortgage-backed securities.
Average investment securities increased to $61.7 billion during 2015 compared to $55.8 billion during 2014, primarily due to increases in average agency residential mortgage-backed securities and U.S. Treasury and government agency securities, partially offset by a decrease in average non-agency residential mortgage-backed securities.
The weighed-average expected maturity of the investment securities portfolio (excluding corporate stock and other) was 4.8 years at December 31, 2015 and 4.3 years at December 31, 2014.
Funding Sources
Total deposits increased $16.8 billion to $249.0 billion at December 31, 2015 compared with December 31, 2014 due to strong growth in savings, demand and money market deposits, partially offset by a decline in retail certificates of deposit.
Average total deposits increased $17.4 billion to $240.4 billion in 2015 compared with 2014, primarily due to increases in average money market deposits, average non-interest-bearing deposits and average interest-bearing demand deposits driven by both commercial and retail deposit growth.
Total borrowed funds decreased $2.2 billion to $54.5 billion at December 31, 2015 compared with December 31, 2014, as declines in commercial paper, federal funds purchased and repurchase agreements and subordinated debt were partially offset by higher net issuances of bank notes and senior debt.
Average borrowed funds increased to $56.5 billion in 2015 from $48.8 billion in 2014 primarily due to an increase in average FHLB borrowings and average bank notes and senior debt. These increases were partially offset by a decline in average commercial paper balances. The changes in the composition of funding sources were attributable to our actions to enhance our funding structure in light of regulatory liquidity standards and a rating agency methodology change.
Shareholders Equity
Total shareholders equity increased $159 million to $44.7 billion at December 31, 2015 compared with December 31, 2014, mainly due to a $2.8 billion increase in retained earnings, partially offset by common share repurchases of $2.1 billion and the redemption of $500 million of preferred stock. The increase in retained earnings was driven by net income of $4.1 billion, reduced by $1.3 billion of common and preferred dividends declared. Common shares outstanding were 504 million and 523 million at December 31, 2015 and 2014, respectively.
18
RISK MANAGEMENT
Enterprise Risk Management
We have an Enterprise Risk Management Framework which is structurally aligned with enhanced prudential standards that establish minimum requirements for the design and implementation of a risk governance framework. We encounter risk as part of the normal course of operating our business. Accordingly, we design risk management processes to help manage this risk. We manage risk in light of our Risk Appetite to optimize long-term shareholder value while supporting our employees, customers, and communities.
This Risk Management section describes our Enterprise Risk Management (ERM) Framework which consists of risk culture, enterprise strategy (including Risk Appetite, strategic planning, capital planning and stress testing), risk governance and oversight, risk identification, risk assessments, risk controls and monitoring, and risk aggregation and reporting. The overall Risk Management section of this Item 7 also provides an analysis of our key areas of risk, which include but are not limited to credit, liquidity and capital, market, operational and compliance. Our use of financial derivatives as part of our overall asset and liability risk management process is also addressed within the risk management section.
We operate within a rapidly evolving regulatory environment. Accordingly, we are actively focused on the timely adoption of regulatory pronouncements within our ERM Framework.
We view risk management as a cohesive combination of the following risk elements which form our ERM Framework:
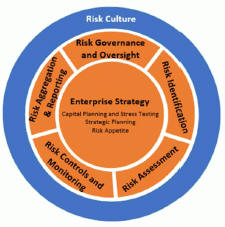
Risk Culture
A strong risk culture helps us make well-informed decisions, ensures individuals conform to the established culture, reduces an individuals ability to do something for personal gain, and rewards employees working toward a common goal rather than individual interests. Our risk culture reinforces the appropriate protocols for responsible and ethical behavior. These protocols are especially critical in terms of our risk awareness, risk-taking behavior and risk management practices.
Managing risk is every one of our employees responsibility. All of our employees individually and collectively assume responsibility for ensuring the organization is performing with the utmost integrity, is applying sound risk management practices and is striving to achieve our stated objectives rather than pursuing individual interests. All employees are responsible for understanding our Enterprise Risk Appetite Statement, the ERM Framework and how risk management applies to their respective roles and responsibilities. Employees are encouraged to collaborate across groups to identify and mitigate risks, and elevate issues as required. We reinforce risk management responsibilities through a performance management system where employee performance goals include risk management objectives and incentives for employees to reinforce balanced measures of risk-adjusted performance.
Proactive communication, between groups and up to the Board of Directors, facilitates timely identification and resolution of risk issues. Our multi-level risk committee structure provides a formal channel to identify, decision, and report risk.
19
Enterprise Strategy
We ensure that our overall enterprise strategy is within acceptable risk parameters through Risk Appetite, strategic planning, capital planning and stress testing processes. These components are reviewed and approved at least annually by the Board of Directors.
Risk Appetite: Our risk appetite represents the organizations desired enterprise risk position, set within our capital based risk and liquidity capacity to achieve our strategic objectives and business plans. The Enterprise Risk Appetite Statement qualitatively describes the aggregate level of risk we are willing to accept in order to execute our business strategies. Qualitative guiding principles further define each of the risks within our taxonomy to support the risk appetite statement. Risk Appetite metrics and limits, including forward-looking metrics, quantitatively measure whether we are operating within our stated Risk Appetite. Our Risk Appetite metrics reflect material risks, align with our established Risk Appetite Framework, balance risk and reward, leverage analytics, and adjust in a timely manner to changes in the external and internal risk environments.
Strategic Planning: Our enterprise and line of business strategic plans outline major objectives, strategies, and goals which are expected to be achieved over the next five years while seeking to ensure we remain compliant with all capital, Risk Appetite, and liquidity targets and guidelines. Our CEO and CFO lead the development of the strategic plan, the strategic objectives, and the comprehensive identification of material risks that could hinder successful implementation and execution of strategies. Strategic planning is linked to our risk management and capital planning processes.
Capital Planning and Stress Testing: Capital planning helps to ensure we are maintaining safe and sound operations and viability. The capital planning process and the resulting capital plan evolve as our overall risks, activities, and risk management practices change. Capital planning aligns with our strategic planning process. Stress testing is an essential element of the capital planning process. Effective stress testing enables us to consider the estimated effect on capital of various hypothetical scenarios.
Risk Governance and Oversight
We employ a comprehensive risk management governance framework to help ensure that risks are identified, balanced decisions are made that consider risk and return, and risks are adequately monitored and managed. Risk committees established within this risk governance and oversight framework provide oversight for risk management activities at the Board of Directors, executive, corporate, and business levels. Committee composition is designed to provide effective oversight balanced across the three lines of defense in accordance with the OCCs heightened risk management and governance expectations and guidelines. See discussion of the enhanced prudential standards in the Supervision and Regulation section in Item 1 in our 2016 Form 10-K.
To ensure the appropriate risks are being taken and effectively managed and controlled, risk is managed across three lines of defense. The Boards and each line of defenses responsibilities are detailed below:
Board of Directors The Board of Directors oversees our risk-taking activities and exercises sound, independent judgment when assessing risk.
First line of defense The front line units are accountable for identifying, owning and managing risks to within acceptable levels while adhering to the risk management framework established by Independent Risk Management. Our businesses strive to enhance risk management and internal control processes within their areas. Integrated and comprehensive processes are designed to adequately identify, measure, manage, monitor and report risks which may significantly impact each business. The manner in which the first line of defense executes its responsibilities must reflect our risk culture.
Second line of defenseThe second line of defense is independent from the first line of defense and is responsible for establishing the standards for identifying, measuring, monitoring and controlling aggregate risks. As the second line of defense, the independent risk areas monitor the risks generated by the first line of defense, review and challenge the implementation of effective risk management practices, and report any issues or exceptions. The risk areas help to ensure the first line of defense is properly designed and operating as intended, and they may intervene directly in modifying and developing first line of defense risk processes and controls.
Third line of defenseAs the third line of defense, Internal Audit is independent from the first and second lines of defense. Internal audit provides the Board of Directors and executive management comprehensive assurance on the effectiveness of risk management practices across the organization.
Within the three lines of defense, the independent risk organization has sufficient authority to influence material decisions. Our business oversight and decision-making is supported through a governance structure at the Board of Directors and management level. Specific responsibilities include:
Board of Directors Our Board of Directors oversees our business and affairs as managed by our officers and employees. The Board of Directors may receive assistance in carrying out its duties and may delegate authority through the following standing committees:
| | Audit Committee: monitors the integrity of our consolidated financial statements; monitors internal control over financial reporting; monitors compliance with our code of ethics; evaluates and monitors the qualifications and independence of our independent auditors; and evaluates and monitors the performance of our internal audit function and our independent auditors. |
20
| | Nominating and Governance Committee: promotes our best interests and those of our shareholders through implementation of sound corporate governance principles and practices. |
| | Personnel and Compensation Committee: oversees the compensation of our executive officers and other specified responsibilities related to personnel compensation matters affecting us. |
| | Risk Committee: oversees enterprise-wide risk structure and the processes established to identify, measure, monitor, and manage the organizations risks and evaluates and approves our risk governance framework. |
Corporate Committees The corporate committees are responsible for overseeing risk standards and strategies, recommending risk limits, policies and metrics, monitoring risk exposures, reviewing risk profiles and key risk issues, and approving significant transactions and initiatives. We have established several senior management-level corporate committees to facilitate the review, evaluation, and management of risk. The management-level Executive Committee is the corporate committee that is responsible for developing enterprise-wide strategy and achieving our strategic objectives. The Executive Committee evaluates risk management, in part, by monitoring risk reporting from the other corporate committees which are the supporting committees for the Executive Committee.
Working Committees The working committees are generally subcommittees of the corporate committees. Working committees are intended to assist in the implementation of key enterprise-level activities within a business or function; recommend and/or approve Risk Appetite metrics and limits; recommend and/or approve policies that are generally within the standards outlined in the applicable enterprise policy; and review and/or approve certain significant transactions or initiatives.
Policies and Procedures We have established risk management policies and procedures to provide direction, guidance, and clarity on roles and responsibilities to management and the Board of Directors. These policies and procedures are organized in a multi-tiered framework and require periodic review and approval by relevant committees within the governance structure.
We have established risk management policies, programs and procedures to support our ERM Framework, articulate our risk culture, define the parameters and processes within which employees are to manage risk and conduct our business activities and to provide direction, guidance, and clarity on roles and responsibilities to management and the Board of Directors. These policies, programs and procedures are organized in a multi-tiered framework and require periodic review and approval by relevant committees within the governance structure.
Risk Identification
Risk identification takes place across a variety of risk types throughout the organization. These risk types consist of, but are not limited to, credit, liquidity and capital, market, operational and compliance. Risks are identified based on a balanced use of analytical tools and management judgment for both on- and off-balance sheet exposures. Our governance structure supports risk identification by facilitating assessment of key risk issues, emerging risks, and idiosyncratic risks and implementation of mitigation strategies as appropriate. These risks are prioritized based on quantitative and qualitative analysis and assessed against the Risk Appetite. Multiple tools and approaches are used to help identify and prioritize risks, including Risk Appetite Metrics, Key Risk Indicators (KRIs), Key Performance Indicators (KPIs), Risk Control and Self-Assessments (RCSAs), scenario analysis, stress testing and special investigations.
Risks are aggregated and assessed within and across risk functions or businesses. The aggregated risk information is reviewed and reported at an enterprise level for adherence to the Risk Appetite framework as established through the policy framework and approved by the Board of Directors or by appropriate committees. This enterprise aggregation and reporting approach promotes the identification and appropriate escalation of material risks across the organization and supports an understanding of the cumulative impact of risk in relation to our Risk Appetite.
Risk Assessment
Once risks are identified, they are evaluated based on quantitative and qualitative analysis to determine whether they are material. Risk assessments support the overall management of an effective ERM Framework and allows us to control and monitor our actual risk level through the use of risk measures. Comprehensive, accurate and timely assessments of risk are essential to an effective ERM Framework. The use of analytical tools and methods help identify and prioritize risks. Effective risk measurement practices will uncover reoccurring risks that have been experienced in the past; make the known risks easy to see, understand, compare and report; and reveal unanticipated risks that may not be easy to understand or predict.
Risk Controls and Monitoring
Our ERM Framework consists of policies, processes, personnel, and control systems. Risk controls and limits provide the linkage from our Risk Appetite Statement and associated guiding principles to the risk taking activities of our businesses. In addition to Risk Appetite limits, a system of more detailed internal controls exists which oversees and monitors our various processes and functions. These control systems measure performance, help employees make correct decisions, ensure information is accurate and reliable and document compliance with laws and regulations.
21
Our monitoring and evaluation of risks and controls provides assurance that policies, procedures and controls are effective and also results in the identification of control improvement recommendations. Risk monitoring is a daily, on-going process used by both the first and second line of defense to ensure compliance with our ERM Framework. Risk monitoring is accomplished in many ways, including performing risk assessments at the prime process and risk assessment unit level, monitoring an areas key controls, the timely reporting of issues, and establishing a quality assurance and/or quality control function, as applicable.
Risk Aggregation and Reporting
Risk reporting is a comprehensive way to: (i) aggregate risks; (ii) identify concentrations; (iii) help ensure we remain within our established Risk Appetite; (iv) serve as a basis for monitoring our risk profile in relation to our Risk Appetite and (v) communicate risks to the Board of Directors and executive management.
Risk reports are produced at the line of business, functional risk and the enterprise levels. The enterprise level risk report aggregates risks identified in the functional and business reports to define the enterprise risk profile. The enterprise risk profile is a point-in-time assessment of enterprise risk. The risk profile represents our overall risk position in relation to the desired enterprise Risk Appetite. The determination of the enterprise risk profile is based on analysis of quantitative reporting of risk limits and other measures along with qualitative assessments. Quarterly aggregation of our risk profile enables a clear view of our risk level relative to our quantitative Risk Appetite. The enterprise level report is provided through the governance structure to the Board of Directors.
Risk reports are produced at the enterprise level as well as the risk area, line of business, and support area levels. Each individual risk report includes an assessment of inherent risk, quality of risk management, residual risk, Risk Appetite, and risk outlook. The enterprise risk report includes an aggregate view of risks identified in the individual report and provides a summary of our overall risk profile compared to our Risk Appetite.
Credit Risk Management
Credit risk represents the possibility that a customer, counterparty or issuer may not perform in accordance with contractual terms. Credit risk is inherent in the financial services business and results from extending credit to customers, purchasing securities, and entering into financial derivative transactions and certain guarantee contracts. Credit risk is one of our most significant risks. Our processes for managing credit risk are embedded in our risk culture and in our decision-making processes using a systematic approach whereby credit risks and related exposures are identified and assessed, managed through specific policies and processes, measured and evaluated against our risk appetite and credit concentration limits, and reported, along with specific mitigation activities, to management and the Board of Directors through our governance structure. Our most significant concentration of credit risk is in our loan portfolio.
Nonperforming Assets and Loan Delinquencies
Nonperforming Assets
Nonperforming assets include nonperforming loans and leases for which ultimate collectability of the full amount of contractual principal and interest is not probable and include nonperforming troubled debt restructurings (TDRs), other real estate owned (OREO), foreclosed and other assets. Loans held for sale, certain government insured or guaranteed loans, purchased impaired loans and loans accounted for under the fair value option are excluded from nonperforming loans. Additional information regarding our nonperforming loans and nonaccrual policies is included in Note 1 Accounting Policies in the Notes To Consolidated Financial Statements in Item 8 of this Report. A summary of the major categories of nonperforming assets are presented in Table 15. See Note 3 Asset Quality in the Notes To Consolidated Financial Statements in Item 8 of this Report for further detail of nonperforming asset categories.
22
Table 15: Nonperforming Assets by Type
| December 31 2016 |
December 31 2015 |
Change | ||||||||||||||
| Dollars in millions |
$ | % | ||||||||||||||
| Nonperforming loans |
||||||||||||||||
| Commercial lending |
$ | 655 | $ | 545 | $ | 110 | 20 | % | ||||||||
| Consumer lending (a) |
1,489 | 1,581 | (92 | ) | (6 | )% | ||||||||||
|
|
|
|
|
|
|
|||||||||||
| Total nonperforming loans (b) |
2,144 | 2,126 | 18 | 1 | % | |||||||||||
| OREO, foreclosed and other assets |
230 | 299 | (69 | ) | (23 | )% | ||||||||||
|
|
|
|
|
|
|
|||||||||||
| Total nonperforming assets |
$ | 2,374 | $ | 2,425 | $ | (51 | ) | (2 | )% | |||||||
|
|
|
|
|
|
|
|||||||||||
| Amount of TDRs included in nonperforming loans |
$ | 1,112 | $ | 1,119 | $ | (7 | ) | (1 | )% | |||||||
| Percentage of total nonperforming loans |
52 | % | 53 | % | ||||||||||||
|
|
|
|
|
|||||||||||||
| Nonperforming loans to total loans |
1.02 | % | 1.03 | % | ||||||||||||
| Nonperforming assets to total loans, OREO, foreclosed and other assets |
1.12 | % | 1.17 | % | ||||||||||||
| Nonperforming assets to total assets |
.65 | % | .68 | % | ||||||||||||
| Allowance for loan and lease losses to total nonperforming loans |
121 | % | 128 | % | ||||||||||||
|
|
|
|
|
|||||||||||||
| (a) | Excludes most consumer loans and lines of credit not secured by residential real estate, which are charged off after 120 to 180 days past due and are not placed on nonperforming status. |
| (b) | The recorded investment of loans collateralized by residential real estate property that are in process of foreclosure was $.4 billion and $.6 billion at December 31, 2016 and December 31, 2015, respectively, and included $.2 billion and $.3 billion, respectively, of loans that are government insured/guaranteed. |
Table 16: Change in Nonperforming Assets
| In millions |
2016 | 2015 | ||||||
| January 1 |
$ | 2,425 | $ | 2,880 | ||||
| New nonperforming assets |
1,835 | 1,459 | ||||||
| Charge-offs and valuation adjustments |
(604 | ) | (499 | ) | ||||
| Principal activity, including paydowns and payoffs |
(697 | ) | (687 | ) | ||||
| Asset sales and transfers to loans held for sale |
(336 | ) | (364 | ) | ||||
| Returned to performing status |
(249 | ) | (364 | ) | ||||
|
|
|
|
|
|||||
| December 31 |
$ | 2,374 | $ | 2,425 | ||||
|
|
|
|
|
|||||
As of December 31, 2016, approximately 84% of total nonperforming loans were secured by collateral which lessened reserve requirements and is expected to reduce credit losses in the event of default. As of December 31, 2016, commercial lending nonperforming loans were carried at approximately 66% of their unpaid principal balance, due to charge-offs recorded to date, before consideration of the ALLL.
Within consumer nonperforming loans, residential real estate TDRs comprise 70% of total residential real estate nonperforming loans at December 31, 2016, up from 68% at December 31, 2015. Home equity TDRs comprise 52% of home equity nonperforming loans at December 31, 2016 and 51% at December 31, 2015. TDRs generally remain in nonperforming status until a borrower has made at least six consecutive months of both principal and interest payments under the modified terms or ultimate resolution occurs. Loans where borrowers have been discharged from personal liability through Chapter 7 bankruptcy and have not formally reaffirmed their loan obligations to us and loans to borrowers not currently obligated to make both principal and interest payments under the restructured terms are not returned to accrual status.
At December 31, 2016, our largest nonperforming asset was $46 million in the Mining, Quarrying, Oil and Gas Extraction Industry and our average nonperforming loan associated with commercial lending was less than $1 million. The ten largest individual nonperforming assets are from the commercial lending portfolio and represented 40% and 11% of total commercial lending nonperforming loans and total nonperforming assets, respectively, as of December 31, 2016.
Loan Delinquencies
We regularly monitor the level of loan delinquencies and believe these levels may be a key indicator of loan portfolio asset quality. Measurement of delinquency status is based on the contractual terms of each loan. Loans that are 30 days or more past due in terms of payment are considered delinquent. Loan delinquencies exclude loans held for sale and purchased impaired loans, but include government insured or guaranteed loans and loans accounted for under the fair value option.
23
Table 17: Accruing Loans Past Due (a)
| Amount | Percentage of Total Loans Outstanding |
|||||||||||||||||||||||
|
|
|
Change | ||||||||||||||||||||||
| Dollars in millions |
December 31 2016 |
December 31 2015 |
$ | % | December 31 2016 |
December 31 2015 |
||||||||||||||||||
| Early stage loan delinquencies |
||||||||||||||||||||||||
| Accruing loans past due 30 to 59 days |
$ | 562 | $ | 511 | $ | 51 | 10 | % | .27 | % | .25 | % | ||||||||||||
| Accruing loans past due 60 to 89 days |
232 | 248 | (16 | ) | (6 | )% | .11 | % | .12 | % | ||||||||||||||
|
|
|
|
|
|
|
|
|
|
|
|||||||||||||||
| Total |
794 | 759 | 35 | 5 | % | .38 | % | .37 | % | |||||||||||||||
| Late stage loan delinquencies Accruing loans past due 90 days or more |
782 | 881 | (99 | ) | (11 | )% | .37 | % | .43 | % | ||||||||||||||
|
|
|
|
|
|
|
|||||||||||||||||||
| Total |
$ | 1,576 | $ | 1,640 | $ | (64 | ) | (4 | )% | .75 | % | .80 | % | |||||||||||
|
|
|
|
|
|
|
|
|
|
|
|||||||||||||||
| (a) | Past due loan amounts include government insured or guaranteed loans of $.9 billion and $1.1 billion as of December 31, 2016 and December 31, 2015, respectively. |
Accruing loans past due 90 days or more decreased at December 31, 2016 compared to December 31, 2015 driven by declines in government insured residential real estate and other consumer loans. Accruing loans past due 90 days or more are not included in nonperforming loans and continue to accrue interest because they are well secured by collateral and are in the process of collection, or are managed in homogenous portfolios with specified charge-off timeframes adhering to regulatory guidelines, or are certain government insured or guaranteed loans.
Home Equity Loan Portfolio
Our home equity loan portfolio totaled $29.9 billion as of December 31, 2016, or 14% of the total loan portfolio. Of that total, $17.7 billion, or 59%, were outstanding under primarily variable-rate home equity lines of credit and $12.2 billion, or 41%, consisted of closed-end home equity installment loans. Approximately 4% of the home equity portfolio was purchased impaired and 3% of the home equity portfolio was on nonperforming status as of December 31, 2016.
As of December 31, 2016, we were in an originated first lien position for approximately 55% of the total outstanding portfolio and, where originated as a second lien, we held or serviced the first lien position for an additional 3% of the portfolio. The remaining 42% of the portfolio was secured by second liens where we do not hold the first lien position. The credit performance of the majority of the home equity portfolio where we are in, hold or service the first lien position, is superior to the portion of the portfolio where we hold the second lien position but do not hold the first lien. Lien position information is generally based upon original LTV at the time of origination. We use an industry-leading third-party service provider to obtain updated loan, lien and collateral data that is aggregated from public and private sources.
We track borrower performance monthly, including obtaining original LTVs and updated FICO scores at least quarterly, updated LTVs semi-annually, and other credit metrics at least quarterly, including the historical performance of any mortgage loans regardless of lien position that we do or do not hold. This information is used for internal reporting and risk management. For internal reporting and risk management we also segment the population into pools based on product type (e.g., home equity loans, brokered home equity loans, home equity lines of credit, brokered home equity lines of credit). As part of our overall risk analysis and monitoring, we segment the home equity portfolio based upon the loan delinquency, modification status and bankruptcy status, as well as the delinquency, modification status and bankruptcy status of any mortgage loan with the same borrower (regardless of whether it is a first lien senior to our second lien).
In establishing our ALLL for non-impaired loans, we utilize a delinquency roll-rate methodology for pools of loans. The roll-rate methodology estimates transition/roll of loan balances from one delinquency state to the next delinquency state and ultimately to charge-off. The roll through to charge-off is based on our actual loss experience for each type of pool. Each of our home equity pools contains both first and second liens. Our experience has been that the ratio of first to second lien loans has been consistent over time and the charge-off amounts for the pools, used to establish our allowance, include losses on both first and second lien loans.
Generally, our variable-rate home equity lines of credit have either a seven or ten year draw period, followed by a 20-year amortization term. During the draw period, we have home equity lines of credit where borrowers pay either interest only or principal and interest. We view home equity lines of credit where borrowers are paying principal and interest under the draw period as less risky than those where the borrowers are paying interest only, as these borrowers have a demonstrated ability to make some level of principal and interest payments. The risk associated with the borrowers ability to satisfy the loan terms upon the draw period ending is considered in establishing our ALLL. Based upon outstanding balances at December 31, 2016, the following table presents the periods when home equity lines of credit draw periods are scheduled to end.
24
Table 18: Home Equity Lines of Credit Draw Period End Dates
| In millions |
Interest Only Product |
Principal and Interest Product |
||||||
| 2017 |
$ | 1,657 | $ | 434 | ||||
| 2018 |
796 | 636 | ||||||
| 2019 |
546 | 483 | ||||||
| 2020 |
442 | 434 | ||||||
| 2021 and thereafter |
2,960 | 6,438 | ||||||
|
|
|
|
|
|||||
| Total (a) (b) |
$ | 6,401 | $ | 8,425 | ||||
|
|
|
|
|
|||||
| (a) | Includes all home equity lines of credit that mature in 2017 or later, including those with borrowers where we have terminated borrowing privileges. |
| (b) | Includes home equity lines of credit with balloon payments, including those where we have terminated borrowing privileges, of $35 million, $27 million, $20 million, $71 million and $416 million with draw periods scheduled to end in 2017, 2018, 2019, 2020 and 2021 and thereafter, respectively. |
Based upon outstanding balances, and excluding purchased impaired loans, at December 31, 2016, for home equity lines of credit for which the borrower can no longer draw (e.g., draw period has ended or borrowing privileges have been terminated), approximately 3% were 30-89 days past due and approximately 6% were 90 days or more past due, which are accounted for as nonperforming. Generally, when a borrower becomes 60 days past due, we terminate borrowing privileges and those privileges are not subsequently reinstated. At that point, we continue our collection/recovery processes, which may include loan modification resulting in a loan that is classified as a TDR.
Auto Loan Portfolio
The auto loan portfolio totaled $12.4 billion as of December 31, 2016, or 6% of our total loan portfolio. Of that total, $10.8 billion resides in the indirect auto portfolio, $1.3 billion in the direct auto portfolio, and $.3 billion in acquired or securitized portfolios, which has been declining as no pools have been recently acquired. Indirect auto loan applications are generated from franchised automobile dealers. This business is strategically aligned with our core retail business.
We have elected not to pursue non-prime auto lending as evidenced by an average new loan origination FICO score during 2016 of 760 for indirect auto loans and 775 for direct auto loans. As of December 31, 2016, .4% of our auto loan portfolio was nonperforming and .5% of the portfolio was accruing past due. We offer both new and used automobile financing to customers through our various channels. The portfolio was composed of 57% new vehicle loans and 43% used vehicle loans at December 31, 2016.
The auto loan portfolios performance is measured monthly, including updated collateral values that are obtained monthly and updated FICO scores that are obtained at least quarterly. For internal reporting and risk management, we analyze the portfolio by product channel and product type, and regularly evaluate default and delinquency experience. As part of our overall risk analysis and monitoring, we segment the portfolio by loan structure, collateral attributes, and credit metrics which include FICO score, loan-to-value and term.
Energy Related Loan Portfolio
Our portfolio of loans outstanding in the oil and gas industry totaled $2.4 billion as of December 31, 2016, or 1% of our total loan portfolio and 2% of our total commercial lending portfolio. This portfolio comprised approximately $1.0 billion in the midstream and downstream sectors, $.8 billion to oil services companies and $.6 billion to upstream sectors. Of the oil services portfolio, approximately $.2 billion is not asset-based or investment grade. Nonperforming loans in the oil and gas sector as of December 31, 2016 totaled $184 million, or 8% of total nonperforming assets.
Our portfolio of loans outstanding in the coal industry totaled $.4 billion as of December 31, 2016, or less than 1% of both our total loan portfolio and our total commercial lending portfolio. Nonperforming loans in the coal industry as of December 31, 2016 totaled $61 million, or 3% of total nonperforming assets.
Loan Modifications and Troubled Debt Restructurings
Consumer Loan Modifications
We modify loans under government and PNC-developed programs based upon our commitment to help eligible homeowners and borrowers avoid foreclosure, where appropriate. Initially, a borrower is evaluated for a modification under a government program. If a borrower does not qualify under a government program, the borrower is then evaluated under a PNC program. Our programs utilize both temporary and permanent modifications and typically reduce the interest rate, extend the term and/or defer principal. Loans that are either temporarily or permanently modified under programs involving a change to loan terms are generally classified as TDRs. Further, loans that have certain types of payment plans and trial payment arrangements which do not include a contractual change to loan terms may be classified as TDRs.
25
A temporary modification, with a term between three and 24 months, involves a change in original loan terms for a period of time and reverts to a calculated exit rate for the remaining term of the loan as of a specific date. A permanent modification, with a term greater than 24 months, is a modification in which the terms of the original loan are changed. Permanent modification programs generally result in principal forgiveness, interest rate reduction, term extension, capitalization of past due amounts, interest-only period or deferral of principal.
We also monitor the success rates and delinquency status of our loan modification programs to assess their effectiveness in serving our borrowers and servicing customers needs while mitigating credit losses. Table 19 provides the number of accounts and unpaid principal balance of modified consumer real estate related loans at the end of each year presented.
Table 19: Consumer Real Estate Related Loan Modifications
| December 31, 2016 | December 31, 2015 | |||||||||||||||
| Dollars in millions |
Number of Accounts |
Unpaid Principal Balance |
Number of Accounts |
Unpaid Principal Balance |
||||||||||||
| Temporary modifications |
3,484 | $ | 258 | 4,469 | $ | 337 | ||||||||||
| Permanent modifications |
23,904 | 2,693 | 24,055 | 2,809 | ||||||||||||
|
|
|
|
|
|
|
|
|
|||||||||
| Total consumer real estate related loan modifications |
27,388 | $ | 2,951 | 28,524 | $ | 3,146 | ||||||||||
|
|
|
|
|
|
|
|
|
|||||||||
Commercial Loan Modifications
Modifications of terms for commercial loans are based on individual facts and circumstances. Commercial loan modifications may involve reduction of the interest rate, extension of the loan term and/or forgiveness of principal. Modified commercial loans are usually already nonperforming prior to modification. We evaluate these modifications for TDR classification based upon whether we granted a concession to a borrower experiencing financial difficulties.
Troubled Debt Restructurings
A TDR is a loan whose terms have been restructured in a manner that grants a concession to a borrower experiencing financial difficulties. TDRs result from our loss mitigation activities and include rate reductions, principal forgiveness, postponement/reduction of scheduled amortization and extensions, which are intended to minimize economic loss and to avoid foreclosure or repossession of collateral. Additionally, TDRs also result from court imposed concessions (e.g. a Chapter 7 bankruptcy where the debtor is discharged from personal liability to us and a court approved Chapter 13 bankruptcy repayment plan).
Table 20: Summary of Troubled Debt Restructurings (a)
| In millions |
December 31 2016 |
December 31 2015 |
Change | |||||||||||||
| $ | % | |||||||||||||||
| Total consumer lending |
$ | 1,793 | $ | 1,917 | $ | (124 | ) | (6 | )% | |||||||
| Total commercial lending |
428 | 434 | (6 | ) | (1 | )% | ||||||||||
|
|
|
|
|
|
|
|||||||||||
| Total TDRs |
$ | 2,221 | $ | 2,351 | $ | (130 | ) | (6 | )% | |||||||
|
|
|
|
|
|
|
|||||||||||
| Nonperforming |
$ | 1,112 | $ | 1,119 | $ | (7 | ) | (1 | )% | |||||||
| Accruing (b) |
1,109 | 1,232 | (123 | ) | (10 | )% | ||||||||||
|
|
|
|
|
|
|
|||||||||||
| Total TDRs |
$ | 2,221 | $ | 2,351 | $ | (130 | ) | (6 | )% | |||||||
|
|
|
|
|
|
|
|||||||||||
| (a) | Amounts in table represent recorded investment, which includes the unpaid principal balance plus accrued interest and net accounting adjustments, less any charge-offs. Recorded investment does not include any associated valuation allowance. |
| (b) | Accruing loans include consumer credit card loans and loans that have demonstrated a period of at least six months of performance under the restructured terms and are excluded from nonperforming loans. |
Excluded from TDRs are $1.2 billion of consumer loans held for sale, loans accounted for under the fair value option and pooled purchased impaired loans, as well as certain government insured or guaranteed loans at both December 31, 2016 and December 31, 2015. Nonperforming TDRs represented approximately 52% and 53% of total nonperforming loans, and 50% and 48% of total TDRs at December 31, 2016 and December 31, 2015, respectively. The remaining portion of TDRs represents TDRs that have been returned to accrual accounting after performing under the restructured terms for at least six consecutive months.
Allowances for Loan and Lease Losses and Unfunded Loan Commitments and Letters of Credit
We maintain an ALLL to absorb losses from the loan and lease portfolio and determine this allowance based on quarterly assessments of the estimated probable credit losses incurred in the loan and lease portfolio. Our total ALLL of $2.6 billion at December 31, 2016 consisted of $1.5 billion and $1.1 billion established for the commercial lending and consumer lending categories, respectively. We maintain the ALLL at a level that we believe to be appropriate to absorb estimated probable credit losses incurred in the loan and lease
26
portfolio as of the balance sheet date. The reserve calculation and determination process is dependent on the use of key assumptions. Key reserve assumptions and estimation processes react to and are influenced by observed changes in loan and lease portfolio performance experience, the financial strength of the borrower, and economic conditions. Key reserve assumptions are periodically updated.
We establish specific allowances for loans considered impaired using methods prescribed by GAAP. All impaired loans are subject to individual analysis, except leases and large groups of smaller-balance homogeneous loans which may include, but are not limited to, credit card, residential real estate secured and consumer installment loans. Specific allowances for individual loans (including commercial and consumer TDRs) are determined based on an analysis of the present value of expected future cash flows from the loans discounted at their effective interest rate, observable market price or the fair value of the underlying collateral.
Reserves are established for non-impaired commercial loan classes based on probability of default (PD) and loss given default (LGD) credit risk ratings.
Our commercial pool reserve methodology is sensitive to changes in key risk parameters such as PD and LGD. The results of these parameters are then applied to the loan balance and unfunded loan commitments and letters of credit to determine the amount of the respective reserves. The majority of the commercial portfolio is secured by collateral, including loans to asset-based lending customers, which generally demonstrate lower LGD compared to loans not secured by collateral. Our PDs and LGDs are primarily determined using internal commercial loan loss data. This internal data is supplemented with third-party data and management judgment, as deemed necessary. We continue to evaluate and enhance our use of internal commercial loss data and will periodically update our PDs and LGDs as well as consider third-party data, regulatory guidance and management judgment.
Allocations to non-impaired consumer loan classes are primarily based upon a roll-rate model which uses statistical relationships, calculated from historical data that estimate the movement of loan outstandings through the various stages of delinquency and ultimately charge-off.
A portion of the ALLL is related to qualitative and measurement factors. These factors may include, but are not limited to, the following:
| | Industry concentrations and conditions, |
| | Recent credit quality trends, |
| | Recent loss experience in particular portfolios, |
| | Recent macro-economic factors, |
| | Model imprecision, |
| | Changes in lending policies and procedures, |
| | Timing of available information, including the performance of first lien positions, and |
| | Limitations of available historical data. |
Our determination of the ALLL for non-impaired loans is sensitive to the risk grades assigned to commercial loans and loss rates for consumer loans. There are several other qualitative and quantitative factors considered in determining the ALLL. This sensitivity analysis does not necessarily reflect the nature and extent of future changes in the ALLL. It is intended to provide insight into the impact of adverse changes to risk grades and loss rates only and does not imply any expectation of future deterioration in the risk ratings or loss rates. Given the current processes used, we believe the risk grades and loss rates currently assigned are appropriate. In the hypothetical event that the aggregate weighted average commercial loan risk grades would experience a 1% deterioration, assuming all other variables remain constant, the allowance for commercial loans would increase by approximately $40 million as of December 31, 2016. In the hypothetical event that consumer loss rates would increase by 10%, assuming all other variables remain constant, the allowance for consumer loans would increase by approximately $25 million at December 31, 2016.
Purchased impaired loans are initially recorded at fair value and applicable accounting guidance prohibits the carry over or creation of valuation allowances at acquisition. Because the initial fair values of these loans already reflect a credit component, additional reserves are established when performance is expected to be worse than our expectations as of the acquisition date. At December 31, 2016, we had established reserves of $.3 billion for purchased impaired loans. In addition, loans (purchased impaired and non-impaired) acquired after January 1, 2009 were recorded at fair value. No allowance for loan losses was carried over and no allowance was created at the date of acquisition.
In determining the appropriateness of the ALLL, we make specific allocations to impaired loans and allocations to portfolios of commercial and consumer loans. We also allocate reserves to provide coverage for probable losses incurred in the portfolio at the balance sheet date based upon current market conditions, which may not be reflected in historical loss data. Commercial lending is the largest category of credits and is sensitive to changes in assumptions and judgments underlying the determination of the ALLL.
27
In addition to the ALLL, we maintain an allowance for unfunded loan commitments and letters of credit. We report this allowance as a liability on our Consolidated Balance Sheet. We maintain the allowance for unfunded loan commitments and letters of credit at a level we believe is appropriate to absorb estimated probable losses on these unfunded credit facilities. We determine this amount using estimates of the probability of the ultimate funding and losses related to those credit exposures. Other than the estimation of the probability of funding, this methodology is very similar to the one we use for determining our ALLL.
See Note 1 Accounting Policies and Note 3 Asset Quality in the Notes To Consolidated Financial Statements in Item 8 of this Report for further information on certain key asset quality indicators that we use to evaluate our portfolios and establish the allowances.
Table 21: Allowance for Loan and Lease Losses
| Dollars in millions |
2016 | 2015 | ||||||
| January 1 |
$ | 2,727 | $ | 3,331 | ||||
| Total net charge-offs |
(543 | ) | (386 | ) | ||||
| Provision for credit losses |
433 | 255 | ||||||
| Net change in allowance for unfunded loan commitments and letters of credit |
(40 | ) | (2 | ) | ||||
| Net recoveries / (write-offs) of purchased impaired loans and other |
12 | (471 | ) | |||||
|
|
|
|
|
|||||
| December 31 |
$ | 2,589 | $ | 2,727 | ||||
|
|
|
|
|
|||||
| Net charge-offs to average loans (for the year ended) |
.26 | % | .19 | % | ||||
| Allowance for loan and lease losses to total loans |
1.23 | 1.32 | ||||||
|
|
|
|
|
|||||
| Commercial lending net charge-offs |
$ | (185 | ) | $ | (15 | ) | ||
| Consumer lending net charge-offs |
(358 | ) | (371 | ) | ||||
|
|
|
|
|
|||||
| Total net charge-offs |
$ | (543 | ) | $ | (386 | ) | ||
|
|
|
|
|
|||||
| Net charge-offs to average loans (for the year ended) |
||||||||
| Commercial lending |
.14 | % | .01 | % | ||||
| Consumer lending |
.50 | .50 | ||||||
|
|
|
|
|
|||||
At December 31, 2016, total ALLL to total nonperforming loans was 121%. The comparable amount for December 31, 2015 was 128%. These ratios are 89% and 98%, respectively, when excluding the $.7 billion and $.6 billion of ALLL at December 31, 2016 and December 31, 2015, respectively, allocated to consumer loans and lines of credit not secured by residential real estate and purchased impaired loans. We have excluded from these ratios purchased impaired loans, consumer loans and consumer lines of credit not secured by real estate that are excluded from nonperforming loans. See Table 15 within this Credit Risk Management section for additional information.
The ALLL balance increases or decreases across periods in relation to fluctuating risk factors, including asset quality trends, net charge-offs and changes in aggregate portfolio balances. During 2016, overall credit quality remained relatively stable despite negative impacts from certain energy related loans, which resulted in an ALLL balance decline of $138 million, or 5.1% to $2.6 billion as of December 31, 2016 compared to December 31, 2015.
See Note 1 Accounting Policies and Note 4 Allowances for Loan and Lease Losses in the Notes To Consolidated Financial Statements in Item 8 of this Report for additional information on the ALLL.
The following table summarizes our loan charge-offs and recoveries.
28
Table 22: Loan Charge-Offs and Recoveries
| Year ended December 31 Dollars in millions |
Gross Charge-offs |
Recoveries | Net Charge-offs / (Recoveries) |
Percent of Average Loans |
||||||||||||
| 2016 |
||||||||||||||||
| Commercial |
$ | 332 | $ | 117 | $ | 215 | .21 | % | ||||||||
| Commercial real estate |
26 | 51 | (25 | ) | (.09 | )% | ||||||||||
| Equipment lease financing |
5 | 10 | (5 | ) | (.07 | )% | ||||||||||
| Home equity |
143 | 84 | 59 | .19 | % | |||||||||||
| Residential real estate |
14 | 9 | 5 | .03 | % | |||||||||||
| Credit card |
161 | 19 | 142 | 2.90 | % | |||||||||||
| Other consumer |
205 | 53 | 152 | .70 | % | |||||||||||
|
|
|
|
|
|
|
|||||||||||
| Total |
$ | 886 | $ | 343 | $ | 543 | .26 | % | ||||||||
|
|
|
|
|
|
|
|||||||||||
| 2015 |
||||||||||||||||
| Commercial |
$ | 206 | $ | 170 | $ | 36 | .04 | % | ||||||||
| Commercial real estate |
44 | 66 | (22 | ) | (.09 | )% | ||||||||||
| Equipment lease financing |
5 | 4 | 1 | .01 | % | |||||||||||
| Home equity |
181 | 93 | 88 | .26 | % | |||||||||||
| Residential real estate |
24 | 13 | 11 | .08 | % | |||||||||||
| Credit card |
160 | 21 | 139 | 3.06 | % | |||||||||||
| Other consumer |
185 | 52 | 133 | .60 | % | |||||||||||
|
|
|
|
|
|
|
|||||||||||
| Total |
$ | 805 | $ | 419 | $ | 386 | .19 | % | ||||||||
|
|
|
|
|
|
|
|||||||||||
See Note 1 Accounting Policies in the Notes To Consolidated Financial Statements in Item 8 of this Report regarding changes in the ALLL.
Residential Mortgage Repurchase Obligations
As discussed in Note 2 Loan Sale and Servicing Activities and Variable Interest Entities in the Notes To Consolidated Financial Statements in Item 8 of this Report, we have sold residential mortgage loans directly or indirectly through securitization and loan sale transactions in which we have continuing involvement. One form of continuing involvement includes certain loan repurchase obligations associated with the transferred assets.
While residential mortgage loans are sold on a non-recourse basis, we assume certain loan repurchase obligations associated with mortgage loans we have sold to investors. These loan repurchase obligations primarily relate to situations where we are alleged to have breached certain origination covenants and representations and warranties made to purchasers of the loans in the respective purchase and sale agreements. Our historical exposure and activity associated with Agency securitization repurchase obligations has primarily been related to transactions with FNMA and FHLMC, as indemnification and repurchase losses associated with FHA and VA-insured and uninsured loans pooled in GNMA securitizations historically have been minimal. In addition to indemnification and repurchase risk, we face other risks of loss with respect to our participation in these programs, some of which are described in Note 19 Legal Proceedings in the Notes To Consolidated Financial Statements in Item 8 of this Report with respect to governmental inquiries related to FHA-insured loans. Repurchase obligation activity associated with residential mortgages is reported in the Retail Banking segment.
Origination and sale of residential mortgages is an ongoing business activity and, accordingly, management continually assesses the need to recognize indemnification and repurchase liabilities pursuant to the associated investor sale agreements. We establish indemnification and repurchase liabilities for estimated losses on sold mortgages for which indemnification is expected to be provided or for loans that are expected to be repurchased. To estimate the mortgage repurchase liability arising from breaches of representations and warranties, we consider the following factors: (i) borrower performance in our historically sold portfolio (both actual and estimated future defaults); (ii) the level of outstanding unresolved repurchase claims; (iii) estimated probable future repurchase claims, considering information about expected investor behaviors, delinquent and liquidated loans, resolved and unresolved mortgage insurance rescission notices and our historical experience with claim rescissions; (iv) the potential ability to cure the defects identified in the repurchase claims (rescission rate); (v) the availability of legal defenses; and (vi) the estimated severity of loss upon repurchase of the loan or collateral, make-whole settlement or indemnification.
29
Our repurchase obligations involve Agency securitizations and other loan sales with FNMA and FHLMC subsequent to 2008, as well as Agency securitizations with GNMA and Non-Agency securitizations and other loan sales with private investors. The unpaid
principal balance of loans associated with our exposure to repurchase obligations totaled $60.5 billion at December 31, 2016, of which $.9 billion was 90 days or more delinquent. The comparative amounts were $65.3 billion and $1.2 billion, respectively, at December 31, 2015. At December 31, 2016 and December 31, 2015, the residential mortgage indemnification and repurchase liability for estimated losses on indemnification and repurchase claims totaled $66 million and $94 million, respectively, and was included in Other liabilities on the Consolidated Balance Sheet.
Liquidity and Capital Management
Liquidity Risk
Liquidity risk has two fundamental components. The first is potential loss assuming we were unable to meet our funding requirements at a reasonable cost. The second is the potential inability to operate our businesses because adequate contingent liquidity is not available. We manage liquidity risk at the consolidated company level (bank, parent company, and nonbank subsidiaries combined) to help ensure that we can obtain cost-effective funding to meet current and future obligations under both normal business as usual and stressful circumstances, and to help ensure that we maintain an appropriate level of contingent liquidity.
Management monitors liquidity through a series of early warning indicators that may indicate a potential market, or PNC-specific, liquidity stress event. In addition, management performs a set of liquidity stress tests over multiple time horizons with varying levels of severity and maintains a contingency funding plan to address a potential stress event. In the most severe liquidity stress simulation, we assume that our liquidity position is under pressure, while the market in general is under systemic pressure. The simulation considers, among other things, the impact of restricted access to both secured and unsecured external sources of funding, accelerated run-off of customer deposits, valuation pressure on assets and heavy demand to fund committed obligations. Parent company liquidity guidelines are designed to help ensure that sufficient liquidity is available to meet our parent company obligations over the succeeding 24-month period. Liquidity-related risk limits are established within our Enterprise Liquidity Management Policy and supporting policies. Management committees, including the Asset and Liability Committee, and the Board of Directors and its Risk Committee regularly review compliance with key established limits.
In addition to these liquidity monitoring measures and tools described above, we also monitor our liquidity by reference to the LCR, a regulatory minimum liquidity requirement designed to ensure that covered banking organizations maintain an adequate level of liquidity to meet net liquidity needs over the course of a 30-day stress scenario. The LCR is calculated by dividing the amount of an institutions high quality, unencumbered liquid assets (HQLA), as defined and calculated in accordance with the LCR rules, by its estimated net cash outflows, with net cash outflows determined by applying the assumed outflow factors in the LCR rules. The resulting quotient is expressed as a percentage. The minimum LCR that PNC and PNC Bank were required to maintain was 90% in 2016 and the minimum increased to 100% in 2017. PNC and PNC Bank calculate the LCR on a daily basis and as of December 31, 2016, the LCR for PNC and PNC Bank exceeded the 2017 fully phased-in requirement of 100%.
We provide additional information regarding regulatory liquidity requirements and their potential impact on us in the Supervision and Regulation section of Item 1 Business and Item 1A Risk Factors in our 2016 Form 10-K.
Sources of Funding
Our largest source of liquidity on a consolidated basis is the customer deposit base generated by our retail and commercial banking businesses. These deposits provide relatively stable and low-cost funding. Total deposits increased to $257.2 billion at December 31, 2016 from $249.0 billion at December 31, 2015, driven by growth in demand and savings deposits, which reflected in part a shift from money market deposits, partially offset by a decline in time deposits. Certain assets determined by us to be liquid and unused borrowing capacity from a number of sources are also available to maintain our liquidity position.
At December 31, 2016, our liquid assets consisted of short-term investments (Federal funds sold, resale agreements, trading securities and interest-earning deposits with banks) totaling $29.6 billion and securities available for sale totaling $60.1 billion. The level of liquid assets fluctuates over time based on many factors, including market conditions, loan and deposit growth and balance sheet management activities. Of our total liquid assets of $89.7 billion, we had $4.5 billion of securities available for sale and trading securities pledged as collateral to secure public and trust deposits, repurchase agreements and for other purposes. In addition, $5.0 billion of securities held to maturity were also pledged as collateral for these purposes.
We also obtain liquidity through the issuance of traditional forms of funding, including long-term debt (senior notes, subordinated debt and FHLB advances) and short-term borrowings (Federal funds purchased, securities sold under repurchase agreements, commercial paper and other short-term borrowings).
Under PNC Banks 2014 bank note program, as amended, PNC Bank may from time to time offer up to $40.0 billion aggregate principal amount outstanding at any one time of its unsecured senior and subordinated notes with maturity dates more than nine months (in the case of senior notes) and five years or more (in the case of subordinated notes) from their date of issue. At December 31, 2016, PNC Bank had $24.8 billion of notes outstanding under this program of which $19.1 billion were senior bank notes and $5.7 billion were subordinated bank notes. The following table details issuances for the three months ended December 31, 2016:
30
Table 23: PNC Bank Notes Issued During Fourth Quarter 2016
| Issuance Date |
Amount |
Description of Issuance |
||
| December 9, 2016 | $600 million | Senior notes with a maturity date of December 7, 2018. Interest is payable semi-annually at a fixed rate of 1.700% on June 7 and December 7 of each year, beginning June 7, 2017. | ||
| December 9, 2016 | $750 million | Senior notes with a maturity date of December 9, 2021. Interest is payable semi-annually at a fixed rate of 2.550% on June 9 and December 9 of each year, beginning June 9, 2017. | ||
| December 9, 2016 | $400 million | Floating rate senior notes with a maturity date of December 7, 2018. Interest is payable at the 3-month LIBOR rate, reset quarterly, plus a spread of .40% per annum on March 7, June 7, September 7 and December 7 of each year, beginning on March 7, 2017. | ||
See Note 23 Subsequent Events for information on the February 17, 2017 issuance of 2.625% Senior Notes due February 17, 2022 in the principal amount of $1.0 billion by PNC Bank.
Total senior and subordinated debt, on a consolidated basis, increased due to the following activity:
Table 24: Senior and Subordinated Debt
| In billions |
2016 | |||
| January 1 |
$ | 29.9 | ||
| Issuances |
5.6 | |||
| Calls and maturities |
(4.2 | ) | ||
| Other |
(0.3 | ) | ||
|
|
|
|||
| December 31 |
$ | 31.0 | ||
|
|
|
|||
PNC Bank is a member of the FHLB-Pittsburgh and, as such, has access to advances from FHLB-Pittsburgh secured generally by residential mortgage loans, other mortgage-related loans and commercial mortgage-backed securities. At December 31, 2016, our unused secured borrowing capacity was $27.5 billion with the FHLB-Pittsburgh. Total FHLB borrowings decreased to $17.5 billion at December 31, 2016 compared with $20.1 billion at December 31, 2015 as maturities outpaced draws.
The FHLB-Pittsburgh also periodically provides standby letters of credit on behalf of PNC Bank to secure certain public deposits. If the FHLB-Pittsburgh is required to make payment for a beneficiarys draw, the payment amount is converted into a collateralized advance to PNC Bank. At December 31, 2016, standby letters of credit issued on our behalf by the FHLB-Pittsburgh totaled $4.4 billion.
PNC Bank has the ability to offer up to $10.0 billion of its commercial paper to provide additional liquidity. As of December 31, 2016, there were no issuances outstanding under this program.
PNC Bank can also borrow from the Federal Reserve Bank discount window to meet short-term liquidity requirements. The Federal Reserve Bank, however, is not viewed as a primary means of funding our routine business activities, but rather as a potential source of liquidity in a stressed environment or during a market disruption. These potential borrowings are secured by commercial loans. At December 31, 2016, our unused secured borrowing capacity was $17.5 billion with the Federal Reserve Bank.
Borrowed funds come from a diverse mix of short-term and long-term funding sources. See Note 10 Borrowed Funds and the Funding sources section of the Consolidated Balance Sheet Review for additional information related to our Borrowings.
In addition to managing liquidity risk at the consolidated company level, we monitor the parent companys liquidity. The parent companys contractual obligations consist primarily of debt service related to parent company borrowings and funding non-bank affiliates. Additionally, the parent company maintains adequate liquidity to fund discretionary activities such as paying dividends to our shareholders, share repurchases, and acquisitions.
As of December 31, 2016, available parent company liquidity totaled $4.5 billion. Parent company liquidity is primarily held in intercompany short-term investments, the terms of which provide for the availability of cash in 31 days or less. Investments with longer durations may also be acquired, but if so, the related maturities are aligned with scheduled cash needs, such as the maturity of parent company debt obligations.
31
The principal source of parent company liquidity is the dividends it receives from its subsidiary bank, which may be impacted by the following:
| | Bank-level capital needs, |
| | Laws and regulations, |
| | Corporate policies, |
| | Contractual restrictions, and |
| | Other factors. |
There are statutory and regulatory limitations on the ability of a national bank to pay dividends or make other capital distributions or to extend credit to the parent company or its non-bank subsidiaries. The amount available for dividend payments by PNC Bank to the parent company without prior regulatory approval was approximately $1.7 billion at December 31, 2016. See Note 18 Regulatory Matters in the Notes To Consolidated Financial Statements in Item 8 of this Report for a further discussion of these limitations. We provide additional information on certain contractual restrictions in Note 15 Equity in the Notes To Consolidated Financial Statements in Item 8 of this Report.
In addition to dividends from PNC Bank, other sources of parent company liquidity include cash and investments, as well as dividends and loan repayments from other subsidiaries and dividends or distributions from equity investments. We can also generate liquidity for the parent company and PNCs non-bank subsidiaries through the issuance of debt and equity securities, including certain capital instruments, in public or private markets and commercial paper. The parent company has the ability to offer up to $5.0 billion of commercial paper to provide additional liquidity. As of December 31, 2016, there were no commercial paper issuances outstanding. The parent company has an effective shelf registration statement pursuant to which we can issue additional debt, equity and other capital instruments.
See Note 23 Subsequent Events for information on the February 7, 2017 issuance of $575 million Floating Rate Senior Notes due August 7, 2018 off of the shelf registration statement.
Total parent company borrowings outstanding totaled $6.2 billion at December 31, 2016 compared with $7.5 billion at December 31, 2015. The decline was primarily attributable to maturities of $1.2 billion during the year. As of December 31, 2016, there were approximately $601 million of parent company borrowings with contractual maturities of less than one year.
Commitments
The following tables set forth contractual obligations and various other commitments as of December 31, 2016 representing required and potential cash outflows.
| Table 25: Contractual Obligations | Payment Due By Period | |||||||||||||||||||
| December 31, 2016 in millions |
Total | Less than one year |
One to three years |
Four to five years |
After five years |
|||||||||||||||
| Remaining contractual maturities of time deposits |
$ | 17,560 | $ | 12,200 | $ | 1,413 | $ | 1,908 | $ | 2,039 | ||||||||||
| Borrowed funds (a) |
52,706 | 14,381 | 22,516 | 6,806 | 9,003 | |||||||||||||||
| Minimum annual rentals on noncancellable leases |
2,532 | 381 | 657 | 459 | 1,035 | |||||||||||||||
| Nonqualified pension and postretirement benefits |
506 | 56 | 112 | 104 | 234 | |||||||||||||||
| Purchase obligations (b) |
1,029 | 394 | 397 | 170 | 68 | |||||||||||||||
|
|
|
|
|
|
|
|
|
|
|
|||||||||||
| Total contractual cash obligations |
$ | 74,333 | $ | 27,412 | $ | 25,095 | $ | 9,447 | $ | 12,379 | ||||||||||
|
|
|
|
|
|
|
|
|
|
|
|||||||||||
| (a) | Includes basis adjustment relating to accounting hedges. |
| (b) | Includes purchase obligations for goods and services covered by noncancellable contracts and contracts including cancellation fees. |
At December 31, 2016, we had unrecognized tax benefits of $22 million, which represents a reserve for tax positions that we have taken in our tax returns which ultimately may not be sustained upon examination by taxing authorities. Since the ultimate amount and timing of any future cash settlements cannot be predicted with reasonable certainty, this estimate has been excluded from the contractual obligations table. See Note 17 Income Taxes in the Notes To Consolidated Financial Statements in Item 8 of this Report for additional information.
Our contractual obligations totaled $79.1 billion at December 31, 2015. The decrease in the comparison is primarily attributable to declines in borrowed funds and time deposits. See Funding Sources in the Consolidated Balance Sheet Review section of this Item 7 for additional information regarding our funding sources.
32
| Table 26: Other Commitments (a) | Amount Of Commitment Expiration By Period | |||||||||||||||||||
| December 31, 2016 in millions |
Total Amounts Committed |
Less than one year |
One to three years |
Four to five years |
After five years |
|||||||||||||||
| Commitments to extend credit (b) |
$ | 151,981 | $ | 57,413 | $ | 55,045 | $ | 38,617 | $ | 906 | ||||||||||
| Net outstanding standby letters of credit (c) |
8,324 | 4,327 | 2,943 | 1,021 | 33 | |||||||||||||||
| Reinsurance agreements (d) |
1,835 | 4 | 24 | 17 | 1,790 | |||||||||||||||
| Standby bond purchase agreements |
790 | 541 | 225 | 24 | ||||||||||||||||
| Other commitments (e) |
967 | 564 | 334 | 44 | 25 | |||||||||||||||
|
|
|
|
|
|
|
|
|
|
|
|||||||||||
| Total commitments |
$ | 163,897 | $ | 62,849 | $ | 58,571 | $ | 39,723 | $ | 2,754 | ||||||||||
|
|
|
|
|
|
|
|
|
|
|
|||||||||||
| (a) | Other commitments are funding commitments that could potentially require performance in the event of demands by third parties or contingent events. Loan commitments are reported net of syndications, assignments and participations. |
| (b) | Commitments to extend credit, or net unfunded loan commitments, represent arrangements to lend funds or provide liquidity subject to specified contractual conditions. |
| (c) | Includes $3.9 billion of standby letters of credit that support remarketing programs for customers variable rate demand notes. |
| (d) | Reinsurance agreements are with third-party insurers related to insurance sold to or placed on behalf of our customers. Balances represent estimates based on availability of financial information. |
| (e) | Includes other commitments of $215 million that were not on our Consolidated Balance Sheet. The remaining $752 million of other commitments were included in Other liabilities on our Consolidated Balance Sheet. |
Our total commitments were $155.1 billion at December 31, 2015. The increase in the comparison is primarily attributable to an increase in commitments to extend credit, partially offset by declines in net outstanding standby letters of credit.
Credit Ratings
PNCs credit ratings affect the cost and availability of short- and long-term funding, collateral requirements for certain derivative instruments, and the ability to offer certain products.
In general, rating agencies base their ratings on many quantitative and qualitative factors, including capital adequacy, liquidity, asset quality, business mix, level and quality of earnings, and the current legislative and regulatory environment, including implied government support. In addition, rating agencies themselves have been subject to scrutiny arising from the most recent financial crisis and could make or be required to make substantial changes to their ratings policies and practices, particularly in response to legislative and regulatory changes. Potential changes in the legislative and regulatory environment and the timing of those changes could impact our ratings, which as noted above, could impact our liquidity and financial condition. A decrease, or potential decrease, in credit ratings could impact access to the capital markets and/or increase the cost of debt, and thereby adversely affect liquidity and financial condition.
Table 27: Credit Ratings as of December 31, 2016 for PNC and PNC Bank
| Moodys | Standard & Poors |
Fitch | ||||||||||
| PNC |
||||||||||||
| Senior debt |
A3 | A- | A+ | |||||||||
| Subordinated debt |
A3 | BBB+ | A | |||||||||
| Preferred stock |
Baa2 | BBB- | BBB- | |||||||||
| PNC Bank |
||||||||||||
| Senior debt |
A2 | A | A+ | |||||||||
| Subordinated debt |
A3 | A- | A | |||||||||
| Long-term deposits |
Aa2 | A | AA- | |||||||||
| Short-term deposits |
P-1 | A-1 | F+ | |||||||||
| Short-term notes |
P-1 | A-1 | F1 | |||||||||
Capital Management
We manage our funding and capital positions by making adjustments to our balance sheet size and composition, issuing or redeeming debt, issuing equity or other capital instruments, executing treasury stock transactions and capital redemptions, and managing dividend policies and retaining earnings.
For the full year 2016, we returned $3.1 billion of capital to shareholders. Repurchases totaled 22.8 million common shares for $2.0 billion and dividends on common shares were $1.1 billion.
33
We repurchase shares of PNC common stock under share repurchase authorization provided by our Board of Directors in the amount of up to 100 million shares and consistent with capital plans submitted to, and accepted by, the Federal Reserve. Repurchases are made on the open market or in privately negotiated transactions and the extent and timing of share repurchases under authorizations depend on a number of factors including, among others, market and general economic conditions, economic and regulatory capital considerations, alternative uses of capital, the potential impact on our credit ratings, contractual and regulatory limitations, and the results of supervisory assessments of capital adequacy and capital planning processes undertaken by the Federal Reserve as part of the CCAR and DFAST processes.
For the five quarter period ended June 30, 2016, we repurchased 29.9 million shares of PNC common stock for $2.7 billion, which was consistent with the 2015 capital plan accepted by the Federal Reserve as part of our 2015 CCAR submission. Of the total repurchased, 12.0 million shares for $1.0 billion occurred in the first two quarters of 2016.
In connection with the 2016 CCAR process, the Federal Reserve accepted our capital plan, as approved by our Board of Directors, and did not object to our proposed capital actions in April 2016. As provided for in the 2016 capital plan, we announced new share repurchase programs of up to $2.0 billion for the four quarter period beginning in the third quarter of 2016, including repurchases of up to $200 million related to employee benefit plans. We repurchased 10.8 million common shares for $1.0 billion during the third and fourth quarters of 2016 under these share repurchase programs.
In January 2017, we announced a $300 million increase in our share repurchase programs for the four quarter period ended June 30, 2017.
The quarterly cash dividend on common stock was increased to 55 cents from 51 cents effective with the August 5, 2016 dividend payment date.
On November 1, 2016 we issued 525,000 depositary shares, each representing a 1/100th interest in a share of our Fixed-to-Floating Rate Non-Cumulative Perpetual Preferred Stock, Series S, in an underwritten public offering resulting in gross proceeds of $525 million to us before commissions and expenses. We issued 5,250 shares of Series S Preferred Stock to the depositary in this transaction. See Note 15 Equity in the Notes to Consolidated Financial Statements in Item 8 of this Report for more information on the terms of the securities.
See the Supervision and Regulation section of Item 1 Business in our 2016 Form 10-K for further information concerning the CCAR process and the factors the Federal Reserve takes into consideration in its evaluation of capital plans.
See Note 23 Subsequent Events for discussion of our February 2017 announcement of our March 2017 redemption of the Fixed-to-Floating Rate Non-Cumulative Exchangeable Perpetual Trust Securities of PNC Preferred Funding Trust I and PNC Preferred Funding Trust II.
34
Table 28: Basel III Capital
| December 31, 2016 | ||||||||
| Dollars in millions |
2016 Transitional Basel III (a) |
Pro forma Fully Phased-In Basel III (Non-GAAP) (estimated) (b)(c) |
||||||
| Common equity Tier 1 capital |
||||||||
| Common stock plus related surplus, net of treasury stock |
$ | 10,317 | $ | 10,317 | ||||
| Retained earnings |
31,670 | 31,670 | ||||||
| Accumulated other comprehensive income for securities currently and previously held as |
||||||||
| available for sale |
94 | 157 | ||||||
| Accumulated other comprehensive income for pension and other postretirement plans |
(332 | ) | (553 | ) | ||||
| Goodwill, net of associated deferred tax liabilities |
(8,826 | ) | (8,826 | ) | ||||
| Other disallowed intangibles, net of deferred tax liabilities |
(148 | ) | (247 | ) | ||||
| Other adjustments/(deductions) |
(214 | ) | (221 | ) | ||||
|
|
|
|
|
|||||
| Total common equity Tier 1 capital before threshold deductions |
32,561 | 32,297 | ||||||
| Total threshold deductions |
(762 | ) | (1,469 | ) | ||||
|
|
|
|
|
|||||
| Common equity Tier 1 capital |
31,799 | 30,828 | ||||||
|
|
|
|
|
|||||
| Additional Tier 1 capital |
||||||||
| Preferred stock plus related surplus |
3,976 | 3,976 | ||||||
| Noncontrolling interests (d) |
418 | 45 | ||||||
| Other adjustments/(deductions) |
(92 | ) | (113 | ) | ||||
|
|
|
|
|
|||||
| Tier 1 capital |
36,101 | 34,736 | ||||||
|
|
|
|
|
|||||
| Additional Tier 2 capital |
||||||||
| Qualifying subordinated debt |
3,899 | 3,749 | ||||||
| Trust preferred capital securities |
119 | | ||||||
| Allowance for loan and lease losses included in Tier 2 capital |
2,891 | 2,891 | ||||||
| Other (d) |
6 | 10 | ||||||
|
|
|
|
|
|||||
| Total Basel III capital |
$ | 43,016 | $ | 41,386 | ||||
|
|
|
|
|
|||||
| Risk-weighted assets |
||||||||
| Basel III standardized approach risk-weighted assets (e) |
$ | 300,533 | $ | 308,517 | ||||
| Basel III advanced approaches risk-weighted assets (f) |
N/A | $ | 277,896 | |||||
| Average quarterly adjusted total assets |
$ | 355,838 | $ | 355,003 | ||||
| Supplementary leverage exposure (g) |
$ | 421,732 | $ | 420,897 | ||||
|
|
|
|
|
|||||
| Basel III risk-based capital and leverage ratios |
||||||||
| Common equity Tier 1 |
10.6 | % | 10.0 | %(h)(i) | ||||
| Tier 1 |
12.0 | % | 11.3 | %(h)(j) | ||||
| Total |
14.3 | % | 13.4 | %(h)(k) | ||||
| Leverage (l) |
10.1 | % | 9.8 | % | ||||
| Supplementary leverage ratio (m) |
8.6 | % | 8.3 | % | ||||
|
|
|
|
|
|||||
| (a) | Calculated using the regulatory capital methodology applicable to us during 2016. |
| (b) | PNC utilizes the pro forma fully phased-in Basel III capital ratios to assess its capital position (without the benefit of phase-ins), as these ratios represent the regulatory capital standards that will ultimately be applicable to PNC under the final Basel III rules. Pro forma fully phased-in capital amounts, ratios and risk-weighted and leverage-related assets are estimates. |
| (c) | Basel III capital ratios and estimates may be impacted by additional regulatory guidance or analysis and, in the case of those ratios calculated using the advanced approaches, may be subject to variability based on the ongoing evolution, validation and regulatory approval of PNCs models integral to the calculation of advanced approaches risk-weighted assets. |
| (d) | Primarily includes REIT Preferred Securities for transitional and pro forma fully phased-in. |
| (e) | Includes credit and market risk-weighted assets. |
| (f) | Basel III advanced approaches risk-weighted assets are estimated based on the Basel III advanced approaches rules, and include credit, market, and operational risk-weighted assets. During the parallel run qualification phase, PNC has refined the data, models, and internal processes used as part of the advanced approaches for determining risk-weighted assets. We anticipate additional refinements to this estimate through the parallel run qualification phase. |
| (g) | Supplementary leverage exposure is the sum of Adjusted average assets and certain off-balance sheet exposures including undrawn credit commitments and derivative potential future exposures. |
| (h) | Pro forma fully phased-in Basel III capital ratio based on Basel III standardized approach risk-weighted assets and rules. |
| (i) | For comparative purposes only, the pro forma fully phased-in advanced approaches Basel III Common equity Tier 1 capital ratio estimate is 11.1%. This capital ratio is calculated using pro forma fully phased-in Common equity Tier 1 capital and dividing by estimated Basel III advanced approaches risk-weighted assets. |
| (j) | For comparative purposes only, the pro forma fully phased-in advanced approaches Basel III Tier 1 risk-based capital ratio estimate is 12.5%. This capital ratio is calculated using fully phased-in Tier 1 capital and dividing by estimated Basel III advanced approaches risk-weighted assets. |
| (k) | For comparative purposes only, the pro forma fully phased-in advanced approaches Basel III Total capital risk-based capital ratio estimate is 13.9%. This ratio is calculated using fully phased-in Total Basel III capital, which under the advanced approaches, Additional Tier 2 capital includes allowance for loan and lease losses in excess of Basel expected credit losses, if any, up to 0.6% of credit risk related risk-weighted assets, and dividing by estimated Basel III advanced approach risk-weighted assets. |
| (l) | Leverage ratio is calculated based on Tier 1 capital divided by Average quarterly adjusted total assets. |
| (m) | Supplementary leverage ratio is calculated based on Tier 1 capital divided by Supplementary leverage exposure. As advanced approaches banking organizations, PNC and PNC Bank will be subject to a 3% minimum supplementary leverage ratio effective January 1, 2018. |
35
As a result of the phase-in periods included in the final U.S. Basel III regulatory capital rules (Basel III rules), as well as the fact that we remain in the parallel run qualification phase for the advanced approaches, our regulatory risk-based capital ratios in 2016 were based on the definitions of, and deductions from, regulatory capital under the Basel III rules (as such definitions and deductions were phased-in for 2016) and the standardized approach for determining risk-weighted assets. Until we have exited parallel run, our regulatory risk-based Basel III ratios will be calculated using the standardized approach for determining risk-weighted assets, and the definitions of, and deductions from, capital under Basel III (as such definitions and deductions are phased-in through 2019). Once we exit parallel run, our regulatory risk-based capital ratios will be the lower of the ratios calculated under the standardized approach and the advanced approaches. We refer to the capital ratios calculated using the phased-in Basel III provisions in effect for 2016 and, for the risk-based ratios, standardized approach risk-weighted assets, as the 2016 Transitional Basel III ratios. Under the standardized approach for determining credit risk-weighted assets, exposures are generally assigned a pre-defined risk weight. Exposures to high volatility commercial real estate, past due exposures, equity exposures and securitization exposures are generally subject to higher risk weights than other types of exposures.
Under the Basel III rules adopted by the U.S. banking agencies, significant common stock investments in unconsolidated financial institutions, mortgage servicing rights and deferred tax assets must be deducted from capital (subject to a phase-in schedule and net of associated deferred tax liabilities) to the extent they individually exceed 10%, or in the aggregate exceed 15%, of the institutions adjusted common equity Tier 1 capital. Also, Basel III regulatory capital includes (subject to a phase-in schedule) accumulated other comprehensive income related to securities currently and previously held as available for sale, as well as pension and other postretirement plans.
Federal banking regulators have stated that they expect the largest U.S. bank holding companies, including PNC, to have a level of regulatory capital well in excess of the regulatory minimum and have required the largest U.S. bank holding companies, including PNC, to have a capital buffer sufficient to withstand losses and allow them to meet the credit needs of their customers through estimated stress scenarios. We seek to manage our capital consistent with these regulatory principles, and believe that our December 31, 2016 capital levels were aligned with them.
At December 31, 2016, PNC and PNC Bank, our sole bank subsidiary, were both considered well capitalized, based on applicable U.S. regulatory capital ratio requirements. To qualify as well capitalized, PNC must have Transitional Basel III capital ratios of at least 6% for Tier 1 risk-based capital and 10% for Total risk-based capital, and PNC Bank must have Transitional Basel III capital ratios of at least 6.5% for Common equity Tier 1 risk-based capital, 8% for Tier 1 risk-based capital, 10% for Total risk-based capital and a Leverage ratio of at least 5%.
We provide additional information regarding regulatory capital requirements and some of their potential impacts on us in the Supervision and Regulation section of Item 1 Business and Item 1A Risk Factors in our 2016 Form 10-K and Note 18 Regulatory Matters in the Notes To Consolidated Financial Statements in Item 8 of this Report. See the Statistical Information (Unaudited) section of this Report for details on our December 31, 2015 Transitional Basel III and Pro forma fully phased-in Basel III common equity tier 1 capital ratios.
Market Risk Management
Market risk is the risk of a loss in earnings or economic value due to adverse movements in market factors such as interest rates, credit spreads, foreign exchange rates, commodity prices and equity prices. We are exposed to market risk primarily by our involvement in the following activities, among others:
| | Traditional banking activities of gathering deposits and extending loans, |
| | Equity and other investments and activities whose economic values are directly impacted by market factors, and |
| | Fixed income securities, derivatives and foreign exchange activities, as a result of customer activities and securities underwriting. |
We have established enterprise-wide policies and methodologies to identify, measure, monitor and report market risk. Market Risk Management provides independent oversight by monitoring compliance with established guidelines, and reporting significant risks in the business to the Risk Committee of the Board of Directors.
Market Risk Management Interest Rate Risk
Interest rate risk results primarily from our traditional banking activities of gathering deposits and extending loans. Many factors, including economic and financial conditions, movements in interest rates and consumer preferences, affect the difference between the interest that we earn on assets and the interest that we pay on liabilities and the level of our noninterest-bearing funding sources. Due to the repricing term mismatches and embedded options inherent in certain of these products, changes in market interest rates not only affect expected near-term earnings, but also the economic values of these assets and liabilities.
36
Asset and Liability Management centrally manages interest rate risk as prescribed in our risk management policies, which are approved by managements Asset and Liability Committee and the Risk Committee of the Board of Directors.
Sensitivity results and market interest rate benchmarks for the fourth quarters of 2016 and 2015 follow:
Table 29: Interest Sensitivity Analysis
| Fourth Quarter 2016 |
Fourth Quarter 2015 |
|||||||
| Net Interest Income Sensitivity Simulation (a) |
||||||||
| Effect on net interest income in first year from gradual interest rate change over the following 12 months of: |
||||||||
| 100 basis point increase |
2.6 | % | 2.4 | % | ||||
| 100 basis point decrease |
(4.2 | )% | (1.9 | )% | ||||
| Effect on net interest income in second year from gradual interest rate change over the preceding 12 months of: |
||||||||
| 100 basis point increase |
4.7 | % | 5.3 | % | ||||
| 100 basis point decrease |
(8.3 | )% | (5.3 | )% | ||||
| Duration of Equity Model (a) |
||||||||
| Base case duration of equity (in years) |
(2.5 | ) | (4.1 | ) | ||||
| Key Period-End Interest Rates |
||||||||
| One-month LIBOR |
.77 | % | .43 | % | ||||
| Three-year swap |
1.69 | % | 1.42 | % | ||||
| (a) | Given the inherent limitations in certain of these measurement tools and techniques, results become less meaningful as interest rates approach zero. |
In addition to measuring the effect on net interest income assuming parallel changes in current interest rates, we routinely simulate the effects of a number of nonparallel interest rate environments. Table 30 reflects the percentage change in net interest income over the next two 12-month periods assuming (i) the PNC Economists most likely rate forecast, (ii) implied market forward rates and (iii) yield curve slope flattening (a 100 basis point yield curve slope flattening between 1-month and ten-year rates superimposed on current base rates) scenario.
Table 30: Net Interest Income Sensitivity to Alternative Rate Scenarios (Fourth Quarter 2016)
| PNC Economist |
Market Forward |
Slope Flattening |
||||||||||
| First year sensitivity |
1.5 | % | 2.1 | % | (2.4 | )% | ||||||
| Second year sensitivity |
5.1 | % | 3.4 | % | (6.9 | )% | ||||||
All changes in forecasted net interest income are relative to results in a base rate scenario where current market rates are assumed to remain unchanged over the forecast horizon.
When forecasting net interest income, we make assumptions about interest rates and the shape of the yield curve, the volume and characteristics of new business and the behavior of existing on- and off-balance sheet positions. These assumptions determine the future level of simulated net interest income in the base interest rate scenario and the other interest rate scenarios presented in Tables 29 and 30 above. These simulations assume that as assets and liabilities mature, they are replaced or repriced at then current market rates.
The following graph presents the LIBOR/Swap yield curves for the base rate scenario and each of the alternate scenarios one year forward.
37
Table 31: Alternate Interest Rate Scenarios: One Year Forward
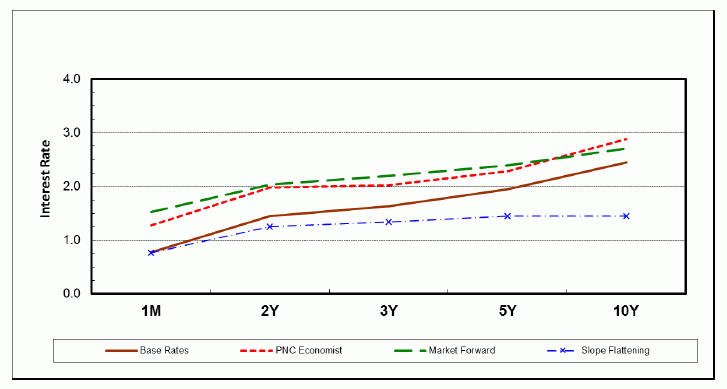
The fourth quarter 2016 interest sensitivity analyses indicate that our Consolidated Balance Sheet is positioned to benefit from an increase in interest rates and an upward sloping interest rate yield curve. We believe that we have the deposit funding base and balance sheet flexibility to adjust, where appropriate and permissible, to changing interest rates and market conditions.
Market Risk Management Customer-Related Trading Risk
We engage in fixed income securities, derivatives and foreign exchange transactions to support our customers investing and hedging activities. These transactions, related hedges and the credit valuation adjustment (CVA) related to our customer derivatives portfolio are marked-to-market daily and reported as customer-related trading activities. We do not engage in proprietary trading of these products.
We use value-at-risk (VaR) as the primary means to measure and monitor market risk in customer-related trading activities. VaR is used to estimate the probability of portfolio losses based on the statistical analysis of historical market risk factors. A diversified VaR reflects empirical correlations across different asset classes. We calculate a diversified VaR at a 95% confidence interval and the results for 2016 and 2015 were within our acceptable limits.
To help ensure the integrity of the models used to calculate VaR for each portfolio and enterprise-wide, we use a process known as backtesting. The backtesting process consists of comparing actual observations of gains or losses against the VaR levels that were calculated at the close of the prior day. Our VaR measure assumes that exposures remain constant and that recent market variability is a good predictor of future variability. Actual observations include customer related revenue and intraday hedging which helps to reduce losses and can reduce the number of instances actual losses exceed the prior day VaR measure. There were two and seven instances during 2016 and 2015, respectively, under our diversified VaR measure where actual losses exceeded the prior day VaR measure and those losses were insignificant. Our portfolio and enterprise-wide VaR models utilize a historical approach with a 500 day look back period.
Customer-related trading revenue was $203 million for full year 2016 compared with $210 million for full year 2015 and is recorded in Other noninterest income and Other interest income on our Consolidated Income Statement. The decrease was mainly due to market interest rate changes impacting valuations for customer-related derivatives, partially offset by higher derivative and fixed income client sales.
Market Risk Management Equity And Other Investment Risk
Equity investment risk is the risk of potential losses associated with investing in both private and public equity markets. In addition to extending credit, taking deposits, securities underwriting and trading financial instruments, we make and manage direct investments in a variety of transactions, including management buyouts, recapitalizations and growth financings in a variety of industries. We also have investments in affiliated and non-affiliated funds that make similar investments in private equity and in debt and equity-oriented hedge funds. The economic and/or book value of these investments and other assets such as loan servicing rights are directly affected by changes in market factors.
38
Various of our business units manage our equity and other investment activities. Our businesses are responsible for making investment decisions within the approved policy limits and associated guidelines.
A summary of our equity investments follows:
Table 32: Equity Investments Summary
| December 31 | December 31 | Change | ||||||||||||||
| In millions |
2016 | 2015 | $ | % | ||||||||||||
| BlackRock |
$ | 6,886 | $ | 6,626 | $ | 260 | 4 | % | ||||||||
| Tax credit investments |
2,090 | 2,254 | (164 | ) | (7 | )% | ||||||||||
| Private equity and other |
1,752 | 1,707 | 45 | 3 | % | |||||||||||
|
|
|
|
|
|
|
|
|
|||||||||
| Total |
$ | 10,728 | $ | 10,587 | $ | 141 | 1 | % | ||||||||
|
|
|
|
|
|
|
|
|
|||||||||
BlackRock
We owned approximately 35 million common stock equivalent shares of BlackRock equity at December 31, 2016, accounted for under the equity method. The primary risk measurement, similar to other equity investments, is economic capital. The Business Segments Review section of this Item 7 includes additional information about BlackRock.
Tax Credit Investments
Included in our equity investments are direct tax credit investments and equity investments held by consolidated entities. These tax credit investment balances included unfunded commitments totaling $.7 billion at both December 31, 2016 and December 31, 2015. These unfunded commitments are included in Other Liabilities on our Consolidated Balance Sheet.
Note 2 Loan Sale and Servicing Activities and Variable Interest Entities in the Notes To Consolidated Financial Statements in Item 8 of this Report has further information on Tax Credit Investments.
Private Equity and Other
The majority of our other equity investments consists of our private equity portfolio. The private equity portfolio is an illiquid portfolio consisted of mezzanine and equity investments that vary by industry, stage and type of investment. Private equity investments carried at estimated fair value totaled $1.4 billion at both December 31, 2016 and December 31, 2015. As of December 31, 2016, $1.1 billion was invested directly in a variety of companies and $.3 billion was invested indirectly through various private equity funds. See Item 1 Business Supervision and Regulation and Item 1A Risk Factors in our 2016 Form 10-K for discussion of the potential impacts of the Volcker Rule provisions of Dodd-Frank on our interests in and of private funds covered by the Volcker Rule.
Included in our other equity investments are Visa Class B common shares, which are recorded at cost. At December 31, 2016, the fair value of our investment in Visa Class B common shares was approximately $452 million and our cost basis was not significant. Visa Class B common shares that we own are transferable only under limited circumstances until they can be converted into shares of the publicly traded class of stock, which cannot happen until the settlement of the pending interchange litigation. Please see Note 6 Fair Value and Note 19 Legal Proceedings in the Notes To Consolidated Financial Statements in Item 8 of this Report for additional information regarding our Visa agreements.
We also have certain other equity investments, the majority of which represent investments in affiliated and non-affiliated funds with both traditional and alternative investment strategies. Net gains related to these investments were not significant during 2016 and 2015.
Impact of Inflation
Our assets and liabilities are primarily financial in nature and typically have varying maturity dates. Accordingly, future changes in prices do not affect the obligations to pay or receive fixed and determinable amounts of money. However, during periods of inflation, there may be a subsequent impact affecting certain fixed costs or expenses, an erosion of consumer and customer purchasing power, and fluctuations in the need or demand for our products and services. Should significant levels of inflation occur, our business could potentially be impacted by, among other things, reducing our tolerance for extending credit or causing us to incur additional credit losses resulting from possible increased default rates.
Financial Derivatives
We use a variety of financial derivatives as part of the overall asset and liability risk management process to help manage exposure to market and credit risk inherent in our business activities. Substantially all such instruments are used to manage risk related to changes in interest rates. Interest rate swaps, interest rate caps and floors, swaptions, options, forwards and futures contracts are the primary instruments we use for interest rate risk management. We also enter into derivatives with customers to facilitate their risk management activities.
39
Financial derivatives involve, to varying degrees, market and credit risk. Periodic cash payments are exchanged for interest rate swaps, options and future contracts. Premiums are also exchanged for options contracts. Therefore, cash requirements and exposure to credit risk are significantly less than the notional amount on these instruments.
Further information on our financial derivatives is presented in Note 1 Accounting Policies, Note 6 Fair Value and Note 13 Financial Derivatives in the Notes To Consolidated Financial Statements in Item 8 of this Report, which is incorporated here by reference.
Not all elements of market and credit risk are addressed through the use of financial derivatives, and such instruments may be ineffective for their intended purposes due to unanticipated market changes, among other reasons.
Operational Risk Management
Operational risk is the risk to the current or projected financial condition and resilience arising from inadequate or failed internal processes or systems, human errors or misconduct, or adverse external events. Operational risk is inherent to the entire organization.
Operational risk management is embedded in our culture and decision-making processes through a systematic approach whereby operational risks and exposures are: 1) identified and assessed; 2) managed through the design and implementation of controls; 3) measured and evaluated against our risk tolerance limits; and 4) appropriately reported to management and the Risk Committee. Strong operational risk management and well-informed risk-based decisions benefit us by improving the customer experience, enhancing compliance, reducing reputational risk, minimizing losses, and establishing an appropriate amount of required operational risk capital held by the bank.
The Operational Risk Management Framework supports our effective and consistent management of operational risk. The primary purpose of the framework is to enable us to understand our operational risks and manage them to the desired risk profile, in line with our Risk Appetite. Additionally, the guidance established within the framework enables management to make well-informed risk-based business decisions.
The framework provides a disciplined and structured process for us to manage operational risk across eight operational risk domains. These domains provide a comprehensive view of operational risk and allow us to discuss operational risk in a standard way, facilitating reporting and ongoing risk mitigation.
The operational risk domains are:
| | Operations: Risk resulting from inadequate or failed internal processes, misconduct or errors of people or fraud. |
| | Compliance: Risk of legal or regulatory sanctions, financial loss, or damage to reputation resulting from failure to comply with laws, regulations, rules, self-regulatory standards, or other regulatory requirements. |
| | Data Management: Risk associated with incomplete or inaccurate data. |
| | Model: Risk associated with the design, implementation, and ongoing use and management of a model. |
| | Technology and Systems: Risk associated with the use, operation, and adoption of technology. |
| | Information Security: Risk resulting from the failure to protect information and ensure appropriate access to, and use and handling of information assets. |
| | Business Continuity: Risk of potential disruptive events to business activities. |
| | Third Party: Risk arising from failure of third party providers to conduct activity in a safe and sound manner and in compliance with contract provisions and applicable laws and regulations. |
We utilize operational risk management programs within the framework, including RCSAs, scenario analysis, and internal and external loss event review and analysis, to assess existing risks, determine potential/emerging risks and evaluate the effectiveness of internal controls. The program tools and methodology enable our business managers to identify potential risks and control gaps.
Lines of business are responsible for identifying, owning, managing, and monitoring the operational risks and controls associated with its business activities and product or service offerings to within acceptable levels. Centralized functions, such as Business Continuity, Enterprise Third Party Management, and Information Security, are responsible for the development, implementation and management of their individual programs and for the development and maintenance of the policies, procedures, methodologies, tools, and technology utilized across the enterprise to identify, assess, monitor, and report program risks. Additionally, independent risk management reviews and challenges line of business adherence to the framework to ensure proper controls are in place and appropriate risk mitigation plans are established as necessary.
40
Compliance Risk
Enterprise Compliance is responsible for coordinating the compliance risk component of our Operational Risk Management Framework. Compliance issues are identified and tracked through enterprise-wide monitoring and tracking programs. Key compliance risk issues are escalated through a comprehensive risk reporting process at both a business and enterprise level and incorporated, as appropriate, into the development and assessment of our operational risk profile. A risk committee, chaired by the Chief Compliance Officer, is responsible for oversight of compliance and fiduciary risk management programs across PNC. In order to help understand and proactively address emerging regulatory issues where appropriate, Enterprise Compliance communicates regularly with various regulators with supervisory or regulatory responsibilities with respect to us, our subsidiaries, or businesses and participates in forums focused on regulatory and compliance matters in the financial services industry.
CRITICAL ACCOUNTING ESTIMATES AND JUDGMENTS
Our consolidated financial statements are prepared by applying certain accounting policies. Note 1 Accounting Policies in the Notes To Consolidated Financial Statements in Item 8 of this Report describes the most significant accounting policies that we use. Certain of these policies require us to make estimates or economic assumptions that may vary under different assumptions or conditions and such variations may significantly affect our reported results and financial position for the period or in future periods.
Fair Value Measurements
We must use estimates, assumptions, and judgments when assets and liabilities are required to be recorded at, or adjusted to reflect, fair value. Assets and liabilities carried at fair value inherently result in a higher degree of financial statement volatility. Fair values and the information used to record valuation adjustments for certain assets and liabilities are based on either quoted market prices or are provided by independent third-party sources, including appraisers and valuation specialists, when available. When such third-party information is not available, we estimate fair value primarily by using cash flow and other financial modeling techniques. Changes in underlying factors, assumptions, or estimates in any of these areas could materially impact our future financial condition and results of operations.
We apply ASC 820Fair Value Measurements. This guidance defines fair value as the price that would be received to sell a financial asset or paid to transfer a financial liability in an orderly transaction between market participants at the measurement date. This guidance requires a three level hierarchy for disclosure of assets and liabilities recorded at fair value. The classification of assets and liabilities within the hierarchy is based on whether the inputs to the valuation methodology used in the measurement are observable or unobservable.
The following table summarizes the assets and liabilities measured at fair value on a recurring basis at December 31, 2016 and December 31, 2015, respectively, and the portions of such assets and liabilities that are classified within Level 3 of the valuation hierarchy. Level 3 assets and liabilities are those where the fair value is estimated using significant unobservable inputs.
Table 33: Fair Value MeasurementsSummary
| December 31, 2016 | December 31, 2015 | |||||||||||||||
| Dollars in millions |
Total Fair Value | Level 3 | Total Fair Value | Level 3 | ||||||||||||
| Total assets |
$ | 74,608 | $ | 8,830 | $ | 68,804 | $ | 8,606 | ||||||||
| Total assets at fair value as a percentage of consolidated assets |
20 | % | 19 | % | ||||||||||||
| Level 3 assets as a percentage of total assets at fair value |
12 | % | 13 | % | ||||||||||||
| Level 3 assets as a percentage of consolidated assets |
2 | % | 2 | % | ||||||||||||
| Total liabilities |
$ | 4,818 | $ | 433 | $ | 4,892 | $ | 495 | ||||||||
| Total liabilities at fair value as a percentage of consolidated liabilities |
2 | % | 2 | % | ||||||||||||
| Level 3 liabilities as a percentage of total liabilities at fair value |
9 | % | 10 | % | ||||||||||||
| Level 3 liabilities as a percentage of consolidated liabilities |
<1 | % | <1 | % | ||||||||||||
The majority of assets recorded at fair value are included in the securities available for sale portfolio. The majority of Level 3 assets represent non-agency residential mortgage-backed securities in the securities available for sale portfolio, equity investments and mortgage servicing rights. For further information on fair value, see Note 6 Fair Value in the Notes To the Consolidated Financial Statements in Item 8 of this Report.
Allowances for Loan and Lease Losses and Unfunded Loan Commitments and Letters of Credit
We maintain the ALLL and the Allowance for Unfunded Loan Commitments and Letters of Credit at levels that we believe to be appropriate to absorb estimated probable credit losses incurred in the loan and lease portfolios and on these unfunded credit facilities as of the balance sheet date. Our determination of the allowances is based on periodic evaluations of the loan and lease portfolios and unfunded credit facilities and other relevant factors. These critical estimates include significant use of our own historical data and complex methods to interpret them. We have an ongoing process to evaluate and enhance the quality, quantity and timeliness of our data and interpretation methods used in the determination of these allowances. These evaluations are inherently subjective, as they require material estimates and may be susceptible to significant change, and include, among others:
| | Probability of default (PD), |
41
| | Loss given default (LGD), |
| | Outstanding balance of the loan, |
| | Movement through delinquency stages, |
| | Amounts and timing of expected future cash flows, |
| | Value of collateral, which may be obtained from third parties, and |
| | Qualitative factors, such as changes in current economic conditions, that may not be reflected in modeled results. |
For all loans, the ALLL is the sum of three components: (i) asset specific/individual impaired reserves, (ii) quantitative (formulaic or pooled) reserves and (iii) qualitative (judgmental) reserves. The reserve calculation and determination process is dependent on the use of key assumptions. Key reserve assumptions and estimation processes react to and are influenced by observed changes in loan portfolio performance experience, the financial strength of the borrower, and economic conditions. For unfunded commitments, the reserve estimate also includes estimation of the probability of funding. Key reserve assumptions are periodically updated.
To the extent actual outcomes differ from our estimates, additional provision for credit losses may be required that would reduce future earnings. See the following for additional information:
| | Allowances For Loan And Lease Losses And Unfunded Loan Commitments And Letters Of Credit in the Credit Risk Management section of this Item 7, and |
| | Note 1 Accounting Policies and Note 4 Allowances for Loan and Lease Losses in the Notes To Consolidated Financial Statements and Allocation of Allowance for Loan and Lease Losses in the Statistical Information (Unaudited) section of Item 8 of this Report. |
Goodwill
Goodwill arising from business acquisitions represents the value attributable to unidentifiable intangible elements in the business acquired. Most of our goodwill relates to value inherent in the Retail Banking and Corporate & Institutional Banking businesses.
The value of goodwill is supported by earnings, which is driven by our invested assets and transaction volume and, for certain businesses, the market value of assets under administration or for which processing services are provided. Lower earnings and realized profitability resulting from a lack of growth or our inability to deliver cost-effective services over sustained periods can lead to impairment of goodwill, which could result in a current period charge to earnings. At least annually, in the fourth quarter, or more frequently if events occur or circumstances have changed significantly from the annual test date, management reviews the current operating environment and strategic direction of each reporting unit taking into consideration any events or changes in circumstances that may have an effect on the unit. For this review, inputs are generated and used in calculating the fair value of the reporting unit, which is compared to its carrying amount (Step 1 of the goodwill impairment test) as further discussed below. The fair values of our reporting units are determined using a discounted cash flow valuation model with assumptions based upon market comparables. Additionally, we may also evaluate certain financial metrics that are indicative of fair value, including market quotes, price to earnings ratios and recent acquisitions involving other financial institutions. A reporting unit is defined as an operating segment or one level below an operating segment. If the fair value of the reporting unit is less than its carrying amount, the reporting units goodwill would be evaluated for impairment. In this circumstance, the implied fair value of reporting unit goodwill, which is determined as if the reporting unit had been acquired in a business combination, would be compared to the carrying amount of that goodwill (Step 2 of the goodwill impairment test). If the carrying amount of goodwill exceeds the implied fair value of goodwill, the difference is recognized as an impairment loss.
The results of our annual 2016 impairment test indicated that the estimated fair values of our reporting units with goodwill exceeded their carrying values by at least 10% and are not considered to be at risk of not passing Step 1. By definition, assumptions utilized in estimating the fair value of a reporting unit are judgmental and inherently uncertain, but absent a significant change in economic conditions of a reporting unit, we would not expect the fair values of these reporting units to decrease below their respective carrying values. Similarly, there were no impairment charges related to goodwill in 2015 or 2014.
Given our segment realignment, as described in the Business Segments Review section of this Item 7, we performed an interim impairment test as of March 31, 2017. The results indicated that the estimated fair value of our reporting units exceeded their carrying values by at least 10% and are not considered to be at risk of not passing Step 1.
See Note 7 Goodwill and Mortgage Servicing Rights in the Notes To Consolidated Financial Statements in Item 8 of this Report for additional information.
Residential and Commercial Mortgage Servicing Rights
We elect to measure our residential and commercial mortgage servicing rights (MSRs) at fair value. This election was made to be consistent with our risk management strategy to hedge changes in the fair value of these assets. The fair value of residential and commercial MSRs is estimated by using a cash flow valuation model which calculates the present value of estimated future net servicing cash flows, taking into consideration actual and expected mortgage loan prepayment rates, discount rates, servicing costs, and other economic factors which are determined based on current market conditions.
42
We employ risk management strategies designed to protect the value of MSRs from changes in interest rates and related market factors. The values of the residential and commercial MSRs are economically hedged with securities and derivatives, including interest-rate swaps, options, and forward mortgage-backed and futures contracts. As interest rates change, these financial instruments are expected to have changes in fair value negatively correlated to the change in fair value of the hedged MSR portfolios. The hedge relationships are actively managed in response to changing market conditions over the life of the MSRs. Selecting appropriate financial instruments to economically hedge residential or commercial MSRs requires significant management judgment to assess how mortgage rates and prepayment speeds could affect the future values of MSRs. Hedging results can frequently be less predictable in the short term, but over longer periods of time are expected to protect the economic value of the MSRs.
The following sections of this Report provide further information on residential and commercial MSRs:
| | Note 6 Fair Value included in the Notes To Consolidated Financial Statements in Item 8 of this Report. |
| | Note 7 Goodwill and Mortgage Servicing Rights included in the Notes To Consolidated Financial Statements in Item 8 of this Report. |
Income Taxes
In the normal course of business, we and our subsidiaries enter into transactions for which the tax treatment is unclear or subject to varying interpretations. In addition, filing requirements, methods of filing and the calculation of taxable income in various state and local jurisdictions are subject to differing interpretations.
We evaluate and assess the relative risks and merits of the tax treatment of transactions, filing positions, filing methods and taxable income calculations after considering statutes, regulations, judicial precedent, and other information, and maintain tax accruals consistent with our evaluation of these relative risks and merits. The result of our evaluation and assessment is by its nature an estimate. We and our subsidiaries are routinely subject to audit and challenges from taxing authorities. In the event we resolve a challenge for an amount different than amounts previously accrued, we will account for the difference in the period in which we resolve the matter.
Recently Issued Accounting Standards
Revenue Recognition
In May 2014, the Financial Accounting Standard Board (FASB) issued Accounting Standards Update (ASU) 2014-09, Revenue from Contracts with Customers (Topic 606). This ASU clarifies the principles for recognizing revenue and replaces nearly all existing revenue recognition guidance in U.S. GAAP with one accounting model. The core principle of the guidance is that an entity should recognize revenue to depict the satisfaction of a performance obligation by transfer of promised goods or services to customers. The ASU also requires additional qualitative and quantitative disclosures relating to the nature, amount, timing, and uncertainty of revenue and cash flows arising from contracts with customers.
In August 2015, the FASB issued guidance deferring the mandatory effective date of ASU 2014-09 for one year, to annual reporting periods beginning after December 15, 2017. During 2016, the FASB also issued four separate ASUs which amend the original standard to clarify guidance regarding principal versus agent considerations, identifying performance obligations and licensing, certain narrow-scope amendments which address the presentation of sales tax, noncash consideration, contract modifications at transition and assessing collectability and other minor technical corrections and improvements.
The requirements within ASU 2014-09 and its subsequent amendments should be applied retrospectively to each prior period presented (with several practical expedients for certain completed contracts) or retrospectively with the cumulative effect of initially applying ASU 2014-09 recognized at the date of initial application (i.e., modified retrospective application). We plan to adopt the ASU consistent with the deferred mandatory effective date using the modified retrospective approach. Based on our evaluation to date, we do not expect the adoption of this standard to have a significant impact on our consolidated results of operations or our consolidated financial position. We expect that the most significant impact related to the standards expanded disclosure requirements will be the disaggregation of revenue.
Financial Instruments
In January 2016, the FASB issued ASU 2016-01, Financial Instruments Overall (Subtopic 825-10): Recognition and Measurement of Financial Assets and Financial Liabilities. This ASU changes the accounting for certain equity investments, financial liabilities under the fair value option and presentation and disclosure requirements for financial instruments. Equity investments not accounted for under the equity method of accounting will be measured at fair value with any changes in fair value recognized in net income. The ASU also simplifies the impairment assessment of equity investments for which fair value is not readily determinable. Additionally, the ASU changes the presentation of certain fair value changes for financial liabilities measured at fair value, and amends certain disclosure requirements relating to the fair value of financial instruments. The ASU is effective for annual periods, and interim periods
43
within those annual periods, beginning after December 15, 2017 and should be applied using a modified retrospective approach through a cumulative-effect adjustment to the balance sheet, except for the amendment related to equity securities without readily determinable fair values, which should be applied prospectively. We plan to adopt all provisions consistent with the effective date and are currently evaluating the impact of this ASU on our results of operations and financial position. However, we expect the standard will most significantly impact equity investments that are currently accounted for under the cost method which will likely have a positive impact on income when transitioned to fair value measurement.
Leases
In February 2016, the FASB issued ASU 2016-02, Leases (Topic 842). The primary change in the new guidance is the recognition of lease assets and lease liabilities by lessees for operating leases. The ASU requires lessees to recognize a right-of-use asset and related lease liability for all leases with lease terms of more than 12 months. The recognition, measurement and presentation of expenses and cash flows arising from a lease by a lessee will depend on its classification as a finance or operating lease. The ASU is effective for annual periods, and interim periods within those annual periods, beginning after December 15, 2018 using a modified retrospective approach through a cumulative-effect adjustment. Early adoption is permitted. We are currently evaluating the impact of adopting this standard.
Credit Losses
In June 2016, the FASB issued ASU 2016-13, Financial Instruments Credit Losses (Topic 326): Measurement of Credit Losses on Financial Instruments. The ASU requires the use of an expected credit loss methodology; specifically, expected credit losses for the remaining life of the asset will be recognized at the time of origination or acquisition. The expected credit loss methodology will apply to loans, debt securities, and other financial assets and net investment in leases not accounted for at fair value through net income. It will also apply to off-balance sheet credit exposures except for unconditionally cancellable commitments. Assets in the scope of the ASU, except for purchased credit deteriorated assets, will be presented at the net amount expected to be collected after deducting the allowance for credit losses from the amortized cost basis of the assets.
Enhanced credit quality disclosures will be required including disaggregation of credit quality indicators by vintage. The development of an expected credit loss methodology and new disclosures will require significant data collection, building or enhancing loss models, and process re-development prior to adoption. The ASU is effective for us for the first quarter of 2020 using a modified retrospective approach through a cumulative-effect adjustment to retained earnings as of the beginning of the year of adoption. We have established a company-wide, cross-functional governance structure. We have also begun assessing the required changes to our credit loss estimation methodologies and systems, as well as additional data and resource requirements to be able to comply with the standard. We continue to assess the impact of the standard; however, we expect the guidance will result in an increase in the allowance for loan losses to cover credit losses over the estimated life of the financial assets. The magnitude of the increase in our allowance for loan losses at the adoption date will be dependent upon the nature of the characteristics of the portfolio at the adoption date, as well as macroeconomic conditions and forecasts at that date.
Statement of Cash Flows
In August 2016, the FASB issued ASU 2016-15, Statement of Cash Flows (Topic 230): Classification of Certain Cash Receipts and Cash Payments. The ASU provides guidance on eight specific issues related to classification within the statement of cash flows with the objective of reducing existing diversity in practice. The specific issues cover cash payments for debt prepayment or debt extinguishment costs; cash outflows for settlement of zero-coupon debt instruments or other debt instruments with coupon interest rates that are insignificant; contingent consideration payments that are not made soon after a business combination; proceeds from the settlement of insurance claims; proceeds from the settlement of corporate-owned life insurance policies, including bank-owned life insurance policies; distributions received from equity method investees; beneficial interests received in securitization transactions; and clarifies that when no specific GAAP guidance exists and the source of the cash flows are not separately identifiable, then the predominant source of cash flows should be used to determine the classification for the item. The ASU is effective for annual periods, and interim periods within those annual periods, beginning after December 15, 2017. Early adoption is permitted, provided that all of the amendments are adopted in the same period. The guidance requires application using a retrospective transition method. We are currently evaluating the impact of adopting this standard.
Recently Adopted Accounting Pronouncements
See Note 1 Accounting Policies in the Notes To the Consolidated Financial Statements in Item 8 of this Report regarding the impact of new accounting pronouncements which we have adopted.
OFF-BALANCE SHEET ARRANGEMENTS AND VARIABLE INTEREST ENTITIES
We engage in a variety of activities that involve entities that are not consolidated or otherwise reflected in our Consolidated Balance Sheet that are generally referred to as off-balance sheet arrangements. Additional information on these types of activities is included in the following sections of this Report:
| | Commitments, including contractual obligations and other commitments, included within the Risk Management section of this Item 7, and |
| | Note 2 Loan Sale and Servicing Activities and Variable Interest Entities, |
| | Note 10 Borrowed Funds, |
| | Note 15 Equity, and |
| | Note 20 Commitments, all of which are in the Notes To Consolidated Financial Statements included in Item 8 of this Report. |
44
We consolidate variable interest entities (VIEs) when we are deemed to be the primary beneficiary. The primary beneficiary of a VIE is determined to be the party that meets both of the following criteria: (i) has the power to make decisions that most significantly affect the economic performance of the VIE; and (ii) has the obligation to absorb losses or the right to receive benefits that in either case could potentially be significant to the VIE.
A summary of VIEs, including those that we have consolidated and those in which we hold variable interests but have not consolidated into our financial statements, as of December 31, 2016 and December 31, 2015 is included in Note 2 in the Notes To Consolidated Financial Statements included in Item 8 of this Report.
Trust Preferred Securities and REIT Preferred Securities
See Note 10 Borrowed Funds, Note 15 Equity and Note 23 Subsequent Events in the Notes To Consolidated Financial Statements in Item 8 of this Report for additional information on trust preferred securities issued by PNC Capital Trust C and REIT preferred securities issued by PNC Preferred Funding Trust I and PNC Preferred Funding Trust II including information on contractual limitations potentially imposed on payments (including dividends) with respect to PNC and PNC Banks equity capital securities.
GLOSSARY OF TERMS
Adjusted average total assetsPrimarily consisted of total average quarterly (or annual) assets plus/less unrealized losses (gains) on investment securities, less goodwill and certain other intangible assets (net of eligible deferred taxes).
Basel III common equity Tier 1 capitalCommon stock plus related surplus, net of treasury stock, plus retained earnings, plus accumulated other comprehensive income for securities currently and previously held as available for sale, plus accumulated other comprehensive income for pension and other postretirement benefit plans, less goodwill, net of associated deferred tax liabilities, less other disallowed intangibles, net of deferred tax liabilities and plus/less other adjustments.
Basel III common equity Tier 1 capital ratioCommon equity Tier 1 capital divided by period-end risk-weighted assets (as applicable).
Basel III Tier 1 capitalCommon equity Tier 1 capital plus preferred stock, plus certain trust preferred capital securities, plus certain noncontrolling interests that are held by others and plus/less other adjustments.
Basel III Tier 1 capital ratioTier 1 capital divided by period-end risk-weighted assets (as applicable).
Basel III Total capitalTier 1 capital plus qualifying subordinated debt, plus certain trust preferred securities, plus, under the Basel III transitional rules and the standardized approach, the allowance for loan and lease losses included in Tier 2 capital and other. Basel III Total capital ratioTotal capital divided by period-end risk-weighted assets (as applicable).
Charge-offProcess of removing a loan or portion of a loan from our balance sheet because it is considered uncollectible. We also record a charge-off when a loan is transferred from portfolio holdings to held for sale by reducing the loan carrying amount to the fair value of the loan, if fair value is less than carrying amount.
Combined loan-to-value ratio (CLTV)This is the aggregate principal balance(s) of the mortgages on a property divided by its appraised value or purchase price.
Common shareholders equityTotal shareholders equity less the liquidation value of preferred stock.
Credit valuation adjustment (CVA)Represents an adjustment to the fair value of our derivatives for our own and counterparties non-performance risk.
Criticized commercial loansLoans with potential or identified weaknesses based upon internal risk ratings that comply with the regulatory classification definitions of Special Mention, Substandard or Doubtful.
45
Discretionary client assets under managementAssets over which we have sole or shared investment authority for our customers/clients. We do not include these assets on our Consolidated Balance Sheet.
Duration of equityAn estimate of the rate sensitivity of our economic value of equity. A negative duration of equity is associated with asset sensitivity (i.e., positioned for rising interest rates), while a positive value implies liability sensitivity (i.e., positioned for declining interest rates). For example, if the duration of equity is -1.5 years, the economic value of equity increases by 1.5% for each 100 basis point increase in interest rates.
Earning assetsAssets that generate income, which include: interest-earning deposits with banks; loans held for sale; loans; investment securities; and certain other assets.
Effective durationA measurement, expressed in years, that, when multiplied by a change in interest rates, would approximate the percentage change in value of on- and off- balance sheet positions.
EfficiencyNoninterest expense divided by total revenue.
Fair valueThe price that would be received to sell an asset or paid to transfer a liability in an orderly transaction between market participants at the measurement date.
Fee incomeWhen referring to the components of Noninterest income, we use the term fee income to refer to the following categories within Noninterest income: Asset management; Consumer services; Corporate services; Residential mortgage; and Service charges on deposits.
FICO scoreA credit bureau-based industry standard score created by Fair Isaac Co. which predicts the likelihood of borrower default. We use FICO scores both in underwriting and assessing credit risk in our consumer lending portfolio. Lower FICO scores indicate likely higher risk of default, while higher FICO scores indicate likely lower risk of default. FICO scores are updated on a periodic basis.
Foreign exchange contractsContracts that provide for the future receipt and delivery of foreign currency at previously agreed-upon terms.
Futures and forward contractsContracts in which the buyer agrees to purchase and the seller agrees to deliver a specific financial instrument at a predetermined price or yield. May be settled either in cash or by delivery of the underlying financial instrument.
GAAPAccounting principles generally accepted in the United States of America.
Home price index (HPI)A broad measure of the movement of single-family house prices in the U.S.
Impaired loansLoans are determined to be impaired when, based on current information and events, it is probable that all contractually required payments will not be collected. Impaired loans include commercial nonperforming loans and consumer and commercial TDRs, regardless of nonperforming status. Excluded from impaired loans are nonperforming leases, loans held for sale, loans accounted for under the fair value option, smaller balance homogenous type loans and purchased impaired loans.
Interest rate swap contractsContracts that are entered into primarily as an asset/liability management strategy to reduce interest rate risk. Interest rate swap contracts are exchanges of interest rate payments, such as fixed-rate payments for floating-rate payments, based on notional principal amounts.
Intrinsic valueThe difference between the price, if any, required to be paid for stock issued pursuant to an equity compensation arrangement and the fair market value of the underlying stock.
Leverage ratioTier 1 capital divided by average quarterly adjusted total assets.
LIBORAcronym for London InterBank Offered Rate. LIBOR is the average interest rate charged when banks in the London wholesale money market (or interbank market) borrow unsecured funds from each other. LIBOR rates are used as a benchmark for interest rates on a global basis. Our product set includes loans priced using LIBOR as a benchmark.
Loan-to-value ratio (LTV)A calculation of a loans collateral coverage that is used both in underwriting and assessing credit risk in our lending portfolio. LTV is the sum total of loan obligations secured by collateral divided by the market value of that same collateral. Market values of the collateral are based on an independent valuation of the collateral. For example, a LTV of less than 90% is better secured and has less credit risk than a LTV of greater than or equal to 90%.
46
Loss given default (LGD)An estimate of loss, net of recovery based on collateral type, collateral value, loan exposure, and other factors. Each loan has its own LGD. The LGD risk rating measures the percentage of exposure of a specific credit obligation that we expect to lose if default occurs. LGD is net of recovery, through any means, including but not limited to the liquidation of collateral or deficiency judgments rendered from foreclosure or bankruptcy proceedings.
Nonaccrual loansLoans for which we do not accrue interest income. Nonaccrual loans include nonperforming loans, in addition to loans accounted for under fair value option and loans accounted for as held for sale for which full collection of contractual principal and/or interest is not probable.
Nondiscretionary client assets under administrationAssets we hold for our customers/clients in a nondiscretionary, custodial capacity. We do not include these assets on our Consolidated Balance Sheet.
Nonperforming assetsNonperforming assets include nonperforming loans and OREO, foreclosed and other assets, but exclude certain government insured or guaranteed loans for which we expect to collect substantially all principal and interest, loans held for sale, loans accounted for under the fair value option and purchased impaired loans. We do not accrue interest income on assets classified as nonperforming.
Nonperforming loansLoans accounted for at amortized cost for which we do not accrue interest income. Nonperforming loans include loans to commercial, commercial real estate, equipment lease financing, home equity, residential real estate, credit card and other consumer customers as well as TDRs which have not returned to performing status. Nonperforming loans exclude certain government insured or guaranteed loans for which we expect to collect substantially all principal and interest, loans held for sale, loans accounted for under the fair value option and purchased impaired loans. Nonperforming loans exclude purchased impaired loans as we are currently accreting interest income over the expected life of the loans.
Notional amountA number of currency units, shares, or other units specified in a derivative contract.
Operating leverageThe period to period dollar or percentage change in total revenue (GAAP basis) less the dollar or percentage change in noninterest expense. A positive variance indicates that revenue growth exceeded expense growth (i.e., positive operating leverage) while a negative variance implies expense growth exceeded revenue growth (i.e., negative operating leverage).
OptionsContracts that grant the purchaser, for a premium payment, the right, but not the obligation, to either purchase or sell the associated financial instrument at a set price during a specified period or at a specified date in the future.
Other real estate owned (OREO), foreclosed and other assetsAssets taken in settlement of troubled loans primarily through deed-in-lieu of foreclosure or foreclosure. Foreclosed and other assets include real and personal property, equity interests in corporations, partnerships, and limited liability companies. Excludes certain assets that have a government guarantee which are classified as other receivables.
Probability of default (PD)An internal risk rating that indicates the likelihood that a credit obligor will enter into default status.
RecoveryCash proceeds received on a loan that we had previously charged off. We credit the amount received to the allowance for loan and lease losses.
RiskThe potential that an event or series of events could occur that would threaten our ability to achieve our strategic objectives, thereby negatively affecting shareholder value or reputation.
Risk appetiteA dynamic, forward-looking view on the aggregate amount of risk we are willing and able to take in executing business strategy in light of the current business environment.
Risk limitsQuantitative measures based on forward looking assumptions that allocate the firms aggregate risk appetite (e.g. measure of loss or negative events) to business lines, legal entities, specific risk categories, concentrations and as appropriate, other levels.
Risk profileThe risk profile is a point-in-time assessment of risk. The profile represents overall risk position in relation to the desired risk appetite. The determination of the risk profiles position is based on qualitative and quantitative analysis of reported risk limits, metrics, operating guidelines and qualitative assessments.
Risk-weighted assetsComputed by the assignment of specific risk-weights (as defined by the Board of Governors of the Federal Reserve System) to assets and off-balance sheet instruments.
Servicing rightsAn intangible asset or liability created by an obligation to service assets for others. Typical servicing rights include the right to receive a fee for collecting and forwarding payments on loans and related taxes and insurance premiums held in escrow.
47
Taxable-equivalent interest incomeThe interest income earned on certain assets is completely or partially exempt from federal income tax. As such, these tax-exempt instruments typically yield lower returns than taxable investments. To provide more meaningful comparisons of yields and margins for all interest-earning assets, we use interest income on a taxable-equivalent basis in calculating average yields and net interest margins by increasing the interest income earned on tax-exempt assets to make it fully equivalent to interest income earned on other taxable investments. This adjustment is not permitted under GAAP on the Consolidated Income Statement.
Transitional Basel III common equityCommon equity calculated under Basel III using phased-in definitions and deductions applicable to us during the related presentation period.
Troubled debt restructuring (TDR)A loan whose terms have been restructured in a manner that grants a concession to a borrower experiencing financial difficulties.
Value-at-risk (VaR)A statistically-based measure of risk that describes the amount of potential loss which may be incurred due to adverse market movements. The measure is of the maximum loss which should not be exceeded on 95 out of 100 days for a 95% VaR.
Yield curveA graph showing the relationship between the yields on financial instruments or market indices of the same credit quality with different maturities. For example, a normal or positive yield curve exists when long-term bonds have higher yields than short-term bonds. A flat yield curve exists when yields are the same for short-term and long-term bonds. A steep yield curve exists when yields on long-term bonds are significantly higher than on short-term bonds. An inverted or negative yield curve exists when short-term bonds have higher yields than long-term bonds.
CAUTIONARY STATEMENT REGARDING FORWARD-LOOKING INFORMATION
We make statements in this Report, and we may from time to time make other statements, regarding our outlook for earnings, revenues, expenses, capital and liquidity levels and ratios, asset levels, asset quality, financial position, and other matters regarding or affecting us and our future business and operations that are forward-looking statements within the meaning of the Private Securities Litigation Reform Act. Forward-looking statements are typically identified by words such as believe, plan, expect, anticipate, see, look, intend, outlook, project, forecast, estimate, goal, will, should and other similar words and expressions. Forward-looking statements are subject to numerous assumptions, risks and uncertainties, which change over time.
Forward-looking statements speak only as of the date made. We do not assume any duty and do not undertake to update forward-looking statements. Actual results or future events could differ, possibly materially, from those anticipated in forward-looking statements, as well as from historical performance.
Our forward-looking statements are subject to the following principal risks and uncertainties.
| | Our businesses, financial results and balance sheet values are affected by business and economic conditions, including the following: |
| | Changes in interest rates and valuations in debt, equity and other financial markets. |
| | Disruptions in the U.S. and global financial markets. |
| | Actions by the Federal Reserve Board, U.S. Treasury and other government agencies, including those that impact money supply and market interest rates. |
| | Changes in law and policy accompanying the new presidential administration and uncertainty or speculation pending the enactment of such changes. |
| | Changes in customers, suppliers and other counterparties performance and creditworthiness. |
| | Slowing or reversal of the current U.S. economic expansion. |
| | Continued residual effects of recessionary conditions and uneven spread of positive impacts of recovery on the economy and our counterparties, including adverse impacts on levels of unemployment, loan utilization rates, delinquencies, defaults and counterparty ability to meet credit and other obligations. |
| | Commodity price volatility. |
| | Changes in customer preferences and behavior, whether due to changing business and economic conditions, legislative and regulatory initiatives, or other factors. |
| | Our forward-looking financial statements are subject to the risk that economic and financial market conditions will be substantially different than those we are currently expecting. These statements are based on our current view that the U.S. economy and the labor market will grow moderately in 2017, boosted by stable oil/energy prices, improving consumer spending and housing activity, and expanded federal fiscal policy stimulus as a result of the 2016 elections. Short-term interest rates and bond yields are expected to continue rising in 2017, along with inflation. These forward-looking statements also do not, unless otherwise indicated, take into account the impact of potential legal and regulatory contingencies. |
48
| | Our ability to take certain capital actions, including paying dividends and any plans to increase common stock dividends, repurchase common stock under current or future programs, or issue or redeem preferred stock or other regulatory capital instruments, is subject to the review of such proposed actions by the Federal Reserve Board as part of our comprehensive capital plan for the applicable period in connection with the Federal Reserve Boards Comprehensive Capital Analysis and Review (CCAR) process and to the acceptance of such capital plan and non-objection to such capital actions by the Federal Reserve Board. |
| | Our regulatory capital ratios in the future will depend on, among other things, the companys financial performance, the scope and terms of final capital regulations then in effect (particularly those implementing the international regulatory capital framework developed by the Basel Committee on Banking Supervision (Basel Committee), the international body responsible for developing global regulatory standards for banking organizations for consideration and adoption by national jurisdictions), and management actions affecting the composition of our balance sheet. In addition, our ability to determine, evaluate and forecast regulatory capital ratios, and to take actions (such as capital distributions) based on actual or forecasted capital ratios, will be dependent at least in part on the development, validation and regulatory approval of related models. |
| | Legal and regulatory developments could have an impact on our ability to operate our businesses, financial condition, results of operations, competitive position, reputation, or pursuit of attractive acquisition opportunities. Reputational impacts could affect matters such as business generation and retention, liquidity, funding, and ability to attract and retain management. These developments could include: |
| | Changes resulting from legislative and regulatory reforms, including changes affecting oversight of the financial services industry, consumer protection, tax, pension, bankruptcy and other industry aspects, and changes in accounting policies and principles. |
| | Changes to regulations governing bank capital and liquidity standards, including due to the Dodd-Frank Act and initiatives of the Basel Committee. |
| | Unfavorable resolution of legal proceedings or other claims and regulatory and other governmental investigations or other inquiries. These matters may result in monetary judgments or settlements or other remedies, including fines, penalties, restitution or alterations in our business practices, and in additional expenses and collateral costs, and may cause reputational harm to us. |
| | Results of the regulatory examination and supervision process, including our failure to satisfy requirements of agreements with governmental agencies. |
| | Impact on business and operating results of any costs associated with obtaining rights in intellectual property claimed by others and of adequacy of our intellectual property protection in general. |
| | Business and operating results are affected by our ability to identify and effectively manage risks inherent in our businesses, including, where appropriate, through effective use of systems and controls, third-party insurance, derivatives, and capital management techniques, and to meet evolving regulatory capital and liquidity standards. |
| | Business and operating results also include impacts relating to our equity interest in BlackRock, Inc. and rely to a significant extent on information provided to us by BlackRock. Risks and uncertainties that could affect BlackRock are discussed in more detail by BlackRock in its SEC filings. |
| | We grow our business in part by acquiring from time to time other financial services companies, financial services assets and related deposits and other liabilities. Acquisition risks and uncertainties include those presented by the nature of the business acquired, including in some cases those associated with our entry into new businesses or new geographic or other markets and risks resulting from our inexperience in those new areas, as well as risks and uncertainties related to the acquisition transactions themselves, regulatory issues, and the integration of the acquired businesses into PNC after closing. |
| | Competition can have an impact on customer acquisition, growth and retention and on credit spreads and product pricing, which can affect market share, deposits and revenues. Our ability to anticipate and respond to technological changes can also impact our ability to respond to customer needs and meet competitive demands. |
| | Business and operating results can also be affected by widespread natural and other disasters, pandemics, dislocations, terrorist activities, system failures, security breaches, cyberattacks or international hostilities through impacts on the economy and financial markets generally or on us or our counterparties specifically. |
We provide greater detail regarding these as well as other factors in this Report, and elsewhere in this Report, including in the Risk Factors and Risk Management sections and the Legal Proceedings and Commitments Notes of the Notes To Consolidated Financial Statements in this Report. Our forward-looking statements may also be subject to other risks and uncertainties, including those discussed elsewhere in this Report or in our other filings with the SEC.
49