EX-99.1
Published on March 3, 2014
Exhibit 99.1
| Meeting Main Street Growing America |
||||

|
PNC Financial Services Group 2013 Annual Report |
|
||
The PNC Financial Services Group, Inc.
Financial Highlights
| Year ended December 31 Dollars in millions, except per share data |
||||||||||||
| Financial Results | 2013 | 2012 | 2011 | |||||||||
| Net interest income |
$ | 9,147 | $ | 9,640 | $ | 8,700 | ||||||
| Noninterest income |
6,865 | 5,872 | 5,626 | |||||||||
|
|
|
|
|
|
|
|||||||
| Total revenue |
16,012 | 15,512 | 14,326 | |||||||||
| Noninterest expense |
9,801 | 10,582 | 9,105 | |||||||||
|
|
|
|
|
|
|
|||||||
| Pretax, pre-provision earnings (non-GAAP) |
6,211 | 4,930 | 5,221 | |||||||||
| Provision for credit losses |
643 | 987 | 1,152 | |||||||||
| Net income |
$ | 4,227 | $ | 3,001 | $ | 3,071 | ||||||
| Diluted earnings per common share |
$ | 7.39 | $ | 5.30 | $ | 5.64 | ||||||
| Cash dividends declared per common share |
$ | 1.72 | $ | 1.55 | $ | 1.15 | ||||||
| Balance Sheet At year end | 2013 | 2012 | 2011 | |||||||||
| Assets |
$ | 320,296 | $ | 305,107 | $ | 271,205 | ||||||
| Loans |
195,613 | 185,856 | 159,014 | |||||||||
| Deposits |
220,931 | 213,142 | 187,966 | |||||||||
| Shareholders equity |
42,408 | 39,003 | 34,053 | |||||||||
| Book value per common share |
$ | 72.21 | $ | 67.05 | $ | 61.52 | ||||||
| Tangible book value per common share (non-GAAP) |
$ | 54.68 | $ | 49.18 | $ | 45.20 | ||||||
| Selected Ratios | 2013 | 2012 | 2011 | |||||||||
| Return on average common shareholders equity |
10.88 | % | 8.31 | % | 9.56 | % | ||||||
| Return on average assets |
1.38 | % | 1.02 | % | 1.16 | % | ||||||
| Net interest margin |
3.57 | % | 3.94 | % | 3.92 | % | ||||||
| Noninterest income to total revenue |
43 | % | 38 | % | 39 | % | ||||||
| Basel I Tier 1 common capital ratio |
10.5 | % | 9.6 | % | 10.3 | % | ||||||
| Basel I Tier 1 risk-based capital ratio |
12.4 | % | 11.6 | % | 12.6 | % | ||||||
| Pro forma Basel III Tier 1 common capital ratio |
9.4 | % | 7.5 | % | ||||||||
PNC believes that pretax, pre-provision earnings serves as a useful tool to help evaluate the ability to provide for credit costs through operations.
PNC believes that tangible book value per common share serves as a useful tool to help evaluate the strength and discipline of a companys capital management strategies and as an additional, conservative measure of total company value. See the Statistical Information (Unaudited) section included in Item 8 of the accompanying 2013 Form 10-K for additional information.
PNCs pro forma Basel III Tier 1 common capital ratio was estimated without benefit of phase-ins and based on estimated Basel III risk-weighted assets, using the lower of the ratio calculated under the standardized and advanced approaches. See the Funding and Capital Resources section included in Item 7 of the accompanying 2013 Form 10-K for additional information.
These Financial Highlights should be read in conjunction with disclosures in the accompanying 2013 Form 10-K including the audited financial statements. Certain prior period amounts included in the Financial Highlights have been reclassified to conform with the current period presentation.
From the CEO
March 3, 2014

PNC is a Main Street bank, not a Wall Street bank ... We are big enough that no matter where you are or what you need to do, we will be there to help you do it. - Bill Demchak

|
Dear Shareholders, | |
|
PNC had a very good year in 2013. We reported record net income of $4.2 billion, or $7.39 per diluted common share, up from $3.0 billion, or $5.30 per diluted common share, in 2012. Our return on average assets was 1.38 percent. We grew commercial and consumer loans combined by $9.8 billion and deposits by $7.8 billion. And our diversified business mix contributed to growth in noninterest income of 17 percent. |
| These results provide an important measure of validation of the strategy that we have been executing in recent years to capitalize on the opportunities created by our recent growth. And our stock price performance reflects that work as well. Our stock climbed from $58.31 on December 31, 2012, to $77.58 on December 31, 2013, an increase of 33 percent. |

|
Our earnings and capital strength supported our decision in April 2013 to increase the common stock dividend beginning in the second quarter of 2013 for the third time in as many years. Our dividend yield as of December 31, 2013, was 2.3 percent, and we believe we are well positioned to return additional capital to shareholders going forward, subject to the regulatory Comprehensive Capital Analysis and Review (CCAR) process.
While it was a good year, we are still operating in a challenging and dynamic environment. Banks must adapt to new realities, and PNC is up to the challenge.
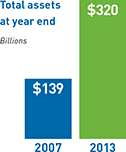
PNC has grown dramatically over the last six years. We have more than doubled in size growing assets to $320 billion and expanded to new markets in the Midwest and Southeast. But that has not changed who we are, what we believe in or the model that has enabled us to truly be a part of the communities in which we do business.
|
PNC is a Main Street bank, not a Wall Street bank. We work to ensure small businesses can meet their payroll, veterinarians can finance new X-ray machines and manufacturers can get goods to market. We help people buy cars to get themselves to work and their kids to soccer practice. We help mothers and fathers save to send their children to college, and then we help those young adults learn to manage their finances. We are big enough that no matter where you are or what you need to do, we will be there to help you do it. We help make America the real America go.
That was true before the financial crisis, it was true through the crisis, and it will be true for generations to come. Ours is a model that has served our shareholders, customers, communities and employees well. |
Progress on our priorities
Our strategic priorities are aligned to expand market share, deepen relationships, increase fee income and improve operating results, leading to sustainable growth and long-term value for our shareholders. In 2013 we made important progress against each priority.
Driving growth in new and underpenetrated markets
Capturing more investable assets
Redefining the retail banking business

Building a stronger mortgage business
Bolstering critical infrastructure and streamlining core processes
Managing risk and building on our strong capital position
Banks are, by the nature of what we do, in the business of managing risk. Our success is determined by how well we define our risk appetite and manage our risks to adhere to those parameters. Of course, that has become more complicated in recent years.
Risk management is not just an exercise in credit policy; it involves operational, market, credit, liquidity and model risk, among others, as well as reputational risk. And we look at risks from both a perspective of potential outcomes and across a range of potential stress scenarios through our internal stress testing and the CCAR process. PNC has a legacy of managing its risk appetite through the economic cycle, and our approach to risk management has served us and our constituencies well through the years.
|
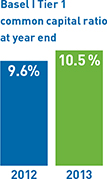
Disciplined risk management goes hand-in-hand with establishing a strong capital position to help ensure our ability to capitalize on opportunities when they arise as well as to sustain and continue executing on strategic priorities when faced with changing market conditions. In 2013, PNC continued to build on its strong capital position. Our Basel I Tier 1 common capital ratio increased to 10.5 percent as of December 31, and our pro forma fully phased-in Basel III Tier 1 common capital ratio under the standardized approach was an estimated 9.4 percent at year end. |
A foundation built to win
Our potential for success as we move forward is magnified by the powerful combination of our business model, our culture and our people.
We have a model that serves us well. For years especially as we have expanded into new markets our Main Street, relationship-based banking model has been a competitive advantage, enabling us to bring the resources of a bank with our size and scale to bear for clients and communities through local decision making and personal relationships.
Our culture and our people set us apart. Our employees live our values each day to deliver for our constituencies as one PNC. We believe we can win by always doing what we know to be right by those we depend on and those that we serve, and we measure our success by the success of our shareholders, customers, communities and each other.
In 2013, we were pleased to receive a number of accolades recognizing PNC for the company we have become. We again ranked No. 2 on Fortunes Most-Admired list for Super-Regional Banks, and ranked No.1 for social responsibility. For the third year in a row, PNC was named a Gallup Great Workplace Award winner. Training Magazine listed us among their top 125 companies for employee training. And we earned honors as a best place to work for LGBT equality, a top-100 best company and a top-50 company for executive women from the Human Rights Campaign, Working Mother and the National Association for Female Executives, respectively.

In October 2013, retiring Executive Chairman James Rohr (front row, second from the left) was honored alongside PNCs annual Performance Award winners, all of whom were chosen for embodying PNCs values and living our commitments to those we serve. The honorees were recognized for their achievements by President and Chief Executive Officer Bill Demchak (front row, second from the right) at a ceremony that was streamed live for employees across the company to view.
Success through consistency and continuity in challenging times
The groundwork for our achievements in 2013 was laid over many years, just as our accomplishments in 2013 position us for greater success in 2014 and beyond.
I was honored to become chief executive officer in April, when Jim Rohr was named executive chairman, and our transition in leadership is noteworthy for the fact that it was not noisy. It has been virtually seamless thanks to the efforts of our employees and the support of our board, shareholders, customers and partners in the community.
This April, at our annual meeting of shareholders, Jim will retire from our board. I cannot thank him enough for his years of leadership, friendship and the wise counsel he continues to offer. Jim devoted his entire 42-year career to building this company. He is a remarkable man and has been a driving force in our success. I know you will join me in offering Jim our sincere thanks for all that he has done to make PNC an organization and an investment you can be proud of. We wish him all the best in his retirement.

The road ahead
Our industry continues to face many challenges new regulation, low interest rates, soft loan demand, less-than-robust economic expansion, a volatile competitive landscape and evolving customer preferences, just to name a few. While we expect to experience continued revenue pressure, our opportunities for organic growth have never been more plentiful, and our results and accomplishments in 2013 offer a glimpse of what is possible in the year and years ahead.
We are focused on being a Main Street bank that:
| | provides the best-possible multi-channel experience for our customers, delivering innovative products, services and insight that enable achievement and engender loyalty; |
| | creates long-term value for our shareholders; |
| | fosters a diverse and inclusive environment for employees, with opportunities for career development and personal growth; and |
| | builds stronger, more vibrant communities where we operate. |
I could not be more excited about where we are headed or more appreciative of your continued confidence in our company.
Sincerely,

William S. Demchak
President and Chief Executive Officer
For more information regarding certain factors that could cause future results to differ, possibly materially, from historical performance or from those anticipated in forward-looking statements, see the Cautionary Statement in Item 7 of our 2013 Annual Report on Form 10-K, which accompanies this letter. For additional information regarding PNCs pro forma Basel III Tier 1 common capital ratio, see the Funding and Capital Resources section included in Item 7 of the accompanying 2013 Annual Report on Form 10-K.
The PNC Financial Services Group, Inc.
Tangible Book Value per Common Share Ratio (Non-GAAP)
Tangible book value per common share is a non-GAAP financial measure and is calculated based on tangible common shareholders equity divided by period-end common shares outstanding. We believe this non-GAAP financial measure serves as a useful tool to help evaluate the strength and discipline of a companys capital management strategies and as an additional, conservative measure of total company value.
| Dollars in millions, except per share data | December 31, 2013 |
December 31, 2012 |
December 31, 2011 |
|||||||||
| Book value per common share |
$ | 72.21 | $ | 67.05 | $ | 61.52 | ||||||
| Tangible book value per common share |
||||||||||||
| Common shareholders equity |
$ | 38,467 | $ | 35,413 | $ | 32,417 | ||||||
| Goodwill and Other Intangible Assets (a) |
(9,654 | ) | (9,798 | ) | (9,027 | ) | ||||||
| Deferred tax liabilities on Goodwill and Other Intangible Assets (a) |
333 | 354 | 431 | |||||||||
| Tangible common shareholders equity |
$ | 29,146 | $ | 25,969 | $ | 23,821 | ||||||
| Period-end common shares outstanding (in millions) |
533 | 528 | 527 | |||||||||
| Tangible book value per common share (Non-GAAP) |
$ | 54.68 | $ | 49.18 | $ | 45.20 | ||||||
| (a) | Excludes the impact from mortgage servicing rights of $1.6 billion, $1.1. billion, and $1.1 billion at December 31, 2013, 2012 and 2011, respectively. |
The PNC Financial Services Group, Inc.
Basel I and Estimated Pro forma Basel III Tier 1 Common Capital
We provide information below regarding PNCs Basel I Tier 1 common capital ratio, as well as PNCs pro forma fully phased-in Basel III Tier 1 common capital ratio under both the advanced approaches and standardized approach frameworks adopted by the U.S. banking agencies in July 2013 and how that ratio differs from the Basel I Tier 1 common capital ratio. After PNC exits its parallel run qualification phase under the advanced approaches, its regulatory Basel III risk-based capital ratios will be the lower of the ratios as calculated under the standardized and advanced approaches.
Basel I Tier 1 Common Capital Ratio
| Dollars in millions | Dec. 31, 2013 | Dec. 31, 2012 | ||||||
| Basel I Tier 1 common capital |
$ | 28,484 | $ | 24,951 | ||||
| Basel I risk-weighted assets |
$ | 272,169 | $ | 260,847 | ||||
| Basel I Tier 1 common capital ratio |
10.5 | % | 9.6 | % | ||||
Tier 1 common capital as defined under the Basel III rule adopted by the U.S. banking agencies in July 2013 differs materially from under Basel I. For example, under Basel III, significant common stock investments in unconsolidated financial institutions, mortgage servicing rights and deferred tax assets must be deducted from capital to the extent they individually exceed 10%, or in the aggregate exceed 15%, of the institutions adjusted Tier 1 common capital. Also, Basel I regulatory capital excludes other comprehensive income related to both available for sale securities and pension and other postretirement plans, whereas under Basel III these items are a component of PNCs capital. Basel III advanced approaches risk-weighted assets were estimated based on the advanced approaches rules and application of Basel II.5, and reflect credit, market and operational risk. Basel III standardized approach risk-weighted assets were estimated based on the standardized approach rules and reflect credit and market risk.
Estimated Pro forma Fully Phased-In Basel III Tier 1 Common Capital Ratio
| Dollars in millions |
December 31 2013 |
December 31 2012 |
||||||
| Basel I Tier 1 common capital |
$ | 28,484 | $ | 24,951 | ||||
| Less regulatory capital adjustments: |
||||||||
| Basel III quantitative limits |
(1,386 | ) | (2,330 | ) | ||||
| Accumulated other comprehensive income (a) |
196 | 276 | ||||||
| All other adjustments |
162 | (396 | ) | |||||
|
|
|
|
|
|||||
| Estimated Fully Phased-In Basel III Tier 1 common capital |
$ | 27,456 | $ | 22,501 | ||||
| Estimated Basel III advanced approaches risk-weighted assets |
$ | 290,080 | $ | 301,006 | ||||
|
|
|
|
|
|||||
| Pro forma Fully Phased-In Basel III advanced approaches Tier 1 common capital ratio |
9.5 | % | 7.5 | % | ||||
|
|
|
|
|
|||||
| Estimated Basel III standardized approach risk-weighted assets |
$ | 291,977 | N/A | |||||
|
|
|
|
|
|||||
| Pro forma Fully Phased-In Basel III standardized approach Tier 1 common capital ratio |
9.4 | % | N/A | |||||
|
|
|
|
|
|||||
| (a) | Represents net adjustments related to accumulated other comprehensive income for available for sale securities and pension and other postretirement benefit plans. |
PNC utilizes these capital ratio estimates to assess its Basel III capital position (without the benefit of phase-ins), including comparison to similar estimates made by other financial institutions. These Basel III capital estimates are likely to be impacted by any additional regulatory guidance, continued analysis by PNC as to application of the rules to PNC and, in the case of ratios calculated using the advanced approaches, the ongoing evolution, validation and regulatory approval of PNCs models integral to the calculation of advanced approaches risk-weighted assets.

