EX-99.1
Published on November 7, 2013

Exhibit 99.1
The PNC Financial Services Group, Inc.
BancAnalysts Association of Boston
November 7, 2013 |

2
Cautionary Statement Regarding Forward-Looking
Information and Adjusted Information
This presentation includes snapshot
information about PNC used by way of illustration. It is not intended as a full business or
financial review and should be viewed in the context of all of the information made
available by PNC in its SEC filings. The presentation also contains
forward-looking
statements
regarding
our
outlook
for
earnings,
revenues,
expenses,
capital
levels
and
ratios,
liquidity
levels,
asset
levels,
asset quality, financial position, and other matters regarding or affecting PNC and its future
business and operations. Forward-looking statements are necessarily subject to
numerous assumptions, risks and uncertainties, which change over time. The forward-looking
statements in this presentation are qualified by the factors affecting forward-looking
statements identified in the more detailed Cautionary Statement included in the
Appendix, which is included in the version of the presentation materials posted on our corporate website at
www.pnc.com/investorevents, and in our SEC filings. We provide greater detail regarding these
as well as other factors in our 2012 Form 10-K and our 2013 Form 10-Qs,
including in the Risk Factors and Risk Management sections and in the Legal Proceedings and Commitments
and Guarantees Notes of the Notes To Consolidated Financial Statements in those reports, and
in our subsequent SEC filings. Our forward- looking statements may also be subject
to other risks and uncertainties, including those we may discuss in this presentation or in SEC
filings, accessible on the SECs website at www.sec.gov and on PNCs corporate
website at www.pnc.com/secfilings. We have included web addresses in this presentation
as inactive textual references only. Information on those websites is not part of this presentation. Future
events or circumstances may change our outlook and may also affect the nature of the
assumptions, risks and uncertainties to which our forward-looking statements are
subject. Forward-looking statements in this presentation speak only as of the date of this presentation. We
do not assume any duty and do not undertake to update those statements. Actual results or
future events could differ, possibly materially, from those anticipated in
forward-looking statements, as well as from historical performance. In
this
presentation,
we
may
sometimes
refer
to
adjusted
results
to
help
illustrate
the
impact
of
certain
types
of
items.
This
information
supplements our results as reported in accordance with GAAP and should not be viewed in
isolation from, or as a substitute for, our GAAP results. We believe that this
additional information and the reconciliations we provide may be useful to investors, analysts, regulators and
others to help evaluate the impact of these respective items on our operations. We may also
provide information on return on tangible capital as well as return on capital to help
illustrate the impact of goodwill on that ratio and on tangible book value per share (calculated as
book value per share less total intangible assets, other than servicing rights, per share).
Where applicable, we provide GAAP reconciliations for such additional information,
including in the slides, the Appendix and/or other slides and materials on our corporate website at
www.pnc.com/investorevents and in our SEC filings. We may also use annualized, proforma,
estimated or third party numbers for illustrative or comparative purposes only. These
may not reflect actual results.
This presentation may also include discussion of other non-GAAP financial measures, which,
to the extent not so qualified therein or in the Appendix, is qualified by GAAP
reconciliation information available on our corporate website at www.pnc.com under About PNCInvestor
Relations. |
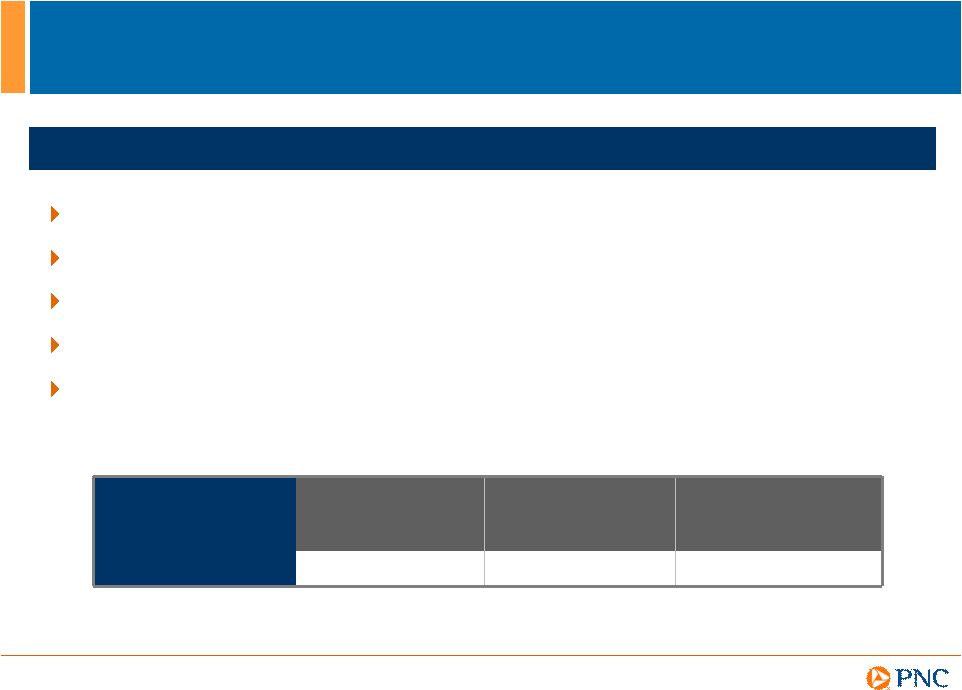
3
YTD13 Performance Summary
YTD13 financial
summary
Net income
Diluted EPS
from net
income
Return on
average assets
$3.2 billion
$5.55
1.40%
Grew loans and fee income
Maintained expense discipline
Continued improvement in overall credit quality
Demonstrated progress on strategic priorities
Strengthened capital position
Highlights |
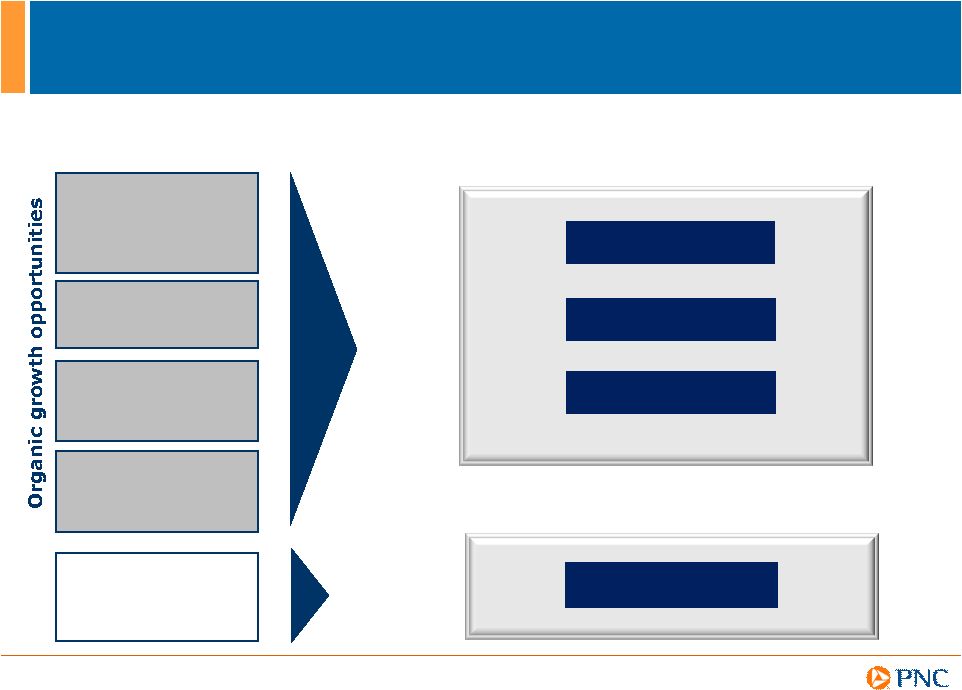
4
Redefine the Retail
Banking business
Drive growth in
acquired &
underpenetrated
markets
Capture more
investable assets
Build a stronger
Residential
Mortgage business
Manage expenses
Well-Positioned to Deliver Long-Term Value
Targeted
Outcomes
(1)
Increase
fee income
Expand
market share
Deepen
relationships
Improve operating
efficiencies
Strategic Priorities
(1) Refer to Cautionary Statement in the Appendix, including economic and other assumptions.
Does not take into account impact of potential legal and regulatory contingencies.
|
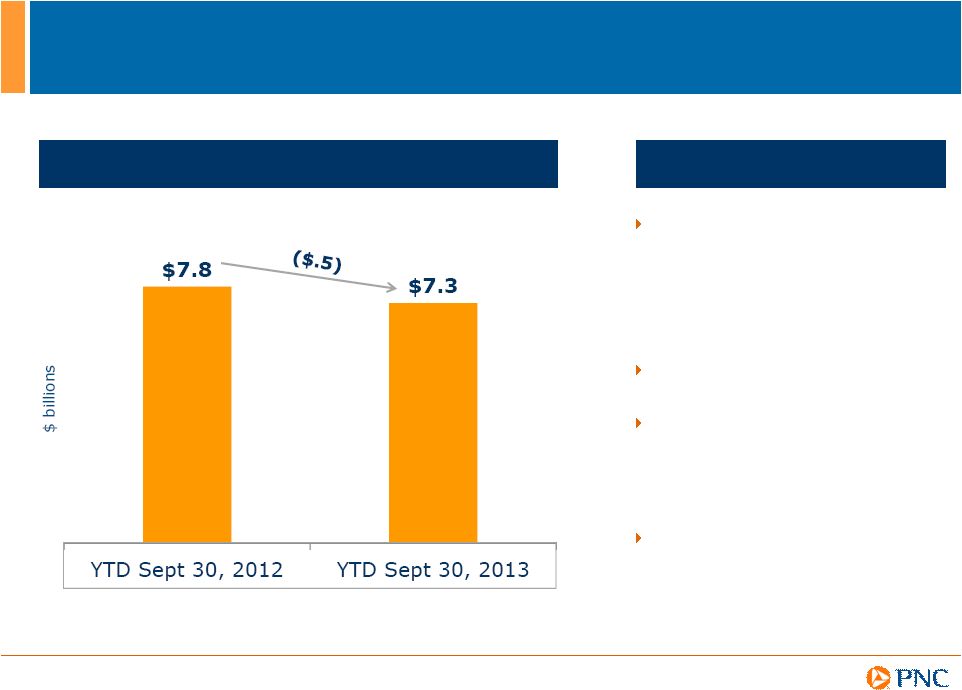
5
Noninterest Expense Trend
Executing Our Expense Objectives
We continue to focus on
expense savings initiatives
through PNCs Continuous
Improvement Program
YTD expenses down 6% for
the first time since 2010
Over 650 ideas are delivering
value in 2013
Process improvement efforts
begun in 2013 or beginning in
2014 should continue to be a
driver of future expense
reductions
Expense savings support
investment in our businesses
and infrastructure
Highlights |

Corporate
& Institutional Banking (C&IB)
Michael P. Lyons
EVP, Head of Corporate & Institutional Banking |
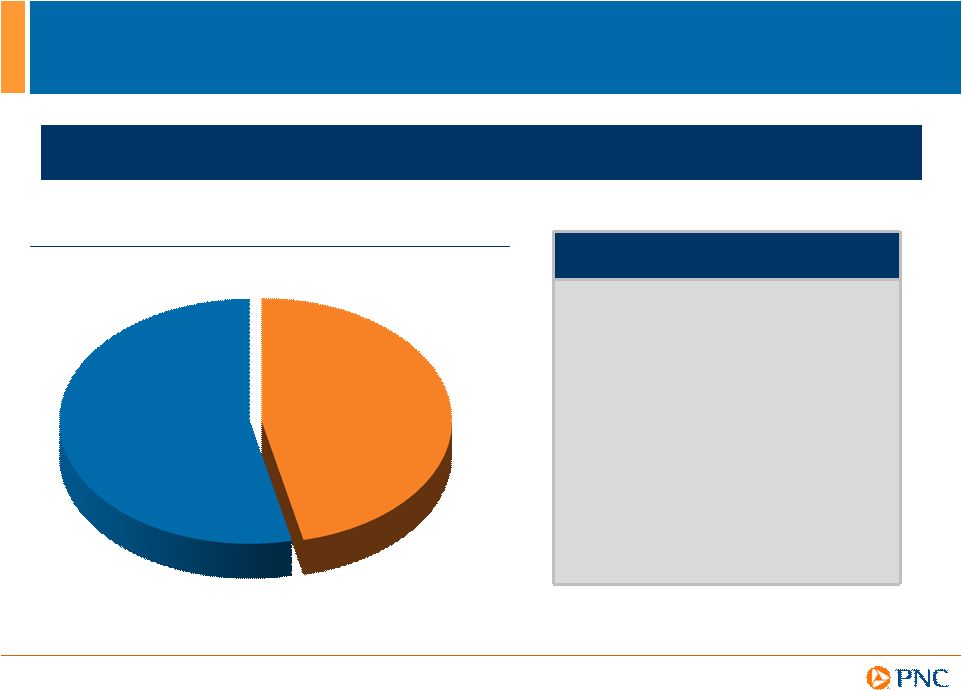
7
C&IB Overview
Corporate &
Institutional
Banking
60%
Contribution to PNC Earnings of $3.9B
(1)
C&IB serves large corporations, middle-market businesses, governments, and
not-for- profit institutions with annual revenues of $10 million and
above (1) As of or for the trailing twelve month period ended
9/30/13. (2) Allocated capital refers to capital which is allocated to our
business segments using our risk-based economic capital model, including consideration of
the goodwill at those business segments as well as the diversification of risk among
the business segments. (3) Efficiency ratio calculated as noninterest expense divided by
total revenue.
Financial Highlights
(1)
Net income
$2.3B
Return on average
allocated capital
(2)
24%
Efficiency ratio
(3)
36%
Loans
$99.3B
Deposits
$69.9B
NPAs to loans
.96%
Headcount
4,716
(1) |

8
Go to market locally and nationally as one organization
Leverage Regional President structure
Deliver superior customer service
Minimize turnover in client-facing personnel
Full complement of traditional banking products and services
Outsized capabilities in treasury management, asset-based
lending, commercial loan servicing, middle-market syndications,
middle-market M&A advisory services
Intentional product gaps
Strategy and Go-to-Market Approach
To be the leading relationship-based provider of credit and related
products and services through the cycles
Strategy
Approach
Products |

9
Well-Positioned into the Financial Crisis |
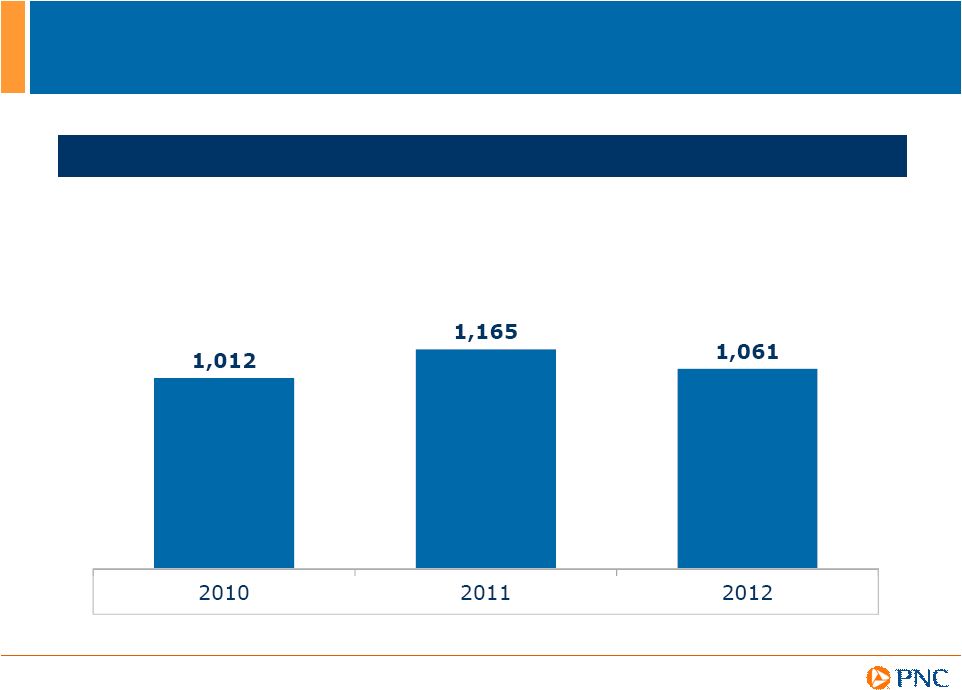
10
Significant New Primary Clients
(1) A Corporate Banking primary client is defined as a corporate
banking relationship with annual revenue generation of $50,000 or
more or, within Corporate Banking, a Commercial Banking client relationship with annual
revenue generation of $10,000 or more. New Corporate Banking Primary Clients
(1)
Won
(1) |
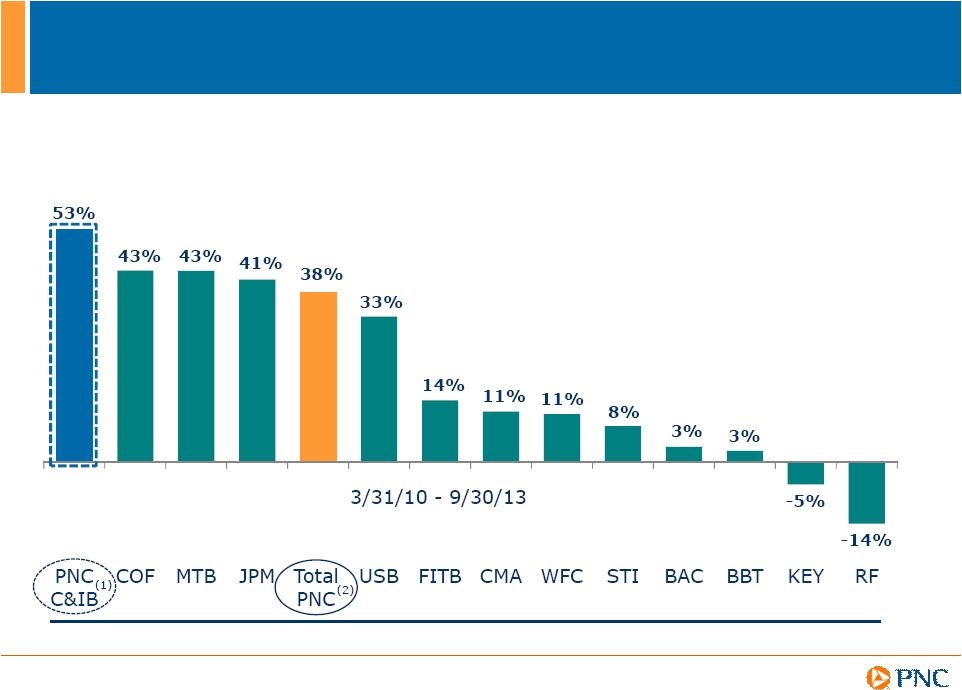
11
Strong Commercial Loan Growth
(1) C&IB commercial loan balances include commercial, commercial
real estate and equipment lease financing within the C&IB segment. Balances for certain
PNC commercial loan customers are reflected in PNC business segments other than
C&IB; in particular, small business customer loans are reflected in the Retail Banking segment. Excluding Southeast markets loan balances, C&IB
commercial loan growth for 9/30/13 compared to 3/31/10 was 44%. See Appendix for
reconciliation. (2) PNCs consolidated commercial loan balances include commercial, commercial real estate and
equipment lease financing across all segments. Peer Source: SNL Datasource except BBT, BAC, COF
and JPM, which are from company reports. JPM and COF loan growth reflect commercial banking
segment reported in company reports. BAC loan growth reflects U.S. commercial loan balances
only, as reported in its company reports. BBT reflects total commercial loans from company reports. |
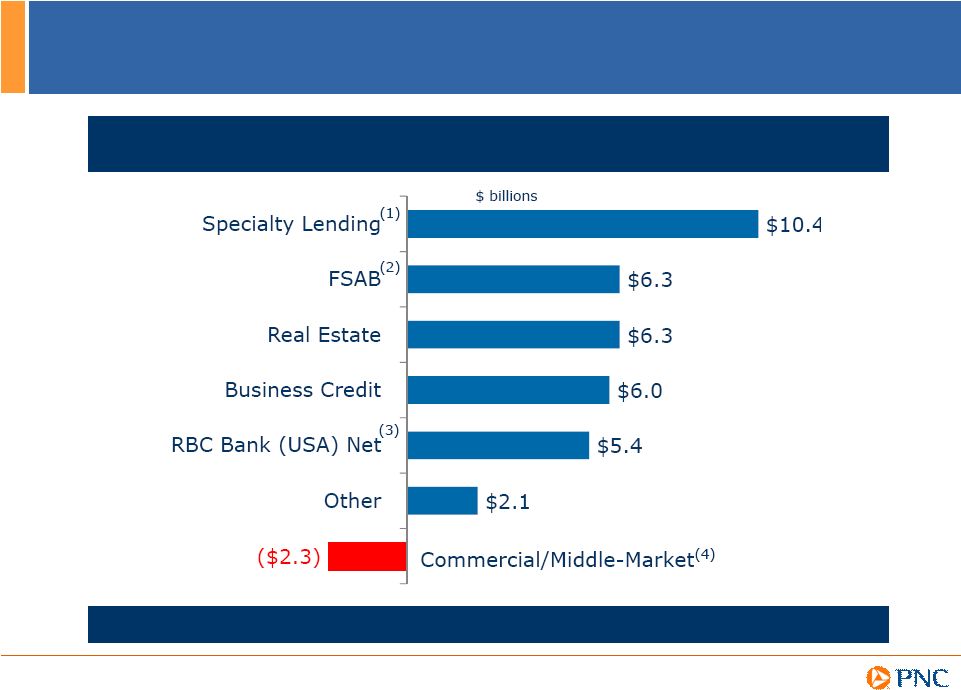
12
Loan Growth Driven by Specialty Areas
(1)
Specialty
Lending
includes
Healthcare,
Public
Finance,
Large
Corporate
and
Diversified
Industries
Group.
(2)
FSAB
refers
to
Financial
Services
Advisory
&
Banking.
(3)
Loans
acquired
in
RBC
Bank
(USA)
transaction,
net
of
run-off.
(4)
Commercial/Middle-
Market
includes
companies
within
the
Retail
Banking
footprint
with
annual
sales
between
$10
million
and
$500
million.
Change in C&IB Loans Outstanding
3/31/10-
9/30/13
Total Change in C&IB Loans: $34.2B or 53% |
13
Strong Performance Through the Crisis |
14
Scale
Asset-based Lender
(1)
Servicer of Commercial and
Multifamily loans
(2)
Wholesale lockbox volume
processor
(3)
Bank-affiliated leasing company
Commercial & Industrial lender
Middle Market Loan Syndications
Bookrunner
Purchasing Card issuer
Commercial Real Estate/Multifamily
lender
(8)
Franchise is Well-Positioned Today
Quality
TNS National Choice Award Winner for
Commercial and Business Banking
Middle Market Investment Bank of the
year
(10)
National Award Winner for Middle-
Market Treasury Management in
Overall Satisfaction, Product
Capabilities and Accuracy of
Operation
(11)
Midland Loan Services: highest
primary, master and special servicer
ratings from Fitch, S&P and
Morningstar
Top
3
#2
#4
#5
#5
#6
#3
#7
See Source Notes (1) through (11) in Appendix for details.
(4)
(5)
(6)
(7)
(9) |
15
Fragmented Industry
PNC Market Share
Top 10 Banks
Share of total
Corporate
Lending
(5)
39%
Other 6,930
banks
(5)
61%
Industry Market Share
Commercial
&
Industrial
(1)
Commercial
Real
Estate
(1)
Asset
Based
Lending
(2)
Leasing
(3)
3%
2%
15%
6%
Purchasing
Card Issuer
Volume
(4)
6%
(1) Source: FDIC, June 30, 2013. (2) Source: Commercial Finance Association, September 30,
2013. (3) Source: Monitor, 2012. (4) Purchasing Card market share based on Purchase
volume. Source: Nilson Report, July 2013. (5) Represents market share of the top 10
banks by assets in total Corporate lending and other banks, respectively. Source: FDIC, June
30, 2013. |
16
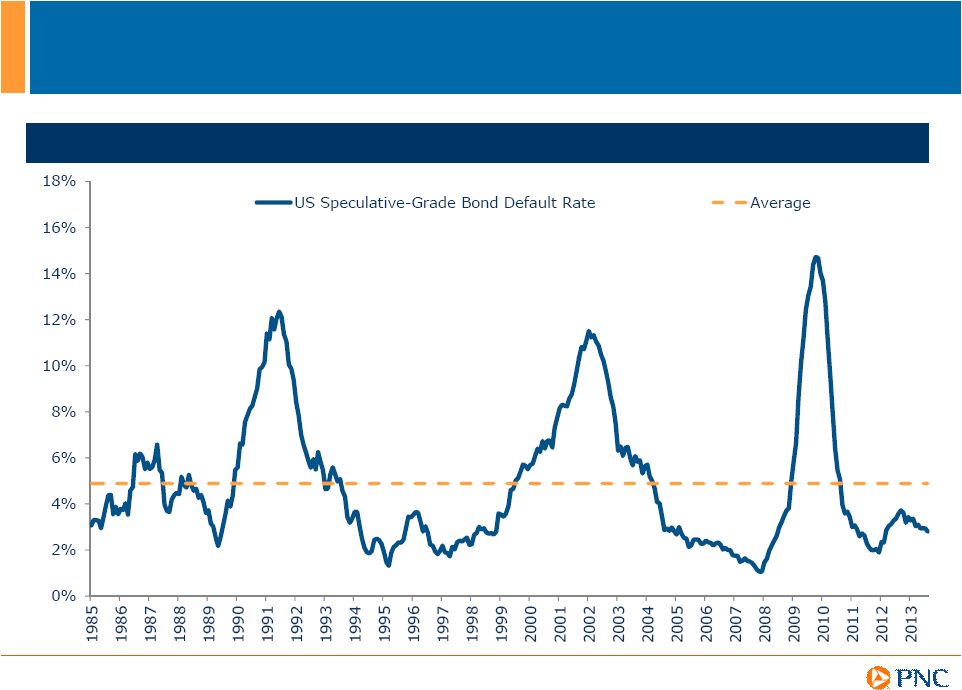
Highly Cyclical Business
Corporate Credit Losses
Moodys Speculative-Grade Bond Default Rate |

17
Clients in great financial shape, but cautious
Revolver utilization low; client cash balances high
Credit losses near cyclical lows
Banks, nonbanks and capital markets aggressively seeking
commercial assets
Pricing compressed, tenor up, terms looser
Difficult to generate required returns on loan-only deals
Current External Market Conditions |
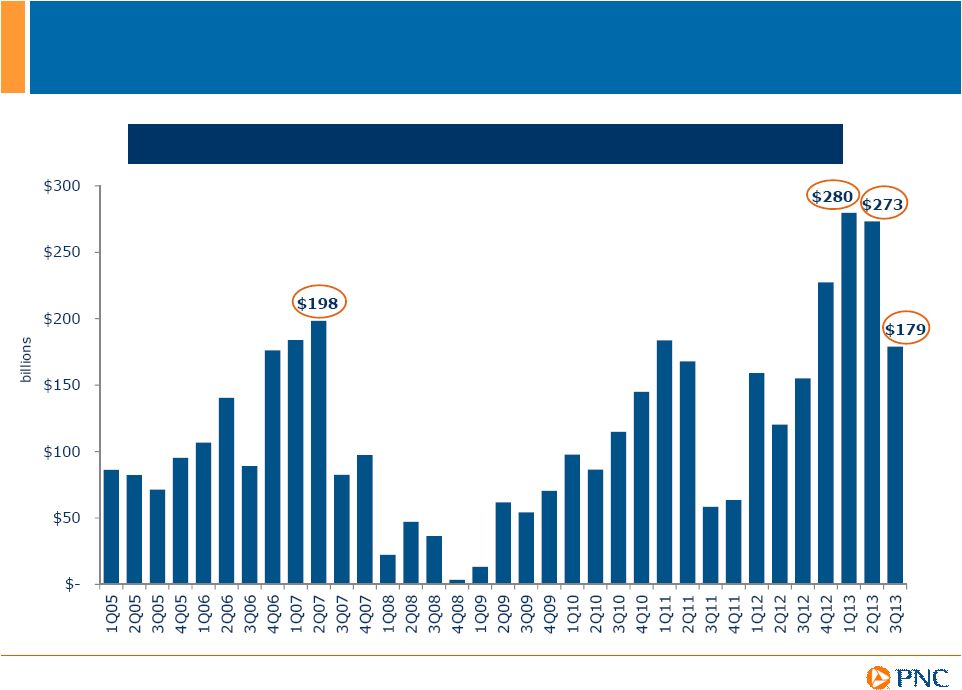
18
Capital Markets Near Record Highs
Institutional Term Loans + High Yield Bond Issuance
Source: Thomson Reuters LPC. |
19
No Change in Risk Appetite
Past
Present
Future
C&IB Risk Appetite Box |
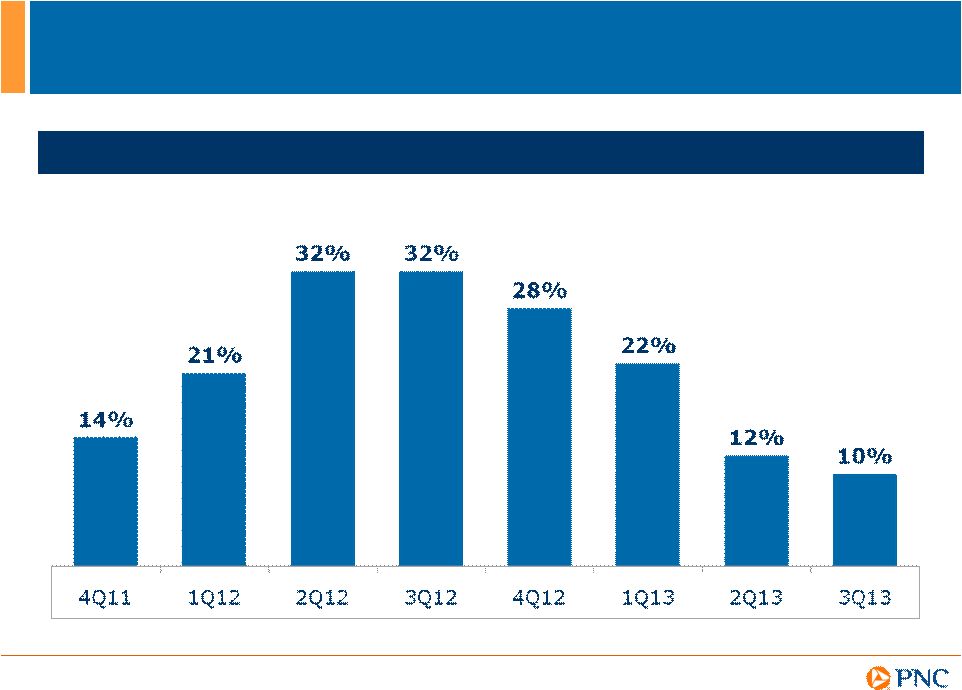
20
So Our Growth is Slowing
C&IB Year-Over-Year Growth in Average Loans
C&IB average loan balance was $62.7 billion for the three months
ended December 31, 2010. |
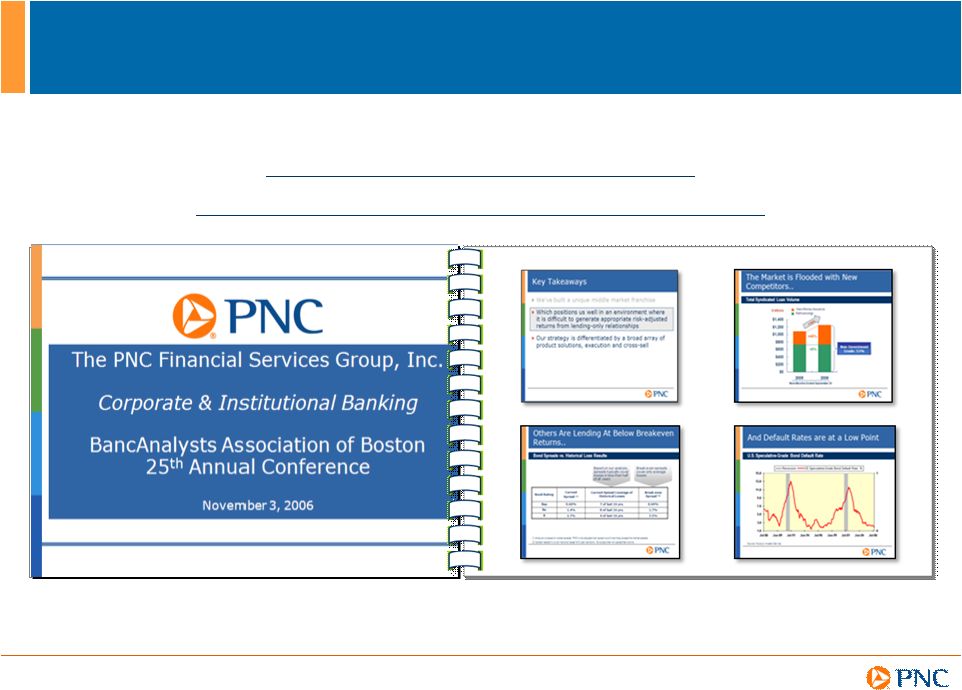
21
Not the First Time We Have Navigated this
Environment
Slides from Bill Demchaks
November 2006 BAAB Presentation |
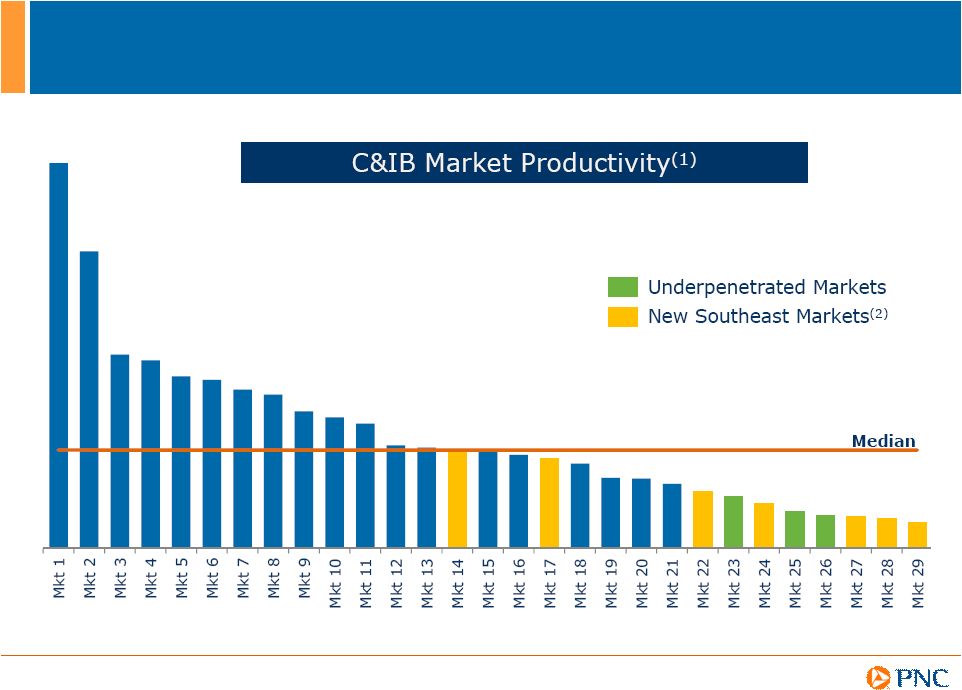
22
Significant Revenue Upside from Bringing All Markets
to Potential
(1) Productivity calculated as YTD September 30, 2013 pre-provision profits divided by MSA
population. (2) Southeast markets are in the states of Alabama, Georgia, North
Carolina, South Carolina and Florida. |
23
Proven Success in Increasing Cross-Sell
Sales Per Corporate Banking Relationship Manager
Western Markets as a % of Eastern Markets
(1)
(1) Western markets primarily NCC and Eastern markets primarily PNC.
(1) |
24
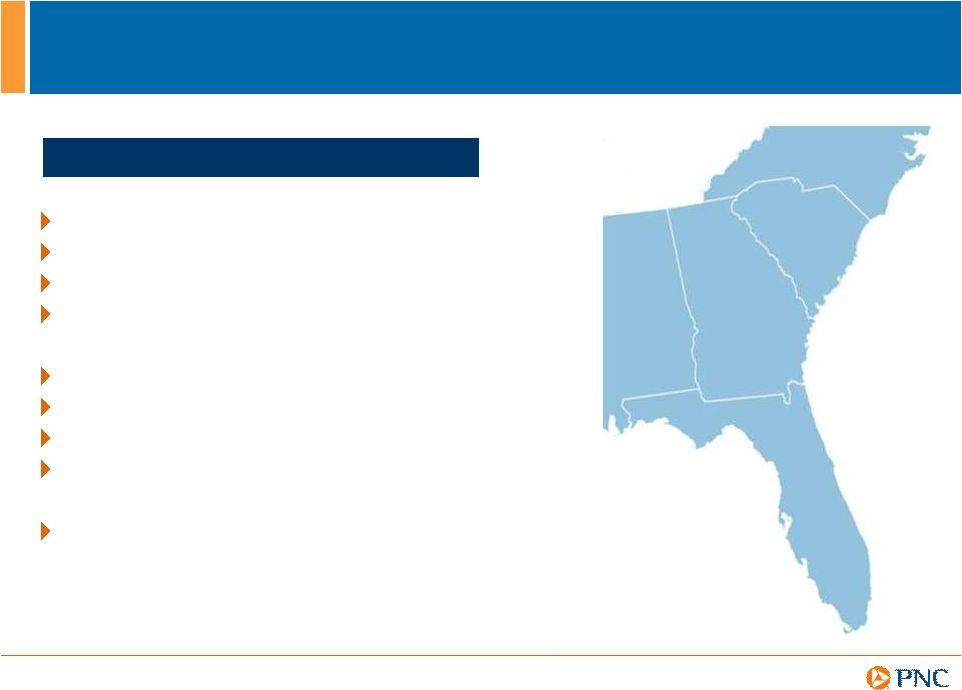
North
Carolina
South
Carolina
Georgia
Alabama
Florida
Strategic rationale confirmed
Hiring completed / top-tier team
Early results ahead of plan
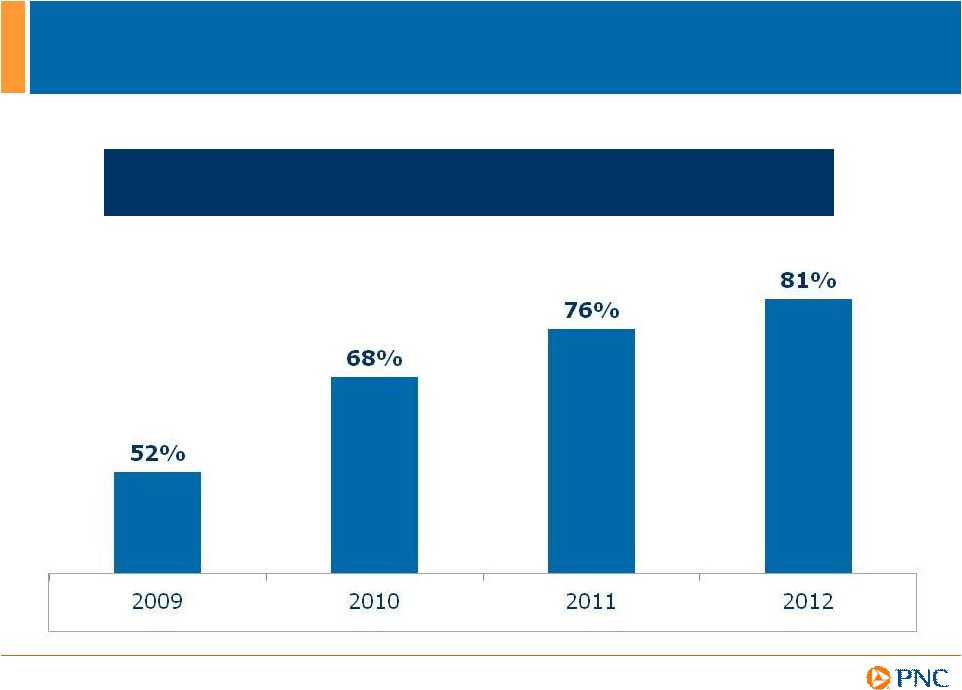
Strong receptivity to PNC name
Primary clients added YTD13 +30% Y/Y
Avg loans of $6B + 11% 3Q13 Y/Y
Brand recognition increased to 52%
Led or joint led 22 loan syndications
Markets less than ½
as productive as legacy
markets
(2)
Southeast Markets Update
C&IB Highlights
(1) PNC brand awareness was 29% at March 2012 and 52% at June 2013, a 79% increase. Source:
TNS Consumer Brand & Advertising Performance Research. (2) See Slide 22, including
Notes. (1) |
25
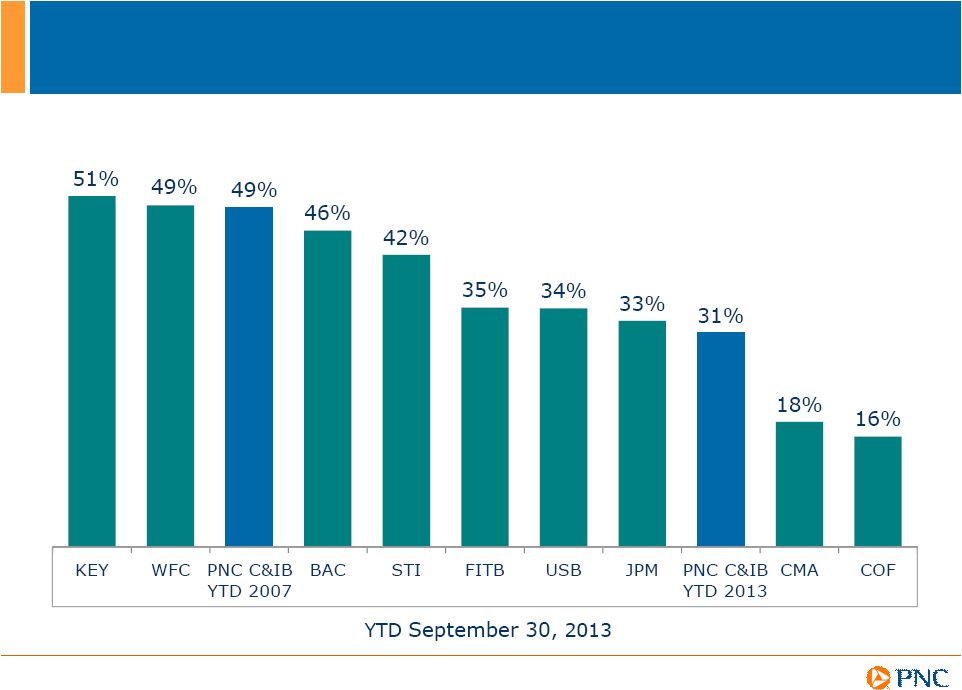
Fee Income Levels
Ratios
in
chart
above
were
calculated
by
dividing
noninterest
income
by
total
revenue.
Peers
selected
based
on
business
segments
comparable to PNCs
C&IB business. MTB and RF disclose their respective C&IB business segment in their
10-Qs which were not yet available for 3Q13 when this chart was prepared. BBT does
not have a comparable business segment to PNCs C&IB business segment. Peer
data for YTD September 30, 2013, from company reports. PNC data provided for YTD
September 30, 2007 and YTD September 30, 2013. |
26
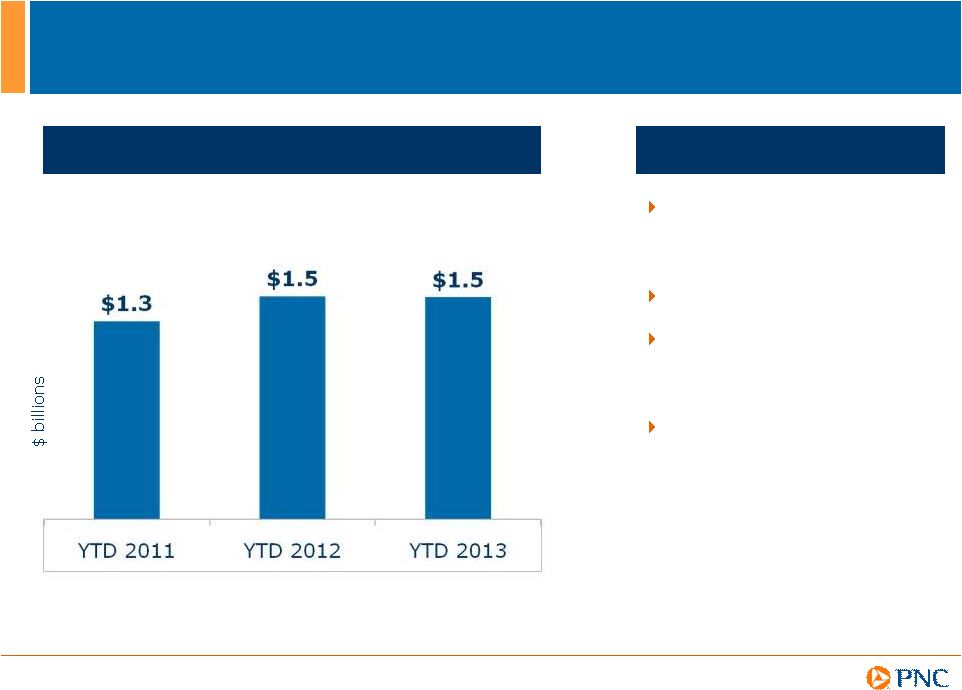
Be More Efficient
C&IB Noninterest Expense
Highlights
Significant opportunity for
us to do things more
efficiently
Focus on core processes
Currently in midst of
significant review of our
commercial credit process
Not curtailing investments |
27
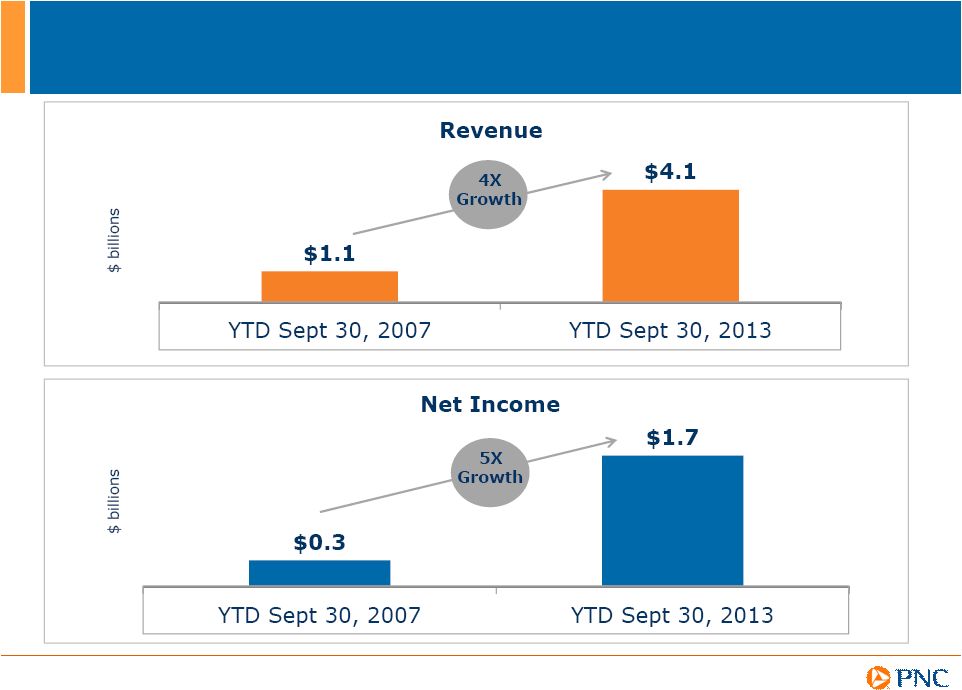
Key Takeaways
Grew C&IB earnings 5x through the crisis and gained significant share
Well-positioned today
Traditional and resilient business model
Current environment challenging
reminiscent of 2006-07
Our post-crisis growth is slowing
Corporate Banking business is highly cyclical
Attractive near-term and long-term growth opportunities
Consistent business model and risk appetite
Bring underpenetrated markets to full potential
Build a leading Southeast franchise
Cross-sell
Capitalize on the cycles
Low market shares |
28
Cautionary Statement Regarding Forward-Looking
Information
Appendix |

29
Cautionary Statement Regarding Forward-Looking
Information (continued)
Appendix
PNCs ability to take certain capital actions, including paying dividends and any plans to increase common stock dividends,
repurchase
common stock under
current or future programs, or issue or redeem preferred stock or other regulatory capital instruments, is subject to
the review of such proposed actions by the Federal Reserve as part of PNCs comprehensive
capital plan for the applicable period in connection
with
the
regulators
Comprehensive
Capital
Analysis
and
Review
(CCAR)
process
and
to
the
acceptance
of
such
capital
plan
and
non-objection to such capital actions by the Federal Reserve
PNCs regulatory capital ratios in the future will depend on, among other things, the companys financial performance, the scope and terms
of final capital regulations then in effect (particularly those implementing the Basel Capital
Accords), and management actions affecting the composition
of
PNCs
balance
sheet.
In
addition,
PNCs
ability
to
determine,
evaluate
and
forecast
regulatory
capital
ratios,
and
to
take
actions (such as capital distributions) based on actual or forecasted capital ratios, will be
dependent on the ongoing development, validation and regulatory approval of related
models. Legal
and
regulatory
developments
could
have
an
impact
on
our
ability
to
operate
our
businesses,
financial
condition,
results
of
operations,
competitive
position,
reputation,
or
pursuit
of
attractive
acquisition
opportunities.
Reputational
impacts
could
affect
matters
such
as
business generation and retention, liquidity, funding, and ability to attract and retain
management. These developments could include: Changes resulting from legislative and regulatory reforms, including major reform of the regulatory oversight structure of the
financial services industry and changes to laws and regulations involving tax, pension,
bankruptcy, consumer protection, and other industry aspects, and changes in accounting
policies and principles. We will be impacted by extensive reforms provided for in the
Dodd-Frank Wall Street Reform and Consumer Protection Act (the Dodd-Frank
Act) and otherwise growing out of the recent financial crisis, the precise
nature, extent and timing of which, and their impact on us, remains uncertain.
Changes to regulations governing bank
capital and liquidity standards, including due to the Dodd-Frank Act and to Basel-related
initiatives.
Unfavorable resolution of legal
proceedings or other claims and regulatory and other governmental investigations or other inquiries.
In
addition
to
matters
relating
to
PNCs
business
and
activities,
such
matters
may
include
proceedings,
claims,
investigations,
or
inquiries relating to pre-acquisition business and activities of acquired companies, such
as National City. These matters may result in monetary judgments or settlements
or other remedies, including fines, penalties, restitution or alterations in our business
practices, and in additional expenses and collateral costs, and may cause reputational harm to
PNC. Results of the regulatory
examination and supervision process, including our failure to satisfy requirements of agreements with
governmental agencies.
Impact
on
business
and
operating
results
of
any
costs
associated
with
obtaining
rights
in
intellectual
property
claimed
by
others
and of adequacy of our intellectual property protection in general.
|

30
Cautionary Statement Regarding Forward-Looking
Information (continued)
Appendix
Business and operating results are affected by our ability to identify and effectively
manage risks inherent in our businesses, including, where
appropriate,
through
effective
use
of
third-party
insurance,
derivatives,
and
capital
management
techniques,
and
to
meet
evolving
regulatory capital standards. In particular, our results currently depend on our ability
to manage elevated levels of impaired assets. Business
and
operating
results
also
include
impacts
relating
to
our
equity
interest
in
BlackRock,
Inc.
and
rely
to
a
significant
extent
on
information provided to us by BlackRock. Risks and uncertainties that could affect
BlackRock are discussed in more detail by BlackRock in its SEC filings.
We grow our business in part by acquiring from time to time other financial services
companies, financial services assets and related deposits and other liabilities.
Acquisition risks and uncertainties include those presented by the nature of the business acquired, including
in some cases those associated with our entry into new businesses or new geographic or other
markets and risks resulting from our inexperience in those new areas, as well as risks
and uncertainties related to the acquisition transactions themselves, regulatory issues, and
the integration of the acquired businesses into PNC after closing.
Competition can have an impact on customer acquisition, growth and retention and on
credit spreads and product pricing, which can affect market share, deposits and
revenues. Industry restructuring in the current environment could also impact our business and financial
performance
through
changes
in
counterparty
creditworthiness
and
performance
and
in
the
competitive
and
regulatory
landscape.
Our
ability to anticipate and respond to technological changes can also impact our ability to
respond to customer needs and meet competitive demands.
Business and operating results can also be affected by widespread natural and other
disasters, dislocations, terrorist activities, cyberattacks
or
international
hostilities
through
impacts
on
the
economy
and
financial
markets
generally
or
on
us
or
our
counterparties
specifically.
We provide greater detail regarding these as well as other factors in our 2012 Form
10-K and our 2013 Form 10-Qs, including in the Risk Factors and Risk
Management sections and the Legal Proceedings and Commitments and Guarantees Notes of the Notes To Consolidated
Financial
Statements
in
those
reports,
and
in
our
subsequent
SEC
filings.
Our
forward-looking
statements
may
also
be
subject
to
other
risks and uncertainties, including those we may discuss elsewhere in this presentation or in
SEC filings, accessible on the SECs website at www.sec.gov and on our corporate
website at www.pnc.com/secfilings. We have included these web addresses as inactive textual
references only. Information on these websites is not part of this document.
Any annualized, proforma, estimated, third party or consensus numbers in this presentation are
used for illustrative or comparative purposes
only
and
may
not
reflect
actual
results.
Any
consensus
earnings
estimates
are
calculated
based
on
the
earnings
projections
made
by
analysts
who
cover
that
company.
The
analysts
opinions,
estimates
or
forecasts
(and
therefore
the
consensus
earnings
estimates)
are
theirs alone, are not those of PNC or its management, and may not reflect PNCs or other
companys actual or anticipated results. |

31
Notes
Appendix
Source Notes For Slide 14
(1) Commercial Finance Association, September 30, 2013.
(2) Mortgage Bankers Association, 2012.
(3) Ernst & Young 2012 Cash Management Services Survey.
(4) Monitor
, 2012.
(5) FDIC based on outstandings as of June 30, 2013.
(6) Loan Pricing Corporation. Trailing nine months from September 30, 2013.
(7) Nilson Report, July 2013.
(8) FDIC based on outstandings as of June 30, 2013.
(9) Awarded April 10, 2013. Commercial is for companies with revenues up to $50 million.
(10) Mergers and Acquisitions Journal,
2012.
(11) Greenwich Survey National category 2012. |

32
Estimated Pro forma Basel III Tier I Common Capital
Appendix
Basel I Tier 1 Common Capital Ratio
Dollars in millions
Sept. 30, 2013
June 30, 2013
December 31, 2012
Sept. 30, 2012
Basel I Tier 1 common capital
$27,540
$26,668
$24,951
$24,382
Basel I risk-weighted assets
266,698
264,750
260,847
257,297
Basel I Tier 1 common capital ratio
10.3%
10.1%
9.6%
9.5%
Estimated Pro forma Basel III Tier 1 Common Capital Ratio (b)
Dollars in millions
Sept. 30, 2013
June 30, 2013
December 31, 2012
Basel I Tier 1 common capital
$27,540
$26,668
$24,951
Less regulatory capital adjustments:
Basel III quantitative limits
(2,011)
(2,224)
(2,330)
Accumulated other comprehensive income (a)
(231)
(241)
276
All other adjustments
(49)
(283)
(396)
Estimated Basel III Tier 1 common capital
$25,249
$23,920
$22,501
Estimated Basel III risk-weighted assets
289,063
290,838
301,006
Pro forma Basel III Tier 1 common capital ratio
8.7%
8.2%
7.5%
(a) Represents net adjustments related to accumulated other comprehensive income for available
for sale securities and pension and other postretirement benefit plans. (b) Pro forma
Basel III Tier 1 common capital ratio estimate not provided in 3Q12. We provide
information below regarding PNCs pro forma fully phased-in Basel III Tier 1 common capital ratio and how it differs from the Basel I
Tier 1 common capital ratio. This Basel III ratio, which is calculated using PNC's estimated
risk-weighted assets under the Basel III advanced approaches, will replace the
current Basel I ratio for this regulatory metric when PNC exits the parallel run qualification phase. The Federal
Reserve Board announced final rules implementing Basel III on July 2, 2013. Our estimate of
Basel III capital information set forth below is based on our current understanding of
the final Basel III rules. Tier 1 common capital as defined under the Basel III rules
differs materially from Basel I. For example, under Basel III, significant common stock
investments in unconsolidated financial institutions, mortgage servicing rights and deferred tax assets must be deducted from capital to the
extent they individually exceed 10%, or in the aggregate exceed 15%, of the institution's
adjusted Tier 1 common capital. Also, Basel I regulatory capital excludes certain other
comprehensive income related to both available for sale securities and pension and other
postretirement plans, whereas under Basel III these items are a component of PNC's capital.
Basel III risk-weighted assets were estimated under the advanced approaches
included in the Basel III rules and application of Basel II.5, and reflect credit, market and operational risk.
PNC utilizes this capital ratio estimate to assess its Basel III capital position (without the
benefit of phase-ins), including comparison to similar estimates made by other
financial institutions. This Basel III capital estimate is likely to be impacted by any additional regulatory guidance,
continued analysis by PNC as to the application of the rules to PNC, and the ongoing
evolution, validation and regulatory approval of PNC's models integral to the
calculation of advanced approaches risk-weighted assets. |

33
Non-GAAP to GAAP Reconcilement
Appendix
$ in millions
Trailing 12 Months - Actual
September 30, 2013
June 30, 2013
March 31, 2013
December 31, 2012
C&IB reported net income
$2,344
$542
$612
$541
$649
Annualized net income
$2,344
$2,151
$2,453
$2,195
$2,581
C&IB average allocated capital (1)
$9,590
$9,489
$9,495
$9,588
$9,787
Return on average allocated capital
24%
23%
26%
23%
26%
C&IB average allocated capital (1)
$9,590
$9,489
$9,495
$9,588
$9,787
C&IB average goodwill
$3,215
$3,215
$3,215
$3,214
$3,214
Total average tangible capital
$6,375
$6,274
$6,280
$6,374
$6,573
Return on average tangible capital
37%
34%
39%
34%
39%
(1) Allocated capital refers to capital which is allocated to our business segments using our
risk-based economic capital model, including consideration
of the goodwill at those business segments as well as the diversification of risk among the business segments.
PNC believes that return on average tangible capital, a non-GAAP measure, is useful as a
tool to help better evaluate the growth of a business apart from the amount of goodwill
considered in the allocation of capital which is used in the calculation of return on average allocated capital.
For
the three months ended |

34
Non-GAAP to GAAP Reconcilement
Appendix
As of
In millions except per share data
Dec. 31, 2007
Dec. 31, 2012
% Change
Common shareholders' equity
$14,847
$35,413
Common shares outstanding
341
528
Book value per common share
$43.60
$67.05
54%
Goodwill and other intangible assets, other than servicing rights (1)
$8,850
$9,798
Common shareholders' equity less intangible assets
$5,997
$25,615
Common shares outstanding
341
528
Tangible book value per common share
$17.59
$48.51
176%
(1) Servicing rights were $701 million and $1,071 at December 31, 2007 and December 31, 2012,
respectively. PNC
believes
that
tangible
book
value
per
common
share,
a
non-GAAP
measure,
is
useful
as
a
tool
to
help
evaluate
the amount, on a per share basis, of goodwill and other intangible assets included in book
value per common share. Sept. 30, 2013
March 31, 2010
% Change
In millions
C&IB loan balance, as reported
$99,337
$65,137
53%
Southeast
(1)
markets loan balance
$6,055
$208
C&IB loan balance, excluding Southeast
(1)
markets
$93,282
$64,929
44%
(1) AL, FL, NC, SC and GA.
As of |

35
Peer Group of Banks
Appendix
The PNC Financial Services Group, Inc.
PNC
BB&T Corporation
BBT
Bank of America Corporation
BAC
Capital One Financial, Inc.
COF
Comerica Inc.
CMA
Fifth Third Bancorp
FITB
JPMorgan Chase
JPM
KeyCorp
KEY
M&T Bank
MTB
Regions Financial Corporation
RF
SunTrust Banks, Inc.
STI
U.S. Bancorp
USB
Wells Fargo & Co.
WFC |