COMPANY PRESENTATION
Published on February 2, 2010

The PNC
Financial Services Group, Inc. Planned TARP Preferred Redemption, Sale of PNC Global Investment Servicing and Equity Offering February 2, 2010 Exhibit 99.2 |

2 Cautionary Statement Regarding Forward-Looking Information and Adjusted Information This presentation includes snapshot information about PNC used by way of
illustration. It is not intended as a full business or financial review and should be viewed in the context of all of the information made available by PNC in its SEC filings. The presentation
also contains forward-looking statements regarding our outlook or expectations relating to PNCs future business, operations, financial condition, financial performance,
capital and liquidity levels, and asset quality. Forward-looking statements are necessarily subject to numerous assumptions, risks and uncertainties, which change over time. The forward-looking statements in this presentation are qualified by the factors affecting
forward-looking statements identified in the more detailed Cautionary Statement included in the Appendix, which is included in the version of the presentation materials posted on
our corporate website at www.pnc.com/investorevents. We provide greater detail
regarding some of these factors in our 2008 Form 10-K and 2009 Form 10-Qs, including in the Risk Factors and Risk Management sections of those reports, and in our other SEC filings (accessible on the SECs website at www.sec.gov and on or through our
corporate website at www.pnc.com/secfilings). We have included web addresses here and elsewhere in this presentation as inactive textual references only. Information on these
websites is not part of this document. Future events or circumstances may change our outlook or expectations and may also affect the nature
of the assumptions, risks and uncertainties to which our forward-looking statements
are subject. The forward-looking statements in this presentation speak only as of the date of this presentation. We do not assume any duty and do not undertake to update those statements. In this presentation, we will sometimes refer to adjusted results to help illustrate the impact of
certain types of items, including our fourth quarter 2009 gain related to BlackRocks acquisition of Barclays Global Investors (BGI), our fourth quarter 2008
conforming provision for credit losses for National City, and other integration costs in the 2009 and 2008 periods. This information supplements our results as reported in accordance with
GAAP and should not be viewed in isolation from, or a substitute for, our GAAP results. We believe that this additional information and the reconciliations we provide may be
useful to investors, analysts, regulators and others as they evaluate the impact of these
respective items on our results for the periods presented due to the extent to which the items are not indicative of our ongoing operations. In certain discussions, we may also provide information on yields and margins for all
interest-earning assets calculated using net interest income on a taxable-equivalent basis by increasing the interest income earned on tax-exempt assets to make it fully equivalent to
interest income earned on taxable investments. We believe this adjustment may be useful when comparing yields and margins for all earning assets. This presentation may also include discussion of other non-GAAP financial measures, which, to
the extent not so qualified therein or in the Appendix, is qualified by GAAP reconciliation information available on our corporate website at www.pnc.com under About
PNCInvestor Relations. |

3 Key Messages PNC Continues to Build a Great Company. PNC Continues to Build a Great Company. (1) Estimated. See pages 5 and 19 for further information. Planned redemption of $7.6 billion of PNC preferred stock held by the US Treasury - Will eliminate $380 million in annual preferred dividends Definitive agreement to sell PNC Global Investment Servicing (GIS) for $2.3 billion - $1.6 billion increase to Tier 1 common capital 1 upon closing Planned $3.0 billion PNC common equity offering Proforma Tier 1 common capital ratio 1 of 8.0% to provide flexibility for future growth |

4 Equity Offering J.P. Morgan, Morgan Stanley Global coordinators In conjunction with other capital and liquidity actions announced today, redemption of PNC preferred stock held by the US Dept. of the Treasury Use of proceeds February 2, 2010 Expected equity pricing $25.8 billion Market cap (as of 2/1/2010) 461,416,582 Shares outstanding (pre-offer as of 1/31/2010) $55.86 Stock price (as of 2/1/2010) 100% primary common equity Share composition $3.0 billion / 15% Offering size/over-allotment PNC/NYSE Ticker/Exchange The PNC Financial Services Group, Inc. Issuer |
5 Risk-Based Capital Ratios 1.6 1.6 Net impact of sale of GIS 3 10.3% 8.0% Proforma ratios $23.4 $18.1 Proforma 11.5% 6.0% Ratios 3.0 (.3) $13.8 Tier 1 common 1 3.0 Common equity offering 2 (7.6) TARP redemption 2 $26.4 December 31, 2009 Tier 1 risk based 1 $ in billions (1) Estimated. (2) Anticipated to occur in the first quarter 2010. (3) Anticipated to occur
in the third quarter of 2010 subject to regulatory approvals and certain other
customary closing conditions. Further information is provided in the Appendix. Net cash
outflow from the TARP preferred redemption is expected to be $7.6 billion. PNC expects to issue $1.5 billion to $2 billion of senior debt to provide additional bank holding company
liquidity. |
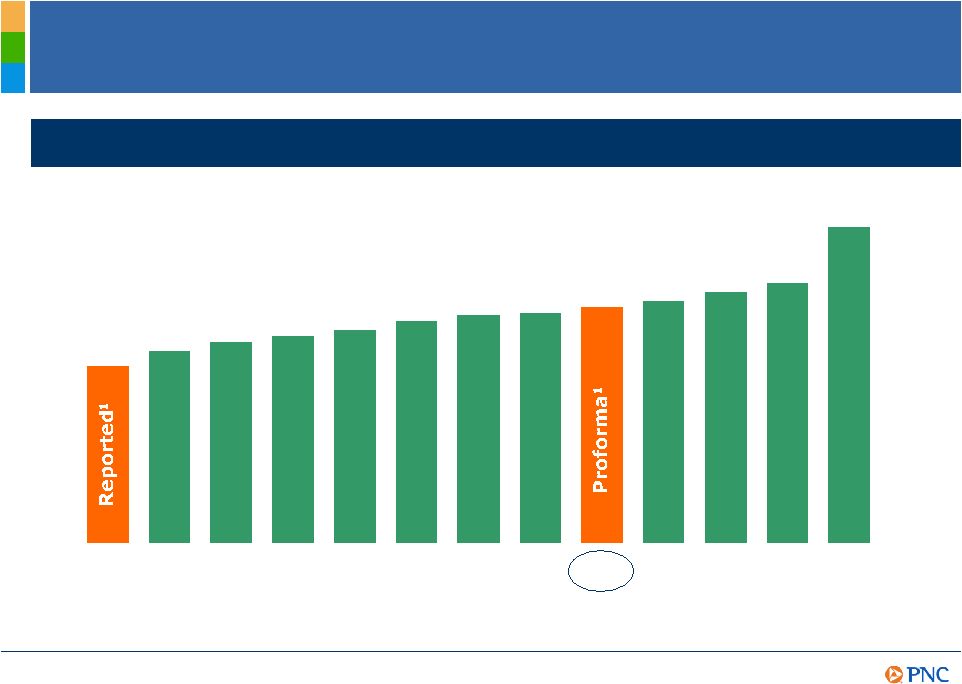
6 Relative Capital Positioning December 31, 2009 Tier 1 common ratio 6.5% 6.8% 7.0% 7.2% 7.7% 8.2% 8.5% 8.8% 10.7% 6.0% 7.8% 8.0% 7.5% PNC WFC USB FITB RF KEY STI BAC PNC CMA BBT JPM COF (1) Estimated. See page 5 for further information. Peer source: company reports.
|
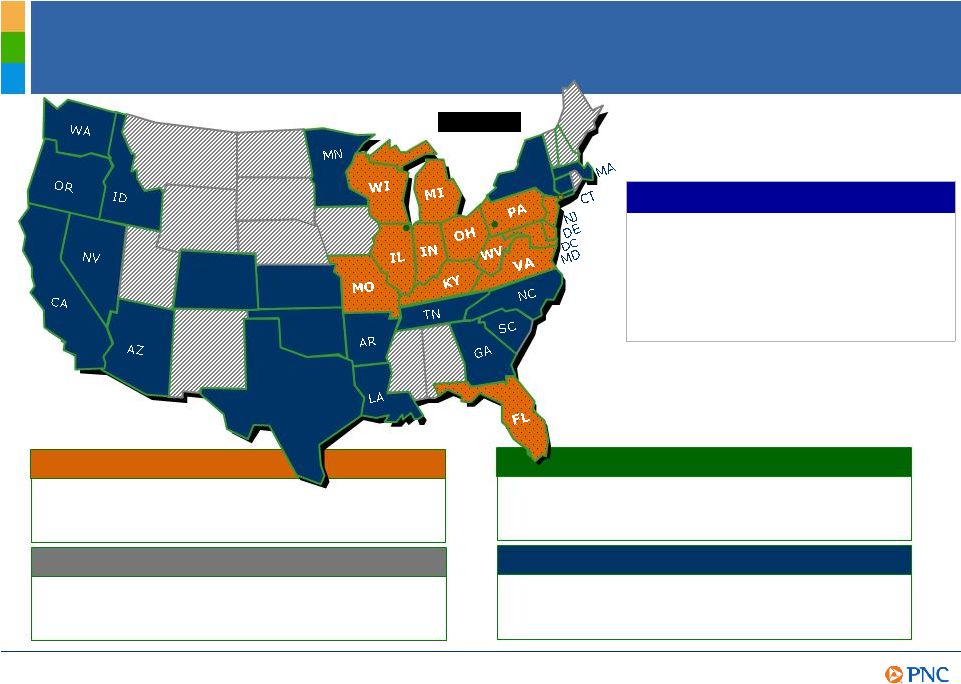
7 CO TX KS OK (offices in 21 countries) BlackRock 8 th $270 billion Assets U.S. Rank 1 Dec. 31, 2009 6,473 2,512 $187 billion 5 th ATMs 5 th Branches 5 th Deposits (1) Rankings source: SNL DataSource. PNCs Powerful Franchise Retail Footprint covering nearly 1/3 of the U.S. population Asset Management One of the largest bank-held asset managers in the U.S. Residential Mortgage Corporate & Institutional A leader in serving middle-market customers and government entities One of the nations largest mortgage platforms |

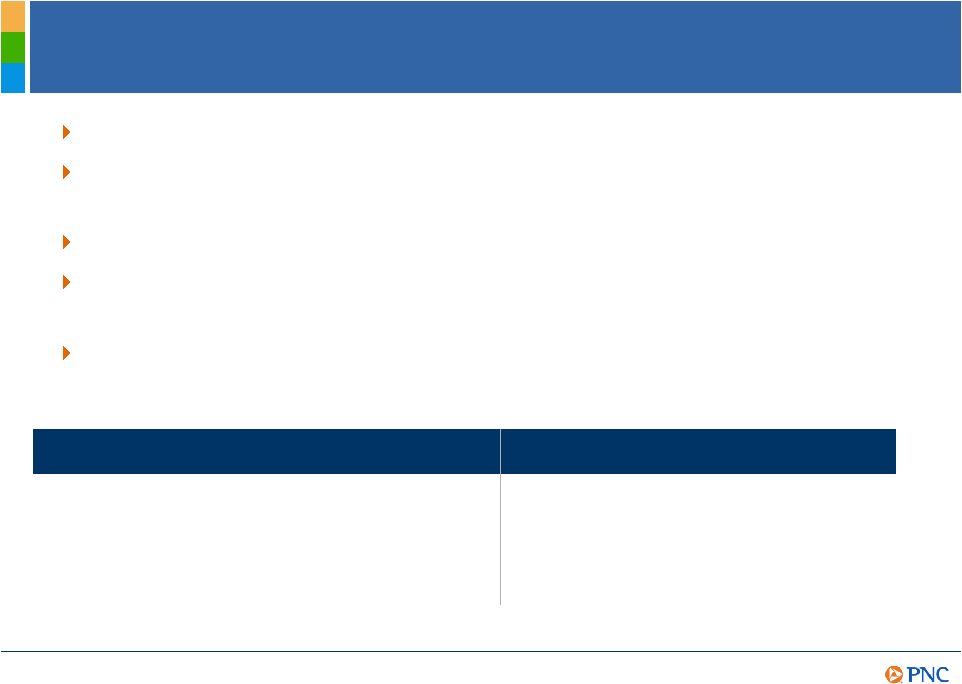
8 PNCs Framework for Success Execute on and deliver the PNC business model Capitalize on integration opportunities Emphasize continuous improvement culture Leverage credit that meets our risk/return criteria Focus on cross selling PNCs deep product offerings Focus front door on risk- adjusted returns Leverage back door credit liquidation capabilities Maximize credit portfolio value Reposition deposit gathering strategies Action Plans 0.17% N/A 45% 3.5% 93% Peers 2 Dec. 31, 2009 0.62% 1 >$1.2 billion 43% 1 2.4% 84% PNC Dec. 31, 2009 1.30%+ $1.5 billion >50% 0.3%-0.5% 80%-90% Target Return on average assets (for the year ended) Key Metrics Loan to deposit ratio (as of) Provision to average loans (for the year ended) Noninterest income/total revenue (for the year ended) Integration cost savings (4Q09, annualized) Executing our strategies PNC Business Model Staying core funded Returning to a moderate risk profile Growing high quality, diverse revenue streams Creating positive operating leverage (1) Excludes the impact of the $1.1 billion pretax, $687 million after-tax, gain related to
BlackRocks acquisition of Barclays Global Investors on December 1, 2009
(the BLK/BGI gain). Including the gain, noninterest income to total revenue percentage
for the year was 47% and the return on average assets for the year was .87%.
Further information is provided in the Appendix. (2) Peers represents average of banks identified in the Appendix. Source: SNL DataSource. |
9 2009 Financial Highlights Execution of the PNC business model delivered exceptional results Well-positioned balance sheet at year end with an improved risk profile, increased loan loss reserves, more liquidity and more capital Strong revenue performance of $17 billion from diversified sources Disciplined expense management - increased integration cost savings goal to $1.5 billion annualized Pretax pre-provision earnings 1 exceeded credit costs by $3.3 billion $4.36 $2,403 $16,988 FY09 $3,871 $3,987 $4,048 $5,082 Revenue $2.17 $1,107 4Q09 $1.03 $530 1Q09 $1.00 $559 3Q09 $207 Net income $.14 2Q09 Earnings per diluted common share In millions, except per share (1) Total revenue less noninterest expense. Revenue includes the $1.1 billion BLK/BGI gain in the
fourth quarter of 2009. Further information is provided in the Appendix.
|

10
A Higher Quality, Differentiated Balance Sheet Core funded - loan to deposit ratio of 84% Appropriately reserved - loss coverage ratio of 6.2% 1 Improved securities portfolio risk profile enhanced liquidity and shift to government and agency securities Asset sensitive duration of equity negative 1 year Proforma 2 Expected improvement to capital quality common equity would be $26 billion Balance sheet positioning $270 22 8 14 39 $187 $270 57 157 $56 Dec. 31, 2009 Common equity Preferred equity Total liabilities and equity Borrowed funds Deposits Other liabilities Other assets Loans Total assets Investment securities Category (billions)
PNC Made Substantial Progress in 2009 Transitioning the PNC Made Substantial Progress in 2009 Transitioning the Balance Sheet to Reflect Our Business Model. Balance Sheet to Reflect Our Business Model. (1) Calculated as the allowance for loan and lease losses combined with the remaining impairment
marks on loans acquired from National City that were impaired per FASB ASC 310-30
(AICPA SOP 03-3) as a percentage of the outstanding loan portfolio at December 31,
2009. (2) Reflects impact of equity offering and the impact of the planned sale of GIS. Further information is provided on pages 5 and 19. |
11
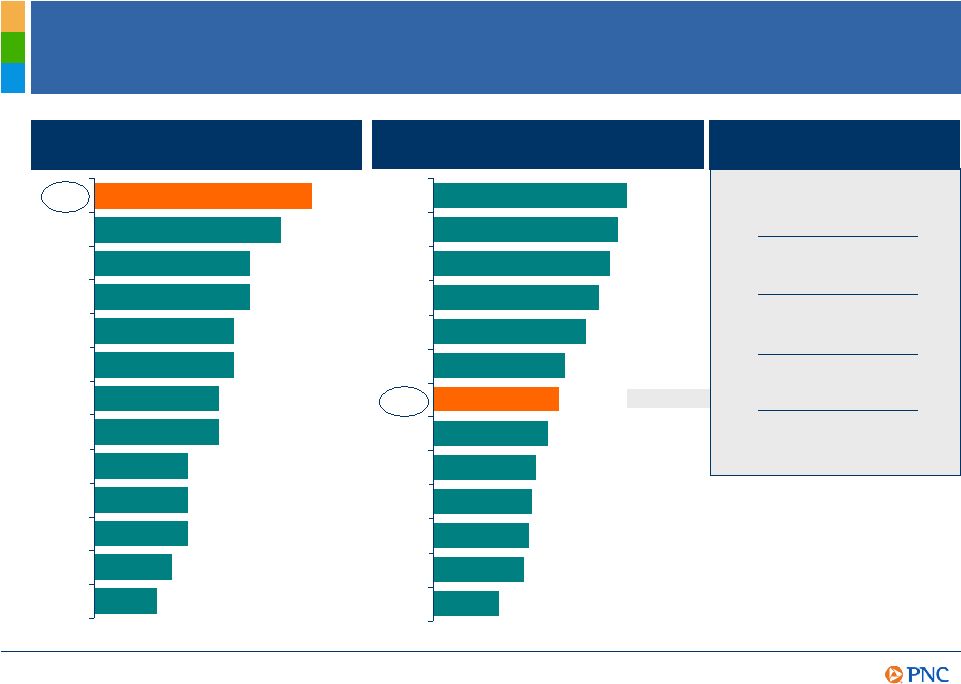
Stronger Loss Coverage Total loans 6.2% Commercial real estate 9.4% Commercial 4.0% Residential real estate 12.5% Consumer 4.7% 2009 reserves / total loans 4.99% 4.75% 4.54% 4.28% 3.94% 3.38% 3.22% 2.96% 2.64% 2.54% 2.45% 2.34% 1.69% JPM FITB COF KEY BAC RF PNC WFC STI USB BBT CMA MTB 2009 reserves / net charge-offs 1.9 1.7 1.5 1.5 1.4 1.4 1.3 1.3 1.1 1.1 1.1 1.0 0.9 PNC MTB BBT FITB RF JPM WFC USB CMA KEY BAC STI COF As of or for the year ended for 2009. Peer source: SNL DataSource. (1) Calculated as the allowance
for loan and lease losses combined with the remaining impairment marks on loans
acquired from National City that were impaired per FASB ASC 310-30 (AICPA SOP 03-3) as a percentage of the outstanding loan portfolio at December 31, 2009. PNC loss coverage ¹ including marks: X |
12
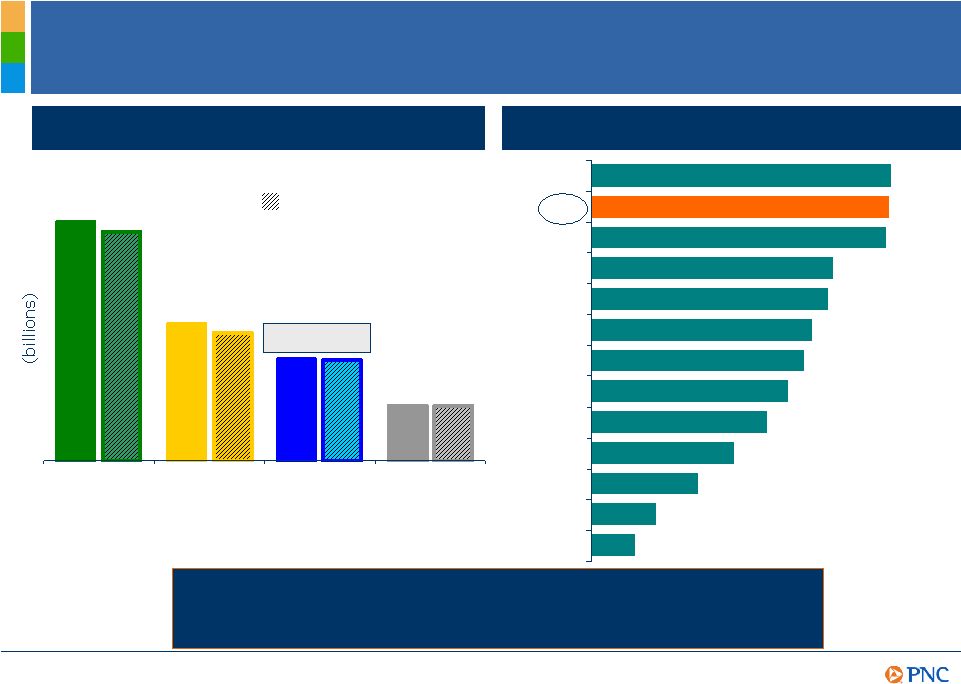
Pretax Pre-Provision Earnings ¹ Substantially Exceed Credit Costs PNC full year 2009 PNC Is Recognized for the Ability to Create Positive Operating PNC Is Recognized for the Ability to Create Positive Operating Leverage to Help Offset Credit Costs. Leverage to Help Offset Credit Costs. $17.0 $9.7 $7.3 $3.9 Peer source: SNL DataSource. (1) Total revenue less noninterest expense. Revenue includes the $1.1
billion BLK/BGI gain except where noted. Further information is provided in the
Appendix. (2) For full year 2009, GIS revenue was $781 million, expenses were $682 million, pretax pre-provision earnings were $99 million and provision was $0. (3) Further
information is provided in the Appendix. Revenue Expense Pretax pre- provision earnings ¹ Provision $16.2 $9.0 $7.2 $3.9 Excluding GIS ² 1.86 1.85 1.83 1.50 1.47 1.37 1.32 1.22 1.09 0.89 0.66 0.40 0.27 MTB PNC WFC JPM USB BBT COF FITB BAC CMA RF STI KEY 2009 pretax pre-provision earnings ¹ /provision Excluding the BLK/BGI gain 1.57x ³ X |
13
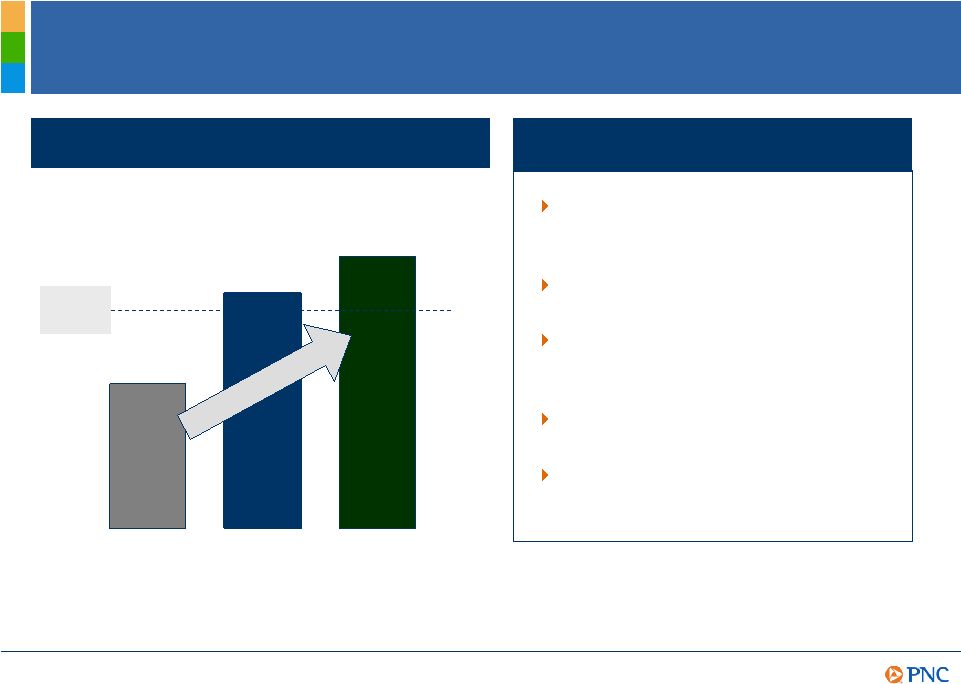
Cost Saves A Substantial Contributor to 2010 (1) Annualized acquisition-related cost savings goal. (2) 2010 expectations exclude the impact
of the $1.1 billion BLK/BGI gain and the 2010 impact of the planned sale of GIS.
(3) Total revenue less noninterest expense. PNC integration cost saves (millions)
2009 captured $800 $1,300+ June 2011 $1,500 2010 expectation 2010 expectations Net interest income and net interest margin consistent with 3Q09 annualized Lower noninterest income due to 2009 impact of MSR hedging gains Reduced expenses driven by increased acquisition cost saves and lower integration costs Credit cost improvement as the economy recovers Significant pretax pre-provision 4Q09 annualized >$1,200 2 goal 1 earnings 3 will continue to exceed credit costs |

14
Summary PNC Continues to Build a Great Company. PNC Continues to Build a Great Company. The execution of the PNC business model resulted in exceptional 2009 performance Actions announced today are consistent with PNCs disciplined use of capital - Redemption of TARP preferred will eliminate a degree of uncertainty for our shareholders, customers and employees - Issuance of common equity will improve the composition of our capital structure - Definitive agreement to sell GIS captures value at the appropriate time PNCs realistic opportunities for growth are expected to deliver significant value |

Appendix |

16
Cautionary Statement Regarding Forward-Looking Information Appendix This presentation includes snapshot information about PNC used by way of illustration and is not intended as a full business or financial review. It should not be viewed in isolation but rather in the context of all of the information made
available by PNC in its SEC filings. We also make statements in this presentation, and
we may from time to time make other statements, regarding our outlook or expectations for earnings, revenues, expenses, capital levels, liquidity levels, asset quality and/or other matters
regarding or affecting PNC that are forward-looking statements within the meaning
of the Private Securities Litigation Reform Act. Forward-looking statements are typically identified by words such as believe, plan, expect, anticipate, intend, outlook, estimate, forecast, will, project and other similar words and expressions. Forward- looking statements are subject to numerous assumptions, risks and uncertainties, which change over
time. Forward-looking statements speak only as of the date they are made. We do not
assume any duty and do not undertake to update our forward- looking
statements. Actual results or future events could differ, possibly materially, from those that we anticipated in our forward-looking statements, and future results could differ materially from our historical performance. Our forward-looking statements are subject to the following principal risks and
uncertainties. We provide greater detail regarding some of these factors
in our 2008 Form 10-K and 2009 Form 10-Qs, including in the Risk Factors and Risk Management sections of those reports, and in our other SEC filings. Our forward-looking statements may also be subject to other risks and
uncertainties, including those that we may discuss elsewhere in this presentation or in our filings with the SEC, accessible on the SECs website at www.sec.gov and on or through our corporate website at www.pnc.com/secfilings. We have included these web addresses as inactive textual references only. Information on these websites is not part of this document. Our businesses and financial results are affected by business and economic conditions, both
generally and specifically in the principal markets in which we operate. In particular,
our businesses and financial results may be impacted by: o Changes in interest rates and valuations in the debt, equity and other financial markets; o Disruptions in the liquidity and other functioning of financial markets, including such disruptions
in the markets for real estate and other assets commonly securing financial
products; o Actions by the Federal Reserve and other government agencies, including those that impact money
supply and market interest rates; o Changes in our customers, suppliers and other counterparties performance in general and their creditworthiness in particular; o Changes in levels of unemployment; and o Changes in customer preferences and behavior, whether as a result of changing business and economic
conditions or other factors. A continuation of recent turbulence in significant
portions of the US and global financial markets, particularly if it worsens, could impact our performance, both directly by affecting our revenues and the value of our assets and liabilities and indirectly by affecting our counterparties and the economy generally. Our business and financial performance could be impacted as the financial industry restructures in the current environment, both by changes in the creditworthiness and performance of our counterparties and by changes in the competitive and
regulatory landscape. Given current economic and financial market conditions, our
forward-looking financial statements are subject to the risk that these conditions will be substantially different than we are currently expecting. These statements are based on our
current expectations that interest rates will remain low in the first half of 2010 but
will move upward in the second half of the year and our view that the modest economic recovery that began last year will extend through 2010. |

17
Cautionary Statement Regarding Forward-Looking Information (continued) Appendix
Legal and regulatory developments could have an impact on our ability to operate our businesses or
our financial condition or results of operations or our competitive position or
reputation. Reputational impacts, in turn, could affect matters such as business generation and retention, our ability to attract and retain management, liquidity, and funding. These legal and regulatory developments
could include: o
Changes resulting from legislative and regulatory responses to the current economic and financial
industry environment, including current and future conditions or restrictions imposed
as a result of our participation in the TARP Capital Purchase Program; o
Other legislative and regulatory reforms, including
broad-based restructuring of financial industry regulation as well as changes to laws and regulations involving tax, pension, bankruptcy, consumer protection, and other aspects of the
financial institution industry; o
Increased litigation risk from recent regulatory and other governmental developments; o
Unfavorable resolution of legal proceedings or other claims and regulatory and other governmental
inquiries; o
The results of the regulatory examination and supervision process, including our failure to
satisfy the requirements of agreements with governmental agencies; o
Changes in accounting policies and principles; and o
Changes to regulations governing bank capital, including as a result of the so-called
Basel 3 initiatives.
If we do not redeem the Series N Preferred stock we issued to the US Department of the Treasury
such securities may limit our ability to return capital to our shareholders and are
dilutive to our common shares. If we are unable previously to redeem the shares, the dividend rate increases substantially after five years.
Our business and operating results are affected by our ability to identify and effectively manage
risks inherent in our businesses, including, where appropriate, through the effective
use of third-party insurance, derivatives, and capital management techniques, and by our ability to meet evolving regulatory capital standards.
The adequacy of our intellectual property protection, and the extent of any costs associated with
obtaining rights in intellectual property claimed by others, can impact our business and
operating results.
Our ability to anticipate and respond to technological changes can have an impact on our ability to
respond to customer needs and to meet competitive demands.
Our ability to implement our business initiatives and strategies could affect our financial
performance over the next several years.
Competition can have an impact on customer acquisition, growth and retention, as well as on our
credit spreads and product pricing, which can affect market share, deposits and
revenues.
Our business and operating results can also be affected by widespread natural disasters, terrorist
activities or international hostilities, either as a result of the impact on the economy
and capital and other financial markets generally or on us or on our customers, suppliers or other counterparties specifically.
Also, risks and uncertainties that could affect the results anticipated in forward-looking
statements or from historical performance relating to our equity interest in BlackRock,
Inc. are discussed in more detail in BlackRocks filings with the SEC, including in the Risk Factors sections of BlackRocks reports. BlackRocks SEC filings are accessible on the SECs website and on or through
BlackRocks website at www.blackrock.com. This material is referenced for
informational purposes only and should not be deemed to constitute a part of this document. In addition, our acquisition of National City Corporation (National City) on December
31, 2008 presents us with a number of risks and uncertainties related both to the
acquisition itself and to the integration of the acquired businesses into PNC. These risks and uncertainties include the following:
The anticipated benefits of the transaction, including anticipated cost savings and strategic
gains, may be significantly harder or take longer to achieve than expected or may not be
achieved in their entirety as a result of unexpected factors or events. |

18
Cautionary Statement Regarding Forward-Looking Information (continued) Appendix Our ability to achieve anticipated results from this transaction is dependent on the state going forward of the economic and financial markets, which have been under significant stress recently. Specifically, we may incur more credit
losses from National Citys loan portfolio than expected. Other issues
related to achieving anticipated financial results include the possibility that deposit attrition or attrition in key client, partner and other relationships may be greater than expected. Legal proceedings or other claims made and governmental investigations currently pending
against National City, as well as others that may be filed, made or commenced relating
to National Citys business and activities before the acquisition, could adversely impact our financial results. Our ability to achieve anticipated results is also dependent on our ability to bring National
Citys systems, operating models, and controls into conformity with ours and to do
so on our planned time schedule. The integration of National Citys business and operations into PNC, which includes conversion of National Citys different systems and procedures, may take longer than
anticipated or be more costly than anticipated or have unanticipated adverse results
relating to National Citys or PNCs existing businesses. PNCs ability to integrate National City successfully may be adversely affected by the fact that this transaction has resulted in PNC entering several markets
where PNC did not previously have any meaningful retail presence. In addition to the National City transaction, we grow our business from time to time by acquiring
other financial services companies. Acquisitions in general present us with risks, in addition to those presented by the nature of the business acquired, similar to some or all of those described above relating to the National City acquisition. Any annualized, proforma, estimated, third party or consensus numbers in this presentation are used
for illustrative or comparative purposes only and may not reflect actual results.
Any consensus earnings estimates are calculated based on the earnings projections made by analysts who cover that company. The analysts opinions, estimates or forecasts (and therefore the consensus earnings estimates) are theirs
alone, are not those of PNC or its management, and may not reflect PNCs or other
companys actual or anticipated results. |

19
Impact of Planned Sale of GIS ¹ (0.2) (0.0) Adjustments / other ² 1.1 Net intangible 1.3 Goodwill and other intangible assets Elimination of net intangible: Less: (1.5) Book equity / intercompany debt Cash Book (billions) $1.6 (0.2) 0.5 (0.3) 0.8 $2.3 PNC tangible capital improvement Eligible deferred income taxes on goodwill and other intangible assets After tax gain / increase in cash Taxes Pretax gain Sales price 1.8 (0.3) 2.1 $2.3 Estimated gain, cash proceeds and capital enhancement Appendix (1) Transaction is currently expected to close in the third quarter of 2010, subject to regulatory
approvals and certain other customary closing conditions. (2) Book column amount
reflects transaction expenses of $46 million; cash column amount reflects transaction expenses of $46 million and $138 million of deferred tax reversal.
|

20
Non-GAAP to GAAP Reconcilement Appendix (a) Calculated using a marginal federal income tax rate of 35%. The after-tax gain on the
BlackRock/BGI transaction also reflects the impact of state income taxes. For the three months ended, in millions
Pretax Income taxes (benefit) (a) Net income Reported net income (loss) ($246) National City conforming provision for credit losses $504 ($176) 328 Net income excluding National City conforming provision for credit losses $82 Year ended, in millions
Pretax Income taxes (benefit) (a) Net income Diluted EPS Reported net income $2,403 $4.36 Gain on BlackRock/BGI transation ($1,076) $389 (687) (1.51) Net income excluding gain on BlackRock/BGI transaction $1,716 $2.85 Year ended, in millions
Net income Average assets Return on average assets Reported $2,403 $276,876 0.87% Excluding gain on BlackRock/BGI transaction $1,716 $276,876 0.62% December 31, 2008 PNC believes that information adjusted for the impact of certain items may be useful due to the extent to which the items are not indicative of our ongoing operations. December 31, 2009 PNC believes that information adjusted for the impact of certain items may be useful due to the extent to which the items are not indicative of our ongoing operations. December 31, 2009 |

21
Non-GAAP to GAAP Reconcilement Appendix in millions Reported Gain on BlackRock/BGI transaction Reported excluding BlackRock/BGI gain Reported Gain on BlackRock/BGI transaction Reported excluding BlackRock/BGI gain Net interest income $9,054 $9,054 $2,345 $2,345 Noninterest income 7,934 $1,076 6,858 2,737 $1,076 1,661 Total revenue $16,988 $1,076 $15,912 $5,082 $1,076 $4,006 Noninterest income/total revenue 47% 43% 54% 41% in millions Reported excluding BlackRock/BGI gain Global Investment Servicing Reported excluding BlackRock/BGI gain and Global Investment Servicing Net interest income $9,054 ($29) $9,083 Noninterest income 6,858 810 6,048 Total revenue $15,912 $781 $15,131 Noninterest income/total revenue 43% 40% Year ended Dec. 31, 2009 Three months ended Dec. 31, 2009 Year ended Dec. 31, 2009 PNC believes that information adjusted for the impact of certain items may be useful due to the
extent to which the items are not indicative of our ongoing operations.
|

22
Non-GAAP to GAAP Reconcilement Appendix Year ended March 31, 2009 June 30, 2009 Sept. 30, 2009 Dec. 31, 2009 Dec. 31, 2009 in millions Total revenue $3,871 $3,987 $4,048 $5,082 $16,988 Noninterest expense 2,328 2,658 2,379 2,369 9,734 Pretax pre-provision earnings $1,543 $1,329 $1,669 $2,713 $7,254 Provision for credit losses 880 1,087 914 1,049 3,930 Excess of pretax pre-provision earnings over credit losses $663 $242 $755 $1,664 $3,324 Net charge-offs $431 $795 $650 $835 $2,711 Pretax pre-provision earnings / provision 1.85 Total revenue $3,871 $3,987 $4,048 $5,082 $16,988 Gain on BlackRock/BGI transaction 1,076 1,076 Total revenue excluding BlackRock/BGI gain 3,871 3,987 4,048 4,006 15,912 Noninterest expense 2,328 2,658 2,379 2,369 9,734 Pretax pre-provision earnings excluding BlackRock/BGI gain $1,543 $1,329 $1,669 $1,637 $6,178 Provision for credit losses 880 1,087 914 1,049 3,930 Excess of pretax pre-provision earnings excluding BlackRock/BGI gain over credit losses $663 $242 $755 $588 $2,248 Net charge-offs $431 $795 $650 $835 $2,711 Pretax pre-provision earnings excluding BlackRock/BGI gain / provision 1.57 Three months ended PNC believes that pretax pre-provision earnings is useful as a tool to help evaluate ability to
provide for credit costs through operations. PNC believes that information adjusted for the impact of certain items may be useful due to the extent to which the items are not
indicative of our ongoing operations. |

23
Non-GAAP to GAAP Reconcilement Appendix Adjustments, Income taxes Net Diluted Adjustments, Income taxes Net Diluted For the three months ended, in millions except per share data
Pretax (benefit) (a) Income EPS Pretax (benefit) (a) Income EPS Net income, as reported $1,107 $2.17 $559 $1.00 Adjustments: Gain on BlackRock/BGI transaction ($1,076) $389 (687) (1.49) Integration costs 155 (54) 101 .22 $89 ($31) 58 .12 Net income, as adjusted $521 $.90 $617 $1.12 Adjustments, Income taxes Net Diluted For the three months ended, in millions except per share data
Pretax (benefit) (a) Income EPS Net income (loss), as reported ($246) $(.77) Adjustments: Conforming provision for credit losses - National City $504 ($176) 328 .94 Other integration costs 81 (29) 52 .15 Net income, as adjusted $134 $.32 Adjustments, Income taxes Net Diluted Adjustments, Income taxes Net Diluted Year ended, in millions except per share data
Pretax (benefit) (a) Income EPS Pretax (benefit) (a) Income EPS Net income, as reported $2,403 $4.36 $914 $2.44 Adjustments: Gain on BlackRock/BGI transaction $(1,076) $389 (687) (1.51) Conforming provision for credit losses - National City $504 ($176) 328 .95 Other integration costs 421 (147) 274 .60 145 (51) 94 .27 Net income, as adjusted $1,990 $3.45 $1,336 $3.66 December 31, 2009 September 30, 2009 December 31, 2008 December 31, 2009 December 31, 2008 PNC believes that information adjusted for the impact of certain items may be useful due to the
extent to which the items are not indicative of our ongoing operations. (a) Calculated using a marginal federal income tax rate of 35%. The after-tax gain on
the BlackRock/BGI transaction also reflects the impact of state income taxes. |

24
Peer Group of Banks Appendix The PNC Financial Services Group, Inc. PNC BB&T Corporation BBT Bank of America Corporation BAC Capital One Financial, Inc. COF Comerica Inc. CMA Fifth Third Bancorp FITB JPMorgan Chase JPM KeyCorp KEY M&T Bank MTB Regions Financial Corporation RF SunTrust Banks, Inc. STI U.S. Bancorp USB Wells Fargo & Company WFC Ticker |

25
The PNC Financial Services Group, Inc. PNC has filed a registration statement (including a prospectus) (File No. 333-164364) with the SEC for the offering to which this communication relates. Before you invest, you should read the prospectus in that registration statement and other documents PNC has filed with the SEC for more complete information about PNC and this offering. You may get these documents for free by visiting EDGAR on the SEC Web site at www.sec.gov. Alternatively, copies of the prospectus may be obtained from J.P. Morgan Securities Inc. toll free at (866) 803-9204 or Morgan Stanley & Co. Incorporated toll free at (800) 718-1649.
|