REVISED MD&A AND FINANCIAL STATEMENTS FROM THE 2008 ANNUAL REPORT ON FORM 10-K
Published on January 15, 2010
Exhibit 99.1
MANAGEMENTS DISCUSSION AND ANALYSIS OF FINANCIAL CONDITION AND RESULTS OF OPERATIONS
This Managements Discussion and Analysis of Financial Condition and Results of Operations (MD&A) should be read together with the audited consolidated financial statements included in this Exhibit 99.1. For information regarding certain business and regulatory risks, see the Risk Management section of this MD&A and the Risk Factors discussion that appears in Item 1 of our Annual Report on Form 10-K for the year ended December 31, 2008 (2008 Form 10-K). Also, see the Cautionary Statement Regarding Forward-Looking Information and Critical Accounting Policies and Judgments sections of this MD&A for certain other factors that could cause actual results or future events to differ, perhaps materially, from historical performance and those anticipated in the forward-looking statements included in this Exhibit 99.1.
EXECUTIVE SUMMARY
THE PNC FINANCIAL SERVICES GROUP, INC.
The PNC Financial Services Group, Inc. (PNC) is one of the largest diversified financial services companies in the United States based on assets and is headquartered in Pittsburgh, Pennsylvania.
As described further below, on December 31, 2008, PNC acquired National City Corporation (National City), nearly doubling our assets to a total of $291 billion and expanding our total consolidated deposits to $193 billion. Our Consolidated Balance Sheet includes the impact of National City as of December 31, 2008.
Prior to the acquisition, PNC had businesses engaged in retail banking, corporate and institutional banking, asset management, and global investment servicing, providing many of its products and services nationally and others in PNCs primary geographic markets located in Pennsylvania, New Jersey, Washington, DC, Maryland, Virginia, Ohio, Kentucky and Delaware. PNC also provided certain investment servicing internationally.
National Citys primary businesses prior to its acquisition by PNC included commercial and retail banking, mortgage financing and servicing, consumer finance and asset management, operating through an extensive network in Ohio, Florida, Illinois, Indiana, Kentucky, Michigan, Missouri, Pennsylvania and Wisconsin. National City also conducted selected consumer lending businesses and other financial services on a nationwide basis.
PNC is now in the process of integrating the business and operations of National City with those of PNC.
KEY STRATEGIC GOALS
We manage our company for the long term and are focused on returning to a moderate risk profile while maintaining strong capital and liquidity positions, investing in our markets and products, and embracing our corporate responsibility to the communities where we do business.
Our strategy to enhance shareholder value centers on driving positive operating leverage by achieving growth in revenue from our balance sheet and diverse business mix that exceeds growth in expenses controlled through disciplined cost management. In each of our current business segments, the primary drivers of revenue growth are the acquisition, expansion and retention of customer relationships. We strive to expand our customer base by offering convenient banking options and leading technology solutions, providing a broad range of fee-based and credit products and services, focusing on customer service, and through a significantly enhanced branding initiative. We may also grow revenue through appropriate and targeted acquisitions and, in certain businesses, by expanding into new geographical markets.
We are focused on our strategies for quality growth. We are committed to returning to a moderate risk profile characterized by disciplined credit management and limited exposure to earnings volatility resulting from interest rate fluctuations and the shape of the interest rate yield curve. Our actions have created a well-positioned and strong balance sheet, ample liquidity and investment flexibility to adjust, where appropriate and permissible, to changing interest rates and market conditions.
We continue to be disciplined in investing capital in our businesses while returning a portion to shareholders through dividends and share repurchases when appropriate and permissible. See the Funding and Capital Sources section of the Consolidated Balance Sheet Review section and the Liquidity Risk Management section of this MD&A regarding certain restrictions on dividends and common share repurchases resulting from PNCs participation in the US Treasurys Troubled Asset Relief Program (TARP) Capital Purchase Program and dividend capacity.
On March 1, 2009, the Board decided to reduce PNCs quarterly common stock dividend from $0.66 to $0.10 per share. The next dividend is expected to be declared in early April 2009. Our Board recognizes the importance of the dividend to our shareholders. While our overall capital and liquidity positions are strong, extreme economic and market deterioration and the changing regulatory environment drove this difficult but prudent decision. This proactive measure will help us build capital, further strengthen our balance sheet and continue to serve our customers.
1
ACQUISITION OF NATIONAL CITY CORPORATION
On December 31, 2008, we acquired National City for approximately $6.1 billion. The total consideration included approximately $5.6 billion of PNC common stock, $150 million of preferred stock, and cash paid to warrant holders by National City.
We completed the acquisition primarily by issuing approximately 95 million shares of PNC common stock. In accordance with purchase accounting methodologies, National City Banks balance sheet was adjusted to fair value at which time the bank was under-capitalized from a regulatory perspective. However, PNCs Consolidated Balance Sheet remained well-capitalized and liquid.
Following the closing, PNC received $7.6 billion from the US Department of the Treasury under the Emergency Economic Stabilization Act of 2008 in exchange for the issuance of preferred stock and a warrant. These proceeds were used to enhance National City Banks regulatory capital position to well-capitalized in order to continue serving the credit and deposit needs of existing and new customers. On a consolidated basis, these proceeds resulted in further improvement to our capital and liquidity positions.
National City, based in Cleveland, Ohio, was one of the nations largest commercial banking organizations based on assets. We expect to incur total merger and integration costs of approximately $1.2 billion in connection with the acquisition of National City, including $575 million recognized in the fourth quarter of 2008. The transaction is expected to result in the reduction of approximately $1.2 billion of combined company annualized noninterest expense through the elimination of operational and administrative redundancies.
Other than the merger and integration costs discussed above, our acquisition of National City did not impact our 2008 Consolidated Income Statement, nor did it impact our 2008 Average Consolidated Balance Sheet. Note 2 Acquisitions and Divestitures included in our Notes To Consolidated Financial Statements within this Exhibit 99.1 and our Current Reports on Form 8-K filed October 24, 2008, October 30, 2008, December 23, 2008, and January 2, 2009 provide additional information regarding our acquisition of National City.
RECENT MARKET AND INDUSTRY DEVELOPMENTS
Starting in the middle of 2007 and with a heightened level of activity during the second half of 2008 and into early 2009, there has been unprecedented turmoil, volatility and illiquidity in worldwide financial markets, accompanied by uncertain prospects for the overall national economy, which is currently in the midst of a severe recession. In addition, there have been dramatic changes in the competitive landscape of the financial services industry during this time.
Recent efforts by the Federal government, including the US Department of the Treasury, the Federal Reserve, the FDIC, and the Securities and Exchange Commission, to stabilize and restore confidence in the financial services industry have impacted and will likely continue to impact PNC and our stakeholders. These efforts, which will continue to evolve, include the Emergency Economic Stabilization Act of 2008, the American Recovery and Reinvestment Act of 2009, and other legislative, administrative and regulatory initiatives, including the US Treasurys TARP and TARP Capital Purchase Program, the FDICs Temporary Liquidity Guarantee Program (TLGP) and the Federal Reserves Commercial Paper Funding Facility (CPFF).
Beginning in the fourth quarter of 2008, PNC participated in several of these programs as further described below:
TARP CAPITAL PURCHASE PROGRAM
The TARP Capital Purchase Program encourages US financial institutions to build capital through the sale to the US Treasury of senior preferred shares of stock to increase the flow of financing to US businesses and consumers and to support the US economy.
On December 31, 2008, PNC issued to the US Treasury $7.6 billion of preferred stock together with a related warrant to purchase shares of common stock of PNC, in accordance with the terms of the TARP Capital Purchase Program. Funds from this sale count as Tier 1 capital.
Holders of this preferred stock are entitled to a cumulative cash dividend at the annual rate per share of 5% of the liquidation preference per year for the first five years after the closing date. Afterward, the annual dividend rate will increase, to 9% per year. PNCs intent is to redeem this preferred stock prior to the escalation of the dividend rate.
Note 19 Shareholders Equity included in our Notes to Consolidated Financial Statements within this Exhibit 99.1 includes additional information regarding the preferred stock and the related warrant that we issued under this program.
FDIC TEMPORARY LIQUIDITY GUARANTEE PROGRAM
The FDICs TLGP is designed to strengthen confidence and encourage liquidity in the banking system by:
| | Guaranteeing newly issued senior unsecured debt of eligible institutions, including FDIC-insured banks and thrifts, as well as certain holding companies (TLGP-Debt Guarantee Program), and |
| | Providing full deposit insurance coverage for non-interest bearing transaction accounts in FDIC-insured institutions, regardless of the dollar amount (TLGP -Transaction Account Guarantee Program). |
In December 2008, PNC Funding Corp issued at the holding company level fixed and floating rate senior notes totaling $2.9 billion under the FDICs TLGP-Debt Guarantee Program as more fully described within the Liquidity Risk Management section of this
2
MD&A of this Exhibit 99.1. Each of these series of senior notes is guaranteed by the FDIC and is backed by the full faith and credit of the United States through June 30, 2012. As of October 14, 2008, PNC Bank, N.A. and National City Bank have been participating in the TLGP-Transaction Account Guarantee Program. Under this program, through December 31, 2009, all non-interest bearing transaction accounts are fully guaranteed by the FDIC for the entire amount in the account. Coverage under this program is in addition to, and separate from, the coverage available under the FDICs general deposit insurance rules.
COMMERCIAL PAPER FUNDING FACILITY
The Federal Reserve established the CPFF to provide a liquidity backstop to US issuers of commercial paper and thereby improve liquidity in short-term funding markets and thus increase the availability of credit for businesses and households. Effective October 28, 2008, Market Street Funding LLC (Market Street) was approved to participate in the Federal Reserves CPFF. The CPFF commitment to purchase up to $5.4 billion of three-month Market Street commercial paper expires on October 30, 2009. As of December 31, 2008, Market Streets participation in this program totaled $445 million. These trades matured at the end of January 2009 and were replaced with commercial paper sold to investors.
****
It is also possible that the US Congress and federal banking agencies, as part of their efforts to provide economic stimulus and financial market stability, to enhance the liquidity and solvency of financial institutions and markets, and to enhance the regulation of financial institutions and markets, will announce additional legislation, regulations or programs. These additional actions may take the form of changes in or additions to the statutes or regulations related to existing programs, including those described above. It is not possible at this time to predict the ultimate impact of these actions on PNCs business plans and strategies.
KEY FACTORS AFFECTING FINANCIAL PERFORMANCE
Our financial performance is substantially affected by several external factors outside of our control including the following, some of which may be affected by legislative, regulatory and administrative initiatives of the Federal government outlined above:
| | General economic conditions, including the length and severity of the current recession, |
| | The level of, and direction, timing and magnitude of movement in interest rates, and the shape of the interest rate yield curve, |
| | The functioning and other performance of, and availability of liquidity in, the capital and other financial markets, |
| | Loan demand, utilization of credit commitments and standby letters of credit, and asset quality, |
| | Customer demand for other products and services, |
| | Changes in the competitive landscape and in counterparty creditworthiness and performance as the financial services industry restructures in the current environment, |
| | Movement of customer deposits from lower to higher rate accounts or to investment alternatives, and |
| | The impact of market credit spreads on asset valuations. |
In addition, our success will depend, among other things, upon:
| | Further success in the acquisition, growth and retention of customers, |
| | Progress toward integrating the National City acquisition, |
| | Continued development of the markets related to our recent acquisitions, including full deployment of our product offerings, |
| | Revenue growth, |
| | A sustained focus on expense management, including achieving our cost savings targets associated with our National City integration, and creating positive operating leverage, |
| | Managing the distressed assets portfolio, |
| | Maintaining solid overall asset quality, |
| | Continuing to maintain our solid deposit base, |
| | Prudent risk and capital management leading to a return to our desired moderate risk profile, and |
| | Actions we take within the capital and other financial markets. |
See also Item 1A Risk Factors in our Annual Report on our 2008 Form 10-K and the Cautionary Statement Regarding Forward-Looking Information section of MD&A of this Exhibit 99.1.
OTHER 2008 ACQUISITION AND DIVESTITURE ACTIVITY
On April 4, 2008, we acquired Lancaster, Pennsylvania-based Sterling Financial Corporation (Sterling) for approximately 4.6 million shares of PNC common stock and $224 million in cash. Sterling was a banking and financial services company with approximately $3.2 billion in assets, $2.7 billion in deposits, and 65 branches in south-central Pennsylvania, northern Maryland and northern Delaware. The Sterling technology systems and bank charter conversions were completed during the third quarter of 2008 and we realized the anticipated cost savings related to these activities.
On March 31, 2008, we sold J.J.B. Hilliard, W.L. Lyons, LLC (Hilliard Lyons), a Louisville, Kentucky-based wholly-owned subsidiary of PNC and a full-service brokerage and financial services provider, to Houchens Industries, Inc. We recognized an after- tax
3
gain of $23 million in the first quarter of 2008 in connection with this divestiture. Business segment information for the periods presented in this MD&A reflects the reclassification of results for Hilliard Lyons, including the gain on the sale of this business, from the Retail Banking business segment to Other.
Summary Financial Results
| Year ended December 31 | ||||||||
| In millions, except per share data |
2008 | 2007 | ||||||
| Net income |
$ | 914 | $ | 1,491 | ||||
| Diluted earnings per share |
$ | 2.44 | $ | 4.32 | ||||
| Return on |
||||||||
| Average common shareholders equity |
6.52 | % | 10.70 | % | ||||
| Average assets |
.64 | % | 1.21 | % | ||||
Our earnings and related per share amounts for 2008 do not include the impact of National City, which we acquired effective December 31, 2008, other than a conforming adjustment to our provision for credit losses of $504 million and other integration costs of $71 million, both of which were recognized in the fourth quarter.
Our performance in 2008 included the following:
| | At December 31, 2008 we had total assets of $291 billion, including loans of $175 billion, and total deposits of $193 billion, reflecting the acquisition of National City. |
| | We significantly strengthened capital. The Tier 1 risk-based capital ratio was 9.7% at December 31, 2008 compared with 6.8% at December 31, 2007. We issued $7.6 billion of preferred stock and a common stock warrant to the US Department of the Treasury under the TARP Capital Purchase Program on December 31, 2008, which qualified as Tier 1 capital. |
| | We maintained a strong liquidity position and continued to generate deposits. The loan to deposit ratio was 91% at December 31, 2008, reflecting the acquisition of National City. Average deposits for 2008 increased 10% compared with 2007. |
| | Credit quality migration reflected a rapidly weakening economy, but remained manageable as PNC was able to maintain a strong capital position and generate positive operating leverage. The allowance for loan and lease losses increased to $3.9 billion at December 31, 2008 from $830 million at December 31, 2007 primarily as a result of the National City acquisition and related conforming credit adjustment. The ratio of allowance for loan and lease losses to total loans was strengthened to 2.23% at December 31, 2008 compared with 1.21% at December 31, 2007. |
| | Average loans for 2008 increased 16% over 2007. |
| | We are committed to supporting the objectives of the Emergency Economic Stabilization Act of 2008. To that end, we are continuing to make credit available to qualified borrowers including enhanced calling efforts on small businesses and corporations, promotions offered with special financing rates and responding to increased loan demand for first mortgages. We have reaffirmed and renewed loans and lines of credit, focused on early identification of loan modification candidates and are working closely where appropriate with customers who are experiencing financial hardship to set up new repayment schedules, loan modifications and forbearance programs. We plan to enhance these efforts over time to improve the effectiveness of our broad-reaching initiatives. |
| | Investment securities were $43.5 billion at December 31, 2008, or 15% of total assets. The portfolio was primarily comprised of well-diversified, high quality securities with US government agency residential mortgage-backed securities representing 53% of the portfolio. Of the remaining portfolio, approximately 80% of the securities had AAA-equivalent ratings. |
| | PNC created positive operating leverage for the year of 4%, or $351 million. Total revenue for 2008 grew 7% compared with 2007, driven by growth in net interest income, and exceeded year-over-year noninterest expense growth of 3%. |
| | With the acquisition of National City, our retail banks now serve over 6 million consumer and business customers. Comprehensive two-year integration plans are being implemented with a goal of eliminating $1.2 billion of annualized expenses, including the reduction of approximately 5,800 positions across the combined 59,595 employee base by 2011. The first regional branch conversion is planned for the second half of 2009. |
Our Consolidated Income Statement Review section describes in greater detail the various items that impacted our results for 2008 and 2007.
BALANCE SHEET HIGHLIGHTS
Total assets were $291.1 billion at December 31, 2008 compared with $138.9 billion at December 31, 2007. Total assets at December 31, 2008 included $133.7 billion related to National City. Our acquisition of National City did not impact our 2008 Average Consolidated Balance Sheet.
Total average assets were $142.0 billion for 2008 compared with $123.4 billion for 2007. This increase reflected a $16.5 billion increase in average interest-earning assets and a $2.1 billion increase in average noninterest-earning assets. An increase of $10.2
4
billion in loans and a $6.2 billion increase in investment securities were the primary factors for the increase in average interest-earning assets.
The increase in average noninterest-earning assets for 2008 reflected an increase in average goodwill of $1.6 billion primarily related to the acquisition of Sterling on April 4, 2008, Yardville National Bancorp (Yardville) on October 26, 2007 and Mercantile Bankshares Corporation (Mercantile) on March 2, 2007.
The impact of the Sterling, Yardville and Mercantile acquisitions is also reflected in our year-over-year increases in average total loans, average securities available for sale and average total deposits as described further below.
Average total loans were $72.7 billion for 2008 and $62.5 billion for 2007. The increase in average total loans included growth in commercial loans of $5.5 billion, consumer loans of $2.8 billion, commercial real estate loans of $1.7 billion and residential mortgage loans of $.5 billion. Loans represented 64% of average interest-earning assets for both 2008 and 2007.
Average investment securities totaled $32.7 billion for 2008 and $26.5 billion for 2007. Average residential and commercial mortgage-backed securities increased $4.5 billion on a combined basis in the comparison. Average investment securities for 2008 included $.4 billion of held to maturity securities that we transferred from available for sale status during the fourth quarter of 2008. Investment securities comprised 29% of average interest-earning assets for 2008 and 27% for 2007.
Average total deposits were $84.5 billion for 2008, an increase of $7.7 billion over 2007. Average deposits grew from the prior year period primarily as a result of increases in money market balances and other time deposits.
Average total deposits represented 60% of average total assets for 2008 and 62% for 2007. Average transaction deposits were $55.7 billion for 2008 compared with $50.7 billion for 2007.
Average borrowed funds were $31.3 billion for 2008 and $23.0 billion for 2007. Increases of $7.1 billion in Federal Home Loan Bank borrowings and $1.4 billion in other borrowed funds drove the increase compared with 2007.
Shareholders equity totaled $25.4 billion at December 31, 2008 compared with $14.9 billion at December 31, 2007 and reflected the issuance of securities under the TARP Capital Purchase Program and the impact of National City. See the Consolidated Balance Sheet Review section of this Exhibit 99.1 for additional information.
LINE OF BUSINESS HIGHLIGHTS
We refer you to Item 1 Business of our 2008 Form 10-K under the captions Business Overview and Review of Lines of Business and the Business Segments Review section of this MD&A for a Results Of Businesses Summary table for an overview of our business segments and further analysis of business segment results for 2008 and 2007, including presentation differences from Note 27 Segment Reporting in the Notes To Consolidated Financial Statements in this Exhibit 99.1.
Total business segment earnings were $991 million for 2008 and $1.7 billion for 2007. We provide a reconciliation of total business segment earnings to total PNC consolidated net income as reported on a GAAP basis in Note 27.
Retail Banking
Retail Bankings earnings were $328 million for 2008 compared with $620 million for 2007. The decline in earnings over the prior year was primarily driven by increases in the provision for credit losses and noninterest expense. The 2008 revenue was negatively impacted by a lower interest credit attributed to deposits in the declining rate environment and was therefore not reflective of the solid growth in customers and deposits.
Corporate & Institutional Banking
Corporate & Institutional Banking earned $215 million in 2008 compared with $512 million in 2007. The 58% decline in earnings over 2007 was primarily driven by an increase in the provision for credit losses and by higher valuation losses on commercial mortgage loans held for sale, net of hedges.
Asset Management Group
Asset Management Groups earnings were $119 million for 2008 compared with $158 million for 2007. A decline in noninterest income and an increase in noninterest expense drove the lower earnings for 2008 in the comparison.
5
BlackRock
Our BlackRock business segment earned $207 million in 2008 and $253 million in 2007. These results reflect our approximately 33% share of BlackRocks reported GAAP earnings during both periods and the additional income taxes on these earnings incurred by PNC.
Global Investment Servicing
Global Investment Servicing earned $122 million for 2008 and $128 million for 2007. Results for 2008 were negatively impacted by declines in asset values and fund redemptions as a result of severe deterioration of the financial markets during the fourth quarter.
Other
Other incurred a loss of $77 million in 2008 and a loss of $180 million in 2007.
Other for 2008 included the impact of integration costs, including the National City conforming provision for credit losses, totaling $422 million after taxes, of which $380 million after taxes were recognized in the fourth quarter of 2008. In addition, net securities losses in 2008 totaled $134 million after taxes. These factors were partially offset by strong growth in net interest income related to asset and liability management activities in 2008, and the after-tax impact of the following:
| | After-tax gains totaling $160 million from PNCs remaining BlackRock long-term incentive plan programs (LTIP) shares obligation, |
| | The $23 million after-tax gain on the sale of Hilliard Lyons in the first quarter, |
| | The $40 million after-tax third quarter reversal of a legal contingency reserve established in connection with an acquisition due to a settlement, and |
| | The $30 million after-tax partial reversal of the Visa indemnification liability. |
Other for 2007 included the after-tax impact of the following:
| | Integration costs totaling $99 million after taxes, |
| | A net after-tax charge of $83 million representing the net mark-to-market adjustment on our remaining BlackRock LTIP shares obligation partially offset by the gain recognized in connection with PNCs first quarter transfer of BlackRock shares to satisfy a portion of our BlackRock LTIP shares obligation, and |
| | A $53 million after-tax charge for an indemnification obligation related to certain Visa litigation. |
CONSOLIDATED INCOME STATEMENT REVIEW
Our Consolidated Income Statement is presented in the Consolidated Financial Statements of this Exhibit 99.1. Net income for 2008 was $914 million and for 2007 was $1.491 billion. Total revenue for 2008 increased 7% compared with 2007. We created positive operating leverage in the year-to-date comparison as total noninterest expense increased 3% in the comparison.
NET INTEREST INCOME AND NET INTEREST MARGIN
| Year ended December 31 Dollars in millions |
2008 | 2007 | ||||||
| Net interest income |
$ | 3,823 | $ | 2,915 | ||||
| Net interest margin |
3.37 | % | 3.00 | % | ||||
Changes in net interest income and margin result from the interaction of the volume and composition of interest-earning assets and related yields, interest-bearing liabilities and related rates paid, and noninterest-bearing sources of funding. See Statistical Information- Analysis of Year-To-Year Changes in Net Interest (Unaudited) Income and Average Consolidated Balance Sheet and Net Interest Analysis in Item 8 of our 2008 Form 10-K for additional information. The 31% increase in net interest income for 2008 compared with 2007 was favorably impacted by the $16.5 billion, or 17%, increase in average interest-earning assets and a decrease in funding costs. The 2008 net interest margin was positively affected by declining rates paid on deposits and borrowings compared with the prior year. The reasons driving the higher interest-earning assets in these comparisons are further discussed in the Balance Sheet Highlights portion of the Executive Summary section of this MD&A.
The net interest margin was 3.37% for 2008 and 3.00% for 2007. The following factors impacted the comparison:
| | A decrease in the rate paid on interest-bearing liabilities of 140 basis points. The rate paid on interest-bearing deposits, the single largest component, decreased 123 basis points. |
| | These factors were partially offset by a 77 basis point decrease in the yield on interest-earning assets. The yield on loans, the single largest component, decreased 109 basis points. |
| | In addition, the impact of noninterest-bearing sources of funding decreased 26 basis points due to lower interest rates and a lower proportion of noninterest-bearing sources of funding to interest-earning assets. |
For comparing to the broader market, during 2008 the average federal funds rate was 1.94% compared with 5.03% for 2007.
6
We expect our full-year 2009 net interest income to benefit from the impact of interest accretion of discounts resulting from purchase accounting marks and deposit pricing alignment related to our National City acquisition. We also currently expect our 2009 net interest margin to improve on a year-over-year basis.
NONINTEREST INCOME
Summary
Noninterest income was $3.367 billion for 2008 and $3.790 billion for 2007.
Noninterest income for 2008 included the following:
| | Gains of $246 million related to the mark-to-market adjustment on our BlackRock LTIP shares obligation, |
| | Losses related to our commercial mortgage loans held for sale of $197 million, net of hedges, |
| | Impairment and other losses related to alternative investments of $179 million, |
| | Income from Hilliard Lyons totaling $164 million, including the first quarter gain of $114 million from the sale of this business, |
| | Net securities losses of $206 million, |
| | A first quarter gain of $95 million related to the redemption of a portion of our Visa Class B common shares related to Visas March 2008 initial public offering, |
| | A third quarter $61 million reversal of a legal contingency reserve established in connection with an acquisition due to a settlement, |
| | Trading losses of $55 million, |
| | A $35 million impairment charge on commercial mortgage servicing rights, and |
| | Equity management losses of $24 million. |
Noninterest income for 2007 included the following:
| | The impact of $82 million gain recognized in connection with our transfer of BlackRock shares to satisfy a portion of PNCs LTIP obligation and a $209 million net loss on our LTIP shares obligation, |
| | Income from Hilliard Lyons totaling $227 million, |
| | Trading income of $104 million, |
| | Equity management gains of $102 million, and |
| | Gains related to our commercial mortgage loans held for sale of $3 million, net of hedges. |
Apart from the impact of these items, noninterest income increased $16 million in 2008 compared with 2007.
Additional analysis
Fund servicing fees increased $69 million in 2008, to $904 million, compared with $835 million in 2007. The impact of the December 2007 acquisition of Albridge Solutions Inc. (Albridge Solutions) and growth in Global Investment Servicings offshore operations were the primary drivers of this increase.
Global Investment Servicing provided fund accounting/ administration services for $839 billion of net fund investment assets and provided custody services for $379 billion of fund investment assets at December 31, 2008, compared with $990 billion and $500 billion, respectively, at December 31, 2007. The decrease in assets serviced was due to declines in asset values and fund outflows resulting primarily from market conditions in the second half of 2008.
Asset management fees totaled $686 million in 2008, a decline of $98 million compared with 2007. The effect on fees of lower equity earnings from BlackRock, a $12 billion decrease in assets managed due to equity values related to wealth management, and the Hilliard Lyons divestiture were reflected in the decline compared with 2007. Excluding $53 billion of assets acquired on December 31, 2008 resulting from our acquisition of National City, assets managed at December 31, 2008 totaled $57 billion compared with $74 billion at December 31, 2007. The Hilliard Lyons sale and the impact of comparatively lower equity markets in 2008 drove the decline in assets managed. Consumer services fees declined $69 million, to $623 million, for 2008 compared with 2007. The sale of Hilliard Lyons more than offset the benefits of increased volume-related fees, including debit card, credit card, bank brokerage and merchant revenues.
Corporate services revenue totaled $704 million in 2008 compared with $713 million in 2007. Higher revenue from treasury management and other fees were more than offset by lower merger and acquisition advisory fees and commercial mortgage servicing fees, net of amortization.
Service charges on deposits grew $24 million, to $372 million, in 2008 compared with 2007. The impact of our expansion into new markets contributed to the increase during 2008.
Net securities losses totaled $206 million in 2008 compared with net securities losses of $5 million in 2007. Losses for 2008 included other-than-temporary impairment charges of $312 million, including $74 million on our investment in preferred stock of FHLMC and FNMA that were partially offset by securities gains.
7
Other noninterest income totaled $284 million for 2008 compared with $423 million for 2007. Other noninterest income for 2008 included gains of $246 million related to our BlackRock LTIP shares adjustment, the $114 million gain from the sale of Hilliard Lyons, the $95 million gain from the redemption of a portion of our investment in Visa related to its March 2008 initial public offering, and the $61 million reversal of a legal contingency reserve referred to above. The impact of these items was partially offset by losses related to our commercial mortgage loans held for sale of $197 million, net of hedges, trading losses of $55 million and equity management losses of $24 million.
Other noninterest income for 2007 included a net loss related to our BlackRock investment of $127 million (the net of the two items described within the Summary section above), trading income of $104 million, equity management gains of $102 million and gains related to our commercial mortgage loans held for sale, net of hedges, of $3 million.
See the BlackRock portion of the Business Segments Review section of this MD&A for further information regarding LTIP. Additional information regarding our transactions related to Visa is included in Note 25 Commitments And Guarantees in the Notes To Consolidated Financial Statements included in this Exhibit 99.1. Further details regarding our trading activities are included in the Market Risk Management Trading Risk portion of the Risk Management section of this MD&A and information regarding equity management are included in the Market Risk Management-Equity and Other Investment Risk section.
Other noninterest income typically fluctuates from period to period depending on the nature and magnitude of transactions completed.
We expect noninterest income in 2009 to reflect customer growth, offset by softening consumer fees and by ongoing volatility of the more market-related categories.
PRODUCT REVENUE
In addition to credit and deposit products for commercial customers, Corporate & Institutional Banking offers other services, including treasury management and capital markets-related products and services and commercial mortgage loan servicing, that are marketed by several businesses to commercial and retail customers across PNC.
Treasury management revenue, which includes fees as well as net interest income from customer deposit balances, increased 14% to $545 million in 2008 compared with $476 million in 2007. The increase was primarily related to the impact of our expansion into new markets and strong growth in commercial payment card services and in cash and liquidity management products.
Revenue from capital markets-related products and services totaled $336 million in 2008 compared with $290 million in 2007. This increase was primarily driven by strong customer interest rate derivative and foreign exchange activity partially offset by a decline in merger and acquisition advisory fees.
Commercial mortgage banking activities include revenue derived from loan originations, commercial mortgage servicing (including net interest income and noninterest income from loan servicing and ancillary services), gains from loan sales, valuation adjustments, net interest income on loans held for sale, and related commitments and hedges.
Commercial mortgage banking activities resulted in revenue of $65 million in 2008 compared with $252 million in 2007. Revenue for 2008 reflected losses of $197 million on commercial mortgage loans held for sale, net of hedges, due to the impact of an illiquid market during most of 2008. The comparable amount for 2007 was a gain of $3 million. Revenue for 2007 also reflected significant securitization activity. In addition, commercial mortgage servicing revenue declined $53 million primarily due to a $35 million impairment charge on commercial mortgage servicing rights while net interest income from commercial mortgage loans held for sale increased $61 million in 2008 compared with 2007 due to higher loans held for sale balances.
PROVISION FOR CREDIT LOSSES
The provision for credit losses totaled $1.517 billion for 2008 compared with $315 million for 2007. Of the total 2008 provision, $990 million was recorded in the fourth quarter, including $504 million of additional provision recorded on December 31, 2008 to conform the National City loan reserving methodology with ours. The differences in methodology include granularity of loss computations, statistical and quantitative factors rather than qualitative assessment, and the extent of current appraisals and risk assessments.
In addition to the impact of National City, the higher provision in 2008 compared with the prior year was driven by general credit quality migration, including residential real estate development and commercial real estate exposure, an increase in net charge-offs, and growth in nonperforming loans. Growth in our total credit exposure also contributed to the higher provision amounts in both comparisons.
With a deteriorating economy, we expect credit migration will continue throughout 2009 as credit quality improvements will lag any economic turnaround. The Credit Risk Management portion of the Risk Management section of this MD&A includes additional information regarding factors impacting the provision for credit losses.
See also Item 1A Risk Factors in our 2008 Form 10-K and the Cautionary Statement Regarding Forward-Looking Information section of this MD&A.
8
NONINTEREST EXPENSE
Total noninterest expense was $4.398 billion for 2008 and $4.272 billion for 2007, an increase of $126 million, or 3%. Higher noninterest expense in 2008 compared with 2007 primarily resulted from investments in growth initiatives, including acquisitions, partially offset by the impact of the sale of Hilliard Lyons and disciplined expense management.
Integration costs included in noninterest expense totaled $122 million for 2008, including $81 million in the fourth quarter, and $102 million for 2007. Integration costs for the fourth quarter of 2008 included $71 million related to our National City acquisition.
Noninterest expense for 2008 included the benefit of the reversal of $46 million of the $82 million Visa indemnification liability that we established in the fourth quarter of 2007. Additional information regarding our transactions related to Visa is included in Note 25 Commitments And Guarantees in the Notes To Consolidated Financial Statements included in this Exhibit 99.1.
Expense management will be a key driver in 2009 as we intend to maintain our focus on continuous improvement and to achieve cost savings targets associated with our National City integration. We currently expect FDIC deposit insurance costs to increase significantly in 2009.
EFFECTIVE TAX RATE
Our effective tax rate was 28.3% for 2008 and 29.6% for 2007.
CONSOLIDATED BALANCE SHEET REVIEW
SUMMARIZED BALANCE SHEET DATA
| December 31 - in millions | 2008 | 2007 | ||||
| Assets |
||||||
| Loans |
$ | 175,489 | $ | 68,319 | ||
| Investment securities |
43,473 | 30,225 | ||||
| Cash and short-term investments |
23,936 | 10,425 | ||||
| Loans held for sale |
4,366 | 3,927 | ||||
| Equity investments |
8,554 | 6,045 | ||||
| Goodwill |
8,868 | 8,405 | ||||
| Other intangible assets |
2,820 | 1,146 | ||||
| Other |
23,575 | 10,428 | ||||
| Total assets |
$ | 291,081 | $ | 138,920 | ||
| Liabilities |
||||||
| Deposits |
$ | 192,865 | $ | 82,696 | ||
| Borrowed funds |
52,240 | 30,931 | ||||
| Other |
18,328 | 8,785 | ||||
| Total liabilities |
263,433 | 122,412 | ||||
| Total shareholders equity |
25,422 | 14,854 | ||||
| Noncontrolling interests |
2,226 | 1,654 | ||||
| Total equity |
27,648 | 16,508 | ||||
| Total liabilities and equity |
$ | 291,081 | $ | 138,920 | ||
The summarized balance sheet data above is based upon our Consolidated Balance Sheet in this Exhibit 99.1.
Our Consolidated Balance Sheet at December 31, 2008 included National Citys assets and liabilities at estimated fair value as of that date. This acquisition added approximately $134 billion of assets, including $99.7 billion of loans, after giving effect to purchase accounting adjustments, eliminations and reclassifications.
Various seasonal and other factors impact our period-end balances whereas average balances (discussed under the Balance Sheet Highlights section of this MD&A and included in the Statistical Information section of Item 8 of our 2008 Form 10-K) are generally more indicative of underlying business trends apart from the impact of recent acquisitions.
An analysis of changes in selected balance sheet categories follows.
LOANS
A summary of the major categories of loans outstanding is shown in the following table. Outstanding loan balances reflect unearned income, unamortized discount and premium, and purchase discounts and premiums totaling $4.1 billion and $990 million at December 31, 2008 and 2007, respectively.
9
Loans increased $107.2 billion as of December 31, 2008 compared with December 31, 2007. Our National City acquisition added $99.7 billion of loans, including $34.3 billion of commercial, $16.0 billion of commercial real estate, $30.5 billion of consumer and $10.6 billion of residential mortgage loans.
In February 2008, we transferred the education loans in our held for sale portfolio to the loan portfolio as further described in the Loans Held For Sale section of this Consolidated Balance Sheet Review.
Details Of Loans
| December 31 - in millions | 2008 | 2007 | ||||
| Commercial |
||||||
| Retail/wholesale |
$ | 11,482 | $ | 6,013 | ||
| Manufacturing |
13,263 | 4,814 | ||||
| Other service providers |
9,038 | 3,639 | ||||
| Real estate related (a) |
9,107 | 5,556 | ||||
| Financial services |
5,194 | 1,419 | ||||
| Health care |
3,201 | 1,464 | ||||
| Other |
16,034 | 5,634 | ||||
| Total commercial |
67,319 | 28,539 | ||||
| Commercial real estate |
||||||
| Real estate projects |
17,176 | 6,111 | ||||
| Commercial mortgage |
8,560 | 2,792 | ||||
| Total commercial real estate |
25,736 | 8,903 | ||||
| Equipment lease financing |
6,461 | 2,514 | ||||
| TOTAL COMMERCIAL LENDING |
99,516 | 39,956 | ||||
| Consumer |
||||||
| Home equity |
||||||
| Lines of credit |
24,024 | 6,811 | ||||
| Installment |
14,252 | 7,636 | ||||
| Education |
4,211 | 132 | ||||
| Automobile |
1,667 | 1,513 | ||||
| Credit card and other unsecured lines of credit |
3,163 | 462 | ||||
| Other |
5,172 | 1,839 | ||||
| Total consumer |
52,489 | 18,393 | ||||
| Residential real estate |
||||||
| Residential mortgage |
18,783 | 9,046 | ||||
| Residential construction |
2,800 | 511 | ||||
| Total residential real estate |
21,583 | 9,557 | ||||
| TOTAL CONSUMER LENDING |
74,072 | 27,950 | ||||
| Other |
1,901 | 413 | ||||
| Total loans |
$ | 175,489 | $ | 68,319 | ||
| (a) | Includes loans to customers in the real estate and construction industries. |
Total loans represented 60% of total assets at December 31, 2008 and 49% of total assets at December 31, 2007.
Our loan portfolio continued to be diversified among numerous industries and types of businesses. The loans that we hold are also concentrated in, and diversified across, our principal geographic markets. See Note 4 Loans, Commitments To Extend Credit and Concentrations of Credit Risk in the Notes To Consolidated Financial Statements in this Exhibit 99.1 for additional information.
10
The following table presents the valuation adjustments applied against National City loans as part of the purchase accounting process at December 31, 2008.
National City Loan Portfolio Assessment
| Dollars in billions | December 31, 2008 | ||||||||||||
| Principal Balance |
Valuation Adjustment |
Fair Value |
Valuation Adjustment as % of Principal Balance |
||||||||||
| Valuation Adjustments By Loan Classification |
|||||||||||||
| Commercial/Commercial real estate |
$ | 56.5 | $ | 4.7 | $ | 51.8 | 8.3 | % | |||||
| Consumer |
31.4 | 3.5 | 27.9 | 11.1 | % | ||||||||
| Residential real estate |
19.2 | 4.4 | 14.8 | 22.9 | % | ||||||||
| Other |
.9 | .9 | |||||||||||
| Total |
$ | 108.0 | $ | 12.6 | $ | 95.4 | (a) | 11.7 | % | ||||
| Valuation Adjustments By Type |
|||||||||||||
| Impaired loans |
|||||||||||||
| Commercial/Commercial real estate |
$ | 4.0 | $ | 2.2 | $ | 1.8 | 55.0 | % | |||||
| Consumer |
5.8 | 1.9 | 3.9 | 32.8 | % | ||||||||
| Residential real estate |
9.5 | 3.3 | 6.2 | 34.7 | % | ||||||||
| Total impaired loans |
19.3 | 7.4 | 11.9 | 38.3 | % | ||||||||
| Performing loans |
88.7 | 5.2 | 83.5 | 5.9 | % | ||||||||
| Total |
$ | 108.0 | $ | 12.6 | $ | 95.4 | (a) | 11.7 | % | ||||
| Valuation Adjustments By Component |
|||||||||||||
| Fair value mark impaired loans |
$ | 7.4 | |||||||||||
| Fair value mark performing loans |
2.4 | ||||||||||||
| Subtotal fair value marks |
9.8 | ||||||||||||
| National City reserve carryover on performing loans |
2.3 | ||||||||||||
| Conforming credit reserve on performing loans |
.5 | ||||||||||||
| Total |
$ | 12.6 | |||||||||||
| (a) | Represents total adjusted loans of $99.7 billion from the National City acquisition, net of $2.8 billion of loan loss reserves, $1.1 billion of loans previously classified as held for sale by National City, and $.4 billion of other purchase accounting adjustments. |
Our home equity loan outstandings totaled $38.3 billion at December 31, 2008. In this portfolio, we consider the higher risk loans to be those with a recent FICO credit score of less than or equal to 660 and a loan-to-value ratio greater than or equal to 90%. We had $1.2 billion or approximately 3% of the total portfolio in this grouping at December 31, 2008. In our $18.8 billion residential mortgage portfolio, loans with a recent FICO credit score of less than or equal to 660 and a loan-to-value ratio greater than 90% totaled $2.5 billion and comprised approximately 14% of this portfolio at December 31, 2008.
Commercial lending outstandings are the largest category and are the most sensitive to changes in assumptions and judgments underlying the determination of the allowance for loan and lease losses. We have allocated $2.6 billion, or 67%, of the total allowance for loan and lease losses at December 31, 2008 to these loans. We allocated $1.2 billion, or 32%, of the remaining allowance at that date to consumer lending outstandings and $47 million, or 1%, to all other loans. This allocation also considers other relevant factors such as:
| | Actual versus estimated losses, |
| | Regional and national economic conditions, |
| | Business segment and portfolio concentrations, |
| | Industry conditions, |
| | The impact of government regulations, and |
| | Risk of potential estimation or judgmental errors, including the accuracy of risk ratings. |
11
Included in total loans at December 31, 2008 were $27.2 billion of distressed loans. These loans include residential real estate development loans, cross-border leases, subprime residential mortgage loans, brokered home equity loans and certain other residential real estate loans. These loans require special servicing and management oversight given current market conditions or, in the case of cross-border leases, are tax and yield challenged. The majority of the distressed loans were from acquisitions, including $24.6 billion from National City. An allowance for loan and lease losses of $927 million was allocated to the distressed loans at December 31, 2008. A total of $537 million of the distressed loans were classified as nonperforming at that date. Details of distressed loans follow:
Details of Distressed Loan Portfolio
| In millions | Dec. 31, 2008 | |
| Commercial |
$28 | |
| Commercial real estate |
||
| Real estate projects |
2,847 | |
| Commercial mortgage |
510 | |
| Total commercial real estate |
3,357 | |
| Equipment lease financing |
858 | |
| TOTAL COMMERCIAL LENDING |
4,243 | |
| Consumer |
||
| Home equity |
||
| Lines of credit |
5,474 | |
| Installment |
2,877 | |
| Total home equity |
8,351 | |
| Residential real estate |
||
| Residential mortgage |
10,198 | |
| Residential construction |
2,603 | |
| Total residential real estate |
12,801 | |
| TOTAL CONSUMER LENDING |
21,152 | |
| Other |
1,761 | |
| Total (a) |
$27,156 |
| (a) | Includes impaired loans attributable to National City totaling $10.3 billion, net of valuation adjustments. The pre-adjusted principal balance was $15.3 billion and represented the majority of the total $19.3 billion principal balance of total impaired loans included in the National City Loan Portfolio Assessment table on page 11. |
Net unfunded credit commitments are comprised of the following:
Net Unfunded Credit Commitments
| December 31 - in millions | 2008 (a) | 2007 | ||||
| Commercial and commercial real estate |
$ | 59,982 | $ | 42,021 | ||
| Home equity lines of credit |
23,195 | 8,680 | ||||
| Consumer credit card lines |
19,028 | 969 | ||||
| Other |
2,683 | 1,677 | ||||
| Total |
$ | 104,888 | $ | 53,347 | ||
| (a) | Includes $53.9 billion related to National City. |
Unfunded commitments are concentrated in our primary geographic markets. Commitments to extend credit represent arrangements to lend funds or provide liquidity subject to specified contractual conditions. Commercial commitments are reported net of participations, assignments and syndications, primarily to financial institutions, totaling $8.6 billion at December 31, 2008 and $8.9 billion at December 31, 2007.
Unfunded liquidity facility commitments and standby bond purchase agreements totaled $7.0 billion at December 31, 2008 and $9.4 billion at December 31, 2007 and are included in the preceding table primarily within the Commercial and Consumer categories. The decrease from December 31, 2007 was due to a $2.5 billion decline in Market Street commitments.
In addition to credit commitments, our net outstanding standby letters of credit totaled $10.3 billion at December 31, 2008 and $4.8 billion at December 31, 2007. Standby letters of credit commit us to make payments on behalf of our customers if specified future events occur.
12
INVESTMENT SECURITIES
Details Of Investment Securities
| In millions | Amortized Cost |
Fair Value |
||||
| December 31, 2008 |
||||||
| SECURITIES AVAILABLE FOR S ALE |
||||||
| Debt securities |
||||||
| Residential mortgage-backed |
||||||
| Agency |
$ | 22,744 | $ | 23,106 | ||
| Nonagency |
13,205 | 8,831 | ||||
| Commercial mortgage-backed |
4,305 | 3,446 | ||||
| Asset-backed |
2,069 | 1,627 | ||||
| US Treasury and government agencies |
738 | 739 | ||||
| State and municipal |
1,326 | 1,263 | ||||
| Other debt |
563 | 559 | ||||
| Corporate stocks and other |
575 | 571 | ||||
| Total securities available for sale |
$ | 45,525 | $ | 40,142 | ||
| SECURITIES HELD TO MATURITY |
||||||
| Debt securities |
||||||
| Commercial mortgage-backed |
$ | 1,945 | $ | 1,896 | ||
| Asset-backed |
1,376 | 1,358 | ||||
| Other debt |
10 | 10 | ||||
| Total securities held to maturity |
$ | 3,331 | $ | 3,264 | ||
| December 31, 2007 |
||||||
| SECURITIES AVAILABLE FOR SALE |
||||||
| Debt securities |
||||||
| Residential mortgage-backed |
||||||
| Agency |
$ | 9,218 | $ | 9,314 | ||
| Nonagency |
11,929 | 11,638 | ||||
| Commercial mortgage-backed |
5,227 | 5,264 | ||||
| Asset-backed |
2,878 | 2,770 | ||||
| U.S. Treasury and government agencies |
151 | 155 | ||||
| State and municipal |
340 | 336 | ||||
| Other debt |
85 | 84 | ||||
| Corporate stocks and other |
662 | 664 | ||||
| Total securities available for sale |
$ | 30,490 | $ | 30,225 | ||
Investment securities totaled $43.5 billion at December 31, 2008, including $13.3 billion from the National City acquisition that were primarily US government agency residential mortgage-backed securities. Securities represented 15% of total assets at December 31, 2008 and 22% of total assets at December 31, 2007.
We evaluate our portfolio of investment securities in light of changing market conditions and other factors and, where appropriate, take steps intended to improve our overall positioning. During the fourth quarter of 2008, we transferred $3.2 billion of securities available for sale to securities held to maturity status and transferred $599 million of proprietary trading securities to the available for sale portfolio.
The transfer of available for sale securities to held to maturity involved short-duration, high quality securities where managements intent to hold changed. In reassessing the classification of these securities, management also considered the current and ongoing illiquidity in the capital markets and that securities prices are under increasing downward pressure, even where there is no indication of credit impairment.
The transfer of trading securities to available for sale occurred against the backdrop of events occurring in the market that management determined to be unusual and highly unlikely to recur in the near term. As a result of these events, which included the unprecedented market illiquidity and related volatility, PNCs economic hedges associated with these trading positions become increasingly ineffective, resulting in increasing and unexpected earnings volatility. Coincident with the transfer of trading securities to available for sale, all hedging instruments were terminated.
13
At December 31, 2008, the investment securities balance included a net unrealized loss of $5.4 billion, which represented the difference between fair value and amortized cost. The comparable amount at December 31, 2007 was a net unrealized loss of $265 million. The fair value of investment securities is impacted by interest rates, credit spreads, and market volatility and illiquidity. We believe that a substantial portion of the decline in value of these securities is attributable to changes in market credit spreads and market illiquidity and not from deterioration in the credit quality of individual securities or underlying collateral, where applicable. The net unrealized losses at December 31, 2008 did not reflect credit quality concerns of any significance with the underlying assets, which represented an overall well-diversified, high quality portfolio. US government agency residential mortgage-backed securities represented 53% of the investment securities portfolio at December 31, 2008.
During 2008, we recorded other-than-temporary impairment charges totaling $312 million, of which $151 million related to residential mortgage-backed securities, $87 million related to asset-backed securities collateralized by first- and second-lien residential mortgage loans and $74 million related to our investment in preferred securities of FHLMC and FNMA.
At least quarterly we conduct a comprehensive security-level impairment assessment. Our process and methods have evolved as market conditions have deteriorated and as more research and other analyses have become available. We expect that our process and methods will continue to evolve. Our assessment considers the security structure, recent security collateral performance metrics, our judgment and expectations of future performance, and relevant industry research and analysis. We also consider the magnitude of the impairment and the amount of time that the security has been impaired in our assessment. Results of the periodic assessment are reviewed by a cross-functional senior management team representing Asset & Liability Management, Finance, Balance Sheet Risk Management, and Credit Policy. The senior management team considers the results of the assessments, as well as other factors, in determining whether the impairment is other-than-temporary.
One of the key inputs into our impairment assessment process is the level of delinquencies (i.e., 60 days and more) for any given security. In February 2009, we received updated delinquency information through January 31, 2009 for our residential mortgage-backed and asset-backed securities positions collateralized by first- and second-lien residential mortgage loans. Delinquencies have generally increased in the January 2009 versus December 2008 month-over-month comparison and, based upon our evaluation of these updated delinquency statistics, we currently expect that we will record additional other-than-temporary impairment charges in the first quarter of 2009. We currently do not expect that these charges will be material to our capital position.
If the current issues affecting the US housing market were to continue for the foreseeable future or worsen, or if market volatility and illiquidity were to continue or worsen, or if market interest rates were to increase appreciably, the valuation of our available for sale securities portfolio could continue to be adversely affected. See Note 7 Investment Securities in the Notes To Consolidated Financial Statements in this Exhibit 99.1 for additional information.
Net unrealized gains and losses in the securities available for sale portfolio are included in shareholders equity as accumulated other comprehensive income or loss, net of tax. The fair value of investment securities generally decreases when interest rates increase and vice versa. In addition, the fair value generally decreases when credit spreads widen and vice versa.
The expected weighted-average life of investment securities (excluding corporate stocks and other) was 3 years and 1 month at December 31, 2008 and 3 years and 6 months at December 31, 2007.
We estimate that at December 31, 2008 the effective duration of investment securities was 3.7 years for an immediate 50 basis points parallel increase in interest rates and 3.1 years for an immediate 50 basis points parallel decrease in interest rates. Comparable amounts at December 31, 2007 were 2.8 years and 2.5 years, respectively.
Loans Held For Sale
| December 31 - in millions | 2008 | 2007 | ||||
| Commercial mortgage |
$ | 2,158 | $ | 2,116 | ||
| Residential mortgage |
1,962 | 117 | ||||
| Education |
1,525 | |||||
| Other |
246 | 169 | ||||
| Total |
$ | 4,366 | $ | 3,927 | ||
The acquisition of National City added approximately $2.2 billion of loans held for sale, primarily 1-4 family conforming residential mortgages. The residential mortgage loans held for sale will be accounted for at fair value.
14
PNC adopted SFAS 159 beginning January 1, 2008 and elected to account for certain commercial mortgage loans held for sale at fair value. The balance of these assets was $1.4 billion at December 31, 2008. We stopped originating these types of loans during the first quarter of 2008. We intend to continue pursuing opportunities to reduce our commercial mortgage loans held for sale position at appropriate prices. We sold and/or securitized $.6 billion of commercial mortgage loans held for sale carried at fair value in 2008. Losses of $197 million on commercial mortgage loans held for sale, net of hedges, were included in other noninterest income for 2008 compared with gains of $3 million in 2007. Net interest income on commercial mortgage loans held for sale was $76 million in 2008 compared with $15 million in 2007. The non-cash losses reflected illiquid market conditions which began in the latter part of 2007.
We previously classified substantially all of our education loans as loans held for sale as we sold education loans to issuers of asset-backed paper when the loans were placed into repayment status. During 2008, the secondary markets for education loans have been impacted by liquidity issues similar to those for other asset classes. In February 2008, given this outlook and the economic and customer relationship value inherent in this product, we transferred these loans at lower of cost or market value from held for sale to the loan portfolio. We did not sell education loans during the remainder of 2008 and do not anticipate sales of these transferred loans in the foreseeable future.
FUNDING AND CAPITAL SOURCES
Details Of Funding Sources
| December 31 - in millions | 2008 | 2007 | ||||
| Deposits |
||||||
| Money market |
$ | 67,678 | $ | 32,785 | ||
| Demand |
43,212 | 20,861 | ||||
| Retail certificates of deposit |
58,315 | 16,939 | ||||
| Savings |
6,056 | 2,648 | ||||
| Other time |
13,620 | 2,088 | ||||
| Time deposits in foreign offices |
3,984 | 7,375 | ||||
| Total deposits |
192,865 | 82,696 | ||||
| Borrowed funds |
||||||
| Federal funds purchased and repurchase agreements |
5,153 | 9,774 | ||||
| Federal Home Loan Bank borrowings |
18,126 | 7,065 | ||||
| Bank notes and senior debt |
13,664 | 6,821 | ||||
| Subordinated debt |
11,208 | 4,506 | ||||
| Other |
4,089 | 2,765 | ||||
| Total borrowed funds |
52,240 | 30,931 | ||||
| Total |
$ | 245,105 | $ | 113,627 | ||
Total funding sources increased $131.5 billion at December 31, 2008 compared with the balance at December 31, 2007.
Deposits totaled $192.9 billion at December 31, 2008, including $104 billion from the National City acquisition, compared with $82.7 billion at December 31, 2007. Interest-bearing deposits represented 81% of total deposits at December 31, 2008 compared with 76% at December 31, 2007. The change in deposit composition reflected the higher proportion of certificates of deposit and other interest-bearing deposits associated with National City. Borrowed funds totaled $52.2 billion at December 31, 2008 compared with $30.9 billion at December 31, 2007. Borrowed funds at December 31, 2008 included $18.2 billion of National City obligations and $2.9 billion of senior notes guaranteed under the FDICs TLGP-Debt Guarantee Program that PNC issued in December 2008.
The Liquidity Risk Management section of this MD&A contains further details regarding actions we have taken which impacted our borrowed funds balances during 2008.
Capital
We manage our capital position by making adjustments to our balance sheet size and composition, issuing debt, equity or hybrid instruments, executing treasury stock transactions, managing dividend policies and retaining earnings. On March 1, 2009, we took a proactive step to build capital and further strengthen our balance sheet as the Board of Directors decided to reduce PNCs quarterly common stock dividend from $0.66 to $0.10 per share.
Total shareholders equity increased $10.6 billion, to $25.4 billion, at December 31, 2008 compared with December 31, 2007 and reflected the following:
| | The December 2008 issuance of $7.6 billion of preferred stock and a common stock warrant to the US Department of Treasury under the TARP Capital Purchase Program, |
| | The December 2008 issuance of $5.6 billion of common stock in connection with the National City acquisition, |
15
| | The May 2008 issuance of $500 million of Series K preferred stock, |
| | The April 2008 issuance of $312 million of common stock in connection with the Sterling acquisition, and |
| | The December 2008 issuance of $150 million of Series L preferred stock in connection with the National City acquisition. |
These factors were partially offset by the $3.8 billion increase from December 31, 2007 in accumulated other comprehensive loss which included $3.5 billion of net unrealized securities losses. The Investment Securities section of this Consolidated Balance Sheet Review includes additional information regarding these unrealized losses.
Common shares outstanding were 443 million at December 31, 2008 and 341 million at December 31, 2007. PNC issued approximately 95 million common shares in December 2008 and 4.6 million common shares in April 2008 in connection with the closings of the National City and Sterling acquisitions, respectively.
Our current common stock repurchase program permits us to purchase up to 25 million shares of PNC common stock on the open market or in privately negotiated transactions. This program will remain in effect until fully utilized or until modified, superseded or terminated. The extent and timing of share repurchases under this program will depend on a number of factors including, among others, market and general economic conditions, economic and regulatory capital considerations, alternative uses of capital, regulatory and contractual limitations, and the potential impact on our credit ratings. We did not purchase any shares during 2008 under this program. During 2007, we purchased 11 million common shares under our current and prior common stock repurchase programs at a total cost of approximately $800 million.
Under the TARP Capital Purchase Program, there are restrictions on dividends and common share repurchases associated with the preferred stock that we issued to the US Treasury in accordance with that program. As is typical with cumulative preferred stock, dividend payments for this preferred stock must be current before dividends can be paid on junior shares, including our common stock, or junior shares can be repurchased or redeemed. Also, the US Treasurys consent will be required for any increase in common dividends per share above the most recent level prior to October 14, 2008 until the third anniversary of the preferred stock issuance as long as the US Treasury continues to hold any of the preferred stock. Further, during that same period, the US Treasurys consent will be required, unless the preferred stock is no longer held by the US Treasury, for any share repurchases with limited exceptions, most significantly purchases of common shares in connection with any benefit plan in the ordinary course of business consistent with past practice.
16
Risk-Based Capital
| December 31 - dollars in millions | 2008 | 2007 | ||||||
| Capital components |
||||||||
| Shareholders equity |
||||||||
| Common |
$ | 17,490 | $ | 14,847 | ||||
| Preferred |
7,932 | 7 | ||||||
| Trust preferred capital securities |
2,898 | 572 | ||||||
| Noncontrolling interests |
1,506 | 985 | ||||||
| Goodwill and other intangible assets |
(9,800 | ) | (8,853 | ) | ||||
| Eligible deferred income taxes on goodwill and other intangible assets |
594 | 119 | ||||||
| Pension, other postretirement benefit plan adjustments |
666 | 177 | ||||||
| Net unrealized securities losses, after-tax |
3,618 | 167 | ||||||
| Net unrealized losses (gains) on cash flow hedge derivatives, after-tax |
(374 | ) | (175 | ) | ||||
| Other |
(243 | ) | (31 | ) | ||||
| Tier 1 risk-based capital |
24,287 | 7,815 | ||||||
| Subordinated debt |
5,676 | 3,024 | ||||||
| Eligible allowance for credit losses |
3,153 | 964 | ||||||
| Total risk-based capital |
$ | 33,116 | $ | 11,803 | ||||
| Assets |
||||||||
| Risk-weighted assets, including off-balance sheet instruments and market risk equivalent assets |
$ | 251,106 | $ | 115,132 | ||||
| Adjusted average total assets |
138,689 | 126,139 | ||||||
| Capital ratios |
||||||||
| Tier 1 risk-based |
9.7 | % | 6.8 | % | ||||
| Total risk-based |
13.2 | 10.3 | ||||||
| Leverage |
17.5 | 6.2 | ||||||
PNCs Tier 1 risk-based capital ratio was 9.7% at December 31, 2008 compared with 6.8% at December 31, 2007. The increase in the ratio from December 31, 2007 included the issuance of Tier 1 eligible securities during the first half of 2008 totaling $1.3 billion, including REIT preferred, noncumulative perpetual preferred, and trust preferred securities. The Perpetual Trust Securities and PNC Capital Trust E Trust Preferred Securities portions of the Off-Balance Sheet Arrangements and VIEs section of this MD&A and Note 19 Shareholders Equity in the Consolidated Financial Statements in this Exhibit 99.1 have additional information regarding these securities.
In addition, $7.6 billion of preferred stock and a common stock warrant was issued to the US Department of the Treasury under the TARP Capital Purchase Program on December 31, 2008. Tier 1 risk-based capital further increased as a result of $5.6 billion of common stock issued in the National City acquisition and PNCs assumption of $2.6 billion of Tier 1 qualifying capital securities previously issued by National City. These increases in capital were partially offset by the deduction of higher acquisition-related intangible assets. The positive effect on the Tier 1 ratio of the net increase in capital was somewhat offset by an increase in risk-weighted assets primarily related to acquisitions, including National City.
The leverage ratio at December 31, 2008 reflected the favorable impact on Tier 1 risk-based capital from the issuance of securities under TARP and the issuance of PNC common stock in connection with the National City acquisition, both of which occurred on December 31, 2008. In addition, the ratio as of that date did not reflect any impact of National City on PNCs adjusted average total assets.
The access to, and cost of, funding new business initiatives including acquisitions, the ability to engage in expanded business activities, the ability to pay dividends, the level of deposit insurance costs, and the level and nature of regulatory oversight depend, in part, on a financial institutions capital strength.
At December 31, 2008 and December 31, 2007, each of our domestic bank subsidiaries was considered well capitalized based on US regulatory capital ratio requirements. See the Supervision and Regulation section of Item 1 of our 2008 Form 10-K and Note 23 Regulatory Matters in the Notes To Consolidated Financial Statements in this Exhibit 99.1 for additional information. We believe our bank subsidiaries will continue to meet these requirements in 2009.
17
OFF-BALANCE SHEET ARRANGEMENTS AND VIES
We engage in a variety of activities that involve unconsolidated entities or that are otherwise not reflected in our Consolidated Balance Sheet that are generally referred to as off-balance sheet arrangements. The following sections of this Exhibit 99.1 provide further information on these types of activities:
| | Commitments, including contractual obligations and other commitments, included within the Risk Management section of this MD&A, and |
| | Note 10 Securitization Activity and Note 25 Commitments and Guarantees in the Notes To Consolidated Financial Statements included in this Exhibit 99.1. |
The following provides a summary of variable interest entities (VIEs), including those that we have consolidated and those in which we hold a significant variable interest but have not consolidated into our financial statements as of December 31, 2008 and December 31, 2007.
Consolidated VIEs PNC Is Primary Beneficiary
| In millions | Aggregate Assets |
Aggregate Liabilities |
||
| Partnership interests in low income housing projects (a) |
||||
| December 31, 2008 |
$1,499 | $ 863 | ||
| December 31, 2007 |
$1,108 | $ 516 | ||
| Credit Risk Transfer Transaction (b) |
||||
| December 31, 2008 |
$1,070 | $1,070 | ||
| (a) | Amounts for December 31, 2008 include National City, which PNC acquired on that date. |
| (b) | National City-related transaction. |
Non-Consolidated VIEs Significant Variable Interests
| In millions | Aggregate Assets |
Aggregate Liabilities |
PNC Risk of Loss |
||||
| December 31, 2008 |
|||||||
| Market Street |
$4,916 | $5,010 | $6,965 | (a) | |||
| Collateralized debt obligations |
20 | 2 | |||||
| Partnership interests in tax credit investments (b) (c) (d) |
1,095 | 652 | 920 | ||||
| Total (c) |
$6,031 | $5,662 | $7,887 | ||||
| December 31, 2007 |
|||||||
| Market Street |
$5,304 | $5,330 | $9,019 | (a) | |||
| Collateralized debt obligations |
255 | 177 | 6 | ||||
| Partnership interests in low income housing projects |
298 | 184 | 155 | ||||
| Total |
$5,857 | $5,691 | $9,180 |
| (a) | PNCs risk of loss consists of off-balance sheet liquidity commitments to Market Street of $6.4 billion and other credit enhancements of $.6 billion at December 31, 2008. The comparable amounts were $8.8 billion and $.2 billion at December 31, 2007. These liquidity commitments are included in the Net Unfunded Credit Commitments table in the Consolidated Balance Sheet Review section of this Exhibit 99.1. |
| (b) | Amounts reported primarily represent low income housing projects. |
| (c) | Amounts include the impact of National City. |
| (d) | Aggregate assets and aggregate liabilities at December 31, 2008 represent approximate balances due to limited availability of financial information associated with the acquired National City partnerships that we did not sponsor. |
Market Street
Market Street is a multi-seller asset-backed commercial paper conduit that is owned by an independent third party. Market Streets activities primarily involve purchasing assets or making loans secured by interests in pools of receivables from US corporations that desire access to the commercial paper market. Market Street funds the purchases of assets or loans by issuing commercial paper which has been rated A1/P1 by Standard & Poors and Moodys, respectively, and is supported by pool-specific credit enhancements, liquidity facilities and program-level credit enhancement. Generally, Market Street mitigates its potential interest rate risk by entering into agreements with its borrowers that reflect interest rates based upon its weighted average commercial paper cost of funds. During 2007 and 2008, Market Street met all of its funding needs through the issuance of commercial paper.
Market Street commercial paper outstanding was $4.4 billion at December 31, 2008 and $5.1 billion at December 31, 2007. The weighted average maturity of the commercial paper was 24 days at December 31, 2008 compared with 32 days at December 31, 2007.
Effective October 28, 2008, Market Street was approved to participate in the Federal Reserves CPFF authorized under Section 13(3) of the Federal Reserve Act. The CPFF commitment to purchase up to $5.4 billion of three-month Market Street commercial paper
18
expires on October 30, 2009. As of December 31, 2008, Market Streets participation in this program totaled $445 million. These trades matured at the end of January 2009 and were replaced with commercial paper sold to investors.
In the ordinary course of business during 2008, PNC Capital Markets, acting as a placement agent for Market Street, held a maximum daily position in Market Street commercial paper of $75 million with an average of $12 million. This compares with a maximum daily position of $113 million with an average of $27 million for the year ended December 31, 2007. PNC Capital Markets owned no Market Street commercial paper at December 31, 2008 and owned less than $1 million of such commercial paper at December 31, 2007. PNC Bank, National Association (PNC Bank, N.A.) purchased overnight maturities of Market Street commercial paper on two days during September 2008 in the amounts of $197 million and $531 million and one day during October 2008 in the amount of $278 million due to illiquidity in the commercial paper market. We considered these transactions as part of our evaluation of Market Street described below to determine that we are not the primary beneficiary. PNC made no other purchases of Market Street commercial paper during 2007 or 2008.
PNC Bank, N.A. provides certain administrative services, the program-level credit enhancement and 99% of liquidity facilities to Market Street in exchange for fees negotiated based on market rates. PNC recognized program administrator fees and commitment fees related to PNCs portion of the liquidity facilities of $21 million and $4 million, respectively, for the year ended December 31, 2008. The comparable amounts were $13 million and $4 million for the year ended December 31, 2007.
The commercial paper obligations at December 31, 2008 and December 31, 2007 were effectively collateralized by Market Streets assets. While PNC may be obligated to fund under the $6.4 billion of liquidity facilities for events such as commercial paper market disruptions, borrower bankruptcies, collateral deficiencies or covenant violations, our credit risk under the liquidity facilities is secondary to the risk of first loss provided by the borrower or another third party in the form of deal-specific credit enhancement, such as by the over collateralization of the assets. Deal-specific credit enhancement that supports the commercial paper issued by Market Street is generally structured to cover a multiple of expected losses for the pool of assets and is sized to generally meet rating agency standards for comparably structured transactions. In addition, PNC would be required to fund $1.0 billion of the liquidity facilities if the underlying assets are in default. See Note 25 Commitments And Guarantees included in the Notes To Consolidated Financial Statements of this Exhibit 99.1 for additional information.
PNC provides program-level credit enhancement to cover net losses in the amount of 10% of commitments, excluding explicitly rated AAA/Aaa facilities. PNC provides 100% of the enhancement in the form of a cash collateral account funded by a loan facility. This facility expires in March 2013. Until November 25, 2008, PNC provided only 25% of the enhancement in the form of a cash collateral account funded by a loan facility and provided a liquidity facility for the remaining 75% of program-level enhancement.
Market Street has entered into a Subordinated Note Purchase Agreement (Note) with an unrelated third party. The Note provides first loss coverage whereby the investor absorbs losses up to the amount of the Note, which was $6.6 million as of December 31, 2008. Proceeds from the issuance of the Note are held by Market Street in a first loss reserve account that will be used to reimburse any losses incurred by Market Street, PNC Bank, N.A. or other providers under the liquidity facilities and the credit enhancement arrangements.
19
Assets of Market Street Funding LLC
| Dollars in millions | Outstanding | Commitments | Weighted Average Remaining Maturity In Years |
|||
| December 31, 2008 (a) |
||||||
| Trade receivables |
$1,516 | $3,370 | 2.34 | |||
| Automobile financing |
992 | 992 | 3.94 | |||
| Collateralized loan obligations |
306 | 405 | 1.58 | |||
| Credit cards |
400 | 400 | .19 | |||
| Residential mortgage |
14 | 14 | 27.00 | |||
| Other |
1,168 | 1,325 | 1.76 | |||
| Cash and miscellaneous receivables |
520 | |||||
| Total |
$4,916 | $6,506 | 2.34 | |||
| December 31, 2007 (a) |
||||||
| Trade receivables |
$1,375 | $2,865 | 2.63 | |||
| Automobile financing |
1,387 | 1,565 | 4.06 | |||
| Collateralized loan obligations |
519 | 1,257 | 2.54 | |||
| Credit cards |
769 | 775 | .26 | |||
| Residential mortgage |
37 | 720 | .90 | |||
| Other |
1,031 | 1,224 | 1.89 | |||
| Cash and miscellaneous receivables |
186 | |||||
| Total |
$5,304 | $8,406 | 2.41 |
| (a) | Market Street did not recognize an asset impairment charge or experience any material rating downgrades during 2007 or 2008. |
Market Street Commitments by Credit Rating (a)
| December 31, 2008 | December 31, 2007 | |||
| AAA/Aaa |
19% | 19% | ||
| AA/Aa |
6 | 6 | ||
| A/A |
72 | 72 | ||
| BBB/Baa |
3 | 3 | ||
| Total |
100% | 100% |
| (a) | The majority of our facilities are not explicitly rated by the rating agencies. All facilities are structured to meet rating agency standards for applicable rating levels. |
We evaluated the design of Market Street, its capital structure, the Note, and relationships among the variable interest holders under the provisions of FASB Interpretation No. 46, (Revised 2003) Consolidation of Variable Interest Entities (FIN 46R). Based on this analysis, we are not the primary beneficiary as defined by FIN 46R and therefore the assets and liabilities of Market Street are not reflected in our Consolidated Balance Sheet.
We would consider changes to the variable interest holders (such as new expected loss note investors and changes to program-level credit enhancement providers), terms of expected loss notes, and new types of risks related to Market Street as reconsideration events. We review the activities of Market Street on at least a quarterly basis to determine if a reconsideration event has occurred.
Based on current accounting guidance, we are not required to consolidate Market Street into our consolidated financial statements. However, if PNC would be determined to be the primary beneficiary under FIN 46R, we would consolidate the commercial paper conduit at that time. Based on current accounting guidance, to the extent that the par value of the assets in Market Street exceeded the fair value of the assets upon consolidation, the difference would be recognized by PNC as a loss in our Consolidated Income Statement in that period. Based on the fair value of the assets held by Market Street at December 31, 2008, the consolidation of Market Street would not have had a material impact on our risk-based capital ratios or debt covenants.
Low Income Housing Projects
We make certain equity investments in various limited partnerships that sponsor affordable housing projects utilizing the Low Income Housing Tax Credit (LIHTC) pursuant to Sections 42 and 47 of the Internal Revenue Code. The purpose of these investments is to achieve a satisfactory return on capital, to facilitate the sale of additional affordable housing product offerings and to assist us in achieving goals associated with the Community Reinvestment Act. The primary activities of the limited partnerships include the identification, development and operation of multi-family housing that is leased to qualifying residential tenants. Generally, these types of investments are funded through a combination of debt and equity. We typically invest in these partnerships as a limited partner.
20
Also, we are a national syndicator of affordable housing equity (together with the investments described above, the LIHTC investments). In these syndication transactions, we create funds in which our subsidiaries are the general partner and sell limited partnership interests to third parties, and in some cases may also purchase a limited partnership interest in the fund. The purpose of this business is to generate income from the syndication of these funds and to generate servicing fees by managing the funds. General partner activities include selecting, evaluating, structuring, negotiating, and closing the fund investments in operating limited partnerships, as well as oversight of the ongoing operations of the fund portfolio.
We evaluate our interests and third party interests in the limited partnerships in determining whether we are the primary beneficiary. The primary beneficiary determination is based on which party absorbs a majority of the variability. The primary sources of variability in LIHTC investments are the tax credits, tax benefits of losses on the investments and development and operating cash flows. We have consolidated LIHTC investments in which we absorb a majority of the variability and thus are considered the primary beneficiary. The assets are primarily included in Equity Investments and Other Assets on our Consolidated Balance Sheet with the liabilities primarily classified in Other Liabilities and Noncontrolling Interests. Neither creditors nor equity investors in the LIHTC investments have any recourse to our general credit. The consolidated aggregate assets and liabilities of these LIHTC investments are provided in the Consolidated VIEs PNC Is Primary Beneficiary table and reflected in the Other business segment.
We also have LIHTC investments in which we are not the primary beneficiary, but are considered to have a significant variable interest based on our interests in the partnership. These investments are disclosed in the Non-Consolidated VIEs Significant Variable Interests table. The table also reflects our maximum exposure to loss. Our maximum exposure to loss is equal to our legally binding equity commitments adjusted for recorded impairment and partnership results. We use the equity and cost methods to account for our investment in these entities with the investments reflected in Equity Investments on our Consolidated Balance Sheet. In addition, we increase our recognized investments and recognize a liability for all legally binding unfunded equity commitments. These liabilities are reflected in Other Liabilities on our Consolidated Balance Sheet.
Credit Risk Transfer Transaction
National City Bank (NCB) sponsored a special purpose entity (SPE) trust and concurrently entered into a credit risk transfer agreement with an independent third-party to mitigate credit losses on a pool of nonconforming mortgage loans originated by its former First Franklin business unit. The SPE was formed with a small contribution from NCB and was structured as a bankruptcy-remote entity so that its creditors have no recourse to NCB. In exchange for a perfected security interest in the cash flows of the nonconforming mortgage loans, the SPE issued to NCB asset-backed securities in the form of senior, mezzanine, and subordinated equity notes. NCB has incurred credit losses equal to the subordinated equity notes. NCB currently holds the right to put the mezzanine notes to the independent third-party at par. As of December 31, 2008, the value of the mezzanine notes was $169 million. NCB holds the senior notes and will be responsible for credit losses in excess of this amount.
The SPE was deemed to be a VIE as its equity was not sufficient to finance its activities. NCB was determined to be the primary beneficiary of the SPE as it would absorb the majority of the expected losses of the SPE through its holding of all of the asset-backed securities. Accordingly, this SPE was consolidated and all of the entitys assets, liabilities, and equity are intercompany balances and are eliminated in consolidation. Nonconforming mortgage loans, including foreclosed properties, pledged as collateral to the SPE remain on the balance sheet and totaled $719 million at December 31, 2008 reflecting the impact of fair value adjustments recorded by PNC in conjunction with the acquisition.
In January 2009, cumulative credit losses in the mortgage loan pool surpassed the principal balance of subordinated equity notes, giving PNC the right to put the first mezzanine note to the independent third party in accordance with the credit risk transfer agreement. In February 2009, PNC exercised its put option and received $16 million for the mezzanine note. Prior to this reconsideration event, management evaluated what impact this transaction would have on determining whether we would remain the primary beneficiary of the SPE. Management concluded, through reassessment of the expected losses and residual returns of the SPE, that we would remain the primary beneficiary and accordingly should continue to consolidate the SPE.
Perpetual Trust Securities
We issue certain hybrid capital vehicles that qualify as capital for regulatory and rating agency purposes.
In February 2008, PNC Preferred Funding LLC (the LLC), one of our indirect subsidiaries, sold $375 million of 8.700% Fixed-to-Floating Rate Non-Cumulative Exchangeable Perpetual Trust Securities of PNC Preferred Funding Trust III (Trust III) to third parties in a private placement. In connection with the private placement, Trust III acquired $375 million of Fixed-to-Floating Rate Non-Cumulative Perpetual Preferred Securities of the LLC (the LLC Preferred Securities). The sale was similar to the March 2007 private placement by the LLC of $500 million of 6.113% Fixed-to-Floating Rate Non-Cumulative Exchangeable Trust Securities (the Trust II Securities) of PNC Preferred Funding Trust II (Trust II) in which Trust II acquired $500 million of LLC Preferred Securities and to the December 2006 private placement by PNC REIT Corp. of $500 million of 6.517% Fixed-to-Floating Rate Non-Cumulative Exchangeable Perpetual Trust Securities (the Trust I Securities) of PNC Preferred Funding Trust I (Trust I) in which Trust I acquired $500 million of LLC Preferred Securities.
21
Each Trust III Security is automatically exchangeable into a share of Series J Non-Cumulative Perpetual Preferred Stock of PNC, each Trust II Security is automatically exchangeable into a share of Series I Non-Cumulative Perpetual Preferred Stock of PNC (Series I Preferred Stock), and each Trust I Security is automatically exchangeable into a share of Series F Non-Cumulative Perpetual Preferred Stock of PNC Bank, N.A. (PNC Bank Preferred Stock), in each case under certain conditions relating to the capitalization or the financial condition of PNC Bank, N.A. and upon the direction of the Office of the Comptroller of the Currency.
We entered into a replacement capital covenant in connection with the closing of the Trust I Securities sale (the Trust RCC) whereby we agreed that neither we nor our subsidiaries (other than PNC Bank, N.A. and its subsidiaries) would purchase the Trust Securities, the LLC Preferred Securities or the PNC Bank Preferred Stock unless such repurchases or redemptions are made from the proceeds of the issuance of certain qualified securities and pursuant to the other terms and conditions set forth in the replacement capital covenant with respect to the Trust RCC.
We also entered into a replacement capital covenant in connection with the closing of the Trust II Securities sale (the Trust II RCC) whereby we agreed until March 29, 2017 that neither we nor our subsidiaries would purchase or redeem the Trust II Securities, the LLC Preferred Securities or the Series I Preferred Stock unless such repurchases or redemptions are made from the proceeds of the issuance of certain qualified securities and pursuant to the other terms and conditions set forth in the replacement capital covenant with respect to the Trust RCC.
As of December 31, 2008, each of the Trust RCC and the Trust II RCC are for the benefit of holders of our $200 million of Floating Rate Junior Subordinated Notes issued in June 1998. We filed a copy of each of the Trust RCC and the Trust II RCC with the SEC as Exhibit 99.1 to PNCs Form 8-K filed on December 8, 2006 and as Exhibit 99.1 to PNCs Form 8-K filed on March 30, 2007, respectively.
PNC has contractually committed to Trust II and Trust III that if full dividends are not paid in a dividend period on the Trust II Securities or the Trust III Securities, as applicable, or the LLC Preferred Securities held by Trust II or Trust III, as applicable, PNC will not declare or pay dividends with respect to, or redeem, purchase or acquire, any of its equity capital securities during the next succeeding dividend period, other than: (i) purchases, redemptions or other acquisitions of shares of capital stock of PNC in connection with any employment contract, benefit plan or other similar arrangement with or for the benefit of employees, officers, directors or consultants, (ii) purchases of shares of common stock of PNC pursuant to a contractually binding requirement to buy stock existing prior to the commencement of the extension period, including under a contractually binding stock repurchase plan, (iii) any dividend in connection with the implementation of a shareholders rights plan, or the redemption or repurchase of any rights under any such plan, (iv) as a result of an exchange or conversion of any class or series of PNCs capital stock for any other class or series of PNCs capital stock, (v) the purchase of fractional interests in shares of PNC capital stock pursuant to the conversion or exchange provisions of such stock or the security being converted or exchanged or (vi) any stock dividends paid by PNC where the dividend stock is the same stock as that on which the dividend is being paid.
PNC Bank, N.A. has contractually committed to Trust I that if full dividends are not paid in a dividend period on the Trust I Securities, LLC Preferred Securities or any other parity equity securities issued by the LLC, neither PNC Bank, N.A. nor its subsidiaries will declare or pay dividends or other distributions with respect to, or redeem, purchase or acquire or make a liquidation payment with respect to, any of its equity capital securities during the next succeeding period (other than to holders of the LLC Preferred Securities and any parity equity securities issued by the LLC) except: (i) in the case of dividends payable to subsidiaries of PNC Bank, N.A., to PNC Bank, N.A. or another wholly-owned subsidiary of PNC Bank, N.A. or (ii) in the case of dividends payable to persons that are not subsidiaries of PNC Bank, N.A., to such persons only if, (A) in the case of a cash dividend, PNC has first irrevocably committed to contribute amounts at least equal to such cash dividend or (B) in the case of in-kind dividends payable by PNC REIT Corp., PNC has committed to purchase such in-kind dividend from the applicable PNC REIT Corp. holders in exchange for a cash payment representing the market value of such in-kind dividend, and PNC has committed to contribute such in-kind dividend to PNC Bank, N.A.
PNC Capital Trust E Trust Preferred Securities
In February 2008, PNC Capital Trust E issued $450 million of 7.75% Trust Preferred Securities due March 15, 2068 (the Trust E Securities). PNC Capital Trust Es only assets are $450 million of 7.75% Junior Subordinated Notes due March 15, 2068 and issued by PNC (the JSNs). The Trust E Securities are fully and unconditionally guaranteed by PNC. We may, at our option, redeem the JSNs at 100% of their principal amount on or after March 15, 2013.
In connection with the closing of the Trust E Securities sale, we agreed that, if we have given notice of our election to defer interest payments on the JSNs or a related deferral period is continuing, then PNC would be subject during such period to restrictions on dividends and other provisions protecting the status of the JSN debenture holder similar to or in some ways more restrictive than those potentially imposed under the Exchange Agreements with Trust II and Trust III, as described above. PNC Capital Trusts C and D have similar protective provisions with respect to $500 million in principal amount of junior subordinated debentures. Also, in connection with the closing of the Trust E Securities sale, we entered into a replacement capital covenant, a copy of which was attached as Exhibit 99.1 to PNCs Form 8-K filed on February 13, 2008 and which is described in Note 14 Capital Securities of Subsidiary Trusts in the Notes To Consolidated Financial Statements of this Exhibit 99.1.
22
Acquired Entity Trust Preferred Securities
As a result of the National City acquisition, we assumed obligations with respect to $2.4 billion in principal amount of junior subordinated debentures issued by the acquired entity. As a result of the Mercantile, Yardville and Sterling acquisitions, we assumed obligations with respect to $158 million in principal amount of junior subordinated debentures issued by the acquired entities. Under the terms of these debentures, if there is an event of default under the debentures or PNC exercises its right to defer payments on the related trust preferred securities issued by the statutory trusts or there is a default under PNCs guarantee of such payment obligations, PNC would be subject during the period of such default or deferral to restrictions on dividends and other provisions protecting the status of the debenture holders similar to or in some ways more restrictive than those potentially imposed under the Exchange Agreements with Trust II and Trust III, as described above.
We are subject to replacement capital covenants (RCCs) with respect to four tranches of junior subordinated debentures inherited from National City, copies of which RCCs were attached, respectively, as Exhibit 99.2 to the National City Form 8-K filed on February 4, 2008 and Exhibit 99.1 to the National City Forms 8-K filed on November 9, 2006, May 25, 2007 and August 30, 2007. See Note 14 Capital Securities of Subsidiary Trusts in the Notes To Consolidated Financial Statements of this Exhibit 99.1. Similarly, we are subject to a replacement capital covenant with respect to our Series L Preferred Stock, a copy of which was attached as Exhibit 99.1 to National Citys Form 8-K filed on February 4, 2008. See Note 19 Shareholders Equity in the Notes To Consolidated Financial Statements of this Exhibit 99.1.
FAIR VALUE MEASUREMENTS AND FAIR VALUE OPTION
We adopted SFAS 157, Fair Value Measurements (SFAS 157), and SFAS 159, The Fair Value Option for Financial Assets and Financial Liabilities Including an amendment of FASB Statement No. 115 (SFAS 159), on January 1, 2008. SFAS 157 defines fair value, establishes a framework for measuring fair value, and expands disclosures about fair value measurements. SFAS 159 permits entities to choose to measure many financial instruments and certain other items at fair value. Under SFAS 159, we elected to fair value certain commercial mortgage loans classified as held for sale and certain customer resale agreements and bank notes to align the accounting for the changes in the fair value of these financial instruments with the changes in the value of their related hedges. See Note 8 Fair Value in the Notes To Consolidated Financial Statements of this Exhibit 99.1 for further information.
At December 31, 2008, fair value assets represented 13% of total assets and fair value liabilities represented 2% of total liabilities. Assets and liabilities measured at fair value on a recurring basis, including instruments for which PNC has elected the fair value option, are summarized below. As prescribed by SFAS 157, the assets and liabilities of National City acquired in a purchase business combination on December 31, 2008 were excluded from the table below and related disclosures.
Fair Value Measurements Summary
| December 31, 2008 | ||||||||||||
| In millions | Level 1 | Level 2 | Level 3 | Total Fair Value |
||||||||
| Assets |
||||||||||||
| Securities available for sale |
$ | 347 | $ | 21,633 | $ | 4,837 | $ | 26,817 | ||||
| Financial derivatives (a) |
16 | 5,582 | 125 | 5,723 | ||||||||
| Trading securities (b) |
89 | 529 | 73 | 691 | ||||||||
| Commercial mortgage loans held for sale (c) |
1,400 | 1,400 | ||||||||||
| Customer resale agreements (d) |
1,072 | 1,072 | ||||||||||
| Equity investments |
571 | 571 | ||||||||||
| Other assets |
144 | 6 | 150 | |||||||||
| Total assets |
$ | 452 | $ | 28,960 | $ | 7,012 | $ | 36,424 | ||||
| Liabilities |
||||||||||||
| Financial derivatives (e) |
$2 | $4,387 | $22 | $4,411 | ||||||||
| Trading securities sold short (f) |
182 | 207 | 389 | |||||||||
| Other liabilities |
9 | 9 | ||||||||||
| Total liabilities |
$ | 184 | $ | 4,603 | $ | 22 | $ | 4,809 | ||||
| (a) | Included in other assets on the Consolidated Balance Sheet. |
| (b) | Included in trading securities on the Consolidated Balance Sheet. Fair value includes net unrealized losses of $27.5 million. |
| (c) | Included in loans held for sale on the Consolidated Balance Sheet. PNC has elected the fair value option under SFAS 159 for certain commercial mortgage loans held for sale. |
| (d) | Included in federal funds sold and resale agreements on the Consolidated Balance Sheet. PNC has elected the fair value option under SFAS 159 for this item. |
| (e) | Included in other liabilities on the Consolidated Balance Sheet. |
| (f) | Included in other borrowed funds on the Consolidated Balance Sheet. |
23
Valuation Hierarchy
The following is an outline of the valuation methodologies used for measuring fair value under SFAS 157 for the major items above. SFAS 157 focuses on the exit price in the principal or most advantageous market for the asset or liability in an orderly transaction between willing market participants and establishes a reporting hierarchy to maximize the use of observable inputs. The fair value hierarchy (i.e., Level 1, Level 2, and Level 3) is described in detail in Note 8 Fair Value in the Notes To Consolidated Financial Statements of this Exhibit 99.1.
We characterize active markets as those where transaction volumes are sufficient to provide objective pricing information, with reasonably narrow bid/ask spreads and where dealer quotes received do not vary widely. Inactive markets are characterized by low transaction volumes, price quotations which vary substantially among market participants, or in which minimal information is released publicly. We also consider nonperformance risks including credit risk as part of our valuation methodology for all assets measured at fair value. Any models used to determine fair values or to validate dealer quotes based on the descriptions below are subject to review and independent testing as part of our model validation and internal control testing processes. Significant models are tested by our Model Validation Committee on at least an annual basis. In addition, we have teams, independent of the traders, verify marks and assumptions used for valuations at each period end.
Securities
Securities include both the available for sale and trading portfolios. We use prices sourced from pricing services, dealer quotes or recent trades to determine the fair value of securities. Approximately 75% of our positions are valued using pricing services provided by the Lehman Index and IDC. Lehman Index prices are set with reference to market activity for highly liquid assets such as agency mortgage-backed securities, and matrix priced for other assets, such as CMBS and asset-backed securities. IDC primarily uses matrix pricing for the instruments we value using this service, such as agency adjustable rate mortgage securities, agency CMOs and municipal bonds. Dealer quotes received are typically non-binding and corroborated with other dealers quotes, by reviewing valuations of comparable instruments, or by comparison to internal valuations. The majority of our securities are classified as Level 2 in the fair value hierarchy. In circumstances where market prices are limited or unavailable, valuations may require significant management judgments or adjustments to determine fair value. In these cases, the securities are classified as Level 3.
The primary valuation technique for securities classified as Level 3 is to identify a proxy security, market transaction or index. The proxy selected generally has similar credit, tenor, duration, pricing and structuring attributes to the PNC position. The price, market spread, or yield on the proxy is then used to calculate an indicative market price for the security. Depending on the nature of the PNC position and its attributes relative to the proxy, management may make additional adjustments to account for market conditions, liquidity, and nonperformance risk, based on various inputs including recent trades of similar assets, single dealer quotes, and/or other observable and unobservable inputs.
| Dollars in millions | December 31, 2008 | |||||||||||
| Agency | Non-Agency | |||||||||||
| Residential Mortgage- Backed Securities |
Residential Mortgage- Backed Securities |
Commercial Mortgage- Backed Securities |
Other Asset- Back Securities |
|||||||||
| Fair Value |
$12,742 | $7,420 | $3,419 | $1,492 | ||||||||
| % of Fair Value: |
||||||||||||
| By Vintage |
||||||||||||
| 2008 |
36 | % | 1 | % | ||||||||
| 2007 |
24 | % | 15 | % | 10 | % | 15 | % | ||||
| 2006 |
23 | % | 23 | % | 31 | % | 30 | % | ||||
| 2005 |
5 | % | 35 | % | 12 | % | 31 | % | ||||
| 2004 and earlier |
12 | % | 26 | % | 47 | % | 24 | % | ||||
| Total |
100 | % | 100 | % | 100 | % | 100 | % | ||||
| By Credit rating |
||||||||||||
| Agency |
100 | % | 1 | % | ||||||||
| AAA |
82 | % | 98 | % | 71 | % | ||||||
| AA |
4 | % | 1 | % | 7 | % | ||||||
| A |
5 | % | 2 | % | ||||||||
| BBB |
2 | % | 8 | % | ||||||||
| BB |
3 | % | 6 | % | ||||||||
| B |
1 | % | 2 | % | ||||||||
| Lower than B |
2 | % | 4 | % | ||||||||
| No rating |
1 | % | ||||||||||
| Total |
100 | % | 100 | % | 100 | % | 100 | % | ||||
| By FICO Score |
||||||||||||
| >720 |
68 | % | 13 | % | ||||||||
| <720 or >660 |
30 | % | 47 | % | ||||||||
| <660 |
1 | % | ||||||||||
| No FICO score |
100 | % | 2 | % | 100 | % | 39 | % | ||||
| Total |
100 | % | 100 | % | 100 | % | 100 | % | ||||
24
Residential Mortgage-Backed Securities
At December 31, 2008, our residential mortgage-backed securities portfolio was comprised of $12.7 billion fair value of US government agency-backed securities (substantially all classified as available for sale) and $7.4 billion fair value of private-issuer securities (all classified as available for sale). The agency securities are generally collateralized by 1-4 family, conforming, fixed-rate residential mortgages. The private-issuer securities are also generally collateralized by 1-4 family residential mortgages. The mortgage loans underlying the private-issuer securities are generally non-conforming (i.e., original balances in excess of the amount qualifying for agency securities) and predominately have interest rates that are fixed for a period of time, after which the rate adjusts to a floating rate based upon a contractual spread that is indexed to a market rate (i.e., a hybrid ARM).
Substantially all of the securities are senior tranches in the subordination structure and have credit protection in the form of credit enhancement, over-collateralization and/or excess spread accounts. At December 31, 2008, $419 million, or 6%, of private-issuer securities were rated below BBB by at least one national rating agency or not rated.
For eight securities, we recorded other-than-temporary impairment charges of $151 million in 2008.
Commercial Mortgage-Backed Securities
The commercial mortgage-backed securities portfolio was $3.4 billion fair value at December 31, 2008 (all classified as available for sale), and consisted of fixed-rate, private-issuer securities collateralized by non-residential properties, primarily retail properties, office buildings, and multi-family housing. Substantially all of the securities are the most senior tranches in the subordination structure.
At December 31, 2008, $18 million, or 1%, of the commercial mortgage-backed securities were not rated.
We recorded no other-than-temporary impairment charges on commercial mortgage-backed securities in 2008.
Other Asset-Backed Securities
The asset-backed securities portfolio was $1.5 billion fair value at December 31, 2008 (all classified as available for sale), and consisted of fixed-rate and floating-rate, private-issuer securities collateralized primarily by various consumer credit products, including first-lien residential mortgage loans, credit cards, and automobile loans. Substantially all of the securities are senior tranches in the subordination structure and have credit protection in the form of credit enhancement, over-collateralization and/or excess spread accounts.
At December 31, 2008, $184 million, or 12%, of the asset-backed securities were rated below BBB by at least one national rating agency or not rated.
For seven asset-backed securities, we recorded other-than-temporary impairment charges totaling approximately $87 million in 2008.
Financial Derivatives
Exchange-traded derivatives are valued using quoted market prices and are classified as Level 1. However, the majority of derivatives that we enter into are executed over-the-counter and are valued using internal techniques. Readily observable market inputs to these models can be validated to external sources, including industry pricing services, or corroborated through recent trades, dealer quotes, yield curves, implied volatility or other market related data. Certain derivatives, such as total rate of return swaps, are corroborated to the CMBX index. These derivatives are classified as Level 2. Derivatives priced using significant management judgment or assumptions are classified as Level 3. The fair values of our derivatives are adjusted for nonperformance risk including credit risk as appropriate. Our nonperformance risk adjustment is computed using internal assumptions based primarily on historical default and recovery observations. The credit risk adjustment is not currently material to the overall derivatives valuation.
Commercial Mortgage Loans and Commitments Held for Sale
Effective January 1, 2008, we elected to account for commercial mortgage loans classified as held for sale and intended for securitization at fair value under the provisions of SFAS 159. Based on the significance of unobservable inputs, we classify this portfolio as Level 3. As such, a synthetic securitization methodology was used historically to value the loans and the related unfunded commitments on an aggregate basis based upon current commercial mortgage-backed securities (CMBS) market structures and conditions. The election of the fair value option aligns the accounting for the commercial mortgages with the related hedges. It also eliminates the requirements of hedge accounting under SFAS 133. Due to the inactivity in the CMBS securitization market in 2008, we determined the fair value of commercial mortgage loans held for sale by using a whole loan methodology. Based on the significance of unobservable inputs, we classify this portfolio as Level 3. Valuation assumptions included observable inputs based on whole loan sales, both observed in the market and actual sales from our portfolio and new loan origination spreads during the quarter. Adjustments were made to the assumptions to account for uncertainties, including market conditions, and liquidity. Credit risk was included as part of our valuation process for these loans by considering expected rates of return for market participants for similar loans in the marketplace.
Customer Resale Agreements
Effective January 1, 2008, we elected to account for structured resale agreements at fair value, which are economically hedged using free-standing financial derivatives. The fair value for structured resale agreements is determined using a model which includes
25
observable market data as inputs such as interest rates. Readily observable market inputs to this model can be validated to external sources, including yield curves, implied volatility or other market related data.
Equity Investments
The valuation of direct and indirect private equity investments requires significant management judgment due to the absence of quoted market prices, inherent lack of liquidity and the long-term nature of such investments. The carrying values of direct and affiliated partnership interests reflect the expected exit price and are based on various techniques including publicly traded price, multiples of adjusted earnings of the entity, independent appraisals, anticipated financing and sale transactions with third parties, or the pricing used to value the entity in a recent financing transaction. Indirect investments in private equity funds are valued based on the financial statements that we receive from their managers. Due to the time lag in our receipt of the financial information and based on a review of investments and valuation techniques applied, adjustments to the manager provided value are made when available recent portfolio company information or market information indicates a significant change in value from that provided by the manager of the fund. These investments are classified as Level 3.
Level 3 Assets and Liabilities
Under SFAS 157, financial instruments are considered Level 3 when their values are determined using pricing models, discounted cash flow methodologies or similar techniques and at least one significant model assumption or input is unobservable. At December 31, 2008, Level 3 fair value assets of $7.012 billion represented 19% of total assets at fair value and 2% of total assets. Level 3 fair value liabilities of $22 million at December 31, 2008 represented less than 1% of total liabilities at fair value and less than 1% of total liabilities at that date.
During 2008, securities transferred into Level 3 from Level 2 exceeded securities transferred out by $4.3 billion. These primarily related to private issuer asset-backed securities, auction rate securities, residential mortgage-backed securities and corporate bonds and occurred due to reduced volume of recently executed transactions and the lack of corroborating market price quotations for these instruments. Other Level 3 assets include commercial mortgage loans held for sale, private equity investments and other assets.
Total securities measured at fair value at December 31, 2008 included securities available for sale and trading securities consisting primarily of residential and commercial mortgage-backed securities and other asset-backed securities. Unrealized gains and losses on available for sale securities do not impact liquidity or risk-based capital. However, reductions in the credit ratings of these securities would have an impact on the determination of risk-weighted assets which could reduce our regulatory capital ratios. In addition, other-than-temporary impairments on available for sale securities would reduce our regulatory capital ratios.
BUSINESS SEGMENTS REVIEW
We have seven major businesses engaged in providing banking, asset management and global fund processing products and services. Business segment results, including inter-segment revenues, and a description of each business are included in Note 27 Segment Reporting included in the Notes To Consolidated Financial Statements in this Exhibit 99.1.
Certain revenue and expense amounts included in this Business Segments Review differ from the amounts shown in Note 27 due to the presentation in this Business Segments Review of business revenue on a taxable-equivalent basis, income statement classification differences related to Global Investment Servicing, the inclusion of the results of Hilliard Lyons, including the March 2008 gain on sale, in the Other category, and the inclusion of 2008 Albridge Solutions and Coates Analytics and 2007 BlackRock/MLIM transaction integration costs in the Other category.
Results of individual businesses are presented based on our management accounting practices and management structure. There is no comprehensive, authoritative body of guidance for management accounting equivalent to GAAP; therefore, the financial results of our individual businesses are not necessarily comparable with similar information for any other company. We refine our methodologies from time to time as our management accounting practices are enhanced and our businesses and management structure change. Financial results are presented, to the extent practicable, as if each business operated on a stand-alone basis. As permitted under GAAP, we have aggregated the business results for certain similar operating segments for financial reporting purposes.
Assets receive a funding charge and liabilities and capital receive a funding credit based on a transfer pricing methodology that incorporates product maturities, duration and other factors. Capital is intended to cover unexpected losses and is assigned to the banking and servicing businesses using our risk-based economic capital model. We have assigned capital equal to 6% of funds to Retail Banking to reflect the capital required for well-capitalized domestic banks and to approximate market comparables for this business. The capital assigned for Global Investment Servicing reflects its legal entity shareholders equity.
We have allocated the allowances for loan and lease losses and unfunded loan commitments and letters of credit based on our assessment of risk inherent in the business segment loan portfolios. Our allocation of the costs incurred by operations and other shared support areas not directly aligned with the businesses is primarily based on the use of services.
Total business segment financial results differ from total consolidated results. The impact of these differences is reflected in the Other category. Other for purposes of this Business Segments Review and the Business Segment Highlights in the Executive Summary includes residual activities that do not meet the criteria for disclosure as a separate reportable business, such as gains or
26
losses related to BlackRock transactions including LTIP share distributions and obligations, earnings and gains or losses related to Hilliard Lyons, integration costs, asset and liability management activities including net securities gains or losses and certain trading activities, exited businesses, equity management activities, alternative investments, intercompany eliminations, most corporate overhead, and differences between business segment performance reporting and financial statement reporting (GAAP), including the presentation of net income attributable to noncontrolling interests.
Employee data as reported by each business segment in the tables that follow reflect PNC legacy staff directly employed by the respective businesses and excludes corporate and shared services employees. National City legacy employees totaling 31,374 at December 31, 2008 are not included in any of PNCs business segment tables.
Results Of Businesses Summary
| Earnings | Revenue | Average Assets (a) | ||||||||||||||||||
| Year ended December 31 - in millions | 2008 | 2007 | 2008 | 2007 | 2008 | 2007 | ||||||||||||||
| Retail Banking (b) |
$ | 328 | $ | 620 | $ | 2,731 | $ | 2,758 | $ | 32,922 | $ | 31,608 | ||||||||
| Corporate & Institutional Banking |
215 | 512 | 1,859 | 1,774 | 47,050 | 36,416 | ||||||||||||||
| Asset Management Group |
119 | 158 | 559 | 594 | 3,001 | 2,619 | ||||||||||||||
| BlackRock |
207 | 253 | 261 | 338 | 4,240 | 4,259 | ||||||||||||||
| Global Investment Servicing (c) |
122 | 128 | 916 | 831 | 5,278 | 2,476 | ||||||||||||||
| Total business segments |
991 | 1,671 | 6,326 | 6,295 | 92,491 | 77,378 | ||||||||||||||
| Other (d) (e) |
(77 | ) | (180 | ) | 864 | 410 | 49,529 | 46,040 | ||||||||||||
| Total consolidated |
$ | 914 | $ | 1,491 | $ | 7,190 | $ | 6,705 | $ | 142,020 | $ | 123,418 | ||||||||
| (a) | Period-end balances for BlackRock and Global Investment Servicing. |
| (b) | Amounts reflect the reclassification of results for Hilliard Lyons, which we sold on March 31, 2008, and the related gain on sale, from Retail Banking to Other. |
| (c) | Global Investment Servicing revenue represents the sum of servicing revenue and nonoperating income (expense) less debt financing costs. Global Investment Servicing income classified as net interest income (expense) in Note 27 Segment Reporting in the Notes To Consolidated Financial Statements in this Exhibit 99.1 represents the interest components of nonoperating income (net of nonoperating expense) and debt financing. |
| (d) | Other for 2008 includes $422 million of after-tax integration costs, including conforming provision for credit losses, primarily related to National City. Other for the 2007 includes $99 million of after-tax integration costs and $53 million of after-tax Visa indemnification costs. |
| Other also includes results related to our cross-border lease portfolio for both 2008 and 2007. However, 2006 results for this item are included in Corporate & Institutional Banking in Note 27 Segment Reporting in the Notes To Consolidated Financial Statements included in this Exhibit 99.1. |
| (e) | Other average assets are comprised primarily of investment securities and residential mortgage loans associated with asset and liability management activities. |
27
RETAIL BANKING (a)
| Year ended December 31 Dollars in millions except as noted |
2008 | 2007 | ||||
| INCOME STATEMENT |
||||||
| Net interest income |
$1,594 | $1,742 | ||||
| Noninterest income |
||||||
| Service charges on deposits |
359 | 336 | ||||
| Brokerage |
152 | 134 | ||||
| Consumer services |
416 | 387 | ||||
| Other |
210 | 159 | ||||
| Total noninterest income |
1,137 | 1,016 | ||||
| Total revenue |
2,731 | 2,758 | ||||
| Provision for credit losses |
388 | 133 | ||||
| Noninterest expense |
1,789 | 1,631 | ||||
| Pretax earnings |
554 | 994 | ||||
| Income taxes |
226 | 374 | ||||
| Earnings |
$328 | $620 | ||||
| AVERAGE BALANCE SHEET |
||||||
| Loans |
||||||
| Consumer |
||||||
| Home equity |
$13,263 | $13,076 | ||||
| Indirect |
2,050 | 1,897 | ||||
| Education |
2,012 | 110 | ||||
| Credit cards |
264 | 210 | ||||
| Other consumer |
468 | 381 | ||||
| Total consumer |
18,057 | 15,674 | ||||
| Commercial and commercial real estate |
5,029 | 5,423 | ||||
| Floor plan |
992 | 978 | ||||
| Residential mortgage |
2,029 | 1,863 | ||||
| Total loans |
26,107 | 23,938 | ||||
| Goodwill and other intangible assets |
5,192 | 4,172 | ||||
| Other assets |
1,623 | 3,498 | ||||
| Total assets |
$32,922 | $31,608 | ||||
| Deposits |
||||||
| Noninterest-bearing demand |
$9,191 | $9,065 | ||||
| Interest-bearing demand |
8,073 | 7,427 | ||||
| Money market |
17,220 | 15,044 | ||||
| Total transaction deposits |
34,484 | 31,536 | ||||
| Savings |
2,681 | 2,659 | ||||
| Certificates of deposit |
15,800 | 16,122 | ||||
| Total deposits |
52,965 | 50,317 | ||||
| Other liabilities |
333 | 418 | ||||
| Capital |
3,334 | 3,171 | ||||
| Total liabilities and equity |
$56,632 | $53,906 | ||||
| PERFORMANCE RATIOS |
||||||
| Return on average capital |
10 | % | 20 | % | ||
| Noninterest income to total revenue |
42 | 37 | ||||
| Efficiency |
66 | 59 | ||||
| OTHER INFORMATION (b) (c) |
||||||
| Credit-related statistics: |
||||||
| Commercial nonperforming assets |
$122 | $86 | ||||
| Consumer nonperforming assets |
68 | 36 | ||||
| Total nonperforming assets (d) |
$190 | $122 | ||||
| Commercial net charge-offs |
$139 | $67 | ||||
| Consumer net charge-offs |
118 | 58 | ||||
| Total net charge-offs |
$257 | $125 | ||||
| Commercial net charge-off ratio |
2.31 | % | 1.05 | % | ||
| Consumer net charge-off ratio |
.59 | % | .33 | % | ||
| Total net charge-off ratio |
.98 | % | .52 | % |
28
| At December 31 Dollars in millions except as noted |
2008 | 2007 | ||||
| OTHER INFORMATION CONTINUED (b) (c) |
||||||
| Other statistics: |
||||||
| Full-time employees |
9,304 | 8,871 | ||||
| ATMs |
4,041 | 3,900 | ||||
| Branches (e) |
1,141 | 1,102 | ||||
| Home equity portfolio credit statistics (f): |
||||||
| % of first lien positions (g) |
37 | % | 38 | % | ||
| Weighted average loan-to-value ratios (g) |
73 | % | 73 | % | ||
| Weighted average FICO scores (h) |
726 | 726 | ||||
| Annualized net charge-off ratio |
.49 | % | .20 | % | ||
| Loans 90 days past due |
.62 | % | .40 | % | ||
| Checking-related statistics: |
||||||
| Retail Banking checking relationships |
2,402,000 | 2,244,000 | ||||
| Retail online banking active customers |
1,215,000 | 1,037,000 | ||||
| Retail online bill payment active customers |
379,000 | 312,000 | ||||
| Brokerage statistics: |
||||||
| Financial consultants (i) |
414 | 364 | ||||
| Full services brokerage offices |
23 | 24 | ||||
| Brokerage account assets (billions) |
$15 | $19 | ||||
| Credit card loans: |
||||||
| Loans held in portfolio |
$330 | $247 | ||||
| Net charge-offs |
$11 | $3 | ||||
| Annualized net charge-off ratio |
4.17 | % | 1.43 | % |
| (a) | Information for all periods presented excludes the impact of National City, which PNC acquired on December 31, 2008, and Hilliard Lyons, which was sold on March 31, 2008, and whose results have been reclassified to Other. |
| (b) | Presented as of December 31 except for net charge-offs and net charge-off ratio, which are for the year ended. |
| (c) | Amounts as of and for the year ended December 31, 2008 include the impact of Yardville. Amounts subsequent to April 4, 2008 include the impact of Sterling. |
| (d) | Includes nonperforming loans of $176 million at December 31, 2008 and $115 million at December 31, 2007. |
| (e) | Excludes certain satellite branches that provide limited products and/or services. |
| (f) | Information presented for 2007 includes estimates. |
| (g) | Includes loans from acquired portfolios for which lien position and loan-to-value information was limited. |
| (h) | Represents the most recent FICO scores that we have on file. |
| (i) | Financial consultants provide services in full service brokerage offices and PNC traditional branches. |
29
The acquisition of National City on December 31, 2008 added 1,439 branches, including 61 branches that we committed to divest, and 2,191 ATMs to our distribution network. Including the impact of National City, our network grew to 2,580 branches and 6,232 ATM machines, giving PNC one of the largest distribution networks among US banks.
All other Retail Banking business segment disclosures in this MD&A exclude any impact of National City.
Retail Bankings earnings were $328 million for 2008 compared with $620 million for 2007. The decline in earnings over the prior year was primarily driven by increases in the provision for credit losses and noninterest expense. The 2008 growth was negatively impacted by a lower interest credit attributed to deposits in the declining rate environment and was therefore not reflective of the solid growth in customers and deposits.
Highlights of Retail Bankings performance during 2008 include the following:
| | Retail Banking expanded the number of customers it serves and grew checking relationships. Total checking relationships increased by a net 158,000 since December 31, 2007, which includes both the conversion of Yardville and Sterling accounts as well as the addition of new relationships through organic growth. Excluding relationships added from acquisitions, net new consumer and business checking relationships grew by 70,000 in 2008. |
| | Average deposit balances increased $2.6 billion or 5% primarily as a result of strong money market deposit growth and the benefits of the acquisitions. |
| | Our investment in online banking capabilities continued to pay off. Retail online bill payment active customers increased 21% since December 31, 2007. We continue to seek customer growth by expanding our use of technology, such as the recent launch of our Virtual Wallet online banking product. Recently, Virtual Wallet received a Best of the Web award for 2008 from Online Banking Report. |
| | Retail Banking continued to invest in the branch network. During 2008, we opened 19 new branches, consolidated 45 branches, and acquired 65 branches for a total of 1,141 branches at December 31, 2008. We continue to work to optimize our network by opening new branches in high growth areas, relocating branches to areas of higher market opportunity, and consolidating branches in areas of declining opportunity. We relocated 8 branches during 2008. |
In October 2008 we announced an exclusive agreement under which we will provide banking services in Giant Food LLC supermarket locations across Virginia, Maryland, Delaware and the District of Columbia. In 2009, we expect to open approximately 40 new in-store branches and install approximately 180 ATMs. Additional locations are expected to open in subsequent years.
Total revenue for 2008 was $2.731 billion, a 1% decrease compared with $2.758 billion for 2007. Net interest income of $1.594 billion decreased $148 million, or 8%, compared with 2007. This decline was primarily driven by a lower value attributed to deposits in the declining rate environment partially offset by benefits from earlier acquisitions.
Noninterest income increased $121 million, or 12%, compared with 2007. This growth was attributed primarily to the following:
| | A gain of $95 million from the redemption of a portion of our Visa Class B common shares related to Visas March 2008 initial public offering, |
| | The Mercantile, Yardville and Sterling acquisitions, |
| | Increased volume-related consumer fees including debit card, credit card, and merchant revenue, and |
| | Increased brokerage account activities. |
These increases were partially offset by other business gains in the prior year.
The Market Risk Management Equity and Other Investment Risk section of this MD&A includes further information regarding Visa.
The provision for credit losses for 2008 was $388 million compared to $133 million for 2007. Net charge-offs were $257 million for 2008 and $125 million in 2007. Asset quality continued to migrate at an accelerated pace in the very challenging economic and credit environment. The increases in provision and net charge-offs were primarily a result of the need to build reserves as credit has migrated downward and the loan portfolios have experienced increased levels of consumer and commercial charge-offs given the current credit environment.
Based upon the current environment and the acquisition of National City, we believe the provision and nonperforming assets will continue to increase in 2009 versus 2008 levels.
Noninterest expense for 2008 totaled $1.789 billion, an increase of $158 million compared with 2007. The majority of this increase was attributable to acquisitions and continued investments in the business such as the branch network and innovation.
Full-time employees at December 31, 2008 totaled 9,304, an increase of 433 over the prior year. Part-time employees have increased by 62 since December 31, 2007. The increase in full-time and part-time employees was primarily the result of the Yardville and Sterling acquisitions.
30
Growing core checking deposits as a lower-cost funding source and as the cornerstone product to build customer relationships is the primary objective of our deposit strategy. Furthermore, core checking accounts are critical to our strategy of expanding our payments business. Average total deposits increased $2.6 billion, or 5%, compared with 2007.
| | Average money market deposits increased $2.2 billion, and average certificates of deposits declined $.3 billion. Money market deposits experienced core growth and both deposit categories benefited from the acquisitions. The decline in certificates of deposits was a result of a focus on relationship customers rather than pursuing higher-rate single service customers. The deposit strategy of Retail Banking is to remain disciplined on pricing, target specific products and markets for growth, and focus on the retention and growth of balances for relationship customers. |
| | Average demand deposit growth of $.8 billion, or 5%, was primarily driven by acquisitions as organic growth was impacted by current economic conditions, such as lower average balances per account. |
Currently, we are focused on a relationship-based lending strategy that targets specific customer sectors (homeowners, students, small businesses and auto dealerships) while seeking a moderate risk profile for the loans that we originate.
| | Average home equity loans grew $187 million, or 1%, compared with 2007 primarily due to acquisitions. Our home equity loan portfolio is relationship based, with 93% of the portfolio attributable to borrowers in our primary geographic footprint. We monitor this portfolio closely and the nonperforming assets and charge-offs that we have experienced are within our expectations given current market conditions. |
| | Average education loans grew $1.9 billion compared with 2007. The increase was primarily the result of the transfer of approximately $1.8 billion of education loans previously held for sale to the loan portfolio during the first quarter of 2008. The Loans Held For Sale portion of the Consolidated Balance Sheet Review section of this MD&A includes additional information related to this transfer. |
| | Average residential mortgage loans increased $166 million primarily due to the addition of loans from acquisitions. |
31
CORPORATE & INSTITUTIONAL BANKING (a)
| Year ended December 31 Dollars in millions except as noted |
2008 | 2007 | ||||||
| INCOME STATEMENT |
||||||||
| Net interest income |
$ | 1,323 | $ | 1,016 | ||||
| Noninterest income |
||||||||
| Corporate service fees |
583 | 597 | ||||||
| Other |
(47 | ) | 161 | |||||
| Noninterest income |
536 | 758 | ||||||
| Total revenue |
1,859 | 1,774 | ||||||
| Provision for credit losses |
575 | 127 | ||||||
| Noninterest expense |
945 | 837 | ||||||
| Pretax earnings |
339 | 810 | ||||||
| Income taxes |
124 | 298 | ||||||
| Earnings |
$ | 215 | $ | 512 | ||||
| AVERAGE BALANCE SHEET |
||||||||
| Loans |
||||||||
| Commercial |
$ | 20,439 | $ | 16,188 | ||||
| Commercial real estate |
5,584 | 3,560 | ||||||
| Commercial real estate related |
3,049 | 2,255 | ||||||
| Asset-based lending |
5,274 | 4,578 | ||||||
| Equipment lease financing |
1,482 | 1,456 | ||||||
| Total loans |
35,828 | 28,037 | ||||||
| Goodwill and other intangible assets |
3,149 | 2,618 | ||||||
| Loans held for sale |
2,053 | 1,318 | ||||||
| Other assets |
6,020 | 4,443 | ||||||
| Total assets |
$ | 47,050 | $ | 36,416 | ||||
| Deposits |
||||||||
| Noninterest-bearing demand |
$ | 8,388 | $ | 7,961 | ||||
| Money market |
5,817 | 5,229 | ||||||
| Other |
3,129 | 2,161 | ||||||
| Total deposits |
17,334 | 15,351 | ||||||
| Other liabilities |
5,357 | 3,293 | ||||||
| Capital |
3,087 | 2,462 | ||||||
| Total liabilities and equity |
$ | 25,778 | $ | 21,106 | ||||
| PERFORMANCE RATIOS |
||||||||
| Return on average capital |
7 | % | 21 | % | ||||
| Noninterest income to total revenue |
29 | 43 | ||||||
| Efficiency |
51 | 47 | ||||||
| COMMERCIAL MORTGAGE SERVICING PORTFOLIO (in billions) |
||||||||
| Beginning of period |
$ | 243 | $ | 200 | ||||
| Acquisitions/additions |
31 | 88 | ||||||
| Repayments/transfers |
(25 | ) | (45 | ) | ||||
| End of period |
$ | 249 | $ | 243 | ||||
| OTHER INFORMATION |
||||||||
| Consolidated revenue from (b): |
||||||||
| Treasury management |
$ | 545 | $ | 476 | ||||
| Capital markets |
$ | 336 | $ | 290 | ||||
| Commercial mortgage loans held for sale (c) |
$ | (115 | ) | $ | 19 | |||
| Commercial mortgage loan servicing (d) |
180 | 233 | ||||||
| Total commercial mortgage banking activities |
$ | 65 | $ | 252 | ||||
| Total loans (e) |
$ | 38,063 | $ | 30,959 | ||||
| Nonperforming assets (e) (f) |
$ | 1,173 | $ | 344 | ||||
| Net charge-offs |
$ | 267 | $ | 68 | ||||
| Full-time employees (e) |
2,502 | 2,518 | ||||||
| Net carrying amount of commercial mortgage servicing rights (e) |
$ | 654 | $ | 694 | ||||
| (a) | Information for all periods presented excludes the impact of National City, which PNC acquired on December 31, 2008. |
| (b) | Represents consolidated PNC amounts. |
| (c) | Includes valuations on commercial mortgage loans held for sale and related commitments, derivative valuations, origination fees, gains on sale of loans held for sale and net interest income on loans held for sale. |
32
| (d) | Includes net interest income and noninterest income from loan servicing and ancillary services. |
| (e) | At December 31. |
| (f) | Includes nonperforming loans of $1,171 million at December 31, 2008 and $320 million at December 31, 2007. |
Corporate & Institutional Banking earned $215 million in 2008 compared with $512 million in 2007. The 58% decline in earnings over 2007 was primarily driven by an increase in the provision for credit losses and by higher valuation losses on commercial mortgage loans held for sale, net of hedges.
| | Net interest income grew $307 million, or 30%, in 2008 compared with 2007. The increase over the prior year was primarily a result of an increase in commercial mortgage loans held for sale, organic loan growth and acquisitions. |
| | Corporate service fees decreased $14 million compared with 2007 to $583 million. The fourth quarter of 2008 included a $35 million impairment charge on commercial mortgage servicing rights due to the effect of lower interest rates. Increases in treasury management, structured finance and syndication fees more than offset declines in commercial mortgage servicing fees, net of amortization, and merger and acquisition advisory fees. |
| | Other noninterest income was negative $47 million for 2008 compared with income of $161 million in 2007. Losses of $197 million on commercial mortgage loans held for sale, net of hedges, were included in other noninterest income for 2008 compared with gains of $3 million in 2007. These non-cash valuation losses reflected illiquid market conditions which began in the latter part of 2007. |
| | PNC adopted SFAS 159 beginning January 1, 2008 and elected to account for its loans held for sale and intended for securitization at fair value. We stopped originating these loans during the first quarter of 2008. We intend to continue pursuing opportunities to reduce our loans held for sale position at appropriate prices. We sold and/or securitized $.6 billion of commercial mortgage loans held for sale carried at fair value in 2008 reducing these fair value assets to $1.4 billion at December 31, 2008. |
| | The provision for credit losses was $575 million in 2008 compared with $127 million in 2007. The increase in the provision was primarily due to credit quality migration mainly related to residential real estate development and related sectors along with growth in total credit exposure. Nonperforming assets increased $829 million in the comparison. The largest component of the increase was in commercial real estate and commercial real estate related loans. Based upon the current environment and the acquisition of National City, we believe the provision will continue to increase in 2009 versus 2008 levels. |
| | Noninterest expense increased $108 million, or 13%, compared with 2007. The increase was primarily due to the impact of the 2007 ARCS Commercial Mortgage and Mercantile acquisitions, expenses associated with revenue-related activities, growth initiatives mainly in treasury management, higher passive losses associated with low income housing tax credit investments, and write-downs of other real estate owned. |
| | Average loan balances increased $7.8 billion, or 28%, compared with 2007. The increase in commercial and commercial real estate loans resulted from higher utilization of credit facilities, organic growth from new and existing clients, and the impact of the Mercantile and Yardville acquisitions. |
| | Average deposit balances increased $2.0 billion, or 13%, compared with 2007. The increase resulted primarily from higher time deposits and the impact of acquisitions. |
| | The commercial mortgage servicing portfolio was $249 billion at December 31, 2008, an increase of $6 billion from December 31, 2007. Servicing portfolio additions were modest during 2008 due to the declining volumes in the commercial mortgage securitization market. |
| | Average other assets and other liabilities increased $1.6 billion and $2.1 billion, respectively. These increases were due to customer driven trading and related hedging transactions. In addition, an increase in customer driven money management activities contributed to the higher other liabilities balance. |
See the additional revenue discussion regarding treasury management, capital markets-related products and services, and commercial mortgage banking activities in the Product Revenue portion of the Consolidated Income Statement Review section of this MD&A.
33
ASSET MANAGEMENT GROUP
| Year ended December 31 Dollars in millions except as noted |
2008 | 2007 | ||||||
| INCOME STATEMENT |
||||||||
| Net interest income |
$ | 130 | $ | 133 | ||||
| Noninterest income |
429 | 461 | ||||||
| Total revenue |
559 | 594 | ||||||
| Provision for credit losses |
6 | 3 | ||||||
| Noninterest expense |
363 | 339 | ||||||
| Pretax earnings |
190 | 252 | ||||||
| Income taxes |
71 | 94 | ||||||
| Earnings |
$ | 119 | $ | 158 | ||||
| AVERAGE BALANCE SHEET |
||||||||
| Loans |
||||||||
| Consumer |
$ | 2,136 | $ | 1,863 | ||||
| Commercial and commercial real estate |
577 | 483 | ||||||
| Residential mortgage |
66 | 60 | ||||||
| Total loans |
2,779 | 2,406 | ||||||
| Goodwill and other intangible assets |
39 | 39 | ||||||
| Other assets |
183 | 174 | ||||||
| Total assets |
$ | 3,001 | $ | 2,619 | ||||
| Deposits |
||||||||
| Noninterest-bearing demand |
$ | 859 | $ | 764 | ||||
| Interest-bearing demand |
700 | 664 | ||||||
| Money market |
1,855 | 1,296 | ||||||
| Total transaction deposits |
3,414 | 2,724 | ||||||
| Certificates of deposit and other |
589 | 480 | ||||||
| Total deposits |
4,003 | 3,204 | ||||||
| Other liabilities |
12 | 18 | ||||||
| Capital |
255 | 210 | ||||||
| Total liabilities and equity |
$ | 4,270 | $ | 3,432 | ||||
| PERFORMANCE RATIOS |
||||||||
| Return on average capital |
47 | % | 75 | % | ||||
| Noninterest income to total revenue |
77 | 78 | ||||||
| Efficiency |
65 | 57 | ||||||
| OTHER INFORMATION |
||||||||
| Total net charge-offs |
2 | 1 | ||||||
| Full-time employees |
1,836 | 1,782 | ||||||
| ASSETS UNDER ADMINISTRATION (in billions) (a) (b) |
||||||||
| Assets under management |
||||||||
| Personal |
$ | 38 | $ | 49 | ||||
| Institutional |
19 | 20 | ||||||
| Total |
$ | 57 | $ | 69 | ||||
| Asset Type |
||||||||
| Equity |
$ | 26 | $ | 40 | ||||
| Fixed Income |
19 | 17 | ||||||
| Liquidity/Other |
12 | 12 | ||||||
| Total |
$ | 57 | $ | 69 | ||||
| Nondiscretionary assets under administration |
||||||||
| Personal |
$ | 23 | $ | 30 | ||||
| Institutional |
64 | 82 | ||||||
| Total |
$ | 87 | $ | 112 | ||||
| Asset Type |
||||||||
| Equity |
$ | 34 | $ | 49 | ||||
| Fixed Income |
19 | 27 | ||||||
| Liquidity/Other |
34 | 36 | ||||||
| Total |
$ | 87 | $ | 112 | ||||
| (a) | As of December 31. |
| (b) | Excludes brokerage account assets. |
34
Asset Management Groups earnings were $119 million for 2008 compared with $158 million for 2007. A decline in noninterest income and an increase in noninterest expense drove the lower earnings for 2008 in the comparison.
Assets under management of $57 billion at December 31, 2008 decreased $12 billion compared with the balance at December 31, 2007. The decline in assets under management was primarily due to comparatively lower equity markets partially offset by the Sterling acquisition and positive net inflows. New business sales efforts and new client acquisition and growth were ahead of our expectations.
Nondiscretionary assets under administration of $87 billion at December 31, 2008 decreased $25 billion compared with the balance at December 31, 2007. This decline was primarily driven by comparatively lower equity markets and net outflows resulting from the reduction in several significant relationships.
Total revenue for 2008 was $559 million compared with $594 million for 2007. Net interest income decreased slightly, to $130 million, while noninterest income declined $32 million primarily due to lower asset management fees that reflected the lower assets under management discussed above.
Noninterest expense totaled $363 million for 2008 compared with $339 million for 2007. The year-over-year increase in expenses was primarily due to the full-year impact in 2008 acquisitions.
BLACKROCK
Our BlackRock business segment earned $207 million in 2008 and $253 million in 2007. These results reflect our approximately 33% share of BlackRocks reported GAAP earnings and the additional income taxes on these earnings incurred by PNC.
PNCs investment in BlackRock was $4.2 billion at December 31, 2008 and $4.1 billion at December 31, 2007. The book value per share was $98.32 at December 31, 2008.
BLACKROCK LTIP PROGRAMS AND EXCHANGE AGREEMENTS
BlackRock adopted the 2002 LTIP program to help attract and retain qualified professionals. At that time, PNC agreed to transfer up to four million of the shares of BlackRock common stock then held by us to help fund the 2002 LTIP and future programs approved by BlackRocks board of directors, subject to certain conditions and limitations. Prior to 2006, BlackRock granted awards of approximately $233 million under the 2002 LTIP program, of which approximately $208 million were paid on January 30, 2007. The award payments were funded by 17% in cash from BlackRock and approximately one million shares of BlackRock common stock transferred by PNC and distributed to LTIP participants. We recognized a pretax gain of $82 million in the first quarter of 2007 from the transfer of BlackRock shares. The gain was included in other noninterest income and reflected the excess of market value over book value of the one million shares transferred in January 2007. Additional BlackRock shares were distributed to LTIP participants during the first quarter of 2008, resulting in a $3 million pretax gain in other noninterest income, and during January 2009, resulting in a $1 million pretax gain.
BlackRock granted awards in 2007 under an additional LTIP program, all of which are subject to achieving earnings performance goals prior to the vesting date of September 29, 2011. Of the shares of BlackRock common stock that we have agreed to transfer to fund their LTIP programs, approximately 1.6 million shares have been committed to fund the awards vesting in 2011 and the amount remaining would then be available for future awards.
PNCs noninterest income for 2008 included a $243 million pretax gain related to our commitment to fund additional BlackRock LTIP programs. This gain represented the mark-to-market adjustment related to our remaining BlackRock LTIP common shares obligation as of December 31, 2008 and resulted from the decrease in the market value of BlackRock common shares for 2008. PNCs noninterest income for 2007 included a pretax charge of $209 million for an increase in the market value of BlackRock common shares for that period.
As further described in PNCs Current Report on Form 8-K filed December 30, 2008, PNC entered into an Exchange Agreement with BlackRock on December 26, 2008. The transactions contemplated by this agreement will restructure PNCs ownership of BlackRock equity without altering, to any meaningful extent, PNCs economic interest in BlackRock. PNC will continue to be subject to the limitations on its voting rights in its existing agreements with BlackRock. These transactions will also allow PNC to reduce its net income volatility associated with the quarterly marking-to-market of obligations related to PNCs delivery of BlackRock stock under the BlackRock LTIP.
Also on December 26, 2008, BlackRock entered into an Exchange Agreement with Merrill Lynch in anticipation of the consummation of the merger of Bank of America Corporation and Merrill Lynch which was completed on January 1, 2009. The PNC and Merrill
35
Lynch Exchange Agreements restructured PNCs and Merrill Lynchs respective ownership of BlackRock common and preferred equity. The exchange was completed on February 27, 2009.
PNC will continue to account for its investment in BlackRock under the equity method of accounting, with its share of BlackRocks earnings reduced from approximately 33% to 31%, solely as a result of the exchange of 2.9 million of its shares of BlackRock common stock for new BlackRock Series C Preferred Stock. The Series C Preferred Stock will not be taken into consideration in determining PNCs share of BlackRock earnings under the equity method. PNCs percentage ownership of BlackRock common stock is expected to increase from approximately 36.5% to 46.5%. The increase will result from a substantial exchange of Merrill Lynchs BlackRock common stock for BlackRock preferred stock. As a result of the BlackRock preferred stock currently held by Merrill Lynch and the new BlackRock preferred stock being issued to Merrill Lynch and PNC under the Exchange Agreements, PNCs share of BlackRock common stock has been, and will continue to be, higher than its overall share of BlackRocks equity and earnings.
On February 27, 2009, PNCs obligation to deliver BlackRock common shares was replaced with an obligation to deliver shares of BlackRocks new Series C Preferred Stock. PNC will account for these preferred shares at fair value as permitted under SFAS 159, which will offset the impact of marking-to-market the liability to deliver these shares to BlackRock.
The transactions related to the Exchange Agreements will not affect our right to receive dividends declared by BlackRock.
QUELLOS TRANSACTION
On October 1, 2007, BlackRock acquired the fund of funds business of Quellos Group, LLC (Quellos). The combined fund of funds platform operates under the name BlackRock Alternative Advisors and is one of the largest fund of funds platforms in the world. In connection with the acquisition, BlackRock paid $562 million in cash to Quellos and placed 1.2 million shares of BlackRock common stock into an escrow account. The shares of BlackRock common stock will be held in the escrow account for up to three years and will be available to satisfy certain indemnification obligations of Quellos under the asset purchase agreement. In April 2008, 280,519 common stock shares were released to Quellos in accordance with the Quellos asset purchase agreement, which resulted in an adjustment to the recognized purchase price. In addition, Quellos may be entitled to receive two contingent payments upon achieving certain investment advisory base and performance fee measures through December 31, 2010, totaling up to an additional $969 million in a combination of cash and stock.
36
GLOBAL INVESTMENT SERVICING
| Year ended December 31 Dollars in millions except as noted |
2008 | 2007 | ||||||
| INCOME STATEMENT |
||||||||
| Servicing revenue (a) |
$ | 947 | $ | 863 | ||||
| Operating expense (a) |
728 | 637 | ||||||
| Operating income |
219 | 226 | ||||||
| Debt financing |
34 | 38 | ||||||
| Nonoperating income (b) |
3 | 6 | ||||||
| Pretax earnings |
188 | 194 | ||||||
| Income taxes |
66 | 66 | ||||||
| Earnings |
$ | 122 | $ | 128 | ||||
| PERIOD-END BALANCE SHEET |
||||||||
| Goodwill and other intangible assets |
$ | 1,301 | $ | 1,315 | ||||
| Other assets |
3,977 | 1,161 | ||||||
| Total assets |
$ | 5,278 | $ | 2,476 | ||||
| Debt financing |
$ | 850 | $ | 989 | ||||
| Other liabilities |
3,737 | 865 | ||||||
| Shareholders equity |
691 | 622 | ||||||
| Total funds |
$ | 5,278 | $ | 2,476 | ||||
| PERFORMANCE RATIOS |
||||||||
| Return on average equity |
18 | % | 23 | % | ||||
| Operating margin (c) |
23 | 26 | ||||||
| SERVICING STATISTICS (at December 31) |
||||||||
| Accounting/administration net fund assets (in billions) (d) |
||||||||
| Domestic |
$ | 764 | $ | 869 | ||||
| Offshore |
75 | 121 | ||||||
| Total |
$ | 839 | $ | 990 | ||||
| Asset type (in billions) |
||||||||
| Money market |
$ | 431 | $ | 373 | ||||
| Equity |
227 | 390 | ||||||
| Fixed income |
103 | 123 | ||||||
| Other |
78 | 104 | ||||||
| Total |
$ | 839 | $ | 990 | ||||
| Custody fund assets (in billions) |
$ | 379 | $ | 500 | ||||
| Shareholder accounts (in millions) |
||||||||
| Transfer agency |
14 | 19 | ||||||
| Subaccounting |
58 | 53 | ||||||
| Total |
72 | 72 | ||||||
| OTHER INFORMATION |
||||||||
| Full-time employees (at December 31) |
4,934 | 4,784 | ||||||
| (a) | Certain out-of-pocket expense items which are then client billable are included in both servicing revenue and operating expense above, but offset each other entirely and therefore have no effect on operating income. Distribution revenue and expenses which relate to 12b-1 fees that are received from certain fund clients for payment of marketing, sales and service expenses also entirely offset each other, but are netted for presentation purposes above. |
| (b) | Net of nonoperating expense. |
| (c) | Total operating income divided by total servicing revenue. |
| (d) | Includes alternative investment net assets serviced. |
Global Investment Servicing earned $122 million for 2008 and $128 million for 2007. Results for 2008 were negatively impacted by declines in asset values and fund redemptions as a result of severe deterioration of the financial markets during the fourth quarter.
Highlights of Global Investment Servicings performance for 2008 included:
| | Initiatives in the offshore arena resulted in a 13% increase in offshore servicing revenue. This included the start up of a new servicing location in Poland which employed 69 individuals at year end. Assets serviced, however, decreased by 38% as a direct result of the unsettled global equity markets and the resultant high redemption activity in the latter part of the year. |
37
| | Subaccounting shareholder accounts rose by 5 million, or 9%, to 58 million, as existing clients continued to convert additional fund families to this platform. Global Investment Servicing remains a leading provider of subaccounting services. A prominent new client was won during 2008 due to the combined subaccounting services and wealth reporting capabilities that Global Investment Servicing can now provide as a result of its acquisition of Albridge Solutions in December 2007. |
| | Total accounting/administration funds serviced increased 7% over the prior year. However, assets serviced decreased 15% due to declines in asset values and fund outflows resulting from market conditions, primarily in the fourth quarter of 2008. |
Servicing revenue for 2008 reached $947 million, an increase of $84 million, or 10%, over 2007. This increase resulted primarily from the acquisitions of Albridge Solutions and Coates Analytics, LP in December 2007, growth in offshore operations, and increased securities lending activities afforded by the volatility in the markets.
Operating expense increased $91 million, or 14%, to $728 million, in 2008 compared with 2007. Investments in technology, a larger employee base to support business growth, and costs related to the acquisitions made in December 2007 drove the higher expense level.
Debt financing costs and nonoperating income were both lower than prior year levels due to the much lower interest rate environment and principal payments on debt during the year.
Global Investment Servicings balance sheet was also impacted by the market turmoil at year end as clients chose to leave cash balances uninvested.
Total assets serviced by Global Investment Servicing totaled $2.0 trillion at December 31, 2008 compared with $2.5 trillion at December 31, 2007. The decline in assets serviced was a direct result of global market declines.
CRITICAL ACCOUNTING
ESTIMATES AND JUDGMENTS
Our consolidated financial statements are prepared by applying certain accounting policies. Note 1 Accounting Policies in the Notes To Consolidated Financial Statements in this Exhibit 99.1 describes the most significant accounting policies that we use. Certain of these policies require us to make estimates and strategic or economic assumptions that may prove inaccurate or be subject to variations that may significantly affect our reported results and financial position for the period or in future periods.
Fair Value Measurements
We must use estimates, assumptions, and judgments when assets and liabilities are required to be recorded at, or adjusted to reflect, fair value. This includes the initial measurement at fair value of the assets acquired and liabilities assumed in acquisitions qualifying as business combinations under SFAS 141 or SFAS 141(R), Business Combinations. The valuation of both financial and nonfinancial assets and liabilities in these transactions require numerous assumptions and estimates and the use of third-party sources including appraisers and valuation specialists.
Assets and liabilities carried at fair value inherently result in a higher degree of financial statement volatility. Assets and liabilities measured at fair value on a recurring basis, including those elected under SFAS 159, include available for sale and trading securities, financial derivatives, certain commercial and residential mortgage loans held for sale, customer resale agreements, private equity investments, and residential mortgage servicing rights. Fair values and the information used to record valuation adjustments for certain assets and liabilities are based on either quoted market prices or are provided by other independent third-party sources, when available. When such third-party information is not available, we estimate fair value primarily by using cash flow and other financial modeling techniques. Changes in underlying factors, assumptions, or estimates in any of these areas could materially impact our future financial condition and results of operations.
Effective January 1, 2008, PNC adopted SFAS 157. SFAS 157 defines fair value as the price that would be received to sell a financial asset or paid to transfer a financial liability in an orderly transaction between market participants at the measurement date. SFAS 157 established a three level hierarchy for disclosure of assets and liabilities recorded at fair value. The classification of assets and liabilities within the hierarchy is based on whether the inputs to the valuation methodology used in the measurement are observable or unobservable.
The following sections of this Exhibit 99.1 provide further information on this type of activity:
| | Fair Value Measurements and Fair Value Option in this MD&A, and |
| | Note 8 Fair Value included in the Notes To Consolidated Financial Statements of this Exhibit 99.1. |
Allowances For Loan And Lease Losses And Unfunded Loan Commitments And Letters Of Credit
We maintain allowances for loan and lease losses and unfunded loan commitments and letters of credit at levels that we believe to be adequate to absorb estimated probable credit losses inherent in the loan portfolio. We determine the adequacy of the allowances based
38
on periodic evaluations of the loan and lease portfolios and other relevant factors. However, this evaluation is inherently subjective as it requires material estimates, all of which may be susceptible to significant change, including, among others:
| | Probability of default, |
| | Loss given default, |
| | Exposure at date of default, |
| | Amounts and timing of expected future cash flows on impaired loans, |
| | Value of collateral, |
| | Historical loss exposure, and |
| | Amounts for changes in economic conditions that may not be reflected in historical results. |
In determining the adequacy of the allowance for loan and lease losses, we make specific allocations to impaired loans, allocations to pools of watchlist and non-watchlist loans, and allocations to consumer and residential mortgage loans. We also allocate reserves to provide coverage for probable losses not covered in specific, pool and consumer reserve methodologies related to qualitative factors. While allocations are made to specific loans and pools of loans, the total reserve is available for all credit losses.
Commercial lending is the largest category of credits and is the most sensitive to changes in assumptions and judgments underlying the determination of the allowance for loan and lease losses. We have allocated approximately $2.6 billion, or 67%, of the allowance for loan and lease losses at December 31, 2008 to the commercial lending category. Consumer and residential mortgage loan allocations are made at a total portfolio level based on historical loss experience adjusted for portfolio activity. Approximately $1.2 billion, or 32%, of the allowance for loan and lease losses at December 31, 2008 have been allocated to these consumer lending categories. The remainder of the allowance is allocated to the other loans category.
To the extent actual outcomes differ from our estimates, additional provision for credit losses may be required that would reduce future earnings. See the following for additional information:
| | Allowances For Loan And Lease Losses And Unfunded Loan Commitments And Letters Of Credit in the Credit Risk Management section of this MD&A (which includes an illustration of the estimated impact on the aggregate of the allowance for loan and lease losses and allowance for unfunded loan commitments and letters of credit assuming we increased pool reserve loss rates for certain loan categories), and |
| | Note 5 Asset Quality in the Notes To Consolidated Financial Statements of this Exhibit 99.1 and Allocation of Allowance for Loan and Lease Losses in the Statistical Information (Unaudited) section in Item 8 of our 2008 Form 10-K. |
Estimated Cash Flows on Impaired Loans
AICPA Statement of Position 03-3, Accounting for Certain Loans or Debt Securities Acquired in a Transfer (SOP 03-3) provides guidance for accounting for certain loans that have experienced a deterioration of credit quality at the time of acquisition for which it is probable that the investor will be unable to collect all contractually required payments. The application of this guidance requires a two-step process: the determination of which loans qualify due to credit quality deterioration and the determination of fair value and undiscounted expected cash flows for the loans that are in the scope of SOP 03-3. SOP 03-3 prohibits carrying over or creation of an allowance for loan losses in the initial accounting of all loans in scope.
In our assessment of credit quality deterioration, we must make numerous assumptions, interpretations and judgments, based on internal and third-party credit quality information and ultimately determine whether we believe it is probable that we will not be able to collect all amounts due, including both principal and interest, according to the contractual terms of the loans. This is a point in time assessment and inherently subjective due to the nature of the available information and judgment involved.
For those loans that qualify under SOP 03-3, the valuation process involves estimating the fair value of each loan at acquisition and determining the undiscounted expected cash flows to be realized from the loan both at acquisition and periodically throughout the life of the loan. Measurement of the fair value of the loan is based on the provisions of SFAS 157 as discussed above.
The measurement of undiscounted expected cash flows involves assumptions and judgments as to credit risk, interest rate risk, prepayment risk, default rates, loss severity, payment speeds and collateral values. All of these factors are inherently subjective and can result in significant changes in the cash flow estimates over the life of the loan. Such changes increase future earnings volatility due to increases or decreases in the accretable yield (i.e., difference between the undiscounted expected cash flows and the fair value) recognized on the loan or the requirement to record a provision for credit losses if the decline in expected cash flows is attributable to a decline in credit quality.
39
Goodwill
Goodwill arising from business acquisitions represents the value attributable to unidentifiable intangible elements in the business acquired. Most of our goodwill relates to value inherent in the Retail Banking, Corporate & Institutional Banking and Global Investment Servicing businesses. The value of this goodwill is dependent upon our ability to provide quality, cost effective services in the face of competition from other market participants on a national and international basis. We also rely upon continuing investments in processing systems, the development of value-added service features, and the ease of access by customers to our services.
As such, the value of goodwill is ultimately supported by earnings, which is driven by transaction volume and, for certain businesses, the market value of assets under administration or for which processing services are provided. Lower earnings resulting from a lack of growth or our inability to deliver cost-effective services over sustained periods can lead to impairment of goodwill, which could result in a current period charge to earnings. At least annually, management reviews the current operating environment and strategic direction of each reporting unit taking into consideration any events or changes in circumstances that may have an effect on the unit. A reporting unit is defined as an operating segment or one level below an operating segment. This input is then used to calculate the fair value of the reporting unit, including goodwill, which is compared to its carrying value. If the fair value of the reporting unit exceeds its carrying amount, then the goodwill of that reporting unit is not considered impaired. During the fourth quarter 2008, and the first quarter of 2009, PNC considered whether the decline in the fair value of our market capitalization due to market conditions is an indicator of declines in the fair value of the reporting units. Although the fair values of the reporting units decreased, their estimated fair values are still considered to be in excess of their respective carrying values. Based on the results of our analysis, there have been no impairment charges related to goodwill. See Note 9 Goodwill and Other Intangible Assets in the Notes To Consolidated Financial Statements in this Exhibit 99.1 for additional information.
Lease Residuals
We provide financing for various types of equipment, aircraft, energy and power systems, and rolling stock through a variety of lease arrangements. Direct financing leases are carried at the sum of lease payments and the estimated residual value of the leased property, less unearned income. Residual value insurance or guarantees by governmental entities provide support for a significant portion of the residual value. Residual values are subject to judgments as to the value of the underlying equipment that can be affected by changes in economic and market conditions and the financial viability of the residual guarantors and insurers. To the extent not guaranteed or assumed by a third party, or otherwise insured against, we bear the risk of ownership of the leased assets. This includes the risk that the actual value of the leased assets at the end of the lease term will be less than the residual value, which could result in an impairment charge and reduce earnings in the future. Residual values are reviewed for impairment on a quarterly basis.
Revenue Recognition
We derive net interest and noninterest income from various sources, including:
| | Lending, |
| | Securities portfolio, |
| | Asset management and fund servicing, |
| | Customer deposits, |
| | Loan servicing, |
| | Brokerage services, |
| | Merger and acquisition advisory services, |
| | Sale of loans and securities, |
| | Certain private equity activities, and |
| | Securities and derivatives trading activities including foreign exchange. |
We also earn fees and commissions from issuing loan commitments, standby letters of credit and financial guarantees, selling various insurance products, providing treasury management services and participating in certain capital markets transactions. Revenue earned on interest-earning assets including the accretion of fair value adjustments on discounts for purchased loans is recognized based on the effective yield of the financial instrument.
The timing and amount of revenue that we recognize in any period is dependent on estimates, judgments, assumptions, and interpretation of contractual terms. Changes in these factors can have a significant impact on revenue recognized in any period due to changes in products, market conditions or industry norms.
Income Taxes
In the normal course of business, we and our subsidiaries enter into transactions for which the tax treatment is unclear or subject to varying interpretations. In addition, filing requirements, methods of filing and the calculation of taxable income in various state and local jurisdictions are subject to differing interpretations.
40
We evaluate and assess the relative risks and merits of the appropriate tax treatment of transactions, filing positions, filing methods and taxable income calculations after considering statutes, regulations, judicial precedent, and other information, and maintain tax accruals consistent with our evaluation of these relative risks and merits. The result of our evaluation and assessment is by its nature an estimate. We and our subsidiaries are routinely subject to audit and challenges from taxing authorities. In the event we resolve a challenge for an amount different than amounts previously accrued, we will account for the difference in the period in which we resolve the matter.
RECENT ACCOUNTING
PRONOUNCEMENTS
See Note 1 Accounting Policies in the Notes To Consolidated Financial Statements in this Exhibit 99.1 for additional information on the following recent accounting pronouncements that are relevant to our business, including a description of each new pronouncement, the required date of adoption, our planned date of adoption, and the expected impact on our consolidated financial statements.
The following were issued in 2008:
| | FASB Staff Position No. (FSP) EITF 99-20-1, Amendments to the Impairment Guidance of EITF Issue No. 99-20 |
| | FSP FAS 132(R)-1, Employers Disclosures about Postretirement Benefit Plan Assets |
| | FSP FAS 140-4 and FIN 46(R)-8, Disclosures by Public Entities (Enterprises) about Transfers of Financial Assets and Interests in Variable Interest Entities |
| | FSP FAS 157-3, Determining the Fair Value of a Financial Asset When the Market for That Asset Is Not Active |
| | FSP FAS 133-1 and FIN 45-4, Disclosures about Credit Derivatives and Certain Guarantees: An Amendment of FASB Statement No. 133 and FASB Interpretation No. 45; and Clarification of the Effective Date of FASB Statement No. 161 |
| | FSP EITF 03-6-1, Determining Whether Instruments Granted in Share-Based Payment Transactions Are Participating Securities |
| | FSP APB 14-1, Accounting for Convertible Debt Instruments That May Be Settled in Cash Upon Conversion (Including Partial Cash Settlement) |
| | SFAS 163, Accounting for Financial Guarantee Insurance Contracts an Interpretation of FASB Statement No. 60 |
| | SFAS 162, The Hierarchy of Generally Accepted Accounting Principles |
| | FSP FAS 142-3, Determination of the Useful Life of Intangible Assets |
| | SFAS 161, Disclosures about Derivative Instruments and Hedging Activities |
| | FSP FAS 140-3, Accounting for Transfers of Financial Assets and Repurchase Financing Transactions |
The following were issued in 2007:
| | SFAS 141(R), Business Combinations |
| | SFAS 160, Accounting and Reporting of Noncontrolling Interests in Consolidated Financial Statements, an Amendment of ARB No. 51 |
| | SEC Staff Accounting Bulletin No. 109 |
| | FIN 46(R) 7, Application of FASB Interpretation No. 46(R) to Investment Companies |
| | FSP FIN 48-1, Definition of Settlement in FASB Interpretation (FIN) No. 48 |
| | SFAS 159 |
The following were issued in 2006 with an effective date in 2008:
| | SFAS 157 |
| | The Emerging Issues Task Force (EITF) of the FASB issued EITF Issue 06-4, Accounting for Deferred Compensation and Postretirement Benefit Aspects of Endorsement Split-Dollar Life Insurance Arrangements |
41
STATUS OF DEFINED BENEFIT PENSION PLAN
We have a noncontributory, qualified defined benefit pension plan (plan or pension plan) covering eligible employees. Benefits are derived from a cash balance formula based on compensation levels, age and length of service. Pension contributions are based on an actuarially determined amount necessary to fund total benefits payable to plan participants. Consistent with our investment strategy, plan assets are primarily invested in equity investments and fixed income instruments. Plan fiduciaries determine and review the plans investment policy.
We calculate the expense associated with the pension plan in accordance with SFAS 87, Employers Accounting for Pensions, and we use assumptions and methods that are compatible with the requirements of SFAS 87, including a policy of reflecting trust assets at their fair market value. On an annual basis, we review the actuarial assumptions related to the pension plan, including the discount rate, the rate of compensation increase and the expected return on plan assets.
The discount rate and compensation increase assumptions do not significantly affect pension expense. However, the expected long-term return on assets assumption does significantly affect pension expense. The expected long-term return on plan assets for determining net periodic pension cost for 2008 was 8.25%, unchanged from 2007. Under current accounting rules, the difference between expected long-term returns and actual returns is accumulated and amortized to pension expense over future periods. Each one percentage point difference in actual return compared with our expected return causes expense in subsequent years to change by up to $7 million as the impact is amortized into results of operations.
The table below reflects the estimated effects on pension expense of certain changes in annual assumptions, using 2009 estimated expense as a baseline.
| Change in Assumption | Estimated (In millions) |
|||
| .5% decrease in discount rate |
(a | ) | ||
| .5% decrease in expected long-term return on assets |
$ | 16 | ||
| .5% increase in compensation rate |
$ | 2 | ||
| (a) | De minimis. |
We currently estimate a pretax pension expense of $124 million in 2009 compared with a pretax benefit of $32 million in 2008. The 2009 values and sensitivities shown above include the qualified defined benefit plan maintained by National City that we merged into the PNC plan as of December 31, 2008. The expected increase in pension cost is attributable not only to the National City acquisition, but also to the significant variance between 2008 actual investment returns and long-term expected returns.
Our pension plan contribution requirements are not particularly sensitive to actuarial assumptions. Investment performance has the most impact on contribution requirements and will drive the amount of permitted contributions in future years. Also, current law, including the provisions of the Pension Protection Act of 2006, sets limits as to both minimum and maximum contributions to the plan. We expect that the minimum required contributions under the law will be zero for 2009.
We maintain other defined benefit plans that have a less significant effect on financial results, including various nonqualified supplemental retirement plans for certain employees. See Note 15 Employee Benefit Plans in the Notes To Consolidated Financial Statements in this Exhibit 99.1 for additional information.
RISK MANAGEMENT
We encounter risk as part of the normal course of our business and we design risk management processes to help manage these risks. This Risk Management section first provides an overview of the risk measurement, control strategies, and monitoring aspects of our corporate-level risk management processes. Following that discussion is an analysis of the risk management process for what we view as our primary areas of risk: credit, operational, liquidity, and market. The discussion of market risk is further subdivided into interest rate, trading, and equity and other investment risk areas. Our use of financial derivatives as part of our overall asset and liability risk management process is also addressed within the Risk Management section of this MD&A. In appropriate places within this section, historical performance is also addressed.
42
OVERVIEW
As a financial services organization, we take a certain amount of risk in every business decision. For example, every time we open an account or approve a loan for a customer, process a payment, hire a new employee, or implement a new computer system, we incur a certain amount of risk. As an organization, we must balance revenue generation and profitability with the risks associated with our business activities. Risk management is not about eliminating risks, but about identifying and accepting risks and then effectively managing them so as to optimize shareholder value.
The key to effective risk management is to be proactive in identifying, measuring, evaluating, and monitoring risk on an ongoing basis. Risk management practices support decision-making, improve the success rate for new initiatives, and strengthen the markets confidence in an organization.
We manage risk toward an overall moderate risk profile. The current economic environment, combined with our acquisition of National City, has increased our risk profile above that desired level. We remain committed to a moderate risk profile and are working to return to that level of overall risk.
CORPORATE-LEVEL RISK MANAGEMENT OVERVIEW
We support risk management through a governance structure involving the Board, senior management and a corporate risk management organization.
Although our Board as a whole is responsible generally for oversight of risk management, committees of the Board provide oversight to specific areas of risk with respect to the level of risk and risk management structure.
We use management level risk committees to help ensure that business decisions are executed within our desired risk profile. The Executive Committee (EC), consisting of senior management executives, provides oversight for the establishment and implementation of new comprehensive risk management initiatives, reviews enterprise level risk profiles and discusses key risk issues.
The corporate risk management organization has the following key roles:
| | Facilitate the identification, assessment and monitoring of risk across PNC, |
| | Provide support and oversight to the businesses, and |
| | Identify and implement risk management best practices, as appropriate. |
Risk Measurement
We conduct risk measurement activities specific to each area of risk. The primary vehicle for aggregation of enterprise-wide risk is a comprehensive risk management methodology that is based on economic capital. This primary risk aggregation measure is supplemented with secondary measures of risk to arrive at an estimate of enterprise-wide risk. The economic capital framework is a measure of potential losses above and beyond expected losses. Potential one year losses are capitalized to a level commensurate with a financial institution with an A rating by the credit rating agencies. Economic capital incorporates risk associated with potential credit losses (Credit Risk), fluctuations of the estimated market value of financial instruments (Market Risk), failure of people, processes or systems (Operational Risk), and income losses associated with declining volumes, margins and/or fees, and the fixed cost structure of the business (Business Risk). We estimate credit and market risks at an exposure level while we estimate the remaining risk types at an institution or business segment level. We routinely compare the output of our economic capital model with industry benchmarks.
Risk Control Strategies
We centrally manage policy development and exception oversight through corporate-level risk management. Corporate risk management is authorized to take action to either prevent or mitigate exceptions to policies and is responsible for monitoring compliance with risk management policies. The Corporate Audit function performs an independent assessment of the internal control environment. Corporate Audit plays a critical role in risk management, testing the operation of the internal control system and reporting findings to management and to the Audit Committee of the Board.
Risk Monitoring
Corporate risk management reports on a regular basis to our Board regarding the enterprise risk profile of the Corporation. These reports aggregate and present the level of risk by type of risk and communicate significant risk issues, including performance relative to risk tolerance limits. Both the Board and the EC provide guidance on actions to address key risk issues as identified in these reports.
CREDIT RISK MANAGEMENT
Credit risk represents the possibility that a customer, counterparty or issuer may not perform in accordance with contractual terms. Credit risk is inherent in the financial services business and results from extending credit to customers, purchasing securities, and entering into financial derivative transactions and certain guarantee contracts. Credit risk is one of our most significant risks.
43
Approved risk tolerances, in addition to credit policies and procedures, set portfolio objectives for the level of credit risk. We have established guidelines for problem loans, acceptable levels of total borrower exposure, and other credit measures. We seek to achieve our credit portfolio objectives by maintaining a customer base that is diverse in borrower exposure and industry types. We use loan participations with third parties, loan sales and syndications, and the purchase of credit derivatives to reduce risk concentrations.
The credit granting businesses maintain direct responsibility for monitoring credit risk within PNC. The Corporate Credit Policy area provides independent oversight to the measurement, monitoring and reporting of our credit risk and reports to the Chief Administrative Officer. Corporate Audit also provides an independent assessment of the effectiveness of the credit risk management process.
Nonperforming, Past Due And Potential Problem Assets
See the Nonperforming Assets And Related Information table in the Statistical Information (Unaudited) section of Item 8 of our 2008 Form 10-K for details of the types of nonperforming assets that we held at December 31 of each of the past five years. In addition, certain performing assets have interest payments that are past due or have the potential for future repayment problems.
Credit quality migration reflected a rapidly weakening economy during 2008, but remained manageable as we were able to maintain a strong capital position and generate positive operating leverage. We remained focused on returning to a moderate risk profile.
Nonperforming Assets by Type
| In millions | Dec. 31 2008 (a) |
Dec. 31 2007 |
||||
| Nonaccrual loans |
||||||
| Commercial |
||||||
| Retail/wholesale |
$ | 88 | $ | 39 | ||
| Manufacturing |
141 | 35 | ||||
| Other service providers |
114 | 48 | ||||
| Real estate related (b) |
151 | 45 | ||||
| Financial services |
23 | 15 | ||||
| Health care |
37 | 4 | ||||
| Other |
22 | 7 | ||||
| Total commercial |
576 | 193 | ||||
| Commercial real estate |
||||||
| Real estate projects |
659 | 184 | ||||
| Commercial mortgage |
107 | 28 | ||||
| Total commercial real estate |
766 | 212 | ||||
| Equipment lease financing |
97 | 3 | ||||
| TOTAL COMMERCIAL LENDING |
1,439 | 408 | ||||
| Consumer |
||||||
| Home equity |
66 | 16 | ||||
| Other |
4 | 1 | ||||
| Total consumer |
70 | 17 | ||||
| Residential real estate |
||||||
| Residential mortgage (c) |
139 | 26 | ||||
| Residential construction |
14 | 1 | ||||
| Total residential real estate (c) |
153 | 27 | ||||
| TOTAL CONSUMER LENDING (c) |
223 | 44 | ||||
| Total nonaccrual loans (c) |
1,662 | 452 | ||||
| Restructured loans |
2 | |||||
| Total nonperforming loans (c) |
1,662 | 454 | ||||
| Foreclosed and other assets |
||||||
| Commercial lending |
34 | 23 | ||||
| Consumer |
11 | 8 | ||||
| Residential real estate |
458 | 10 | ||||
| Total foreclosed and other assets |
503 | 41 | ||||
| Total nonperforming assets (c)(d)(e) |
$ | 2,165 | $ | 495 | ||
| (a) | Amounts at December 31, 2008 include $722 million of nonperforming assets related to National City. Nonperforming assets of National City are comprised of $250 million of nonperforming loans, including $154 million related to commercial lending and $96 million related to consumer lending, and $472 million of foreclosed and other assets. |
| (b) | Includes loans related to customers in the real estate and construction industries. |
| (c) | We have adjusted the December 31, 2007 amounts to be consistent with the current methodology for recognizing nonaccrual residential mortgage loans serviced under master servicing arrangements. |
| (d) | Excludes equity management assets carried at estimated fair value of $42 million at December 31, 2008 and $4 million at December 31, 2007. |
| (e) | Excludes loans held for sale carried at lower of cost or market value of $78 million at December 31, 2008 (amount includes troubled debt restructured assets of $5 million) and $25 million at December 31, 2007. |
44
Nonperforming loans at December 31, 2008 included $537 million related to the distressed loan portfolio, of which $103 million were attributable to National City. Details of these nonperforming loans follow.
Nonperforming Loans - Distressed Loan Portfolio
| In millions | Dec. 31, 2008 | ||
| Commercial real estate real estate projects |
$ | 445 | |
| Consumer home equity |
29 | ||
| Residential real estate |
|||
| Residential mortgage |
50 | ||
| Residential construction |
13 | ||
| Total residential real estate |
63 | ||
| Total nonperforming loans distressed portfolio |
$ | 537 | |
Change In Nonperforming Assets
| In millions | 2008 | 2007 | ||||||
| January 1 |
$ | 495 | $ | 184 | ||||
| National City acquisition |
722 | |||||||
| Other acquisitions (a) |
9 | 37 | ||||||
| Transferred from accrual |
1,981 | 653 | ||||||
| Charge-offs and valuation adjustments |
(491 | ) | (167 | ) | ||||
| Principal activity including payoffs |
(381 | ) | (179 | ) | ||||
| Returned to performing |
(127 | ) | (23 | ) | ||||
| Asset sales |
(43 | ) | (10 | ) | ||||
| December 31 |
$ | 2,165 | $ | 495 | ||||
| (a) | Sterling in 2008; Mercantile and Yardville in 2007. |
Total nonperforming assets at December 31, 2008 increased $1.670 billion, to $2.165 billion, from the balance at December 31, 2007. Our nonperforming assets represented .74% of total assets at December 31, 2008 compared with ..36% at December 31, 2007. The increase in nonperforming assets reflected higher nonaccrual residential real estate development loans and loans in related sectors, and the addition of $722 million of nonperforming assets related to National City.
Nonperforming assets added with the National City acquisition exclude those loans that we impaired in accordance with SOP 03-3. We recorded such loans at estimated fair value and considered them to be performing, even if contractually past due (or if we do not expect to receive payment in full based on the original contractual terms), since certain purchase accounting adjustments will be accreted to interest income over time. The accretion will represent the discount associated with the difference between the expected cash flows and estimated fair value of the loans. This accounting treatment resulted in the return to performing status of $3.2 billion of loans previously classified as nonperforming by National City. The purchase accounting adjustments were estimated as of December 31, 2008 and such estimates may be refined during the first quarter of 2009.
At December 31, 2008, our largest nonperforming asset was approximately $36 million and our average nonperforming loan associated with commercial lending was less than $1 million.
The amount of nonperforming loans that was current as to principal and interest was $555 million at December 31, 2008 and $178 million at December 31, 2007.
45
Accruing Loans Past Due 90 Days Or More- Summary
| Dollars in millions | Amount | Percent of Total Outstandings |
||||||||||
| Dec. 31 2008 (a) |
Dec. 31 2007 |
Dec. 31 2008 (a) |
Dec. 31 2007 |
|||||||||
| Commercial |
$ | 97 | $ | 14 | .14 | % | .05 | % | ||||
| Commercial real estate |
723 | 18 | 2.81 | .20 | ||||||||
| Equipment lease financing |
2 | .03 | ||||||||||
| Consumer |
419 | 49 | .80 | .27 | ||||||||
| Residential real estate |
2,011 | 43 | 9.32 | .45 | ||||||||
| Other |
7 | 12 | .37 | 2.91 | ||||||||
| Total |
$ | 3,259 | $ | 136 | 1.86 | % | .20 | % | ||||
| (a) | Amounts include the impact of National City. |
Loans that are not included in nonperforming or past due categories but cause us to be uncertain about the borrowers ability to comply with existing repayment terms over the next six months totaled $745 million at December 31, 2008, compared with $134 million at December 31, 2007.
Allowances For Loan And Lease Losses And Unfunded Loan Commitments And Letters Of Credit
We maintain an allowance for loan and lease losses to absorb losses from the loan portfolio. We determine the allowance based on quarterly assessments of the probable estimated losses inherent in the loan portfolio. While we make allocations to specific loans and pools of loans, the total reserve is available for all loan and lease losses.
In addition to the allowance for loan and lease losses, we maintain an allowance for unfunded loan commitments and letters of credit. We report this allowance as a liability on our Consolidated Balance Sheet. We determine this amount using estimates of the probability of the ultimate funding and losses related to those credit exposures. This methodology is similar to the one we use for determining the adequacy of our allowance for loan and lease losses.
We refer you to Note 5 Asset Quality in the Notes To Consolidated Financial Statements in this Exhibit 99.1 regarding changes in the allowance for loan and lease losses and in the allowance for unfunded loan commitments and letters of credit. Also see the Allocation Of Allowance For Loan And Lease Losses table in the Statistical Information (Unaudited) section of Item 8 of our 2008 Form 10-K for additional information.
We establish specific allowances for loans considered impaired using a method prescribed by SFAS 114, Accounting by Creditors for Impairment of a Loan. All impaired loans except leases and large groups of smaller-balance homogeneous loans which may include but are not limited to credit card, residential mortgage, and consumer installment loans are subject to SFAS 114 analysis. Specific allowances for individual loans over a set dollar threshold are determined by our Special Asset Committee based on an analysis of the present value of expected future cash flows from the loans discounted at their effective interest rate, observable market price, or the fair value of the underlying collateral. We establish specific allowance on all other impaired loans based on the loss given default credit risk rating.
Allocations to non-impaired commercial and commercial real estate loans (pool reserve allocations) are assigned to pools of loans as defined by our business structure and are based on internal probability of default and loss given default credit risk ratings.
Key elements of the pool reserve methodology include:
| | Probability of default (PD), which is primarily based on historical default analyses and is derived from the borrowers internal PD credit risk rating; |
| | Exposure at default (EAD), which is derived from historical default data; and |
| | Loss given default (LGD), which is based on historical loss data, collateral value and other structural factors that may affect our ultimate ability to collect on the loan and is derived from the loans internal LGD credit risk rating. |
Our pool reserve methodology is sensitive to changes in key risk parameters such as PDs, LGDs and EADs. In general, a given change in any of the major risk parameters will have a corresponding change in the pool reserve allocations for non-impaired commercial loans. Our commercial loans are the largest category of credits and are most sensitive to changes in the key risk parameters and pool reserve loss rates. To illustrate, if we increase the pool reserve loss rates by 5% for all categories of non-impaired commercial loans, then the aggregate of the allowance for loan and lease losses and allowance for unfunded loan commitments and letters of credit would increase by $128 million. Additionally, other factors such as the rate of migration in the severity of problem loans will contribute to the final pool reserve allocations.
We make consumer (including residential mortgage) loan allocations at a total portfolio level by consumer product line based on historical loss experience. We compute a four-quarter average loss rate from net charge-offs for the prior four quarters as a percentage
46
of the average loans outstanding in those quarters. We apply this loss rate to loans outstanding at the end of the current period and make certain qualitative adjustments to determine the consumer loan allocation.
The provision for credit losses totaled $1.517 billion for 2008 compared with $315 million for 2007. Of the total 2008 provision, $990 million was recorded in the fourth quarter, including $504 million of additional provision recorded at December 31, 2008 to conform the National City loan reserving methodology with ours. The differences in methodology include granularity of loss computations, statistical and quantitative factors rather than qualitative assessment, and the extent of current appraisals and risk assessments.
In addition to the impact of National City, the higher provision in 2008 compared with the prior year was driven by general credit quality migration, including residential real estate development and commercial real estate exposure, an increase in net charge-offs, and growth in nonperforming loans. Growth in our total credit exposure also contributed to the higher provision amounts in both comparisons.
In addition, the provision for credit losses for 2008 and the evaluation of the allowances for loan and lease losses and unfunded loan commitments and letters of credit as of December 31, 2008 reflected loan and total credit exposure growth, changes in loan portfolio composition, and other changes in asset quality. The provision includes amounts for probable losses on loans and credit exposure related to unfunded loan commitments and letters of credit.
With a deteriorating economy, we expect credit migration will continue throughout 2009 as credit quality improvements will lag any economic turnaround.
The allowance as a percent of nonperforming loans was 236% and as a percent of total loans was 2.23% at December 31, 2008. The comparable percentages at December 31, 2007 were 183% and 1.21%. We expect to continue to increase our allowance as a percent of total loans as the market and our credit quality migration dictates.
Charge-Offs And Recoveries
| Year ended December 31 Dollars in millions |
Charge-offs | Recoveries | Net Charge-offs |
Percent of Average Loans |
||||||||
| 2008 |
||||||||||||
| Commercial |
$ | 301 | $ | 53 | $ | 248 | .80 | % | ||||
| Commercial real estate |
165 | 10 | 155 | 1.65 | ||||||||
| Equipment lease financing |
3 | 1 | 2 | .08 | ||||||||
| Consumer |
143 | 15 | 128 | .62 | ||||||||
| Residential real estate |
6 | 6 | .07 | |||||||||
| Total |
$ | 618 | $ | 79 | $ | 539 | .74 | |||||
| 2007 |
||||||||||||
| Commercial |
$ | 156 | $ | 30 | $ | 126 | .49 | % | ||||
| Commercial real estate |
16 | 1 | 15 | .20 | ||||||||
| Consumer |
73 | 14 | 59 | .33 | ||||||||
| Total |
$ | 245 | $ | 45 | $ | 200 | .32 | |||||
We establish reserves to provide coverage for probable losses not considered in the specific, pool and consumer reserve methodologies, such as, but not limited to, the following:
| | industry concentrations and conditions, |
| | credit quality trends, |
| | recent loss experience in particular sectors of the portfolio, |
| | ability and depth of lending management, |
| | changes in risk selection and underwriting standards, and |
| | timing of available information. |
The amount of reserves for these qualitative factors is assigned to loan categories and to business segments primarily based on the relative specific and pool allocation amounts. The amount of reserve allocated for qualitative factors represented 1.76% of the total allowance and .04% of total loans at December 31, 2008.
CREDIT DEFAULT SWAPS
From a credit risk management perspective, we buy and sell credit loss protection via the use of credit derivatives. When we buy loss protection by purchasing a credit default swap (CDS), we pay a fee to the seller, or CDS counterparty, in return for the right to receive a payment if a specified credit event occurs for a particular obligor or reference entity. We purchase CDSs to mitigate the risk of economic loss on a portion of our loan exposures.
47
We also sell loss protection to mitigate the net premium cost and the impact of fair value accounting on the CDS in cases where we buy protection to hedge the loan portfolio and for trading purposes. These activities represent additional risk positions rather than hedges of risk.
We approve counterparty credit lines for all of our trading activities, including CDSs. Counterparty credit lines are approved based on a review of credit quality in accordance with our traditional credit quality standards and credit policies. The credit risk of our counterparties is monitored in the normal course of business. In addition, all counterparty credit lines are subject to collateral thresholds and exposures above these thresholds are secured.
Credit default swaps are included in the Free-Standing Derivatives table in the Financial Derivatives section of this Risk Management discussion. Net gains from credit default swaps for proprietary trading positions, reflected in other noninterest income in our Consolidated Income Statement, totaled $45 million for 2008 and $38 million for 2007.
OPERATIONAL RISK MANAGEMENT
Operational risk is defined as the risk of financial loss or other damage to us resulting from inadequate or failed internal processes or systems, human factors, or from external events. Operational risk may occur in any of our business activities and manifests itself in various ways, including but not limited to the following:
| | Errors related to transaction processing and systems, |
| | Breaches of the system of internal controls and compliance requirements, and |
| | Business interruptions and execution of unauthorized transactions and fraud by employees or third parties. |
Operational losses may arise from legal actions due to operating deficiencies or noncompliance with contracts, laws or regulations.
To monitor and control operational risk, we maintain a comprehensive framework including policies and a system of internal controls that is designed to manage risk and to provide management with timely and accurate information about the operations of PNC. Management at each business unit is primarily responsible for its operational risk management program, given that operational risk management is integral to direct business management and most easily effected at the business unit level. Corporate Operational Risk Management oversees day-to-day operational risk management activities.
Technology Risk
The technology risk management program is a significant component of the operational risk framework. We have an integrated security and technology risk management framework designed to help ensure a secure, sound, and compliant infrastructure for information management. The technology risk management process is aligned with the strategic direction of the businesses and is integrated into the technology management culture, structure and practices. The application of this framework across the enterprise helps to support comprehensive and reliable internal controls.
Our business resiliency program manages the organizations capabilities to provide services in the case of an event that results in material disruption of business activities. Prioritization of investments in people, processes, technology and facilities is based on different types of events, business risk and criticality. Comprehensive testing validates our resiliency capabilities on an ongoing basis, and an integrated governance model is designed to help assure transparent management reporting.
Insurance
As a component of our risk management practices, we purchase insurance designed to protect us against accidental loss or losses which, in the aggregate, may significantly affect personnel, property, financial objectives, or our ability to continue to meet our responsibilities to our various stakeholder groups.
PNC, through subsidiary companies, Alpine Indemnity Limited and Advent Guaranty Corporation, provides insurance coverage for its general liability, automobile liability, management liability, fidelity, employment practices liability, special crime, workers compensation, property and terrorism programs. PNCs risks associated with its participation as an insurer for these programs are mitigated through policy limits and annual aggregate limits. Risks in excess of Alpine and Advent policy limits and annual aggregates are mitigated through the purchase of direct coverage provided by various insurers up to limits established by PNCs Corporate Insurance Committee.
LIQUIDITY RISK MANAGEMENT
Liquidity risk is the risk of potential loss if we were unable to meet our funding requirements at a reasonable cost. We manage liquidity risk to help ensure that we can obtain cost-effective funding to meet current and future obligations under both normal business as usual and stressful circumstances.
Our largest source of liquidity on a consolidated basis is the deposit base that comes from our retail and corporate and institutional banking activities. Other borrowed funds come from a diverse mix of short and long-term funding sources. Liquid assets and unused borrowing capacity from a number of sources are also available to maintain our liquidity position.
48
Liquid assets consist of short-term investments (federal funds sold, resale agreements, trading securities, interest-earning deposits with banks, and other short-term investments) and securities available for sale. At December 31, 2008, our liquid assets totaled $59.6 billion, with $22.5 billion pledged as collateral for borrowings, trust, and other commitments.
Bank Level Liquidity
PNC Bank, N.A. and National City Bank can borrow from the Federal Reserve Bank of Clevelands (Federal Reserve Bank) discount window to meet short-term liquidity requirements. These borrowings are secured by securities and commercial loans. PNC Bank, N.A. is also a member of the Federal Home Loan Bank (FHLB)-Pittsburgh and as such has access to advances from FHLB-Pittsburgh secured generally by residential mortgage and other mortgage-related loans. At December 31, 2008, we maintained significant unused borrowing capacity from the Federal Reserve Bank discount window and FHLB-Pittsburgh under current collateral requirements. In addition, National City Bank is a member of FHLB Cincinnati.
Information regarding amounts pledged, for the ability to borrow if necessary, and borrowings related to the Federal Reserve Bank, FHLB Pittsburgh and FHLB Cincinnati are as follows:
| In billions | Dec. 31, 2008 |
Dec. 31, 2007 |
||||
| Pledged to Federal Reserve Bank |
||||||
| Loans |
$ | 32.9 | $ | 1.6 | ||
| Securities |
$ | 11.0 | $ | 18.8 | ||
| Combined collateral value |
$ | 35.4 | $ | 18.2 | ||
| Pledged to FHLB-Pittsburgh |
||||||
| Loans |
$ | 27.1 | $ | 33.5 | ||
| Securities |
$ | 5.3 | $ | 4.3 | ||
| Combined collateral value |
$ | 16.7 | $ | 23.5 | ||
| Pledged to FHLB-Cincinnati |
||||||
| Loans |
$ | 22.3 | ||||
| Securities |
$ | 1.1 | ||||
| Combined collateral value |
$ | 6.5 | ||||
| Outstanding borrowings |
||||||
| Federal Reserve Bank |
$ | 2.0 | ||||
| FHLB Pittsburgh |
8.8 | $ | 6.8 | |||
| FHLB Cincinnati |
6.5 | |||||
| Total |
$ | 17.3 | $ | 6.8 | ||
| Unused borrowing capacity |
||||||
| Federal Reserve Bank |
$ | 33.4 | $ | 18.2 | ||
| FHLB Pittsburgh |
7.9 | 16.7 | ||||
| FHLB Cincinnati |
| | ||||
| Total |
$ | 41.3 | $ | 34.9 | ||
Total FHLB borrowings were $18.1 billion at December 31, 2008 compared with $7.1 billion at December 31, 2007. We increased total FHLB borrowings during 2008 which provided us with additional liquidity at relatively attractive rates.
We can also obtain funding through traditional forms of borrowing, including federal funds purchased, repurchase agreements, and short and long-term debt issuances. PNC Bank, N.A. has the ability to offer up to $20 billion in senior and subordinated unsecured debt obligations with maturities of more than nine months. Through December 31, 2008, PNC Bank, N.A. had issued $6.9 billion of debt under this program.
PNC Bank, N.A. also has the ability to offer up to $3.0 billion of its commercial paper. As of December 31, 2008, $327 million of commercial paper was outstanding under this program.
As of December 31, 2008, there were $3.1 billion of PNC Bank, N.A. and $4.8 billion of National City Bank short- and long-term debt issuances, including commercial paper, with maturities of less than one year.
Parent Company Liquidity
Our parent companys routine funding needs consist primarily of dividends to PNC shareholders, share repurchases, debt service, the funding of non-bank affiliates, and acquisitions.
See the Funding and Capital Sources section of the Consolidated Balance Sheet Review section of this Exhibit 99.1 regarding certain restrictions on dividends and common share repurchases related to PNCs participation in the US Treasurys TARP Capital Purchase Program.
49
Parent company liquidity guidelines are designed to help ensure that sufficient liquidity is available to meet these requirements over the succeeding 12-month period. In managing parent company liquidity we consider funding sources, such as expected dividends to be received from our subsidiaries and potential debt issuance, and discretionary funding uses, the most significant of which is the external dividend to be paid on PNCs stock. On March 1, 2009, the Board decided to reduce PNCs quarterly common stock dividend from $0.66 to $0.10 per share. This action will reduce the cash requirement for annual external dividends by approximately $1.0 billion.
The principal source of parent company cash flow is the dividends it receives from its subsidiary banks, which may be impacted by the following:
| | Capital needs, |
| | Laws and regulations, |
| | Corporate policies, |
| | Contractual restrictions, and |
| | Other factors. |
Also, there are statutory and regulatory limitations on the ability of national banks to pay dividends or make other capital distributions or to extend credit to the parent company or its non-bank subsidiaries. See Note 23 Regulatory Matters in the Notes To Consolidated Financial Statements in this Exhibit 99.1 for a further discussion of these limitations. Dividends may also be impacted by the banks capital needs and by contractual restrictions. We provide additional information on certain contractual restrictions under the Perpetual Trust Securities, PNC Capital Trust E Trust Preferred Securities, and Acquired Entity Trust Preferred Securities sections of the Off-Balance Sheet Arrangements And Variable Interest Entities section of this MD&A. The amount available for dividend payments to the parent company by PNC Bank, N.A. without prior regulatory approval was approximately $351 million at December 31, 2008. National City Bank had no statutory dividend capacity as of December 31, 2008.
In addition to dividends from PNC Bank, N.A., other sources of parent company liquidity include cash and short-term investments, as well as dividends and loan repayments from other subsidiaries and dividends or distributions from equity investments. As of December 31, 2008, the parent company had approximately $4.2 billion in funds available from its cash and short-term investments.
We can also generate liquidity for the parent company and PNCs non-bank subsidiaries through the issuance of securities in public or private markets.
In December 2008, PNC Funding Corp issued the following securities totaling $2.9 billion under the FDICs Temporary Liquidity Guarantee Program-Debt Guarantee Program:
| | $2 billion of fixed rate senior notes due June 2012. These notes pay interest semiannually at a fixed rate of 2.3%. |
| | $500 million of fixed rate senior notes due June 2011. These notes pay interest semiannually at a fixed rate of 1.875%. |
| | $400 million of floating rate senior notes due June 2011. Interest will be reset quarterly to 3-month LIBOR plus 28 basis points and interest will be paid quarterly. |
Each of these series of senior notes is guaranteed by the parent company and by the FDIC and is backed by the full faith and credit of the United States through June 30, 2012.
See the Executive Summary section of this MD&A and Note 19 Shareholders Equity in the Notes To Consolidated Financial Statements in this Exhibit 99.1 for information regarding PNCs December 31, 2008 issuance of $7.6 billion of preferred stock and related common stock warrant to the US Treasury under the TARP Capital Purchase Program.
PNC Funding Corp has the ability to offer up to $3.0 billion of commercial paper to provide the parent company with additional liquidity. As of December 31, 2008, $99 million of commercial paper was outstanding under this program.
We have effective shelf registration statements which enable us to issue additional debt and equity securities, including certain hybrid capital instruments. As of December 31, 2008, there were $1.4 billion of parent company contractual obligations, including commercial paper, with maturities of less than one year.
We also provide tables showing contractual obligations and various other commitments representing required and potential cash outflows as of December 31, 2008 under the heading Commitments below.
50
Commitments
The following tables set forth contractual obligations and various other commitments representing required and potential cash outflows as of December 31, 2008.
| Contractual Obligations | Payment Due By Period | ||||||||||||||
| December 31, 2008 - in millions | Total | Less than one year |
One to three years |
Four to five years |
After five years |
||||||||||
| Remaining contractual maturities of time deposits |
$ | 75,919 | $ | 44,877 | $ | 17,758 | $ | 9,011 | $ | 4,273 | |||||
| Federal Home Loan Bank borrowings |
18,126 | 5,058 | 7,887 | 4,694 | 487 | ||||||||||
| Other borrowed funds |
34,114 | 13,533 | 6,730 | 4,129 | 9,722 | ||||||||||
| Minimum annual rentals on noncancellable leases |
2,615 | 329 | 579 | 459 | 1,248 | ||||||||||
| Nonqualified pension and postretirement benefits |
567 | 62 | 124 | 117 | 264 | ||||||||||
| Purchase obligations (a) |
1,145 | 398 | 472 | 215 | 60 | ||||||||||
| Total contractual cash obligations |
$ | 132,486 | $ | 64,257 | $ | 33,550 | $ | 18,625 | $ | 16,054 | |||||
| (a) | Includes purchase obligations for goods and services covered by noncancellable contracts and contracts including cancellation fees. |
| Other Commitments (a) | Amount Of Commitment Expiration By Period | ||||||||||||||
| December 31, 2008 - in millions | Total Amounts Committed |
Less than one year |
One to three years |
Four to five years |
After five years |
||||||||||
| Other unfunded loan commitments |
$ | 62,665 | $ | 27,260 | $ | 22,317 | $ | 12,358 | $ | 730 | |||||
| Home equity lines of credit |
23,195 | 14,342 | 8,853 | ||||||||||||
| Consumer credit card lines |
19,028 | 17,549 | 1,479 | ||||||||||||
| Standby letters of credit (b) |
10,317 | 3,855 | 3,916 | 2,352 | 194 | ||||||||||
| Other commitments (c) |
1,408 | 595 | 390 | 302 | 121 | ||||||||||
| Total commitments |
$ | 116,613 | $ | 63,601 | $ | 36,955 | $ | 15,012 | $ | 1,045 | |||||
| (a) | Other commitments are funding commitments that could potentially require performance in the event of demands by third parties or contingent events. Loan commitments are reported net of participations, assignments and syndications. |
| (b) | Includes $5.1 billion of standby letters of credit that support remarketing programs for customers variable rate demand notes. |
| (c) | Includes unfunded commitments related to private equity investments of $540 million and other investments of $178 million which are not on our Consolidated Balance Sheet. Also includes commitments related to tax credit investments of $690 million which are included in other liabilities on the Consolidated Balance Sheet. |
MARKET RISK MANAGEMENT OVERVIEW
Market risk is the risk of a loss in earnings or economic value due to adverse movements in market factors such as interest rates, credit spreads, foreign exchange rates, and equity prices. We are exposed to market risk primarily by our involvement in the following activities, among others:
| | Traditional banking activities of taking deposits and extending loans, |
| | Private equity and other investments and activities whose economic values are directly impacted by market factors, and |
| | Trading in fixed income products, equities, derivatives, and foreign exchange, as a result of customer activities, underwriting, and proprietary trading. |
We have established enterprise-wide policies and methodologies to identify, measure, monitor, and report market risk. Market Risk Management provides independent oversight by monitoring compliance with these limits and guidelines, and reporting significant risks in the business to the Risk Committee of the Board.
MARKET RISK MANAGEMENT INTEREST RATE RISK
Interest rate risk results primarily from our traditional banking activities of gathering deposits and extending loans. Many factors, including economic and financial conditions, movements in interest rates, and consumer preferences, affect the difference between the interest that we earn on assets and the interest that we pay on liabilities and the level of our noninterest-bearing funding sources. Due to the repricing term mismatches and embedded options inherent in certain of these products, changes in market interest rates not only affect expected near-term earnings, but also the economic values of these assets and liabilities.
Asset and Liability Management centrally manages interest rate risk within limits and guidelines set forth in our risk management policies approved by the Asset and Liability Committee and the Risk Committee of the Board.
51
Sensitivity results and market interest rate benchmarks for the fourth quarters of 2008 and 2007 follow:
Interest Sensitivity Analysis
| Fourth Quarter 2008 |
Fourth Quarter 2007 |
|||||
| Net Interest Income Sensitivity Simulation |
||||||
| Effect on net interest income in first year from gradual interest rate change over following 12 months of: |
||||||
| 100 basis point increase |
(0.7 | )% | (2.8 | )% | ||
| 100 basis point decrease |
(0.5 | )% | 2.9 | % | ||
| Effect on net interest income in second year from gradual interest rate change over the preceding 12 months of: |
||||||
| 100 basis point increase |
1.9 | % | (6.4 | )% | ||
| 100 basis point decrease |
(3.1 | )% | 4.4 | % | ||
| Duration of Equity Model |
||||||
| Base case duration of equity (in years): |
NM | (a) | 2.1 | |||
| Key Period-End Interest Rates |
||||||
| One month LIBOR |
.44 | % | 4.60 | % | ||
| Three-year swap |
1.76 | % | 3.91 | % |
| (a) | NM = not meaningful. Given the inherent limitations in certain of these measurement tools and techniques, results become less meaningful as interest rates approach zero. |
In addition to measuring the effect on net interest income assuming parallel changes in current interest rates, we routinely simulate the effects of a number of nonparallel interest rate environments. The following Net Interest Income Sensitivity To Alternative Rate Scenarios table reflects the percentage change in net interest income over the next two 12-month periods assuming (i) the PNC Economists most likely rate forecast, (ii) implied market forward rates, and (iii) a Two-Ten Inversion (a 200 basis point inversion between two-year and ten-year rates superimposed on current base rates) scenario.
Net Interest Income Sensitivity To Alternative Rate Scenarios (Fourth Quarter 2008)
| PNC Economist |
Market Forward |
Two-Ten Inversion |
|||||||
| First year sensitivity |
0.5 | % | (0.2 | )% | 2.3 | % | |||
| Second year sensitivity |
4.9 | % | 2.4 | % | 2.3 | % |
All changes in forecasted net interest income are relative to results in a base rate scenario where current market rates are assumed to remain unchanged over the forecast horizon.
When forecasting net interest income, we make assumptions about interest rates and the shape of the yield curve, the volume and characteristics of new business, and the behavior of existing on- and off-balance sheet positions. These assumptions determine the future level of simulated net interest income in the base interest rate scenario and the other interest rate scenarios presented in the following table. These simulations assume that as assets and liabilities mature, they are replaced or repriced at market rates.
The graph below presents the yield curves for the base rate scenario and each of the alternate scenarios one year forward.
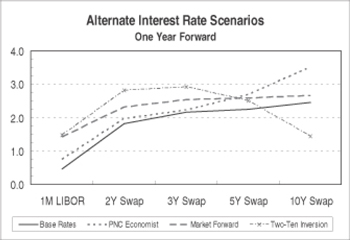
The results of the fourth quarter 2008 interest sensitivity analyses reflect our current best estimates of the impact of integrating National Citys balance sheet, including the preliminary effects of purchase accounting, balance sheet repositioning, and deposit pricing strategies. Going forward as these estimates and strategies are finalized or revised, the results of our analyses may change. The
52
fourth quarter 2008 analyses also reflect the impact of the rapid decline in market interest rates that occurred during that quarter, in which period-end one-month LIBOR and three-year swap rates declined 349 basis points and 197 basis points, respectively.
The fourth quarter 2008 interest sensitivity analyses indicate that our Consolidated Balance Sheet is positioned to benefit from an increase in interest rates. We believe that we have the deposit funding base and balance sheet flexibility to adjust, where appropriate and permissible, to changing interest rates and market conditions.
MARKET RISK MANAGEMENT TRADING RISK
Our trading activities include customer-driven trading in fixed income securities, equities, derivatives, and foreign exchange contracts. They also include the underwriting of fixed income and equity securities and proprietary trading.
We use value-at-risk (VaR) as the primary means to measure and monitor market risk in trading activities. The Risk Committee of the Board establishes an enterprise-wide VaR limit on our trading activities.
During 2008, our VaR ranged between $5.4 million and $18.4 million, averaging $10.8 million. During 2007, our VaR ranged between $6.1 million and $12.8 million, averaging $8.5 million. The increase in VaR compared with 2007 reflected ongoing market volatility.
To help ensure the integrity of the models used to calculate VaR for each portfolio and enterprise-wide, we use a process known as backtesting. The backtesting process consists of comparing actual observations of trading-related gains or losses against the VaR levels that were calculated at the close of the prior day. Under typical market conditions, we would expect an average of two to three instances a year in which actual losses exceeded the prior day VaR measure at the enterprise-wide level. As a result of increased volatility in certain markets, there were 10 such instances during 2008 compared with two such instances in 2007.
The following graph shows a comparison of enterprise-wide trading-related gains and losses against prior day VaR for the period.
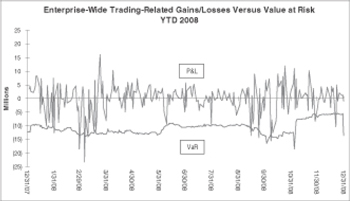
Total trading revenue for the past three years was as follows:
| Year end December 31 in millions | 2008 | 2007 | 2006 | ||||||||
| Net interest income (expense) |
$ | 72 | $ | 7 | $ | (6 | ) | ||||
| Noninterest income |
(55 | ) | 104 | 183 | |||||||
| Total trading revenue |
$ | 17 | $ | 111 | $ | 177 | |||||
| Securities underwriting and trading (a) |
$ | (17 | ) | $ | 41 | $ | 38 | ||||
| Foreign exchange |
73 | 58 | 55 | ||||||||
| Financial derivatives |
(39 | ) | 12 | 84 | |||||||
| Total trading revenue |
$ | 17 | $ | 111 | $ | 177 | |||||
| (a) | Includes changes in fair value for certain loans accounted for at fair value. |
The decline in total trading revenue for 2008 primarily related to losses sustained in our proprietary trading activities. These decreases reflected the negative impact of significant widening of market credit spreads in extremely illiquid markets. We took the following steps during 2008 to reduce our proprietary trading positions:
| | Sold Hilliard Lyons on March 31, 2008, including their proprietary trading positions; |
| | Significantly reduced the PNC Capital Markets municipal bond arbitrage book during the first half of 2008, closing it completely by August 2008; |
| | Reduced significantly proprietary risk taking within the customer-focused equity derivatives book during 2008; |
| | Reduced convertible arbitrage book positions during 2008 from close to $225 million face value of bonds to close to $100 million; |
53
| | Terminated all derivative positions hedging municipal bond exposure in tender option bond trusts, terminated the trusts, and transferred the remaining long municipal bond position (approximately $300 million face value) to the available for sale portfolio. This transfer occurred in the fourth quarter of 2008; |
| | Sold down approximately 80% of the positions in the non-agency mortgage-backed securities and commercial mortgage-backed securities proprietary trading books during 2008. The remaining positions (market value of approximately $300 million) were transferred to the available for sale portfolio after terminating swap hedges. This transfer occurred in the fourth quarter of 2008; and |
| | Significantly reduced all other proprietary trading positions including interest rate swaps, futures, swap options and credit default swaps. |
Trading securities at December 31, 2008 totaled $1.7 billion, including $1 billion from National City, compared with $3.6 billion at December 31, 2007 and reflected our risk management actions outlined above.
Average trading assets and liabilities for the past three years consisted of the following:
| Year ended - in millions | 2008 | 2007 | 2006 | ||||||
| Assets |
|||||||||
| Securities (a) |
$ | 2,387 | $ | 2,708 | $ | 1,712 | |||
| Resale agreements (b) |
1,794 | 1,133 | 623 | ||||||
| Financial derivatives (c) |
2,389 | 1,378 | 1,148 | ||||||
| Loans at fair value (c) |
83 | 166 | 128 | ||||||
| Total assets |
$ | 6,653 | $ | 5,385 | $ | 3,611 | |||
| Liabilities |
|||||||||
| Securities sold short (d) |
$ | 1,294 | $ | 1,657 | $ | 965 | |||
| Repurchase agreements and other borrowings (e) |
756 | 520 | 833 | ||||||
| Financial derivatives (f) |
2,423 | 1,384 | 1,103 | ||||||
| Borrowings at fair value (f) |
22 | 39 | 31 | ||||||
| Total liabilities |
$ | 4,495 | $ | 3,600 | $ | 2,932 | |||
| (a) | Included in Interest-earning assets-Other on the Average Consolidated Balance Sheet And Net Interest Analysis section of our 2008 Form 10-K. |
| (b) | Included in Federal funds sold and resale agreements. |
| (c) | Included in Noninterest-earning assets-Other. |
| (d) | Included in Other borrowed funds. |
| (e) | Included in Repurchase agreements and Other borrowed funds. |
| (f) | Included in Accrued expenses and other liabilities. |
MARKET RISK MANAGEMENT EQUITY AND OTHER INVESTMENT RISK
Equity investment risk is the risk of potential losses associated with investing in both private and public equity markets. In addition to extending credit, taking deposits, and underwriting and trading financial instruments, we make and manage direct investments in a variety of transactions, including management buyouts, recapitalizations, and later-stage growth financings in a variety of industries. We also have investments in affiliated and non-affiliated funds that make similar investments in private equity and in debt and equity-oriented hedge funds. The economic and/or book value of these investments and other assets such as loan servicing rights are directly affected by changes in market factors.
The primary risk measurement for equity and other investments is economic capital. Economic capital is a common measure of risk for credit, market and operational risk. It is an estimate of the worst-case value depreciation over one year within a 99.9% confidence level. Given the illiquid nature of many of these types of investments, it can be a challenge to determine their fair values. Market Risk Management and Finance provide independent oversight of the valuation process.
Various PNC business units manage our private equity and other investment activities. Our businesses are responsible for making investment decisions within the approved policy limits and associated guidelines.
BlackRock
PNC owns approximately 43 million shares of BlackRock common stock, accounted for under the equity method. Our total investment in BlackRock was $4.2 billion at December 31, 2008 compared with $4.1 billion at December 31, 2007. The market value of our investment in BlackRock was $5.8 billion at December 31, 2008. The primary risk measurement, similar to other equity investments, is economic capital.
The discussion of BlackRock within the Business Segments Review section of this MD&A includes information about changes in our ownership structure of BlackRock in 2009.
54
Tax Credit Investments
Included in our equity investments are limited partnerships that sponsor tax credit investments. These investments, consisting of partnerships as well as equity investments held by consolidated partnerships, totaled $2.3 billion at December 31, 2008. Investments accounted for under the equity method totaled $1.7 billion while investments accounted for under the cost method totaled $648 million at December 31, 2008. These investments totaled $1.0 billion at December 31, 2007, all of which were accounted for under the equity method.
Visa
At December 31, 2008, our remaining investment in Visa Class B common shares totaled approximately 23.2 million shares, including 19.7 million shares acquired in connection with our National City acquisition. The Visa B shares owned by National City were recorded by PNC at fair value (including a liquidity discount) as part of our acquisition. The PNC-owned Visa B shares are recorded at zero book value. Considering the expected reduction in the IPO conversion ratio due to settled litigation reported by Visa, these shares would convert to approximately 14.6 million of the publicly traded Visa Class A common shares. Based on the December 31, 2008 closing price of $52.45 for the Visa shares, our remaining investment had an unrecognized pretax value of approximately $312 million at that date. The Visa Class B common shares we own generally will not be transferable until they can be converted into shares of the publicly traded class of stock, which cannot happen until the later of three years after the IPO or settlement of all of the specified litigation. As stated above, it is expected that Visa will continue to adjust the conversion ratio of Visa Class B to Class A shares in connection with settlements in excess of any amounts then in escrow for that purpose and will also reduce the conversion ratio to the extent that it adds any funds to the escrow in the future. Note 25 Commitments and Guarantees in our Notes To Consolidated Financial Statements included in this Exhibit 99.1 has further information on our Visa indemnification obligation.
Private Equity
The private equity portfolio is comprised of equity and mezzanine investments that vary by industry, stage and type of investment. Private equity investments are reported at fair value. Changes in the values of private equity investments are reflected in our results of operations. Due to the nature of the investments, the valuations incorporate assumptions as to future performance, financial condition, liquidity, availability of capital, and market conditions, among other factors, to determine the estimated fair value of the investments. Market conditions and actual performance of the investments could differ from these assumptions. Accordingly, lower valuations may occur that could adversely impact earnings in future periods. Also, the valuations may not represent amounts that will ultimately be realized from these investments. See Note 1 Accounting Policies in the Notes To Consolidated Financial Statements in this Exhibit 99.1 for additional information.
At December 31, 2008, private equity investments carried at estimated fair value totaled $1.2 billion compared with $561 million at December 31, 2007. As of December 31, 2008, $620 million was invested directly in a variety of companies and $566 million was invested indirectly through various private equity funds. Included in direct investments are investment activities of two private equity funds that are consolidated for financial reporting purposes. The noncontrolling interests of these funds totaled $142 million as of December 31, 2008. Our unfunded commitments related to private equity totaled $540 million at December 31, 2008 compared with $270 million at December 31, 2007.
Other Investments
We also make investments in affiliated and non-affiliated funds with both traditional and alternative investment strategies. The economic values could be driven by either the fixed-income market or the equity markets, or both. At December 31, 2008, other investments totaled $853 million compared with $384 million at December 31, 2007. We recognized losses related to these investments of $156 million during 2008 including $76 million in the fourth quarter. Given the nature of these investments and if current market conditions affecting their valuation were to continue or worsen, we could incur future losses.
Our unfunded commitments related to other investments totaled $178 million at December 31, 2008 compared with $79 million at December 31, 2007.
IMPACT OF INFLATION
Our assets and liabilities are primarily monetary in nature. Accordingly, future changes in prices do not affect the obligations to pay or receive fixed and determinable amounts of money. During periods of inflation, monetary assets lose value in terms of purchasing power and monetary liabilities have corresponding purchasing power gains. The concept of purchasing power, however, is not an adequate indicator of the effect of inflation on banks because it does not take into account changes in interest rates, which are an important determinant of our earnings.
55
FINANCIAL DERIVATIVES
We use a variety of financial derivatives as part of the overall asset and liability risk management process to help manage interest rate, market and credit risk inherent in our business activities. Substantially all such instruments are used to manage risk related to changes in interest rates. Interest rate and total return swaps, interest rate caps and floors and futures contracts are the primary instruments we use for interest rate risk management.
Financial derivatives involve, to varying degrees, interest rate, market and credit risk. For interest rate swaps and total return swaps, options and futures contracts, only periodic cash payments and, with respect to options, premiums are exchanged. Therefore, cash requirements and exposure to credit risk are significantly less than the notional amount on these instruments. Further information on our financial derivatives is presented in Note 1 Accounting Policies and Note 17 Financial Derivatives in the Notes To Consolidated Financial Statements in this Exhibit 99.1.
Not all elements of interest rate, market and credit risk are addressed through the use of financial or other derivatives, and such instruments may be ineffective for their intended purposes due to unanticipated market characteristics, among other reasons.
The following tables provide the notional or contractual amounts and estimated net fair value of financial derivatives used for risk management and designated as accounting hedges as well as free-standing derivatives at December 31, 2008 and 2007. Weighted-average interest rates presented are based on contractual terms, if fixed, or the implied forward yield curve at each respective date, if floating.
56
Financial Derivatives 2008
| Notional/ Contractual |
Estimated Net |
Weighted Average |
Weighted- Average Interest Rates |
||||||||||||
| December 31, 2008 - dollars in millions | Amount | Fair Value | Maturity | Paid | Received | ||||||||||
| Accounting Hedges |
|||||||||||||||
| Interest rate risk management |
|||||||||||||||
| Asset rate conversion |
|||||||||||||||
| Interest rate swaps (a) |
|||||||||||||||
| Receive fixed |
$ | 5,618 | $ | 527 | 3 yrs. | 2.18 | % | 4.76 | % | ||||||
| Liability rate conversion |
|||||||||||||||
| Interest rate swaps (a) |
|||||||||||||||
| Receive fixed |
9,888 | 888 | 3 yrs. 7 mos. | 2.27 | % | 4.73 | % | ||||||||
| Total interest rate risk management |
15,506 | 1,415 | |||||||||||||
| Total accounting hedges (b) |
$ | 15,506 | $ | 1,415 | |||||||||||
| Free-Standing Derivatives |
|||||||||||||||
| Customer-related |
|||||||||||||||
| Interest rate |
|||||||||||||||
| Swaps (c) |
$ | 97,337 | $ | (161 | ) | 4 yrs. 9 mos. | 3.08 | % | 3.07 | % | |||||
| Caps/floors |
|||||||||||||||
| Sold (c) |
3,878 | (12 | ) | 4 yrs. 4 mos. | NM | NM | |||||||||
| Purchased |
2,410 | 8 | 2 yrs. 10 mos. | NM | NM | ||||||||||
| Futures |
8,878 | 1 yr. 1 mo. | NM | NM | |||||||||||
| Foreign exchange (c) |
8,877 | (3 | ) | 5 mos. | NM | NM | |||||||||
| Equity |
984 | (4 | ) | 1 yr. | NM | NM | |||||||||
| Swaptions |
3,058 | 160 | 13 yrs. 2 mos. | NM | NM | ||||||||||
| Other |
335 | 12 | 3 yrs. 3 mos. | NM | NM | ||||||||||
| Total customer-related |
125,757 | | |||||||||||||
| Residential mortgage servicing rights |
52,980 | 109 | 5 yrs. 10 mos. | NM | NM | ||||||||||
| Other risk management and proprietary |
|||||||||||||||
| Interest rate |
|||||||||||||||
| Swaps (d) |
24,481 | 667 | 3 yrs. | 3.93 | % | 2.70 | % | ||||||||
| Caps/floors |
|||||||||||||||
| Sold |
514 | 1 yr. 4 mos. | NM | NM | |||||||||||
| Purchased |
280 | 1 | 4 yrs. 7 mos. | NM | NM | ||||||||||
| Futures |
8,359 | 8 mos. | NM | NM | |||||||||||
| Foreign exchange |
95 | 4 mos. | NM | NM | |||||||||||
| Credit derivatives |
2,937 | 205 | 13 yrs. 8 mos. | NM | NM | ||||||||||
| Risk participation agreements |
3,290 | 3 yrs. 1 mo. | NM | NM | |||||||||||
| Commitments related to mortgage-related assets (c) |
18,853 | (12 | ) | 1 mo. | NM | NM | |||||||||
| Options |
|||||||||||||||
| Swaptions |
276 | 17 | 10 yrs. 11 mos. | NM | NM | ||||||||||
| Other (e) |
438 | 44 | NM | NM | NM | ||||||||||
| Total other risk management and proprietary |
59,523 | 922 | |||||||||||||
| Total free-standing derivatives |
$ | 238,260 | $ | 1,031 | |||||||||||
| (a) | The floating rate portion of interest rate contracts is based on money-market indices. As a percent of notional amount, 55% were based on 1-month LIBOR and 45% on 3-month LIBOR. |
| (b) | Fair value amount includes net accrued interest receivable of $147 million. |
| (c) | The increases in the negative fair values from December 31, 2007 to December 31, 2008 for interest rate contracts, foreign exchange and commitments related to mortgage-related assets were due to the changes in fair values of the existing contracts along with new contracts entered into during 2008. |
| (d) | Due to the adoption of SFAS 159 as of January 1, 2008, we discontinued hedge accounting for our commercial mortgage banking pay-fixed interest rate swaps; therefore, the fair value of these are now reported in this category. |
| (e) | Relates to PNCs obligation to help fund certain BlackRock LTIP programs. Additional information regarding the BlackRock/MLIM transaction and our BlackRock LTIP shares obligation is included in Note 2 Acquisitions and Divestitures included in the Notes To Consolidated Financial Statements in this Exhibit 99.1. |
| NM | Not meaningful |
57
Financial Derivatives 2007
| December 31, 2007- dollars in millions | Notional/ Amount |
Estimated Fair Value |
Weighted Average Maturity |
Weighted-Average Interest Rates |
|||||||||||
| Paid | Received | ||||||||||||||
| Accounting Hedges |
|||||||||||||||
| Interest rate risk management |
|||||||||||||||
| Asset rate conversion |
|||||||||||||||
| Interest rate swaps (a) |
|||||||||||||||
| Receive fixed |
$ | 7,856 | $ | 325 | 4 yrs. 2 mos. | 4.28 | % | 5.34 | % | ||||||
| Liability rate conversion |
|||||||||||||||
| Interest rate swaps (a) |
|||||||||||||||
| Receive fixed |
9,440 | 269 | 4 yrs. 10 mos. | 4.12 | % | 5.09 | % | ||||||||
| Total interest rate risk management |
17,296 | 594 | |||||||||||||
| Commercial mortgage banking risk management |
1,128 | (79 | ) | 8 yrs. 8 mos. | 5.45 | % | 4.52 | % | |||||||
| Total accounting hedges (b) |
$ | 18,424 | $ | 515 | |||||||||||
| Free-Standing Derivatives |
|||||||||||||||
| Customer-related |
|||||||||||||||
| Interest rate |
|||||||||||||||
| Swaps |
$ | 61,768 | $ | (39 | ) | 5 yrs. 4 mos. | 4.46 | % | 4.49 | % | |||||
| Caps/floors |
|||||||||||||||
| Sold |
2,837 | (5 | ) | 6 yrs. 5 mos. | NM | NM | |||||||||
| Purchased |
2,356 | 7 | 3 yrs. 7 mos. | NM | NM | ||||||||||
| Futures |
5,564 | 8 mos. | NM | NM | |||||||||||
| Foreign exchange |
7,028 | 8 | 7 mos. | NM | NM | ||||||||||
| Equity |
1,824 | (69 | ) | 1 yr. 5 mos. | NM | NM | |||||||||
| Swaptions |
3,490 | 40 | 13 yrs. 10 mos. | NM | NM | ||||||||||
| Other |
200 | 10 yrs. 6 mos. | NM | NM | |||||||||||
| Total customer-related |
85,067 | (58 | ) | ||||||||||||
| Other risk management and proprietary |
|||||||||||||||
| Interest rate |
|||||||||||||||
| Swaps |
41,247 | 6 | 4 yrs. 5 mos. | 4.44 | % | 4.47 | % | ||||||||
| Caps/floors |
|||||||||||||||
| Sold |
6,250 | (82 | ) | 2 yrs. 1 mo. | NM | NM | |||||||||
| Purchased |
7,760 | 117 | 1 yr. 11 mos. | NM | NM | ||||||||||
| Futures |
43,107 | 1 yr. 7 mos. | NM | NM | |||||||||||
| Foreign exchange |
8,713 | 5 | 6 yrs. 8 mos. | NM | NM | ||||||||||
| Credit derivatives |
5,823 | 42 | 12 yrs. 1 mo. | NM | NM | ||||||||||
| Risk participation agreements |
1,183 | 4 yrs. 6 mos. | NM | NM | |||||||||||
| Commitments related to mortgage-related assets |
3,190 | 10 | 4 mos. | NM | NM | ||||||||||
| Options |
|||||||||||||||
| Futures |
39,158 | (2 | ) | 8 mos. | NM | NM | |||||||||
| Swaptions |
21,800 | 49 | 8 yrs. 1 mo. | NM | NM | ||||||||||
| Other (c) |
442 | (201 | ) | NM | NM | NM | |||||||||
| Total other risk management and proprietary |
178,673 | (56 | ) | ||||||||||||
| Total free-standing derivatives |
$ | 263,740 | $ | (114 | ) | ||||||||||
| (a) | The floating rate portion of interest rate contracts is based on money-market indices. As a percent of a notional amount, 52% were based on 1-month LIBOR, 43% on 3-month LIBOR and 5% on Prime Rate. |
| (b) | Fair value amounts include net accrued interest receivable of $130 million. |
| (c) | See (e) on page 57. |
| NM | Not meaningful |
58
2007 VERSUS 2006
CONSOLIDATED INCOME STATEMENT REVIEW
Summary Results
Consolidated net income for 2007 was $1.491 billion or $4.32 per diluted share and for 2006 was $2.599 billion or $8.71 per diluted share.
Net income for 2006 included the after-tax impact of the following items:
| | The third quarter gain on the BlackRock/MLIM transaction of $1.3 billion, or $4.39 per diluted share; |
| | The third quarter securities portfolio rebalancing loss of $127 million, or $.43 per diluted share; |
| | BlackRock/MLIM transaction integration costs of $47 million, or $.16 per diluted share, and |
| | The third quarter mortgage loan portfolio repositioning loss of $31 million, or $.11 per diluted share. |
The aggregate impact of these items increased 2006 net income by $1.1 billion, or $3.69 per diluted share.
Net Interest Income
Net interest income was $2.915 billion for 2007 and $2.245 billion for 2006, an increase of $670 million, or 30%. This increase was consistent with the $20.3 billion, or 26%, increase in average interest-earning assets during 2007 compared with 2006. The net interest margin was 3.00% in 2007 and 2.92% for 2006, an increase of 8 basis points.
Provision For Credit Losses
The provision for credit losses totaled $315 million for 2007 and $124 million for 2006. Of the total 2007 provision, $188 million was recorded in the fourth quarter, including approximately $45 million related to our Yardville acquisition. The higher provision in 2007 was also impacted by an increase in our real estate portfolio, including residential real estate development exposure, and growth in total credit exposure. Total residential real estate development outstandings were approximately $2.1 billion at December 31, 2007.
Noninterest Income
Summary
Noninterest income was $3.790 billion for 2007 and $6.327 billion for 2006. Noninterest income for 2007 included the impact of an $83 million gain recognized in connection with our transfer of BlackRock shares to satisfy a portion of PNCs LTIP obligation and a $210 million net loss representing the mark-to-market adjustment on our LTIP obligation.
Noninterest income for 2006 included the impact of the following items:
| | The gain on the BlackRock/MLIM transaction, which totaled $2.078 billion, |
| | The effects of our third quarter 2006 balance sheet repositioning activities that resulted in charges totaling $244 million, and |
| | PNC consolidated BlackRock in its results for the first nine months of 2006 but accounted for BlackRock on the equity method for the fourth quarter of 2006 and all of 2007. Had our BlackRock investment been on the equity method for all of 2006, BlackRocks noninterest income reported by us would have been lower by $943 million for that year. |
Apart from the impact of these items, noninterest income increased $367 million, or 10%, in 2007 compared with 2006 largely as a result of the Mercantile acquisition and growth in several fee income categories.
Additional analysis
Fund servicing fees declined $58 million in 2007, to $835 million, compared with $893 million in the prior year. Amounts for 2006 included $117 million of distribution fee revenue at Global Investment Servicing. Effective January 1, 2007, we refined our accounting and reporting of Global Investment Servicings distribution fee revenue and related expense amounts and present these amounts net on a prospective basis. Prior to 2007, the distribution amounts were shown on a gross basis within fund servicing fees and within other noninterest expense and offset each other entirely with no impact on earnings.
Apart from the impact of the distribution fee revenue included in the 2006 amounts, fund servicing fees increased $59 million in 2007 compared with the prior year. Higher revenue from offshore operations, transfer agency, managed accounts and alternative investments contributed to the increase in 2007, reflecting net new business and growth from existing clients.
Asset management fees totaled $784 million for 2007 and $1.420 billion for 2006. Our equity income from BlackRock has been included in asset management fees beginning with the fourth quarter of 2006. Asset management fees were higher in 2006 as the first nine months of 2006 reflected the impact of BlackRocks revenue on a consolidated basis.
Assets managed at December 31, 2007 totaled $74 billion compared with $54 billion at December 31, 2006. This increase resulted primarily from the Mercantile acquisition.
59
Consumer services fees increased $81 million, or 13%, to $692 million in 2007 compared with 2006. The increase reflected the impact of Mercantile, higher brokerage fees, higher debit card revenues resulting from higher transaction volumes, and fees from the credit card business that began in the latter part of 2006.
Corporate services revenue was $713 million for 2007, an increase of $87 million, or 14%, over 2006. Higher revenue from commercial mortgage servicing including the impact of the ARCS acquisition, treasury management, third party consumer loan servicing activities and the Mercantile acquisition contributed to the increase in 2007 over the prior year.
Service charges on deposits increased $35 million, or 11%, to $348 million for 2007 compared with 2006. The increase was primarily due to the impact of Mercantile.
Net securities losses totaled $5 million in 2007 and $207 million in 2006. We took actions during the third quarter of 2006 that resulted in the sale of approximately $6 billion of investment securities at an aggregate pretax loss of $196 million during that quarter.
Other noninterest income decreased $170 million, to $423 million, in 2007 compared with 2006. Net losses of $127 million in 2007 representing the net of the mark-to-market adjustment on our LTIP obligation and gain recognized in connection with our transfer of shares to satisfy a portion of our LTIP obligation, compared with a net loss of $12 million on our LTIP shares obligation in 2006, where such obligation was applicable in the fourth quarter. Noninterest revenue from trading activities totaled $104 million in 2007 compared with $183 million in 2006. While customer trading income increased in comparison, total trading revenue declined in 2007 largely due to the lower economic hedging gains associated with commercial mortgage loan activity and economic hedging losses associated with structured resale agreements. Other noninterest income for 2006 included a $48 million loss incurred in the third quarter in connection with the rebalancing of our residential mortgage portfolio.
Noninterest income for 2006 also included the $2.078 billion gain on the BlackRock/MLIM transaction, whereas there was no similar transaction in 2007.
Noninterest Expense
Total noninterest expense was $4.272 billion for 2007, a decrease of $214 million compared with $4.486 billion for 2006.
Noninterest expense for 2007 included the following:
| | Acquisition integration costs of $102 million, and |
| | A charge of $82 million for an indemnification obligation related to certain Visa litigation. |
Noninterest expense for 2006 included the following:
| | The first nine months of 2006 included $765 million of expenses related to BlackRock, which was still consolidated during that time, and |
| | BlackRock/MLIM transaction integration costs totaling $91 million. |
Apart from the impact of these items, noninterest expense increased $458 million, or 13%, in 2007 compared with 2006.
These increases were largely a result of the acquisition of Mercantile. Investments in growth initiatives were mitigated by disciplined expense management.
EFFECTIVE TAX RATE
Our effective tax rate was 29.6% for 2007 and 34.4% for 2006. The lower effective tax rate in 2007 compared with the prior year reflected the impact of the following matters:
| | An increase in income taxes related to the gain from, and a $57 million cumulative adjustment to increase deferred income taxes in connection with, the BlackRock/MLIM transaction in 2006, and |
| | Lower pretax income for the fourth quarter of 2007 had the impact of reducing the effective tax rate for the full year. |
CONSOLIDATED BALANCE SHEET REVIEW
Loans
Loans increased $18.2 billion, or 36%, as of December 31, 2007 compared with December 31, 2006. Our Mercantile acquisition added $12.4 billion of loans including $4.9 billion of commercial, $4.8 billion of commercial real estate, $1.6 billion of consumer and $1.1 billion of residential mortgage loans. Our Yardville acquisition added $1.9 billion of loans.
60
Securities
Total securities at December 31, 2007 were $30.2 billion compared with $23.2 billion at December 31, 2006. Securities represented 22% of total assets at December 31, 2007 and 23% of total assets at December 31, 2006. Our acquisition of Mercantile included approximately $2 billion of securities classified as available for sale. The increase in total securities compared with December 31, 2006 was primarily due to higher balances in residential mortgage-backed, commercial mortgage-backed and asset-backed securities.
At December 31, 2007, the investment securities balance included a net unrealized loss of $265 million, which represented the difference between fair value and amortized cost. The comparable amount at December 31, 2006 was a net unrealized loss of $142 million. The expected weighted-average life of investment securities (excluding corporate stocks and other) was 3 years and 6 months at December 31, 2007 and 3 years and 8 months at December 31, 2006.
Loans Held For Sale
Loans held for sale totaled $3.9 billion at December 31, 2007 compared with $2.4 billion at December 31, 2006.
Loans held for sale included commercial mortgage loans intended for securitization totaling $2.1 billion at December 31, 2007 and $.9 billion at December 31, 2006. The balance at December 31, 2007 increased as market conditions were not conducive to completing securitization transactions during the fourth quarter of 2007.
Loans held for sale also included education loans held for sale of $1.5 billion at December 31, 2007 and $1.3 billion at December 31, 2006. Gains on sales of education loans totaled $24 million in 2007 and $33 million for 2006. These gains are reflected in the other noninterest income line item in our Consolidated Income Statement and in the results of the Retail Banking business segment.
Asset Quality
Total nonperforming assets at December 31, 2007 increased $311 million, to $495 million, compared with December 31, 2006. Nonperforming loans, the largest component of nonperforming assets, increased $294 million, to $454 million, at December 31, 2007 compared with December 31, 2006. Of this increase in nonperforming loans, $192 million occurred during the fourth quarter of 2007. The increase was primarily due to higher nonaccrual commercial real estate loans primarily related to residential real estate development exposure. At December 31, 2007, our largest nonperforming asset was approximately $20 million and our average nonperforming loan associated with commercial lending was approximately $0.5 million.
The ratio of nonperforming assets to total assets rose to .36% at December 31, 2007 compared with .18% at December 31, 2006. The allowance for loan and lease losses was $830 million and represented 1.21% of total loans and 183% of nonperforming loans at December 31, 2007. The comparable amounts were $560 million, 1.12% and 350%, respectively, at December 31, 2006.
Goodwill and Other Intangible Assets
The sum of goodwill and other intangible assets increased $5.5 billion at December 31, 2007 compared with the prior year end, to $9.6 billion. We added $4.7 billion of goodwill and other intangible assets in connection with the Mercantile acquisition. In addition, our acquisitions of ARCS, Yardville and Albridge collectively added $.9 billion of goodwill and other intangible assets during 2007.
Funding Sources
Total funding sources were $113.6 billion at December 31, 2007 and $81.3 billion at December 31, 2006. Funding sources increased $32.3 billion in the comparison as total deposits increased $16.4 billion and total borrowed funds increased $15.9 billion. Our acquisition of Mercantile added $12.5 billion of deposits and $2.1 billion of borrowed funds. The Yardville acquisition resulted in $2.0 billion of deposits.
During the first quarter of 2007 we issued borrowings to fund the $2.1 billion cash portion of the Mercantile acquisition. The remaining increase in borrowed funds was the result of growth in loans and securities and the need to fund other net changes in our balance sheet. During the second half of 2007 we substantially increased Federal Home Loan Bank borrowings, which provided us with additional liquidity at relatively attractive rates.
Shareholders Equity
Total shareholders equity increased $4.1 billion, to $14.9 billion, at December 31, 2007 compared with December 31, 2006. In addition to the net impact of earnings and dividends in 2007, this increase reflected a $2.5 billion reduction in treasury stock and a $1.0 billion increase in capital surplus, largely due to the issuance of PNC common shares for the Mercantile and Yardville acquisitions.
Regulatory capital ratios at December 31, 2007 were 6.2% for leverage, 6.8% for Tier 1 risk-based and 10.3% for total risk-based capital. At December 31, 2006, the regulatory capital ratios were 9.3% for leverage, 10.4% for Tier 1 risk-based and 13.5% for total risk-based capital.
61
Glossary of Terms
Accounting/administration net fund assets - Net domestic and foreign fund investment assets for which we provide accounting and administration services. We do not include these assets on our Consolidated Balance Sheet.
Adjusted average total assets - Primarily comprised of total average quarterly (or annual) assets plus (less) unrealized losses (gains) on investment securities, less goodwill and certain other intangible assets (net of eligible deferred taxes).
Annualized - Adjusted to reflect a full year of activity.
Assets under management - Assets over which we have sole or shared investment authority for our customers/clients. We do not include these assets on our Consolidated Balance Sheet.
Basis point - One hundredth of a percentage point.
Charge-off - Process of removing a loan or portion of a loan from our balance sheet because it is considered uncollectible. We also record a charge-off when a loan is transferred to held for sale by reducing the carrying amount by the allowance for loan losses associated with such loan or, if the market value is less than its carrying amount, by the amount of that difference.
Common shareholders equity to total assets - Common shareholders equity divided by total assets. Common shareholders equity equals total shareholders equity less the liquidation value of preferred stock.
Credit derivatives - Contractual agreements, primarily credit default swaps, that provide protection against a credit event of one or more referenced credits. The nature of a credit event is established by the protection buyer and protection seller at the inception of a transaction, and such events include bankruptcy, insolvency and failure to meet payment obligations when due. The buyer of the credit derivative pays a periodic fee in return for a payment by the protection seller upon the occurrence, if any, of a credit event.
Credit spread - The difference in yield between debt issues of similar maturity. The excess of yield attributable to credit spread is often used as a measure of relative creditworthiness, with a reduction in the credit spread reflecting an improvement in the borrowers perceived creditworthiness.
Custody assets - Investment assets held on behalf of clients under safekeeping arrangements. We do not include these assets on our Consolidated Balance Sheet. Investment assets held in custody at other institutions on our behalf are included in the appropriate asset categories on the Consolidated Balance Sheet as if physically held by us.
Derivatives - Financial contracts whose value is derived from publicly traded securities, interest rates, currency exchange rates or market indices. Derivatives cover a wide assortment of financial contracts, including forward contracts, futures, options and swaps.
Distressed loan portfolio - Includes residential real estate development loans, cross border leases, subprime residential mortgage loans, brokered home equity loans and certain other residential real estate loans. These loans require special servicing and management oversight given current market conditions. The majority of these loans are from acquisitions, primarily National City.
Duration of equity - An estimate of the rate sensitivity of our economic value of equity. A negative duration of equity is associated with asset sensitivity (i.e., positioned for rising interest rates), while a positive value implies liability sensitivity (i.e., positioned for declining interest rates). For example, if the duration of equity is +1.5 years, the economic value of equity declines by 1.5% for each 100 basis point increase in interest rates.
Earning assets - Assets that generate income, which include: federal funds sold; resale agreements; trading securities; interest-earning deposits with banks; other short-term investments; loans held for sale; loans, net of unearned income; investment securities; and certain other assets.
Economic capital - Represents the amount of resources that a business segment should hold to guard against potentially large losses that could cause insolvency. It is based on a measurement of economic risk, as opposed to risk as defined by regulatory bodies. The economic capital measurement process involves converting a risk distribution to the capital that is required to support the risk, consistent with our target credit rating. As such, economic risk serves as a common currency of risk that allows us to compare different risks on a similar basis.
Effective duration - A measurement, expressed in years, that, when multiplied by a change in interest rates, would approximate the percentage change in value of on- and off- balance sheet positions.
Efficiency - Noninterest expense divided by the sum of net interest income (GAAP basis) and noninterest income.
62
Fair value - The price that would be received to sell an asset or the price that would be paid to transfer a liability on the measurement date using the principal or most advantageous market for the asset or liability in an orderly transaction between willing market participants.
Foreign exchange contracts - Contracts that provide for the future receipt and delivery of foreign currency at previously agreed-upon terms.
Funds transfer pricing - A management accounting methodology designed to recognize the net interest income effects of sources and uses of funds provided by the assets and liabilities of a business segment. We assign these balances LIBOR-based funding rates at origination that represent the interest cost for us to raise/invest funds with similar maturity and repricing structures.
Futures and forward contracts - Contracts in which the buyer agrees to purchase and the seller agrees to deliver a specific financial instrument at a predetermined price or yield. May be settled either in cash or by delivery of the underlying financial instrument.
GAAP - Accounting principles generally accepted in the United States of America.
Impaired loans - Acquired loans determined to be credit impaired under AICPA Statement of Position 03-3, Accounting for Certain Loans or Debt Securities Acquired in a Transfer. Loans are determined to be impaired if there is evidence of credit deterioration since origination and for which it is probable that all contractually required payments will not be collected.
Interest rate floors and caps - Interest rate protection instruments that involve payment from the protection seller to the protection buyer of an interest differential, which represents the difference between a short-term rate (e.g., three-month LIBOR) and an agreed-upon rate (the strike rate) applied to a notional principal amount.
Interest rate swap contracts - Contracts that are entered into primarily as an asset/liability management strategy to reduce interest rate risk. Interest rate swap contracts are exchanges of interest rate payments, such as fixed-rate payments for floating-rate payments, based on notional principal amounts.
Intrinsic value - The amount by which the fair value of an underlying stock exceeds the exercise price of an option on that stock.
Investment securities - Collectively, securities available for sale and securities held to maturity.
Leverage ratio - Tier 1 risk-based capital divided by adjusted average total assets.
LIBOR - Acronym for London InterBank Offered Rate. LIBOR is the average interest rate charged when banks in the London wholesale money market (or interbank market) borrow unsecured funds from each other. LIBOR rates are used as a benchmark for interest rates on a global basis.
Net interest income from loans and deposits - A management accounting assessment, using funds transfer pricing methodology, of the net interest contribution from loans and deposits.
Net interest margin - Annualized taxable-equivalent net interest income divided by average earning assets.
Nondiscretionary assets under administration - Assets we hold for our customers/clients in a non-discretionary, custodial capacity. We do not include these assets on our Consolidated Balance Sheet.
Noninterest income to total revenue - Noninterest income divided by the sum of net interest income (GAAP basis) and noninterest income.
Nonperforming assets - Nonperforming assets include nonaccrual loans, troubled debt restructured loans, foreclosed assets and other assets. We do not accrue interest income on assets classified as nonperforming.
Nonperforming loans - Nonperforming loans include loans to commercial, commercial real estate, equipment lease financing, consumer, and residential mortgage customers and construction customers as well as troubled debt restructured loans. Nonperforming loans do not include loans held for sale or foreclosed and other assets. We do not accrue interest income on loans classified as nonperforming.
Notional amount - A number of currency units, shares, or other units specified in a derivatives contract.
Operating leverage - The period to period dollar or percentage change in total revenue (GAAP basis) less the dollar or percentage change in noninterest expense. A positive variance indicates that revenue growth exceeded expense growth (i.e., positive operating leverage) while a negative variance implies expense growth exceeded revenue growth (i.e., negative operating leverage).
Options - Contracts that grant the purchaser, for a premium payment, the right, but not the obligation, to either purchase or sell the associated financial instrument at a set price during a specified period or at a specified date in the future.
63
Other-than-temporary impairment - Impairment occurs when the fair value of a security is less than its cost. The impairment is considered other-than-temporary when it is probable that the holder will be unable to collect all amounts due according to contractual terms of a debt security at acquisition. A few factors that are considered to determine whether a decline in fair value is other than temporary may include a) the length of the time and the extent to which the market value has been less than cost; b) the financial condition and near-term prospects of the issuer, including any specific events which may influence the operations of the issuer such as changes in technology that may impair the earnings potential of the investment or the discontinuance of a segment of the business that may affect the future earnings potential; or c) the intent and ability of the holder to retain its investment in the issuer for a period of time sufficient to allow for any anticipated recovery in market value.
Securities determined to be other-than-temporary impaired are written down to fair value with the loss recognized in income during the period in which the assessment is made. The fair value would take into account credit and liquidity risk.
Recovery - Cash proceeds received on a loan that we had previously charged off. We credit the amount received to the allowance for loan and lease losses.
Return on average assets - Annualized net income divided by average assets.
Return on average capital - Annualized net income divided by average capital.
Return on average common shareholders equity - Annualized net income less preferred stock dividends divided by average common shareholders equity.
Risk-weighted assets - Primarily computed by the assignment of specific risk-weights (as defined by the Board of Governors of the Federal Reserve System) to assets and off-balance sheet instruments.
Securitization - The process of legally transforming financial assets into securities.
Servicing rights - An intangible asset or liability created by an obligation to service assets for others. Typical servicing rights include the right to receive a fee for collecting and forwarding payments on loans and related taxes and insurance premiums held in escrow.
Swaptions - Contracts that grant the purchaser, for a premium payment, the right, but not the obligation, to enter into an interest rate swap agreement during a specified period or at a specified date in the future.
Taxable-equivalent interest - The interest income earned on certain assets is completely or partially exempt from federal income tax. As such, these tax-exempt instruments typically yield lower returns than taxable investments. To provide more meaningful comparisons of yields and margins for all interest-earning assets, we use interest income on a taxable-equivalent basis in calculating average yields and net interest margins by increasing the interest income earned on tax-exempt assets to make it fully equivalent to interest income earned on other taxable investments. This adjustment is not permitted under GAAP on the Consolidated Income Statement.
Tier 1 risk-based capital - Tier 1 risk-based capital equals: total shareholders equity, plus trust preferred capital securities, plus certain noncontrolling interests that are held by others; less goodwill and certain other intangible assets (net of eligible deferred taxes relating to taxable and nontaxable combinations), less equity investments in nonfinancial companies less ineligible servicing assets and less net unrealized holding losses on available for sale equity securities. Net unrealized holding gains on available for sale equity securities, net unrealized holding gains (losses) on available for sale debt securities and net unrealized holding gains (losses) on cash flow hedge derivatives are excluded from total shareholders equity for Tier 1 risk-based capital purposes.
Tier 1 risk-based capital ratio - Tier 1 risk-based capital divided by period-end risk-weighted assets.
Total fund assets serviced - Total domestic and offshore fund investment assets for which we provide related processing services. We do not include these assets on our Consolidated Balance Sheet.
Total return swap - A non-traditional swap where one party agrees to pay the other the total return of a defined underlying asset (e.g., a loan), usually in return for receiving a stream of LIBOR-based cash flows. The total returns of the asset, including interest and any default shortfall, are passed through to the counterparty. The counterparty is therefore assuming the credit and economic risk of the underlying asset.
Total risk-based capital - Tier 1 risk-based capital plus qualifying subordinated debt and trust preferred securities, other noncontrolling interests not qualified as Tier 1, eligible gains on available for sale equity securities and the allowance for loan and lease losses, subject to certain limitations.
Total risk-based capital ratio - Total risk-based capital divided by period-end risk-weighted assets.
64
Transaction deposits - The sum of money market and interest-bearing demand deposits and demand and other noninterest-bearing deposits.
Value-at-risk (VaR) - A statistically-based measure of risk which describes the amount of potential loss which may be incurred due to severe and adverse market movements. The measure is of the maximum loss which should not be exceeded on 99 out of 100 days.
Watchlist - A list of criticized loans, credit exposure or other assets compiled for internal monitoring purposes. We define criticized exposure for this purpose as exposure with an internal risk rating of other assets especially mentioned, substandard, doubtful or loss.
Yield curve - A graph showing the relationship between the yields on financial instruments or market indices of the same credit quality with different maturities. For example, a normal or positive yield curve exists when long-term bonds have higher yields than short-term bonds. A flat yield curve exists when yields are the same for short-term and long-term bonds. A steep yield curve exists when yields on long-term bonds are significantly higher than on short-term bonds. An inverted or negative yield curve exists when short-term bonds have higher yields than long-term bonds.
CAUTIONARY STATEMENT REGARDING FORWARD-LOOKING INFORMATION
We make statements in this Exhibit 99.1, and we may from time to time make other statements, regarding our outlook or expectations for earnings, revenues, expenses, capital levels, liquidity levels, asset quality and/or other matters regarding or affecting PNC that are forward-looking statements within the meaning of the Private Securities Litigation Reform Act. Forward-looking statements are typically identified by words such as believe, expect, anticipate, intend, outlook, estimate, forecast, will, project and other similar words and expressions.
Forward-looking statements are subject to numerous assumptions, risks and uncertainties, which change over time. Forward-looking statements speak only as of the date they are made. We do not assume any duty and do not undertake to update our forward-looking statements. Actual results or future events could differ, possibly materially, from those that we anticipated in our forward-looking statements, and future results could differ materially from our historical performance.
Our forward-looking statements are subject to the following principal risks and uncertainties. We provide greater detail regarding some of these factors elsewhere in this Exhibit 99.1, including in the Risk Management section of the MD&A and in Item 1A - Risk Factors in our 2008 Form 10-K. Our forward-looking statements may also be subject to other risks and uncertainties, including those discussed elsewhere in this Exhibit 99.1 or in our other filings with the SEC.
| | Our businesses and financial results are affected by business and economic conditions, both generally and specifically in the principal markets in which we operate. In particular, our businesses and financial results may be impacted by: |
| | Changes in interest rates and valuations in the debt, equity and other financial markets. |
| | Disruptions in the liquidity and other functioning of financial markets, including such disruptions in the markets for real estate and other assets commonly securing financial products. |
| | Actions by the Federal Reserve and other government agencies, including those that impact money supply and market interest rates. |
| | Changes in our customers, suppliers and other counterparties performance in general and their creditworthiness in particular. |
| | Changes in customer preferences and behavior, whether as a result of changing business and economic conditions or other factors. |
| | A continuation of recent turbulence in significant portions of the US and global financial markets, particularly if it worsens, could impact our performance, both directly by affecting our revenues and the value of our assets and liabilities and indirectly by affecting our counterparties and the economy generally. |
| | Our business and financial performance could be impacted as the financial industry restructures in the current environment, both by changes in the creditworthiness and performance of our counterparties and by changes in the competitive landscape. |
| | Given current economic and financial market conditions, our forward-looking financial statements are subject to the risk that these conditions will be substantially different than we are currently expecting. These statements are based on our current expectations that interest rates will remain low through 2009 with continued wide market credit spreads, and our view that national economic trends currently point to a continuation of severe recessionary conditions in 2009 followed by a subdued recovery. |
| | Legal and regulatory developments could have an impact on our ability to operate our businesses or our financial condition or results of operations or our competitive position or reputation. Reputational impacts, in turn, could affect matters such as business generation and retention, our ability to attract and retain management, liquidity, and funding. These legal and regulatory developments could include: |
| | Changes resulting from the Emergency Economic Stabilization Act of 2008, the American Recovery and Reinvestment Act of 2009, and other |
65
| developments in response to the current economic and financial industry environment, including current and future conditions or restrictions imposed as a result of our participation in the TARP Capital Purchase Program. |
| | Legislative and regulatory reforms generally, including changes to laws and regulations involving tax, pension, bankruptcy, consumer protection, and other aspects of the financial institution industry. |
| | Increased litigation risk from recent regulatory and other governmental developments. |
| | Unfavorable resolution of legal proceedings or regulatory and other governmental inquiries. |
| | The results of the regulatory examination and supervision process, including our failure to satisfy the requirements of agreements with governmental agencies. |
| | Changes in accounting policies and principles. |
| | Our issuance of securities to the US Department of the Treasury may limit our ability to return capital to our shareholders and is dilutive to our common shares. If we are unable previously to redeem the shares, the dividend rate increases substantially after five years. |
| | Our business and operating results are affected by our ability to identify and effectively manage risks inherent in our businesses, including, where appropriate, through the effective use of third-party insurance, derivatives, and capital management techniques. |
| | The adequacy of our intellectual property protection, and the extent of any costs associated with obtaining rights in intellectual property claimed by others, can impact our business and operating results. |
| | Our ability to anticipate and respond to technological changes can have an impact on our ability to respond to customer needs and to meet competitive demands. |
| | Our ability to implement our business initiatives and strategies could affect our financial performance over the next several years. |
| | Competition can have an impact on customer acquisition, growth and retention, as well as on our credit spreads and product pricing, which can affect market share, deposits and revenues. |
| | Our business and operating results can also be affected by widespread natural disasters, terrorist activities or international hostilities, either as a result of the impact on the economy and capital and other financial markets generally or on us or on our customers, suppliers or other counterparties specifically. |
| | Also, risks and uncertainties that could affect the results anticipated in forward-looking statements or from historical performance relating to our equity interest in BlackRock, Inc. are discussed in more detail in BlackRocks filings with the SEC, including in the Risk Factors sections of BlackRocks reports. BlackRocks SEC filings are accessible on the SECs website and on or through BlackRocks website at www.blackrock.com. This material is referenced for informational purposes only and should not be deemed to constitute a part of this Exhibit 99.1. |
In addition, our recent acquisition of National City Corporation (National City) presents us with a number of risks and uncertainties related both to the acquisition transaction itself and to the integration of the acquired businesses into PNC. These risks and uncertainties include the following:
| | The transaction may be substantially more expensive to complete (including the required divestitures and the integration of National Citys businesses) and the anticipated benefits, including anticipated cost savings and strategic gains, may be significantly harder or take longer to achieve than expected or may not be achieved in their entirety as a result of unexpected factors or events. |
| | Our ability to achieve anticipated results from this transaction is dependent on the state going forward of the economic and financial markets, which have been under significant stress recently. Specifically, we may incur more credit losses from National Citys loan portfolio than expected. Other issues related to achieving anticipated financial results include the possibility that deposit attrition or attrition in key client, partner and other relationships may be greater than expected. |
| | Litigation and governmental investigations currently pending against National City, as well as others that may be filed or commenced relating to National Citys business and activities before the acquisition could adversely impact our financial results. |
66
| | Our ability to achieve anticipated results is also dependent on our ability to bring National Citys systems, operating models, and controls into conformity with ours and to do so on our planned time schedule. The integration of National Citys business and operations into PNC, which will include conversion of National Citys different systems and procedures, may take longer than anticipated or be more costly than anticipated or have unanticipated adverse results relating to National Citys or PNCs existing businesses. PNCs ability to integrate National City successfully may be adversely affected by the fact that this transaction will result in PNC entering several markets where PNC did not previously have any meaningful retail presence. |
In addition to the National City transaction, we grow our business from time to time by acquiring other financial services companies. Acquisitions in general present us with risks, in addition to those presented by the nature of the business acquired, similar to some or all of those described above relating to the National City acquisition.
CONSOLIDATED FINANCIAL STATEMENTS
Included below is the report of our current independent registered public accounting firm. The report of our previous independent registered public accounting firm follows the consolidated financial statements presented below.
REPORT OF INDEPENDENT REGISTERED PUBLIC ACCOUNTING FIRM
To the Board of Directors and Shareholders of The PNC Financial Services Group, Inc.
In our opinion, the accompanying consolidated balance sheets and the related consolidated statements of income, changes in equity, and cash flows present fairly, in all material respects, the financial position of The PNC Financial Services Group, Inc. and its subsidiaries (the Company) at December 31, 2008 and 2007, and the results of their operations and their cash flows for the years then ended in conformity with accounting principles generally accepted in the United States of America. Also in our opinion, the Company maintained, in all material respects, effective internal control over financial reporting as of December 31, 2008, based on criteria established in Internal Control - Integrated Framework issued by the Committee of Sponsoring Organizations of the Treadway Commission (COSO). The Companys management is responsible for these financial statements, for maintaining effective internal control over financial reporting and for its assessment of the effectiveness of internal control over financial reporting, included in Managements Report on Internal Control over Financial Reporting (not presented herein) appearing under Item 9A of the Companys 2008 Annual Report on Form 10-K. Our responsibility is to express opinions on these financial statements and on the Companys internal control over financial reporting based on our integrated audits. We conducted our audits in accordance with the standards of the Public Company Accounting Oversight Board (United States). Those standards require that we plan and perform the audits to obtain reasonable assurance about whether the financial statements are free of material misstatement and whether effective internal control over financial reporting was maintained in all material respects. Our audits of the financial statements included examining, on a test basis, evidence supporting the amounts and disclosures in the financial statements, assessing the accounting principles used and significant estimates made by management, and evaluating the overall financial statement presentation. Our audit of internal control over financial reporting included obtaining an understanding of internal control over financial reporting, assessing the risk that a material weakness exists, and testing and evaluating the design and operating effectiveness of internal control based on the assessed risk. Our audits also included performing such other procedures as we considered necessary in the circumstances. We believe that our audits provide a reasonable basis for our opinions.
As described in Note 1 to the consolidated financial statements, the Company changed the manner in which it accounts for noncontrolling interests and the manner in which it accounts for earnings per share effective January 1, 2009.
We also have audited the adjustments to the 2006 financial statements to retrospectively apply the change in reportable segments as described in Note 27 and the change in accounting for noncontrolling interests and earnings per share as described in Note 1. In our opinion, such adjustments are appropriate and have been properly applied. We were not engaged to audit, review, or apply any procedures to the 2006 financial statements of the Company other than with respect to the adjustments and, accordingly, we do not express an opinion or any other form of assurance on the 2006 financial statements taken as a whole.
A companys internal control over financial reporting is a process designed to provide reasonable assurance regarding the reliability of financial reporting and the preparation of financial statements for external purposes in accordance with generally accepted accounting principles. A companys internal control over financial reporting includes those policies and procedures that (i) pertain to the maintenance of records that, in reasonable detail, accurately and fairly reflect the transactions and dispositions of the assets of the company; (ii) provide reasonable assurance that transactions are recorded as necessary to permit preparation of financial statements in accordance with generally accepted accounting principles, and that receipts and expenditures of the company are being made only in accordance with authorizations of management and directors of the company; and (iii) provide reasonable assurance regarding prevention or timely detection of unauthorized acquisition, use, or disposition of the companys assets that could have a material effect on the financial statements.
67
Because of its inherent limitations, internal control over financial reporting may not prevent or detect misstatements. Also, projections of any evaluation of effectiveness to future periods are subject to the risk that controls may become inadequate because of changes in conditions, or that the degree of compliance with the policies or procedures may deteriorate.
As described in Managements Report on Internal Control over Financial Reporting, management has excluded National City Corporation from its assessment of internal control over financial reporting as of December 31, 2008 because it was acquired by the Company in a purchase business combination on December 31, 2008. We have also excluded National City Corporation from our audit of internal control over financial reporting. National City Corporations total assets represented $136 billion of the related consolidated financial statement amount as of December 31, 2008.
| /s/ PricewaterhouseCoopers LLP |
||||
| Pittsburgh, Pennsylvania | ||||
| March 2, 2009, except with respect to our opinion on the consolidated financial statements insofar as it relates to the effects of the change in accounting for noncontrolling interests and earnings per share described in Note 1 and the change in reportable segments described in Note 27, as to which the date is January 15, 2010. | ||||
68
CONSOLIDATED INCOME STATEMENT
THE PNC FINANCIAL SERVICES GROUP, INC.
| Year ended December 31 | ||||||||||||
| In millions, except per share data | 2008 | 2007 | 2006 | |||||||||
| Interest Income |
||||||||||||
| Loans |
$ | 4,138 | $ | 4,232 | $ | 3,203 | ||||||
| Investment securities |
1,746 | 1,429 | 1,049 | |||||||||
| Other |
429 | 505 | 360 | |||||||||
| Total interest income |
6,313 | 6,166 | 4,612 | |||||||||
| Interest Expense |
||||||||||||
| Deposits |
1,485 | 2,053 | 1,590 | |||||||||
| Borrowed funds |
1,005 | 1,198 | 777 | |||||||||
| Total interest expense |
2,490 | 3,251 | 2,367 | |||||||||
| Net interest income |
3,823 | 2,915 | 2,245 | |||||||||
| Noninterest Income |
||||||||||||
| Fund servicing |
904 | 835 | 893 | |||||||||
| Asset management |
686 | 784 | 1,420 | |||||||||
| Consumer services |
623 | 692 | 611 | |||||||||
| Corporate services |
704 | 713 | 626 | |||||||||
| Service charges on deposits |
372 | 348 | 313 | |||||||||
| Net securities losses |
(206 | ) | (5 | ) | (207 | ) | ||||||
| Gain on BlackRock/MLIM transaction |
2,078 | |||||||||||
| Other |
284 | 423 | 593 | |||||||||
| Total noninterest income |
3,367 | 3,790 | 6,327 | |||||||||
| Total revenue |
7,190 | 6,705 | 8,572 | |||||||||
| Provision for credit losses |
1,517 | 315 | 124 | |||||||||
| Noninterest Expense |
||||||||||||
| Personnel |
2,154 | 2,140 | 2,432 | |||||||||
| Occupancy |
368 | 350 | 310 | |||||||||
| Equipment |
359 | 311 | 303 | |||||||||
| Marketing |
125 | 115 | 104 | |||||||||
| Other |
1,392 | 1,356 | 1,337 | |||||||||
| Total noninterest expense |
4,398 | 4,272 | 4,486 | |||||||||
| Income before income taxes and noncontrolling interests |
1,275 | 2,118 | 3,962 | |||||||||
| Income taxes |
361 | 627 | 1,363 | |||||||||
| Net income |
914 | 1,491 | 2,599 | |||||||||
| Less: Net income attributable to noncontrolling interests |
32 | 24 | 4 | |||||||||
| Preferred stock dividends |
21 | 1 | ||||||||||
| Net income attributable to common shareholders |
$ | 861 | $ | 1,467 | $ | 2,594 | ||||||
| Earnings Per Common Share |
||||||||||||
| Basic |
$ | 2.49 | $ | 4.40 | $ | 8.81 | ||||||
| Diluted |
$ | 2.44 | $ | 4.32 | $ | 8.71 | ||||||
| Average Common Shares Outstanding |
||||||||||||
| Basic |
344 | 331 | 292 | |||||||||
| Diluted |
346 | 334 | 295 | |||||||||
See accompanying Notes To Consolidated Financial Statements.
69
CONSOLIDATED BALANCE SHEET
THE PNC FINANCIAL SERVICES GROUP, INC.
| December 31 | ||||||||
| In millions, except par value | 2008 | 2007 | ||||||
| Assets |
||||||||
| Cash and due from banks |
$ | 4,471 | $ | 3,567 | ||||
| Federal funds sold and resale agreements (includes $1,072 measured at fair value at December 31, 2008) (a) |
1,856 | 2,729 | ||||||
| Trading securities |
1,725 | 3,556 | ||||||
| Interest-earning deposits with banks |
14,859 | 346 | ||||||
| Other short-term investments |
1,025 | 227 | ||||||
| Loans held for sale (includes $1,400 measured at fair value at December 31, 2008) (a) |
4,366 | 3,927 | ||||||
| Investment securities |
43,473 | 30,225 | ||||||
| Loans |
175,489 | 68,319 | ||||||
| Allowance for loan and lease losses |
(3,917 | ) | (830 | ) | ||||
| Net loans |
171,572 | 67,489 | ||||||
| Goodwill |
8,868 | 8,405 | ||||||
| Other intangible assets |
2,820 | 1,146 | ||||||
| Equity investments |
8,554 | 6,045 | ||||||
| Other |
27,492 | 11,258 | ||||||
| Total assets |
$ | 291,081 | $ | 138,920 | ||||
| Liabilities |
||||||||
| Deposits |
||||||||
| Noninterest-bearing |
$ | 37,148 | $ | 19,440 | ||||
| Interest-bearing |
155,717 | 63,256 | ||||||
| Total deposits |
192,865 | 82,696 | ||||||
| Borrowed funds |
||||||||
| Federal funds purchased and repurchase agreements |
5,153 | 9,774 | ||||||
| Federal Home Loan Bank borrowings |
18,126 | 7,065 | ||||||
| Bank notes and senior debt |
13,664 | 6,821 | ||||||
| Subordinated debt |
11,208 | 4,506 | ||||||
| Other |
4,089 | 2,765 | ||||||
| Total borrowed funds |
52,240 | 30,931 | ||||||
| Allowance for unfunded loan commitments and letters of credit |
344 | 134 | ||||||
| Accrued expenses |
3,949 | 4,330 | ||||||
| Other |
14,035 | 4,321 | ||||||
| Total liabilities |
263,433 | 122,412 | ||||||
| Equity |
||||||||
| Preferred stock (b) |
||||||||
| Common stock $5 par value |
||||||||
| Authorized 800 shares, issued 452 and 353 shares |
2,261 | 1,764 | ||||||
| Capital surplus preferred stock |
7,918 | |||||||
| Capital surplus common stock and other |
8,328 | 2,618 | ||||||
| Retained earnings |
11,461 | 11,497 | ||||||
| Accumulated other comprehensive loss |
(3,949 | ) | (147 | ) | ||||
| Common stock held in treasury at cost: 9 and 12 shares |
(597 | ) | (878 | ) | ||||
| Total shareholders equity |
25,422 | 14,854 | ||||||
| Noncontrolling interests |
2,226 | 1,654 | ||||||
| Total equity |
27,648 | 16,508 | ||||||
| Total liabilities and equity |
$ | 291,081 | $ | 138,920 | ||||
| (a) | Amounts represent items for which the Corporation has elected the fair value option under SFAS 159. |
| (b) | Par value less than $.5 million at each date. |
See accompanying Notes To Consolidated Financial Statements.
70
CONSOLIDATED STATEMENT OF CHANGES IN EQUITY
THE PNC FINANCIAL SERVICES GROUP, INC.
| In millions | Shares Outstanding Stock |
Common Stock |
Capital Surplus - Preferred Stock |
Capital Surplus - Common Stock and Other |
Retained Earnings |
Accumulated Other Comprehensive Income (Loss) |
Treasury Stock |
Noncontrolling Interests |
Total Equity |
|||||||||||||||||||||||
| Balance at January 1, 2006 (a) |
293 | $ | 1,764 | $ | 1,299 | $ | 9,023 | $ | (267 | ) | $ | (3,256 | ) | $ | 590 | $ | 9,153 | |||||||||||||||
| Net income |
2,595 | 4 | 2,599 | |||||||||||||||||||||||||||||
| Net unrealized securities losses |
149 | 149 | ||||||||||||||||||||||||||||||
| Net unrealized losses on cash flow hedge derivatives |
13 | 13 | ||||||||||||||||||||||||||||||
| Additional minimum pension liability under SFAS 87 |
(1 | ) | (1 | ) | ||||||||||||||||||||||||||||
| Other |
3 | 3 | ||||||||||||||||||||||||||||||
| Comprehensive income |
4 | 2,763 | ||||||||||||||||||||||||||||||
| Cash dividends declared |
||||||||||||||||||||||||||||||||
| Common |
(632 | ) | (632 | ) | ||||||||||||||||||||||||||||
| Preferred |
(1 | ) | (1 | ) | ||||||||||||||||||||||||||||
| BlackRock/MLIM transaction (b) |
262 | 262 | ||||||||||||||||||||||||||||||
| Treasury stock activity (c) |
(12 | ) | (121 | ) | (133 | ) | ||||||||||||||||||||||||||
| Tax benefit of stock option plans |
29 | 29 | ||||||||||||||||||||||||||||||
| Stock options granted |
31 | 31 | ||||||||||||||||||||||||||||||
| Effect of BlackRock equity transactions |
27 | 27 | ||||||||||||||||||||||||||||||
| Restricted stock/unit and incentive/ performance unit share transactions |
15 | 15 | ||||||||||||||||||||||||||||||
| Net effect of adopting SFAS 158 |
(132 | ) | (132 | ) | ||||||||||||||||||||||||||||
| Other |
291 | 291 | ||||||||||||||||||||||||||||||
| Balance at December 31, 2006 (a) |
293 | $ | 1,764 | $ | 0 | $ | 1,651 | $ | 10,985 | $ | (235 | ) | $ | (3,377 | ) | $ | 885 | $ | 11,673 | |||||||||||||
| Net income |
1,467 | 24 | 1,491 | |||||||||||||||||||||||||||||
| Net unrealized securities losses |
(76 | ) | (76 | ) | ||||||||||||||||||||||||||||
| Net unrealized gains on cash flow hedge derivatives |
188 | 188 | ||||||||||||||||||||||||||||||
| Pension, other postretirement and postemployment benefit plan adjustments |
(29 | ) | (29 | ) | ||||||||||||||||||||||||||||
| Other |
5 | 5 | ||||||||||||||||||||||||||||||
| Comprehensive income |
24 | 1,579 | ||||||||||||||||||||||||||||||
| Cash dividends declared common |
(806 | ) | (806 | ) | ||||||||||||||||||||||||||||
| Net effect of adopting FSP FAS 13-2 |
(149 | ) | (149 | ) | ||||||||||||||||||||||||||||
| Treasury stock issued for acquisitions |
56 | 872 | 3,147 | 4,019 | ||||||||||||||||||||||||||||
| Treasury stock activity all other |
(8 | ) | (17 | ) | (648 | ) | (665 | ) | ||||||||||||||||||||||||
| Tax benefit of stock option plans |
18 | 18 | ||||||||||||||||||||||||||||||
| Stock options granted |
28 | 28 | ||||||||||||||||||||||||||||||
| Effect of BlackRock equity transactions |
53 | 53 | ||||||||||||||||||||||||||||||
| Restricted stock/unit and incentive/ performance unit share transactions |
13 | 13 | ||||||||||||||||||||||||||||||
| Other |
745 | 745 | ||||||||||||||||||||||||||||||
| Balance at December 31, 2007 (a) |
341 | $ | 1,764 | $ | 0 | $ | 2,618 | $ | 11,497 | $ | (147 | ) | $ | (878 | ) | $ | 1,654 | $ | 16,508 | |||||||||||||
| Net effect of adopting EITF 06-4 |
(12 | ) | (12 | ) | ||||||||||||||||||||||||||||
| Net effect of adopting SFAS 157 and SFAS 159 |
17 | 17 | ||||||||||||||||||||||||||||||
| Balance at January 1, 2008 |
341 | $ | 1,764 | $ | 2,618 | $ | 11,502 | $ | (147 | ) | $ | (878 | ) | $ | 1,654 | $ | 16,513 | |||||||||||||||
| Net income |
882 | 32 | 914 | |||||||||||||||||||||||||||||
| Other comprehensive income (loss), net of tax |
||||||||||||||||||||||||||||||||
| Net unrealized securities losses |
(3,459 | ) | (3,459 | ) | ||||||||||||||||||||||||||||
| Net unrealized gains on cash flow hedge derivatives |
199 | 199 | ||||||||||||||||||||||||||||||
| Pension, other postretirement and postemployment benefit plan adjustments |
(490 | ) | (490 | ) | ||||||||||||||||||||||||||||
| Other |
(52 | ) | (52 | ) | ||||||||||||||||||||||||||||
| Comprehensive income (loss) |
32 | (2,888 | ) | |||||||||||||||||||||||||||||
| Cash dividends declared |
||||||||||||||||||||||||||||||||
| Common |
(902 | ) | (902 | ) | ||||||||||||||||||||||||||||
| Preferred |
(21 | ) | (21 | ) | ||||||||||||||||||||||||||||
| Common stock activity acquisition |
99 | 497 | 5,419 | 5,916 | ||||||||||||||||||||||||||||
| Treasury stock activity |
3 | (110 | ) | 281 | 171 | |||||||||||||||||||||||||||
| Preferred stock issuance Series K |
493 | 493 | ||||||||||||||||||||||||||||||
| Preferred stock issuance Series L |
150 | 150 | ||||||||||||||||||||||||||||||
| Preferred stock issuance Series N (d) |
7,275 | 7,275 | ||||||||||||||||||||||||||||||
| TARP Warrant (d) |
304 | 304 | ||||||||||||||||||||||||||||||
| Tax benefit of stock option plans |
17 | 17 | ||||||||||||||||||||||||||||||
| Stock options granted |
22 | 22 | ||||||||||||||||||||||||||||||
| Effect of BlackRock equity transactions |
43 | 43 | ||||||||||||||||||||||||||||||
| Restricted stock/unit and incentive/ performance unit share transactions |
15 | 15 | ||||||||||||||||||||||||||||||
| Other |
540 | 540 | ||||||||||||||||||||||||||||||
| Balance at December 31, 2008 (a) |
443 | $ | 2,261 | $ | 7,918 | $ | 8,328 | $ | 11,461 | $ | (3,949 | ) | $ | (597 | ) | $ | 2,226 | $ | 27,648 | |||||||||||||
| (a) | The par value of our our preferred stock outstanding was less than $.5 million at each date and, therefore, is excluded from this presentation. |
| (b) | Represents the portion of our gain on the BlackRock/MLIM transaction that was credited to capital surplus. |
| (c) | Our net treasury stock activity in 2006 was less than .1 million shares issued. |
| (d) | Issued to the US Department of Treasury on December 31, 2008 under the TARP Capital Purchase Program. |
See accompanying Notes To Consolidated Financial Statements.
71
CONSOLIDATED STATEMENT OF CASH FLOWS
THE PNC FINANCIAL SERVICES GROUP, INC.
| Year ended December 31 | ||||||||||||
| In millions | 2008 | 2007 | 2006 | |||||||||
| Operating Activities |
||||||||||||
| Net income |
$ | 914 | $ | 1,491 | $ | 2,599 | ||||||
| Adjustments to reconcile net income to net cash provided by operating activities |
||||||||||||
| Provision for credit losses |
1,517 | 315 | 124 | |||||||||
| Depreciation, amortization and accretion |
325 | 332 | 345 | |||||||||
| Deferred income taxes (benefit) |
(261 | ) | 78 | 752 | ||||||||
| Net securities losses |
206 | 5 | 207 | |||||||||
| Loan related valuation adjustments |
253 | 24 | 45 | |||||||||
| Gain on BlackRock/MLIM transaction |
(2,078 | ) | ||||||||||
| Net losses (gains) related to BlackRock LTIP shares adjustment |
(246 | ) | 127 | 12 | ||||||||
| Undistributed earnings of BlackRock |
(129 | ) | (207 | ) | (39 | ) | ||||||
| Visa redemption gain |
(95 | ) | ||||||||||
| Reversal of legal contingency reserve established in connection with an acquisition due to a settlement |
(61 | ) | ||||||||||
| Excess tax benefits from share-based payment arrangements |
(13 | ) | (15 | ) | (29 | ) | ||||||
| Net change in |
||||||||||||
| Trading securities and other short-term investments |
1,459 | (552 | ) | 156 | ||||||||
| Loans held for sale |
50 | (1,465 | ) | 435 | ||||||||
| Other assets |
(1,974 | ) | 37 | 173 | ||||||||
| Accrued expenses and other liabilities |
5,140 | (498 | ) | 83 | ||||||||
| Other |
329 | (88 | ) | (626 | ) | |||||||
| Net cash provided (used) by operating activities |
7,414 | (416 | ) | 2,159 | ||||||||
| Investing Activities |
||||||||||||
| Repayment of investment securities |
4,246 | 4,374 | 3,667 | |||||||||
| Sales |
||||||||||||
| Investment securities |
10,283 | 6,056 | 11,102 | |||||||||
| Visa shares |
95 | |||||||||||
| Loans |
76 | 329 | 1,110 | |||||||||
| Purchases |
||||||||||||
| Investment securities |
(19,482 | ) | (15,884 | ) | (15,707 | ) | ||||||
| Loans |
(249 | ) | (2,747 | ) | (3,072 | ) | ||||||
| Net change in |
||||||||||||
| Federal funds sold and resale agreements |
1,301 | (1,147 | ) | (1,413 | ) | |||||||
| Loans |
(4,595 | ) | (2,160 | ) | (278 | ) | ||||||
| Net cash received from divestitures |
377 | 59 | ||||||||||
| Net cash received from (paid for) acquisitions |
2,384 | (2,602 | ) | (58 | ) | |||||||
| Purchases of corporate and bank-owned life insurance |
(350 | ) | (117 | ) | (425 | ) | ||||||
| Interest-earning deposits with Federal Reserve |
(6,234 | ) | ||||||||||
| Other |
(838 | ) | (800 | ) | (288 | ) | ||||||
| Net cash used by investing activities |
(12,986 | ) | (14,639 | ) | (5,362 | ) | ||||||
| Financing Activities |
||||||||||||
| Net change in |
||||||||||||
| Noninterest-bearing deposits |
1,719 | 230 | 968 | |||||||||
| Interest-bearing deposits |
2,065 | 1,769 | 4,940 | |||||||||
| Federal funds purchased and repurchase agreements |
(8,081 | ) | 4,057 | (1,058 | ) | |||||||
| Federal Home Loan Bank short-term borrowings |
(2,000 | ) | 2,000 | |||||||||
| Other short-term borrowed funds |
840 | 514 | 239 | |||||||||
| Sales/issuances |
||||||||||||
| Federal Home Loan Bank long-term borrowings |
5,050 | 4,750 | ||||||||||
| Bank notes and senior debt |
3,626 | 4,523 | 1,964 | |||||||||
| Subordinated debt |
759 | 943 | ||||||||||
| Other long-term borrowed funds |
96 | 250 | 279 | |||||||||
| Perpetual trust securities |
369 | 490 | 489 | |||||||||
| Preferred stock TARP |
7,275 | |||||||||||
| Preferred stock Other |
492 | |||||||||||
| TARP Warrant |
304 | |||||||||||
| Treasury stock |
375 | 253 | 343 | |||||||||
| Repayments/maturities |
||||||||||||
| Federal Home Loan Bank long-term borrowings |
(1,158 | ) | (232 | ) | (1,124 | ) | ||||||
| Bank notes and senior debt |
(3,815 | ) | (1,590 | ) | (2,200 | ) | ||||||
| Subordinated debt |
(140 | ) | (887 | ) | (471 | ) | ||||||
| Other long-term borrowed funds |
(156 | ) | (217 | ) | (26 | ) | ||||||
| Excess tax benefits from share-based payment arrangements |
13 | 15 | 29 | |||||||||
| Acquisition of treasury stock |
(234 | ) | (963 | ) | (531 | ) | ||||||
| Cash dividends paid |
(923 | ) | (806 | ) | (633 | ) | ||||||
| Net cash provided by financing activities |
6,476 | 15,099 | 3,208 | |||||||||
| Net Increase In Cash And Due From Banks |
904 | 44 | 5 | |||||||||
| Cash and due from banks at beginning of period |
3,567 | 3,523 | 3,518 | |||||||||
| Cash and due from banks at end of period |
$ | 4,471 | $ | 3,567 | $ | 3,523 | ||||||
| Cash Paid For |
||||||||||||
| Interest |
$ | 2,145 | $ | 2,973 | $ | 2,376 | ||||||
| Income taxes |
706 | 659 | 471 | |||||||||
| Non-cash Items |
||||||||||||
| Issuance of common stock for acquisitions |
5,916 | 4,019 | ||||||||||
| Issuance of preferred stock for National City acquisition |
150 | |||||||||||
| Net increase in investment in BlackRock |
126 | 180 | 3,179 | |||||||||
| Transfer from (to) loans held for sale to (from) loans, net |
1,763 | (288 | ) | (2,280 | ) | |||||||
| Transfer from trading securities to investment securities |
599 | |||||||||||
| Impact of FSP FAS 13-2, Accounting for a Change or Projected Change in the Timing of Cash Flows Relating to Income Taxes Generated by a Leveraged Lease Transaction |
15 | 252 | ||||||||||
See accompanying Notes To Consolidated Financial Statements.
72
NOTES TO CONSOLIDATED FINANCIAL STATEMENTS
THE PNC FINANCIAL SERVICES GROUP, INC.
BUSINESS
PNC is one of the largest diversified financial services companies in the United States and is headquartered in Pittsburgh, Pennsylvania.
As described in Note 2 Acquisitions and Divestitures, on December 31, 2008, PNC acquired National City Corporation (National City), which increased our assets to a total of $291 billion and expanded our total consolidated deposits to $193 billion.
Prior to the acquisition, PNC had businesses engaged in retail banking, corporate and institutional banking, asset management, and global investment servicing, providing many of its products and services nationally and others in PNCs primary geographic markets located in Pennsylvania, New Jersey, Washington DC, Maryland, Virginia, Ohio, Kentucky and Delaware. PNC also provided certain investment servicing internationally.
National Citys primary businesses prior to its acquisition by PNC included commercial and retail banking, mortgage financing and servicing, consumer finance and asset management, operating through an extensive network in Ohio, Florida, Illinois, Indiana, Kentucky, Michigan, Missouri, Pennsylvania and Wisconsin. National City also conducted selected consumer lending businesses and other financial services on a nationwide basis.
PNC is now in the process of integrating the business and operations of National City with those of PNC.
NOTE 1 ACCOUNTING POLICIES
BASIS OF FINANCIAL STATEMENT PRESENTATION
Our consolidated financial statements include the accounts of the parent company and its subsidiaries, most of which are wholly owned, and certain partnership interests and variable interest entities.
On December 31, 2008, we acquired National City. Our Consolidated Balance Sheet as of December 31, 2008 and other consolidated information presented as of that date in the Consolidated Financial Statements includes the impact of National City. See Note 2 Acquisitions and Divestitures for additional information.
We prepared these consolidated financial statements in accordance with accounting principles generally accepted in the United States of America (generally accepted accounting principles or GAAP). We have eliminated intercompany accounts and transactions. We have also reclassified certain prior year amounts to conform with the 2008 presentation. These reclassifications did not have a material impact on our consolidated financial condition or results of operations.
Subsequent to the issuance of our 2006 Annual Report on Form 10-K, we determined that the Consolidated Statement of Cash Flows for the year ended December 31, 2006 should be restated. The cash flows related to the 2006 issuance of perpetual trust securities totaling $489 million had previously been classified within the Operating Activities section of the Consolidated Statement of Cash Flows. We concluded that such cash flows should have been classified within the Financing Activities section of the Consolidated Statement of Cash Flows and, accordingly, restated these amounts in Amendment No. 1 thereto on Form 10-K/A dated February 4, 2008. The Consolidated Statement of Cash Flows included in these Consolidated Financial Statements reflects this restatement.
USE OF ESTIMATES
We prepare the consolidated financial statements using financial information available at the time, which requires us to make estimates and assumptions that affect the amounts reported. Our most significant estimates pertain to our allowance for loan and lease losses, impaired loans, fair value measurements and revenue recognition. Actual results may differ from the estimates and the differences may be material to the consolidated financial statements.
BUSINESS COMBINATIONS
We record the net assets of companies that we acquire at their estimated fair value at the date of acquisition and we include the results of operations of the acquired companies in our consolidated income statement from the date of acquisition. We recognize as goodwill the excess of the acquisition price over the estimated fair value of the net assets acquired. The excess of the estimated fair value of net assets acquired over the acquisition price is allocated on a pro rata basis to reduce the fair value of intangibles and non-current assets acquired.
SUBSIDIARY STOCK TRANSACTIONS
We recognize as income, when appropriate, any gain from the sale or issuance by subsidiaries of their stock to third parties. The gain is the difference between our basis in the stock and the increase in the book value per share of the subsidiaries equity and is recorded in noninterest income in the Consolidated Income Statement. We provide applicable taxes on the gain.
73
SPECIAL PURPOSES ENTITIES
Special purpose entities (SPEs) are defined as legal entities structured for a particular purpose. We use special purpose entities in various legal forms to conduct normal business activities. We review the structure and activities of special purpose entities for possible consolidation under the guidance contained in Financial Accounting Standards Board (FASB) Interpretation No. 46 (Revised 2003), Consolidation of Variable Interest Entities (FIN 46R) and Accounting Research Bulletin No. 51, Consolidated Financial Statements, as appropriate.
A variable interest entity (VIE) is a corporation, partnership, limited liability company, or any other legal structure used to conduct activities or hold assets that either:
| | Does not have equity investors with voting rights that can directly or indirectly make decisions about the entitys activities through those voting rights or similar rights, or |
| | Has equity investors that do not provide sufficient equity for the entity to finance its activities without additional subordinated financial support. |
A VIE often holds financial assets, including loans or receivables, real estate or other property.
Based on the guidance contained in FIN 46R, we consolidate a VIE if we are considered to be its primary beneficiary. The primary beneficiary will absorb the majority of the expected losses from the VIEs activities, is entitled to receive a majority of the entitys residual returns, or both. Upon consolidation of a VIE, we recognize all of the VIEs assets, liabilities and noncontrolling interests on our Consolidated Balance Sheet. See Note 3 Variable Interest Entities for information about VIEs that we do not consolidate but in which we hold a significant variable interest.
REVENUE RECOGNITION
We earn net interest and noninterest income from various sources, including:
| | Lending, |
| | Securities portfolio, |
| | Asset management and fund servicing, |
| | Customer deposits, |
| | Loan servicing, |
| | Brokerage services, and |
| | Securities and derivatives trading activities, including foreign exchange. |
We also earn revenue from selling loans and securities, and we recognize income or loss from certain private equity activities.
We earn fees and commissions from:
| | Issuing loan commitments, standby letters of credit and financial guarantees, |
| | Selling various insurance products, |
| | Providing treasury management services, |
| | Providing merger and acquisition advisory and related services, and |
| | Participating in certain capital markets transactions. |
Revenue earned on interest-earning assets including net unearned income and the accretion of purchased loans is recognized based on the constant effective yield of the financial instrument.
Asset management fees are generally based on a percentage of the fair value of the assets under management and performance fees are generally based on a percentage of the returns on such assets. Certain performance fees are earned upon attaining specified investment return thresholds and are recorded as earned. The caption asset management also includes our share of the earnings of BlackRock under the equity method of accounting.
Fund servicing fees are primarily based on a percentage of the fair value of the fund assets and the number of shareholder accounts we service.
Service charges on deposit accounts are recognized when earned. Brokerage fees and gains and losses on the sale of securities and certain derivatives are recognized on a trade-date basis.
We record private equity income or loss based on changes in the valuation of the underlying investments or when we dispose of our interest. Dividend income from private equity investments is generally recognized when received and interest income from subordinated private equity debt investments is recorded on an accrual basis.
We recognize revenue from residential and commercial mortgage and other consumer loan servicing; securities and derivatives and foreign exchange trading; and securities underwriting activities as they are earned based on contractual terms, as transactions occur or as services are provided. We recognize any gains from the sale of loans upon cash settlement of the transaction.
74
When appropriate, revenue is reported net of associated expenses in accordance with GAAP.
CASH AND CASH EQUIVALENTS
Cash and due from banks are considered cash and cash equivalents for financial reporting purposes.
INVESTMENTS
We have interests in various types of investments. The accounting for these investments is dependent on a number of factors including, but not limited to, items such as:
| | Ownership interest, |
| | Our plans for the investment, and |
| | The nature of the investment. |
Debt Securities
Debt securities are recorded on a trade-date basis. We classify debt securities as held to maturity and carry them at amortized cost if we have the positive intent and ability to hold the securities to maturity. Debt securities that we purchase for short-term appreciation or other trading purposes are carried at fair value and classified as trading securities and other short-term investments on our Consolidated Balance Sheet. Realized and unrealized gains and losses on trading securities are included in other noninterest income.
Income earned from trading securities totaled $116 million in 2008, $116 million in 2007, and $62 million in 2006 and is included in Other interest income in the Consolidated Income Statement.
Debt securities not classified as held to maturity or trading are designated as securities available for sale and carried at fair value with unrealized gains and losses, net of income taxes, reflected in accumulated other comprehensive income (loss).
We review all debt securities that are in an unrealized loss position for other-than-temporary impairment. We evaluate outstanding available-for-sale and held-to maturity securities for other-than-temporary impairment on at least a quarterly basis. An investment security is deemed impaired if the fair value of the investment is less than its amortized cost. Amortized cost includes adjustments (if any) made to the cost basis of an investment for accretion, amortization, previous other-than-temporary impairments and hedging. After an investment security is determined to be impaired, we evaluate whether the decline in value is other than temporary. When evaluating whether the impairment is other-than-temporary, we take into consideration whether or not we expect to receive all of the contractual cash flows from the investment based on factors that include, but are not limited to: the creditworthiness of the issuer and, in the case of non-agency mortgage-backed securities, the historical and projected performance of the underlying collateral; the length of time and extent that fair value has been less than amortized cost; and our ability and intent to hold the investment for a sufficient amount of time to recover the unrealized losses. In addition, we may also evaluate the business and financial outlook of the issuer, as well as broader industry and sector performance indicators. Declines in the fair value of available for sale debt securities that are deemed other than temporary are recognized on our Consolidated Income Statement in net securities gains / (losses) in the period in which the determination is made. Such impairment charges include the impact of declines in both credit quality and liquidity.
We include all interest on debt securities, including amortization of premiums and accretion of discounts in net interest income using the constant effective yield method. We compute gains and losses realized on the sale of debt securities available for sale on a specific security basis and include them in net securities gains/(losses).
In very limited situations, due to market conditions, management may elect to transfer certain debt securities from the securities available for sale to the held-to-maturity classification. In such cases, any unrealized gain or loss at the date of transfer included in accumulated other comprehensive income is amortized over the remaining life of the security as a yield adjustment. This amortization effectively offsets or mitigates the effect on interest income of the amortization of the premium or discount on the security on the date of transfer.
Equity Securities and Partnership Interests
We account for equity securities and equity investments other than BlackRock and private equity investments under one of the following methods:
| | Marketable equity securities are recorded on a trade-date basis and are accounted for based on the securities quoted market prices from a national securities exchange. Dividend income on these securities is recognized in net interest income. Those purchased with the intention of recognizing short-term profits are classified as trading and included in trading securities and other short-term investments on our Consolidated Balance Sheet. Both realized and unrealized gains and losses on trading securities are included in noninterest income. Marketable equity securities not classified as trading are designated as securities available for sale with unrealized gains and losses, net of income taxes, reflected in accumulated other comprehensive income (loss). Any unrealized losses that we have determined to be other than temporary on securities classified as available for sale are recognized in current period earnings. |
75
| | For investments in limited partnerships, limited liability companies and other investments that are not required to be consolidated, we use either the cost method or the equity method of accounting. We use the cost method for investments in which we are not considered to have influence over the operations of the investee and when cost appropriately reflects our economic interest in the underlying investment. Under the cost method, there is no change to the cost basis unless there is an other than temporary decline in value. If the decline is determined to be other than temporary, we write down the cost basis of the investment to a new cost basis that represents realizable value. The amount of the write-down is accounted for as a loss included in other noninterest income. Distributions received from income of investee on cost method investments are included in interest income or noninterest income depending on the type of investment. We use the equity method for all other general and limited partner ownership interests and limited liability company investments. Under the equity method, we record our equity ownership share of net income or loss of the investee in noninterest income. Investments described above are included in the caption Equity investments on the Consolidated Balance Sheet. |
Private Equity Investments
We report private equity investments, which include direct investments in companies, affiliated partnership interests and indirect investments in private equity funds, at estimated fair value. These estimates are based on available information and may not necessarily represent amounts that we will ultimately realize through distribution, sale or liquidation of the investments. Fair value of publicly traded direct investments are determined using quoted market prices and are subject to various discount factors for sales restrictions, when appropriate. The valuation procedures applied to direct investments in private companies include techniques such as multiples of adjusted earnings of the entity, independent appraisals, anticipated financing and sale transactions with third parties, or the pricing used to value the entity in a recent financing transaction. We value affiliated partnership interests based on the underlying investments of the partnership using procedures consistent with those applied to direct investments. Indirect investments in private equity funds are valued based on the financial statements that we receive from their managers. Due to the time lag in our receipt of the financial information and based on a review of investments and valuation techniques applied, adjustments to the manager provided value are made when available recent portfolio company information or market information indicates a significant change in value from that provided by the manager of the fund. We include all private equity investments on the Consolidated Balance Sheet in the caption Equity investments. Changes in the fair value of private equity investments are recognized in noninterest income.
We consolidate private equity investments when we are the general partner in a limited partnership and have determined that we have control of the partnership. The portion we do not own is reflected in the caption Noncontrolling interests in consolidated entities on the Consolidated Balance Sheet.
Investment in BlackRock, Inc.
We deconsolidated the assets and liabilities of BlackRock, Inc. (BlackRock) from our Consolidated Balance Sheet effective September 29, 2006 and now account for our investment in BlackRock under the equity method of accounting. The investment in BlackRock is reflected on our Consolidated Balance Sheet in the caption Equity investments, while our equity in earnings of BlackRock is reported on our Consolidated Income Statement in the caption Asset management.
We mark to market our obligation to transfer BlackRock shares related to certain BlackRock long-term incentive plan (LTIP) programs. This obligation is classified as a free standing derivative as disclosed in Note 17 Financial Derivatives. As we transfer the shares for payouts under such LTIP programs, we recognize a gain or loss on those shares. The impact of those transactions is shown on a net basis on our Consolidated Income Statement in Other noninterest income. Our obligation to transfer BlackRock shares related to the LTIP programs and the resulting accounting are described in more detail in Note 2 Acquisitions and Divestitures.
LOANS AND LEASES
Loans are classified as held for investment when management has both the intent and ability to hold the loan for the foreseeable future, or until maturity or payoff. In conjunction with the acquisition of National City, management designated all acquired loans and leases as either held for investment or held for sale based on its current intent and view of the foreseeable future. Managements intent and view of the foreseeable future may change based on changes in business strategies, the economic environment and market conditions.
Except as described below, loans held for investment are stated at the principal amounts outstanding, net of unearned income, unamortized deferred fees and costs on originated loans, and premiums or discounts on loans purchased. Interest on performing loans is accrued based on the principal amount outstanding and recorded in interest income as earned using the constant effective yield method. Loan origination fees, direct loan origination costs, and loan premiums and discounts are deferred and accreted or amortized into net interest income, over periods not exceeding the contractual life of the loan.
Certain loans are accounted for at fair value in accordance with Statement of Financial Accounting Standards No. (SFAS) 155, Accounting for Certain Hybrid Financial Instruments an amendment of FASB Statements No. 133 and 140, with changes in the fair value reported in other noninterest income. The fair value of these loans was $43 million, or less than .5% of the total loan portfolio, at December 31, 2008.
76
In addition to originating loans, we also acquire loans through portfolio purchases or acquisitions of other financial services companies. For certain acquired loans that have experienced a deterioration of credit quality at the time of acquisition, we follow the guidance contained in AICPA Statement of Position 03-3, Accounting for Certain Loans or Debt Securities Acquired in a Transfer (SOP 03-3). Under SOP 03-3, acquired loans are to be recorded at fair value absent the carry over of any existing valuation allowances. Evidence of credit quality deterioration as of the purchase date may include information and statistics such as bankruptcy events, FICO scores, past due status, current borrower credit scores, and current loan-to-value (LTV). We review the loans acquired for evidence of credit quality deterioration at the date of acquisition and determine if it is probable that we will be unable to collect all amounts due, including both principal and interest, according to the loans contractual terms. When both conditions exist, we estimate the amount and timing of undiscounted expected cash flows for each loan either individually or on a pool basis. We estimate the cash flows expected to be collected at acquisition using internal and third party models that incorporate managements best estimate of current key assumptions, such as default rates, loss severity and payment speeds. Collateral values are also incorporated into cash flow estimates. Late fees, which are contractual but not expected to be collected, are excluded from expected future cash flows. The accretable yield is calculated based upon the difference between the undiscounted expected future cash flows of the loans and the fair value of the loan as determined under the provisions of SFAS 157, Fair Value Measurement. This amount is accreted into income over the life of the loan on a level yield basis. Subsequent increases in expected cash flows are recognized prospectively through an adjustment of the loans or pools yield over its remaining life. Subsequent decreases in expected cash flows that are attributable, at least in part, to credit quality are recognized as impairments through a change to the provision for credit losses resulting in an increase in the allowance for loan and lease losses.
The nonaccretable yield represents the difference between the expected undiscounted cash flows of the loans and the total contractual cash flows (including the principal and interest) at acquisition and throughout the remaining lives of the loans.
We also provide financing for various types of equipment, aircraft, energy and power systems, and rolling stock and automobiles through a variety of lease arrangements. Direct financing leases are carried at the aggregate of lease payments plus estimated residual value of the leased property, less unearned income. Leveraged leases, a form of financing lease, are carried net of nonrecourse debt. We recognize income over the term of the lease using the interest method. Lease residual values are reviewed for other than temporary impairment on a quarterly basis. Gains or losses on the sale of leased assets are included in other noninterest income while valuation adjustments on lease residuals are included in other noninterest expense.
When loans are redesignated from held for investment to held for sale, specific reserves and allocated pooled reserves included in the allowance for loan and lease losses are charged-off to reduce the basis of the loans to lower of cost or market value.
LOAN SALES, LOAN SECURITIZATIONS AND RETAINED INTERESTS
We recognize the sale of loans or other financial assets when the transferred assets are legally isolated from our creditors and the appropriate accounting criteria are met. We also sell mortgage and other loans through secondary market securitizations. Securitization of financial assets represents a source of funding. In a securitization, financial assets are transferred into trusts or to special-purpose entities (SPEs) in transactions which are effective in legally isolating the assets from PNC. Pools of credit card, automobile, and mortgage loans have been securitized. Where the transferor is a depository institution, legal isolation is accomplished through compliance with specific rules and regulations of the relevant regulatory authorities. Where the transferor is not a depository institution, legal isolation is accomplished through utilization of a two-step securitization structure.
SFAS 140 Accounting for Transfers and Servicing of Financial Assets and Extinguishments of Liabilities requires a true sale analysis of the treatment of the transfer under state law as if the transferring equity was a debtor under the bankruptcy code. A true sale legal analysis includes several legally relevant factors, such as the nature and level of recourse to the transferor, and the amount and nature of retained interests in the loans sold. The analytical conclusion as to a true sale is never absolute and unconditional, but contains qualifications based on the inherent equitable powers of a bankruptcy court, as well as the unsettled state of the common law. Once the legal isolation test has been met under SFAS 140, other factors concerning the nature and extent of the transferors control over the transferred assets are taken into account in order to determine whether derecognition of assets is warranted, including whether the SPE has complied with rules concerning qualifying special-purpose entities.
In a securitization, the trusts or SPE issues beneficial interests in the form of senior and subordinated asset-backed securities backed or collateralized by the assets sold to the trust. The senior classes of the asset-backed securities typically receive investment grade credit ratings at the time of issuance. These ratings are generally achieved through the creation of lower-rated subordinated classes of asset-backed securities, as well as subordinated interests. In certain cases, we may retain a portion or all of the securities issued, interest-only strips, one or more subordinated tranches, servicing rights and, in some cases, cash reserve accounts.
77
For credit card securitizations, PNCs continued involvement in the securitized assets includes maintaining an undivided, pro rata interest in all credit card assets that are in the trust, referred to as sellers interest. The sellers interest ranks equally with the investors interests in the trust. As the amount of the assets in the securitized pool fluctuates due to customer payments, purchases, cash advances, and credit losses, the carrying amount of the sellers interest will vary. However, PNC is required to maintain its sellers interest at a minimum level of 5% of the initial invested amount in each series to ensure sufficient assets are available for allocation to the investors interests.
In accordance with SFAS 140, securitized loans are removed from the balance sheet and a net gain or loss is recognized in noninterest income at the time of initial sale, and each subsequent sale for revolving securitization structures. Gains or losses recognized on the sale of the loans depend on the allocation of carrying value between the loans sold and the retained interests, based on their relative fair market values at the date of sale. We generally estimate the fair value of the retained interests based on the present value of future expected cash flows using assumptions as to discount rates, interest rates, prepayment speeds, credit losses and servicing costs, if applicable.
Our loan sales and securitizations are generally structured without recourse to us and with no restrictions on the retained interests with the exception of loan sales to certain US government chartered entities.
When we are obligated for loss-sharing or recourse in a sale, our policy is to record such liabilities at fair value upon closing of the transaction based on the guidance contained in FIN 45, Guarantors Accounting and Disclosure Requirements for Guarantees, Including Indirect Guarantees of Indebtedness of Others, or as a contingent liability recognized at inception of the guarantee under SFAS 5, Accounting for Contingencies.
We originate, sell and service mortgage loans under the Federal National Mortgage Association (FNMA) Delegated Underwriting and Servicing (DUS) program. Under the provisions of the DUS program, we participate in a loss-sharing arrangement with FNMA. We participate in a similar program with the Federal Home Loan Mortgage Corporation (FHLMC). Refer to Note 25 Commitments and Guarantees for more information about our obligations related to sales of loans under these programs.
In securitization transactions, we classify securities retained as debt securities available for sale or other assets, depending on the form of the retained interest. Retained interests that are subject to prepayment risk are reviewed on a quarterly basis for impairment. If the fair value of the retained interests is below its carrying amount and the decline is determined to be other than temporary, then the decline is reflected as a charge in other noninterest income.
LOANS HELD FOR SALE
We designate loans and related unfunded loan commitments as held for sale when we have a positive intent to sell them. We transfer loans to the loans held for sale category at the lower of cost or fair market value. At the time of transfer, write-downs on the loans and related unfunded loan commitments are recorded as charge-offs or as a reduction in the liability for unfunded commitments. We establish a new cost basis upon transfer except for certain residential and commercial mortgages held for sale discussed below. Any subsequent lower of cost or market adjustment is determined on an individual loan and unfunded loan commitment basis and is recognized as a valuation allowance with any charges included in other noninterest income. Gains or losses on the sale of these loans and/or related unfunded loan commitments are included in other noninterest income when realized.
Effective January 1, 2008, we adopted SFAS 159, The Fair Value Option for Financial Assets and Financial Liabilities Including an amendment of FASB Statement No. 115, and elected to fair value certain commercial mortgage loans held for sale. Under SFAS 159, changes in the fair value of these loans are measured and recorded in other noninterest income each period. See Note 8 Fair Value for additional information. Also, we elected fair value for residential real estate loans held for sale or securitization acquired from National City.
Interest income with respect to loans held for sale classified as performing is accrued based on the principal amount outstanding at a constant effective yield.
In certain circumstances, loans designated as held for sale may be transferred to the loan portfolio based on a change in strategy. We transfer these loans to the portfolio at the lower of cost or fair market value; however, any loans designated under SFAS 159 will remain at fair value.
NONPERFORMING ASSETS
Nonperforming assets include:
| | Nonaccrual loans, |
| | Troubled debt restructurings, and |
| | Foreclosed assets. |
78
Measurement of delinquency and past due status are based on the contractual terms of each loan.
A loan acquired and accounted for under SOP 03-3 is reported as an accruing loan and a performing asset as long as the remaining future expected undiscounted cash flows exceed the carrying value of the loan.
We generally classify commercial loans as nonaccrual when we determine that the collection of interest or principal is doubtful or when a default of interest or principal has existed for 90 days or more and the loans are not well-secured or in the process of collection. When the accrual of interest is discontinued, any accrued but uncollected interest previously included in net interest income is reversed. We charge off small business commercial loans less than $1 million at 120 days after transfer to nonaccrual status. We charge off other nonaccrual loans based on the facts and circumstances of the individual loans.
Subprime mortgage loans for first liens with a loan to value ratio of greater than 90% and second liens are classified as nonaccrual at 90 days past due.
Most consumer loans and lines of credit, not secured by residential real estate, are charged off after 120 to 180 days past due. Generally, they are not placed on non-accrual status.
Home equity installment loans and lines of credit, as well as residential mortgage loans, that are well secured by residential real estate are classified as nonaccrual at 180 days past due or if a partial write-down has occurred, consistent with regulatory guidance. These loans are considered well secured if the fair market value of the property, less 15% to cover potential foreclosure expenses, is greater than or equal to the recorded investment in the loan including any superior liens. A fair market value assessment of the property is initiated when the loan becomes 90 to 120 days past due.
Home equity installment loans and lines of credit and residential real estate loans that are not well secured, but are in the process of collection, are charged-off at 180 days past due. This is consistent with the charge-off policy for home equity lines of credit. These loans are recorded at the lower of cost or market value, less liquidation costs, and the unsecured portion of these loans is charged off in accordance with regulatory guidelines. The remaining portion of the loan is placed on nonaccrual status.
Additionally, residential mortgage loans serviced by others under master servicing arrangements and primary-serviced residential loans not in process of foreclosure are also classified as nonaccrual at 180 days past due or if a partial write-down has occurred.
A loan is categorized as a troubled debt restructuring (TDR) if a significant concession is granted due to deterioration in the financial condition of the borrower. TDRs may include certain modifications of terms of loans, receipts of assets from debtors in partial or full satisfaction of loans, or a combination of both. Restructured loans classified as TDRs are accounted for in accordance with SFAS 15, Accounting by Debtors and Creditors for Troubled Debt Restructurings, and SFAS 114, Accounting by Creditors for Impairment of a Loan.
Nonperforming loans are generally not returned to performing status until the obligation is brought current and the borrower has performed in accordance with the contractual terms for a reasonable period of time and collection of the contractual principal and interest is no longer doubtful. Nonaccrual commercial and commercial real estate loans and troubled debt restructurings are designated as impaired loans under SFAS 114.
Foreclosed assets are comprised of any asset seized or property acquired through a foreclosure proceeding or acceptance of a deed-in-lieu of foreclosure. Other real estate owned (OREO) is comprised principally of commercial and residential real estate properties obtained in partial or total satisfaction of loan obligations. Depending on various state statutes, legal proceedings are initiated on or about the 65th day of delinquency. If no other remedies arise from the legal proceedings, the final outcome will result in the sheriffs sale of the property. When we acquire the deed, the transfer of loans to other real estate owned will be completed. Property obtained in satisfaction of a loan is recorded at the estimated fair value less anticipated selling costs. We estimate market values primarily based on appraisals, when available, or quoted market prices on liquid assets. Anticipated recoveries from private mortgage insurance and government guarantees are also considered in evaluating the potential impairment of loans at the date of transfer. When the anticipated future cash flows associated with a loan are less than its net carrying value, a charge-off is recognized against the allowance for loan losses.
Subsequently, foreclosed assets are valued at the lower of the amount recorded at acquisition date or the current market value less estimated disposition costs. Valuation adjustments on these assets and gains or losses realized from disposition of such property are reflected in noninterest expense.
ALLOWANCE FOR LOAN AND LEASE LOSSES
We maintain the allowance for loan and lease losses at a level that we believe to be adequate to absorb estimated probable credit losses inherent in the loan portfolio as of the balance sheet date. Our determination of the adequacy of the allowance is based on periodic evaluations of the loan and lease portfolios and other relevant factors. This evaluation is inherently subjective as it requires material estimates, all of which may be susceptible to significant change, including, among others:
| | Probability of default, |
79
| | Loss given default, |
| | Exposure at date of default, |
| | Amounts and timing of expected future cash flows on impaired loans, |
| | Value of collateral, |
| | Historical loss exposure, and |
| | Amounts for changes in economic conditions that may not be reflected in historical results. |
In determining the adequacy of the allowance for loan and lease losses, we make specific allocations to impaired loans, allocations to pools of watchlist and non-watchlist loans, and allocations to consumer and residential mortgage loans. We also allocate reserves to provide coverage for probable losses inherent in the portfolio at the balance sheet date based upon current market conditions, which may not be reflected in historical loss data. While allocations are made to specific loans and pools of loans, the total reserve is available for all credit losses.
Specific allocations are made to significant individual impaired loans and are determined in accordance with SFAS 114, with impairment measured based on the present value of the loans expected cash flows, observable market price of the loan or the fair value of collateral. We establish a pooled reserve on all other impaired loans based on their loss given default credit risk ratings.
Allocations to loan pools are developed by product and industry with estimated losses based on probability of default and loss given default credit risk ratings by using historical loss trends and our judgment concerning those trends and other relevant factors. These factors may include, among others:
| | Actual versus estimated losses, |
| | Regional and national economic conditions, and |
| | Industry and portfolio concentrations. |
Loss factors are based on industry and/or internal experience and may be adjusted for significant factors that, based on our judgment, impact the collectibility of the portfolio as of the balance sheet date. Consumer and residential mortgage loan allocations are made at a total portfolio level based on historical loss experience adjusted for current risk factors.
While our pool reserve methodologies strive to reflect all risk factors, there continues to be a certain element of uncertainty associated with, but not limited to, potential imprecision in the estimation process due to the inherent time lag of obtaining information. We provide additional reserves that are designed to provide coverage for losses attributable to such risks. These reserves also include factors which may not be directly measured in the determination of specific or pooled reserves. Such factors include:
| | Credit quality trends, |
| | Recent loss experience in particular segments of the portfolio, |
| | Ability and depth of lending management, and |
| | Changes in risk selection and underwriting standards. |
ALLOWANCE FOR UNFUNDED LOAN COMMITMENTS AND LETTERS OF CREDIT
We maintain the allowance for unfunded loan commitments and letters of credit at a level we believe is adequate to absorb estimated probable losses related to these unfunded credit facilities. We determine the adequacy of the allowance based on periodic evaluations of the unfunded credit facilities including an assessment of the probability of commitment usage, credit risk factors for loans outstanding to these same customers, and the terms and expiration dates of the unfunded credit facilities. The allowance for unfunded loan commitments and letters of credit is recorded as a liability on the Consolidated Balance Sheet. Net adjustments to the allowance for unfunded loan commitments and letters of credit are included in the provision for credit losses.
MORTGAGE AND OTHER SERVICING RIGHTS
We provide servicing under various loan servicing contracts for commercial, residential, home equity, automobile and credit card loans. These contracts are either purchased in the open market or retained as part of a loan securitization or loan sale. All newly acquired or originated servicing rights are initially measured at fair value. Fair value is based on the present value of the expected future cash flows, including assumptions as to:
| | Interest rates for escrow and deposit balance earnings, |
| | Discount rates, |
| | Stated note rates, |
| | Estimated prepayment speeds, and |
| | Estimated servicing costs. |
For subsequent measurements, we have elected to account for our commercial mortgage loan servicing rights as a class of assets and use the amortization method. This election was made based on the unique characteristics of the commercial mortgage loans underlying these servicing rights with regard to market inputs used in determining fair value and how we manage the risks inherent in the commercial mortgage servicing rights assets. Specific risk characteristics of commercial mortgages include loan type, currency or exchange rate, interest rates, expected cash flows and changes in the cost of servicing. We record these servicing assets as other intangible assets and amortize them over their estimated lives based on estimated net servicing income. On a quarterly basis, we test
80
the assets for impairment by categorizing the pools of assets underlying the servicing rights into various stratum. If the estimated fair value of the assets is less than the carrying value, an impairment loss is recognized and a valuation reserve is established. Subsequent measurement of servicing rights for home equity lines and loans, automobile loans and credit card loans also follow the amortization method.
For subsequent measurement of servicing rights for residential real estate loans, the fair value method is used. This election was made to be consistent with our risk management strategy to hedge the fair value of these assets. We manage this risk by hedging the fair value of this asset with derivatives which are expected to increase in value when the value of the servicing right declines. The fair value of these servicing rights is estimated by using a cash flow valuation model which calculates the present value of estimated future net servicing cash flows, taking into consideration actual and expected mortgage loan prepayment rates, discount rates, servicing costs, and other economic factors which are determined based on current market conditions. Expected mortgage loan prepayment assumptions are derived from an internal proprietary model and consider empirical data drawn from the historical performance of PNCs managed portfolio and adjusted for current market conditions. On a quarterly basis, management obtains market value quotes from two independent brokers that reflect current conditions in the secondary market and any recently executed servicing transactions. Management compares its valuation to the quoted range of market values to determine if its estimated fair value is reasonable in comparison to market participant valuations. If the estimated fair value of PNCs residential servicing rights is outside the range, management re-evaluates its model inputs and assumptions to derive a fair value which falls within the range of market observed values.
Servicing fees are recognized as they are earned and are reported net of amortization expense and any impairments in the line item Corporate services on the Consolidated Income Statement.
FAIR VALUE OF FINANCIAL INSTRUMENTS
The fair value of financial instruments and the methods and assumptions used in estimating fair value amounts and financial assets and liabilities for which fair value was elected based on the guidance in SFAS 159 are detailed in Note 8 Fair Value.
GOODWILL AND OTHER INTANGIBLE ASSETS
We test goodwill and indefinite-lived intangible assets for impairment at least annually, or when events or changes in circumstances indicate the assets might be impaired. Finite-lived intangible assets are amortized to expense using accelerated or straight-line methods over their respective estimated useful lives. We review finite-lived intangible assets for impairment when events or changes in circumstances indicate that the assets carrying amount may not be recoverable from undiscounted future cash flows or it may exceed its fair value.
DEPRECIATION AND AMORTIZATION
For financial reporting purposes, we depreciate premises and equipment, net of salvage value, principally using the straight-line method over their estimated useful lives.
We use estimated useful lives for furniture and equipment ranging from one to 10 years, and depreciate buildings over an estimated useful life of up to 40 years. We amortize leasehold improvements over their estimated useful lives of up to 15 years or the respective lease terms, whichever is shorter.
We purchase, as well as internally develop and customize, certain software to enhance or perform internal business functions. Software development costs incurred in the planning and post-development project stages are charged to noninterest expense. Costs associated with designing software configuration and interfaces, installation, coding programs and testing systems are capitalized and amortized using the straight-line method over periods ranging from one to seven years.
REPURCHASE AND RESALE AGREEMENTS
Generally, repurchase and resale agreements are treated as collateralized financing transactions and are carried at the amounts at which the securities will be subsequently reacquired or resold, including accrued interest, as specified in the respective agreements. Our policy is to take possession of securities purchased under agreements to resell. We monitor the market value of securities to be repurchased and resold and additional collateral may be obtained where considered appropriate to protect against credit exposure.
Effective January 1, 2008, we elected to account for structured resale agreements at fair value. The fair value for structured resale agreements is determined using a model which includes observable market data as inputs.
OTHER COMPREHENSIVE INCOME
Other comprehensive income consists, on an after-tax basis, primarily of unrealized gains or losses on investment securities classified as available for sale and derivatives designated as cash flow hedges, and changes in pension, other postretirement and postemployment benefit plan liability adjustments. Details of each component are included in Note 20 Other Comprehensive Income.
TREASURY STOCK
We record common stock purchased for treasury at cost. At the date of subsequent reissue, the treasury stock account is reduced by the cost of such stock on the first-in, first-out basis.
81
DERIVATIVE INSTRUMENTS AND HEDGING ACTIVITIES
We use a variety of financial derivatives as part of our overall asset and liability risk management process to help manage interest rate, market and credit risk inherent in our business activities. Interest rate and total return swaps, interest rate caps and floors and futures contracts are the primary instruments we use for interest rate risk management.
Financial derivatives involve, to varying degrees, interest rate, market and credit risk. We manage these risks as part of our asset and liability management process and through credit policies and procedures. We seek to minimize counterparty credit risk by entering into transactions with only high-quality institutions, establishing credit limits, and generally requiring bilateral netting and collateral agreements.
We recognize all derivative instruments at fair value as either other assets or other liabilities on the Consolidated Balance Sheet. The accounting for changes in the fair value of a derivative instrument depends on whether it has been designated and qualifies as part of a hedging relationship. For derivatives not designated as an accounting hedge, the gain or loss is recognized in noninterest income.
For those derivative instruments that are designated and qualify as accounting hedges, we must designate the hedging instrument, based on the exposure being hedged, as a fair value hedge or a cash flow hedge. We have no derivatives that hedge the net investment in a foreign operation.
We formally document the relationship between the hedging instruments and hedged items, as well as the risk management objective and strategy, before undertaking an accounting hedge. To qualify for hedge accounting, the derivatives and related hedged items must be designated as a hedge at inception of the hedge relationship. For accounting hedge relationships, we formally assess, both at the inception of the hedge and on an ongoing basis, if the derivatives are highly effective in offsetting designated changes in the fair value or cash flows of the hedged item. If it is determined that the derivative instrument is not highly effective, hedge accounting is discontinued.
For derivatives that are designated as fair value hedges (i.e., hedging the exposure to changes in the fair value of an asset or a liability attributable to a particular risk), changes in the fair value of the hedging instrument are recognized in earnings and offset by recognizing changes in the fair value of the hedged item attributable to the hedged risk. To the extent the changes in fair value of the derivative does not offset the change in fair value of the hedged item, the difference or ineffectiveness is reflected in the income statement in the same financial statement category as the hedged item.
For derivatives designated as cash flow hedges (i.e., hedging the exposure to variability in expected future cash flows), the effective portions of the gain or loss on derivatives are reported as a component of accumulated other comprehensive income (loss) and subsequently reclassified to interest income in the same period or periods during which the hedged transaction affects earnings. The change in fair value of any ineffective portion of the hedging derivative is recognized immediately in noninterest income.
We discontinue hedge accounting when it is determined that the derivative is no longer qualifying as an effective hedge; the derivative expires or is sold, terminated or exercised; or the derivative is de-designated as a fair value or cash flow hedge or, for a cash flow hedge, it is no longer probable that the forecasted transaction will occur by the end of the originally specified time period. If we determine that the derivative no longer qualifies as a fair value or cash flow hedge and hedge accounting is discontinued, the derivative will continue to be recorded on the balance sheet at its fair value with changes in fair value included in current earnings. For a discontinued fair value hedge, the previously hedged item is no longer adjusted for changes in fair value.
When hedge accounting is discontinued because it is no longer probable that a forecasted transaction will occur, the derivative will continue to be recorded on the balance sheet at its fair value with changes in fair value included in current earnings, and the gains and losses in accumulated other comprehensive income (loss) will be recognized immediately into earnings. When we discontinue hedge accounting because the hedging instrument is sold, terminated or no longer designated, the amount reported in accumulated other comprehensive income (loss) up to the date of sale, termination or de-designation, continues to be reported in other comprehensive income or loss until the forecasted transaction affects earnings. We did not terminate any cash flow hedges in 2008, 2007 or 2006 due to a determination that a forecasted transaction was no longer probable of occurring.
82
We occasionally purchase or originate financial instruments that contain an embedded derivative. At the inception of the transaction, we assess if the economic characteristics of the embedded derivative are clearly and closely related to the economic characteristics of the financial instrument (host contract), whether the financial instrument that embodied both the embedded derivative and the host contract are measured at fair value with changes in fair value reported in earnings, and whether a separate instrument with the same terms as the embedded instrument would not meet the definition of a derivative. If the embedded derivative does not meet these three conditions, the embedded derivative would qualify as a derivative and be recorded apart from the host contract and carried at fair value with changes recorded in current earnings.
On January 1, 2006, we adopted SFAS 155, which, among other provisions, permits a fair value election for hybrid financial instruments requiring bifurcation on an instrument-by-instrument basis. Beginning January 1, 2006, we elected to account for certain previously bifurcated hybrid instruments and certain newly acquired hybrid instruments under this fair value election on an instrument-by-instrument basis. As such, certain previously reported embedded derivatives are reported with their host contracts at fair value in loans or other borrowed funds.
We enter into commitments to make residential real estate loans and loans whereby the interest rate on the loan is set prior to funding (interest rate lock commitments). We also enter into commitments to purchase or sell commercial mortgage loans. Loan commitments and interest rate lock commitments for loans to be classified as held for sale and commitments to buy or sell mortgage loans are accounted for as free-standing derivatives and are recorded at fair value in other assets or other liabilities on the Consolidated Balance Sheet. Any gain or loss from the change in fair value after the inception of the commitment is recognized in noninterest income.
INCOME TAXES
We account for income taxes under the asset and liability method. Deferred tax assets and liabilities are determined based on differences between the financial reporting and tax bases of assets and liabilities and are measured using the enacted tax rates and laws that we expect will apply at the time when we believe the differences will reverse. The realization of deferred tax assets requires an assessment to determine the realization of such assets. Realization refers to the incremental benefit achieved through the reduction in future taxes payable or refunds receivable from the deferred tax assets, assuming that the underlying deductible differences and carryforwards are the last items to enter into the determination of future taxable income. We establish a valuation allowance for tax assets when it is more likely than not that they will not be realized, based upon all available positive and negative evidence.
EARNINGS PER COMMON SHARE
We calculate basic earnings per common share by dividing net income adjusted for preferred stock dividends declared by the weighted-average number of shares of common stock outstanding.
Diluted earnings per common share are based on net income available to common stockholders. We increase the weighted-average number of shares of common stock outstanding by the assumed conversion of outstanding convertible preferred stock and debentures from the beginning of the year or date of issuance, if later, and the number of shares of common stock that would be issued assuming the exercise of stock options and warrants and the issuance of incentive shares using the treasury stock method. These adjustments to the weighted-average number of shares of common stock outstanding are made only when such adjustments will dilute earnings per common share.
STOCK-BASED COMPENSATION
In December 2004, the FASB issued SFAS 123R Share-Based Payment, which requires compensation cost related to share-based payments to employees to be recognized in the financial statements based on their fair value. We adopted SFAS 123R effective January 1, 2006, using the modified prospective method of transition, which required the provisions of SFAS 123R be applied to new awards and awards modified, repurchased or cancelled after the effective date. It also required changes in the timing of expense recognition for awards granted to retirement-eligible employees and clarified the accounting for the tax effects of stock awards. The adoption of SFAS 123R did not have a significant impact on our consolidated financial statements.
See Note 16 Stock-Based Compensation Plans for additional information.
RECENT ACCOUNTING PRONOUNCEMENTS
We adopted the guidance in Staff Accounting Bulletin No. (SAB) 109 on January 1, 2008. SAB 109 provides the SEC staffs view that the expected future cash flows related to servicing should be included in the fair value measurement of all written loan commitments that are accounted for at fair value through earnings. The impact of this guidance on our consolidated financial statements has not been significant.
83
We adopted SFAS 157, Fair Value Measurements on January 1, 2008. SFAS 157 defines fair value, establishes a framework for measuring fair value, and expands disclosures about fair value measurements. The FASBs Financial Staff Position FSP FAS 157-2, Effective Date of FASB Statement No. 157, defers until January 1, 2009, the application of SFAS 157 to nonfinancial assets and nonfinancial liabilities not recognized or disclosed at least annually at fair value. This includes nonfinancial assets and nonfinancial liabilities initially measured at fair value in a business combination or other new basis event, but not measured at fair value in subsequent periods. See Note 8 Fair Value for additional information.
As noted above, we adopted SFAS 159 on January 1, 2008. SFAS 159 permits entities to choose to measure many financial instruments and certain other assets and liabilities at fair value. We elected to fair value certain commercial mortgage loans classified as held for sale and certain other financial instruments. We also elected fair value for residential real estate loans held for sale or securitization acquired from National City. See Note 8 Fair Value for additional information.
As required, we adopted the provisions of Emerging Issues Task Force Issue No. (EITF) 06-4, Accounting for Deferred Compensation and Postretirement Benefit Aspects of Endorsement Split-Dollar Life Insurance Arrangements, on January 1, 2008. EITF 06-4 requires the recognition of a liability and related compensation costs for endorsement split-dollar life insurance arrangements that provide a benefit to retired employees. The adoption of the guidance resulted in a reduction of retained earnings at January 1, 2008 of approximately $12 million and did not have a material effect on our future results of operations or financial position.
In February 2008, the FASB issued FSP FAS 140-3, Accounting for Transfers of Financial Assets and Repurchase Financing Transactions. This FSP provides guidance on how the transferor and transferee should separately account for a transfer of a financial asset and a related repurchase financing if certain criteria are met. This guidance will be effective January 1, 2009 for PNC and will impact our accounting for structured repurchase agreements entered into after that date.
In March 2008, the FASB issued SFAS 161, Disclosures about Derivative Instruments and Hedging Activities. This standard will require revisions to our derivative disclosures to provide greater transparency as to the use of derivative instruments and hedging activities. This guidance will be effective for interim and annual financial statements beginning with the first quarter 2009 Form 10-Q.
In April 2008, the FASB issued FSP FAS 142-3, Determination of the Useful Life of Intangible Assets. This FSP provides guidance as to factors considered in developing renewal or extension assumptions used to determine the useful life of a recognized intangible asset under SFAS 142, Goodwill and Other Intangible Assets. This guidance will be effective January 1, 2009 for PNC. The adoption is not expected to have a material effect on our results of operations or financial position.
In May 2008, the FASB issued SFAS 162, The Hierarchy of Generally Accepted Accounting Principles. This standard formalizes minor changes in prioritizing accounting principles used in the preparation of financial statements that are presented in conformity with GAAP.
In May 2008, the FASB issued SFAS 163, Accounting for Financial Guarantee Insurance Contracts an Interpretation of FASB Statement No. 60. This standard changes the current practice of accounting for financial guarantee insurance contracts by insurance companies including the recognition and measurement of premium revenue, claim liabilities and enhances related disclosure requirements. This guidance will be effective for interim and annual financial statements beginning in 2009. The adoption of this guidance is not expected to have a material effect on our results of operations or financial position.
In May 2008, the FASB issued FSP APB 14-1, Accounting for Convertible Debt Instruments That May Be Settled in Cash Upon Conversion (Including Partial Cash Settlement). This FSP clarifies that certain convertible debt instruments should be separately accounted for as liability and equity components. This guidance will be effective beginning with our first quarter 2009 Form 10-Q. We do not expect the adoption of this guidance to have a material effect on our results of operations or financial position.
In June 2008, the FASB issued FSP EITF 03-6-1, Determining Whether Instruments Granted in Share-Based Payment Transactions Are Participating Securities. This FSP clarifies that unvested share-based payment awards that contain nonforfeitable rights to dividends or dividend equivalents are considered participating securities and should be included in the calculation of basic earnings per share using the two-class method prescribed by SFAS 128, Earnings Per Share. This guidance was effective for disclosure beginning with our first quarter 2009 Form 10-Q with retrospective application required. Our adoption of this guidance did not have a material effect on either our basic or diluted earnings per share.
84
In September 2008, the FASB issued FSP FAS 133-1 and FIN 45-4, Disclosures about Credit Derivatives and Certain Guarantees: An Amendment of FASB Statement No. 133 and FASB Interpretation No. 45; and Clarification of the Effective Date of FASB Statement No. 161. This FSP amends FASB Statement No. 133, Accounting for Derivative Instruments and Hedging Activities, to require disclosures by sellers of credit derivatives, including credit derivatives embedded in a hybrid instrument. This FSP also amends FASB Interpretation No. 45, Guarantors Accounting and Disclosure Requirements for Guarantees, Including Indirect Guarantees of Indebtedness of Others, to require additional disclosure about the payment/performance risk of a guarantee. This guidance was effective December 31, 2008 for PNC. See Note 25 Commitments and Guarantees for additional information.
In September 2008, the FASB issued an Exposure Draft, Proposed Statement, Amendments to FASB Interpretation No. 46(R). This proposed Statement would amend FIN 46R and require ongoing assessments to determine: 1) whether an entity is a variable interest entity and, 2) whether an enterprise is the primary beneficiary of a variable interest entity. The primary beneficiary determination generally would be based on a qualitative analysis based on who has power over the activities of the entity and the rights to receive benefits or absorb losses. Enhanced disclosures would also be required. This proposed guidance would be effective for PNC beginning January 1, 2010. The guidance as proposed could require us to consolidate certain VIEs or securitization trusts if we are deemed the primary beneficiary.
In September 2008, the FASB issued an Exposure Draft, Proposed Statement, Accounting for Transfers of Financial Assets an amendment of FASB Statement No. 140. This proposed Statement, a revision of a 2005 FASB Exposure Draft, would remove (1) the concept of a qualifying SPE from FASB Statement No. 140, Accounting for Transfers and Servicing of Financial Assets and Extinguishments of Liabilities, and (2) the exceptions from applying FIN 46R to qualifying SPEs. This proposed Statement would also revise and clarify the derecognition requirements for transfers of financial assets, establish conditions for transfer of a portion of a financial asset, and requiring the initial measurement of beneficial interests that are received as proceeds in connection with transfers of financial assets at fair value. This proposed guidance would be effective for PNC beginning January 1, 2010.
In October 2008, the FASB issued FSP FAS 157-3, Determining the Fair Value of a Financial Asset When the Market for That Asset Is Not Active. This FSP clarifies the application of FASB Statement No. 157, Fair Value Measurements, in a market that is not active and provides an example to illustrate key considerations in determining the fair value of a financial asset when the market for that financial asset is not active. This guidance was considered in determining the fair value of financial assets beginning September 30, 2008.
In December 2008, the FASB issued FSP FAS 140-4 and FIN 46(R)-8, Disclosures by Public Entities (Enterprises) about Transfers of Financial Assets and Interests in Variable Interest Entities. This FSP amends FASB Statement No. 140, Accounting for Transfers and Servicing of Financial Assets and Extinguishments of Liabilities, and will require additional disclosures about transfers of financial assets. It also amends FASB Interpretation No. 46 (revised December 2003), Consolidation of Variable Interest Entities, and requires additional disclosures about involvement with variable interest entities. This guidance was effective December 31, 2008 for PNC. See Note 3 Variable Interest Entities for additional information.
In December 2008, the FASB issued FSP FAS 132(R)-1, Employers Disclosures about Postretirement Benefit Plan Assets. This FSP amends FASB Statement No. 132 (revised 2003), Employers Disclosures about Pensions and Other Postretirement Benefits, to provide guidance on an employers disclosures about plan assets of a defined benefit pension or other postretirement plan. This guidance will be effective December 31, 2009 for PNC.
In January 2009, the FASB issued FSP EITF 99-20-1, Amendments to the Impairment Guidance of EITF Issue No. 99-20. This FSP amends the impairment guidance in EITF Issue No. 99-20, Recognition of Interest income and Impairment on Purchased Beneficial Interests and Beneficial Interest That Continue to Be Held by a Transferor in Securitized Financial Assets. The FSP also retains and emphasizes the objective of an other-than-temporary impairment assessment and the related disclosure requirements in FASB Statement No. 115, Accounting for Certain Investments in Debt and Equity Securities, and other related guidance. This guidance was effective December 31, 2008 for PNC. The adoption of this guidance did not have a material effect on our results of operations or financial position.
In January 2009, the FASB issued proposed FSP FAS 107-b and APB 28-a, Interim Disclosures about Fair Value of Financial Instruments. This FSP would amend FASB Statement No. 107, Disclosures about Fair Value of Financial Instruments, to require disclosures about fair value of financial instruments in interim financial statements as well as in annual financial statements. This FSP also would amend APB Opinion No. 28, Interim Financial Reporting, to require those disclosures in all interim financial statements. As proposed, the disclosures would be effective for the quarter ended March 31, 2009.
85
In December 2007, the FASB issued SFAS 141(R), Business Combinations. This statement will require all businesses acquired to be measured at the fair value of the consideration paid as opposed to the cost-based provisions of SFAS 141. It will require an entity to recognize the assets acquired, the liabilities assumed, and any noncontrolling interest in the acquiree at the acquisition date, measured at their fair values as of that date. SFAS 141(R) requires the value of consideration paid including any future contingent consideration to be measured at fair value at the closing date of the transaction. Also, restructuring costs and acquisition costs are to be expensed rather than included in the cost of the acquisition. This guidance is effective for all acquisitions with closing dates after January 1, 2009.
In December 2007, the FASB issued SFAS 160, Accounting and Reporting of Noncontrolling Interests in Consolidated Financial Statements, an amendment of ARB No. 51. This statement amends ARB No. 51 to establish accounting and reporting standards for the noncontrolling interest in a subsidiary and for the deconsolidation of a subsidiary. It clarifies that a noncontrolling interest should be reported as equity in the consolidated financial statements. This statement requires expanded disclosures that identify and distinguish between the interests of the parents owners and the interests of the noncontrolling owners of an entity. This guidance was effective January 1, 2009 with retrospective application required. The adoption of this guidance did not have a material impact on our results of operations or financial position.
In May 2007, the FASB issued FSP FIN 48-1, Definition of Settlement in FASB Interpretation (FIN) No. 48. This FSP amended FIN 48, Accounting for Uncertainty in Income Taxes, to provide guidance as to the determination of whether a tax position is deemed effectively settled for purposes of recognizing previously unrecognized tax benefits under FIN 48. This guidance was adopted effective January 1, 2007 in connection with our adoption of FIN 48. See Note 21 Income Taxes for additional information.
During 2006, the FASB issued the following:
| | SFAS 158, Employers Accounting for Defined Benefit Pension and Other Postretirement Plans an amendment of FASB Statements No. 87, 88, 106, and 132(R). This statement affects the accounting and reporting for our qualified pension plan, our nonqualified retirement plans, our postretirement welfare benefit plans and our post employment benefit plan. SFAS 158 required recognition on the balance sheet of the over- or underfunded position of these plans as the difference between the fair value of plan assets and the related benefit obligations previously recognized on the balance sheet. The difference, net of tax, was recorded as part of accumulated other comprehensive income or loss (AOCI) within the shareholders equity section of the balance sheet. This guidance also required the recognition of any unrecognized actuarial gains and losses and unrecognized prior service costs to AOCI, net of tax. SFAS 158 was effective for PNC as of December 31, 2006, with no restatement for prior year-end reporting periods permitted. The impact of adoption of SFAS 158 at December 31, 2006 was a reduction of AOCI of $132 million after tax. |
| | FIN 48 Accounting for Uncertainty in Income Taxes an Interpretation of FASB Statement No. 109, clarifies the accounting for uncertainty in income taxes recognized in the financial statements and sets forth recognition, derecognition and measurement criteria for tax positions taken or expected to be taken in a tax filing. For PNC, this guidance was effective for all tax positions taken or expected to be taken beginning on January 1, 2007. See Note 21 Income Taxes for additional information. |
| | FSP FAS 13-2, Accounting for a Change or Projected Change in the Timing of Cash Flows Relating to Income Taxes Generated by a Leveraged Lease Transaction, requires a recalculation of the timing of income recognition for a leveraged lease under SFAS 13, Accounting for Leases, when a change in the timing of income tax deductions directly related to the leveraged lease transaction occurs or is projected to occur. Any tax positions taken regarding the leveraged lease transaction must be recognized and measured in accordance with FIN 48 described above. This guidance was effective for PNC beginning January 1, 2007 with the cumulative effect of applying the provisions of this FSP being recognized through an adjustment to opening retained earnings. Any immediate or future reductions in earnings from the change in accounting would be recovered in subsequent years. Our adoption of the guidance in FSP FAS 13-2 resulted in an after-tax charge to beginning retained earnings at January 1, 2007 of approximately $149 million. |
86
NOTE 2 ACQUISITIONS AND DIVESTITURES
2008
NATIONAL CITY CORPORATION
On December 31, 2008, we acquired National City for approximately $6.1 billion. The total consideration included approximately $5.6 billion of common stock, representing approximately 95 million shares, $150 million of preferred stock and cash of $379 million paid to warrant holders by National City. The transaction requires no future contingent consideration payments.
National City, based in Cleveland, Ohio, was one of the nations largest financial services companies. At December 31, 2008, prior to our acquisition, National City had total assets of approximately $153 billion and total deposits of approximately $101 billion. National City operates through an extensive network in Ohio, Florida, Illinois, Indiana, Kentucky, Michigan, Missouri, Pennsylvania and Wisconsin and also conducts selected consumer lending businesses and other financial services on a nationwide basis. Its primary businesses include commercial and retail banking, mortgage financing and servicing, consumer finance and asset management. The primary reasons for the merger with National City were to enhance shareholder value, to improve PNCs competitive position in the financial services industry and to further expand PNCs existing branch network in states where it currently operates as well as expanding into new markets.
This acquisition was accounted for under the purchase method of accounting. The purchase price was allocated to the National City assets acquired and liabilities assumed using their estimated fair values as of the acquisition date, December 31, 2008. Since the acquisition occurred at year end, no results of operations of National City are included in the Consolidated Income Statement. The summary computation of the purchase price and the allocation of the purchase price to the net assets of National City are presented below. The allocation of the purchase price may be modified through 2009 as more information, such as appraisals, contracts, reviews of legal documentation, and selected key borrower data, is obtained about the fair value of assets acquired and liabilities assumed and may result in goodwill. We also have not yet finalized our plans to exit National City facilities or identified employee terminations. Completion of these plans will likely result in additional liabilities in future periods.
| (In millions, except per share data) | ||||||||
| Net assets acquired |
||||||||
| National City stockholders equity |
$ | 13,432 | ||||||
| Cash paid to certain warrant holders by National City |
379 | |||||||
| National City goodwill and other intangibles |
(3,275 | ) | ||||||
| Gross net assets acquired |
$ | 10,536 | ||||||
| Preliminary adjustments to reflect fair value of net assets acquired |
||||||||
| Principal balance of loans (a) |
(9,831 | ) | ||||||
| Allowance for loan losses on impaired loans |
2,632 | |||||||
| Other adjustments to loans |
433 | |||||||
| Deferred taxes |
2,720 | |||||||
| Other assets |
331 | |||||||
| Other intangibles, including servicing rights |
1,084 | |||||||
| Deposits (a) |
(1,930 | ) | ||||||
| Borrowed funds (a) |
2,395 | |||||||
| Accrued expenses and other liabilities |
(900 | ) | (3,066 | ) | ||||
| Adjusted net assets acquired |
7,470 | |||||||
| Purchase price |
||||||||
| National City common shares outstanding |
2,420 | |||||||
| Exchange ratio per share |
0.0392 | |||||||
| PNC common stock equivalent |
94.86 | |||||||
| Less: Fractional shares |
0.06 | |||||||
| PNC common stock issued |
94.80 | |||||||
| Average PNC share price over days surrounding announcement (b) |
$ | 59.09 | ||||||
| Purchase price for National City common shares outstanding |
$ | 5,601 | ||||||
| National City preferred stock converted to PNC preferred stock |
150 | |||||||
| Value of National City options converted to PNC options |
2 | |||||||
| Cash paid to certain warrant holders by National City |
379 | |||||||
| Cash in lieu of fractional shares |
1 | |||||||
| Total purchase price |
6,133 | |||||||
| Excess of fair value of adjusted net assets acquired over purchase price (c) |
$ | 1,337 | ||||||
| (a) | Amounts include premium, discount and other fair value adjustments. |
| (b) | The value of PNC common stock was determined by averaging its closing price for five trading days, including the announcement date of October 24, 2008. |
| (c) | The fair value of the net assets of National City exceeded the purchase price. In accordance with SFAS 141 Business Combinations, the fair value allocated to premises, equipment and leasehold improvements and other intangibles reduced these balances by $891 million and $446 million, respectively. |
87
Condensed Statement of National City Net Assets Acquired
The following condensed statement of net assets reflects the preliminary value assigned to National City net assets as of the December 31, 2008 acquisition date. The values are net of the reallocation of the excess value of net assets acquired over the purchase price ($1.337 billion), and the cash paid by National City to its warrant holders ($379 million).
| (In millions) | |||
| Assets |
|||
| Cash and due from banks |
$ | 2,144 | |
| Federal funds sold and resale agreements |
7,335 | ||
| Trading assets, interest-earning deposits with banks, and other short-term investments |
9,249 | ||
| Loans held for sale |
2,185 | ||
| Investment securities |
13,327 | ||
| Net loans |
97,435 | ||
| Other intangible assets |
1,797 | ||
| Equity investments |
2,060 | ||
| Other assets |
12,651 | ||
| Total assets |
$ | 148,183 | |
| Liabilities |
|||
| Deposits |
$ | 103,639 | |
| Federal funds purchased and repurchase agreements |
3,501 | ||
| Other borrowed funds |
21,919 | ||
| Other liabilities |
13,370 | ||
| Total liabilities |
142,429 | ||
| Net assets acquired |
$ | 5,754 | |
Purchase accounting adjustments include discounts and premiums on interest-earning assets and liabilities as follows:
| | Discounts on loans of $6.1 billion will be accreted to net interest income using the constant effective yield method over the weighted average life of the loans, estimated to be between two and three years. The weighted average lives could vary depending on prepayments, revised estimated cash flows and other related factors. Of the $6.1 billion of discounts, $3.7 billion relates to loans accounted for under SOP 03-3 and $2.4 billion relates to performing loans. A total of $3.7 billion of the fair value mark on impaired loans is not accretable. |
| | Premiums on interest-earning time deposits of $2.1 billion will be amortized over the weighted average life of the deposits of approximately one year using the constant effective yield method. |
| | Discounts on borrowed funds of $1.8 billion will be accreted over the weighted average life of the borrowings of approximately seven years using the constant effective yield method. |
Other intangible assets acquired consisted of the following (in millions):
| Intangible Asset | Fair Value |
Weighted Life |
Amortization Method |
||||||
| Residential mortgage servicing rights |
$ | 1,003 | (a | ) | (a | ) | |||
| Core deposit (b) |
351 | 12 yrs | Accelerated | ||||||
| Commercial mortgage servicing rights |
210 | 13 yrs | Accelerated | ||||||
| Wealth management customer relationships (b) |
203 | 12 yrs | Straight line | ||||||
| National City brand (b) |
15 | 21 mos | Straight line | ||||||
| Consumer loan servicing rights |
15 | 2 yrs | Accelerated | ||||||
| Total |
$ | 1,797 | |||||||
| (a) | Intangible asset carried at fair value. |
| (b) | Fair value adjusted for the allocation of the excess of fair value of net assets acquired over the purchase price. |
See Note 9 Goodwill and Other Intangible Assets for additional information.
88
The following table presents the unaudited pro forma combined results of operations of PNC and National City as if the acquisition had been completed as of the beginning of 2008 or 2007. The unaudited pro forma results of operations are presented solely for information purposes and are not intended to represent or be indicative of the consolidated results of operations that PNC would have reported had this transaction been completed as of the dates and for the periods presented, nor are they necessarily indicative of future results.
Unaudited Pro Forma Combined Results
| (In millions, except per share data) | 2008 | 2007 | |||||
| Total revenue |
$ | 15,397 | $ | 16,709 | |||
| Net income (loss) |
(3,742 | ) | 3,695 | ||||
|
Per share data |
|||||||
| Earnings (loss) basic |
$ | (9.58 | ) | $ | 7.66 | ||
| Earnings (loss) diluted |
(9.60 | ) | 7.55 | ||||
| Average common shares outstanding basic |
439 | 426 | |||||
| Average common shares outstanding diluted |
439 | 431 | |||||
The unaudited pro forma combined results of operations include the effect of the net amortization/accretion of purchase accounting fair value adjustments based on asset and liability valuations as of the acquisition date. They also reflect the receipt of $7.6 billion from the sale of preferred securities and issuance of a warrant to purchase 16.9 million shares of PNC common stock under the TARP Capital Purchase Program (See Note 19 Shareholders Equity for additional information). During 2008, National City recorded $2.4 billion of nonrecurring charges for goodwill impairments which are included in these pro forma results. These adjustments have been consistently applied to each period presented in the table above.
STERLING FINANCIAL CORPORATION
On April 4, 2008, we acquired Lancaster, Pennsylvania-based Sterling Financial Corporation (Sterling). Sterling shareholders received an aggregate of approximately 4.6 million shares of PNC common stock and $224 million of cash.
J.J.B. HILLIARD, W.L. LYONS, LLC
On March 31, 2008, we sold J.J.B. Hilliard, W.L. Lyons, LLC (Hilliard Lyons), a Louisville, Kentucky-based wholly-owned subsidiary of PNC and a full-service brokerage and financial services provider, to Houchens Industries, Inc. We recognized an after-tax gain of $23 million in the first quarter of 2008 in connection with this divestiture.
2007
ALBRIDGE SOLUTIONS INC.
On December 7, 2007, we acquired Albridge Solutions Inc. (Albridge), a Lawrenceville, New Jersey-based provider of portfolio accounting and enterprise wealth management services. Albridge extends PNC Global Investment Servicings capabilities into the delivery of knowledge-based information services through its relationships with financial institutions and financial advisors.
COATES ANALYTICS, LP
Also on December 7, 2007, we acquired Coates Analytics, LP (Coates Analytics), a Chadds Ford, Pennsylvania-based provider of web-based analytic tools that help asset managers identify wholesaler territories and financial advisor targets, promote products in the marketplace and strengthen competitive intelligence. Coates Analytics complements PNC Global Investment Servicings business strategy.
YARDVILLE NATIONAL BANCORP
On October 26, 2007 we acquired Hamilton, New Jersey-based Yardville National Bancorp (Yardville). Yardville shareholders received an aggregate of approximately 3.4 million shares of PNC common stock and $156 million in cash. Total consideration paid was approximately $399 million in stock and cash.
ARCS COMMERCIAL MORTGAGE CO., L.P.
On July 2, 2007, we acquired ARCS Commercial Mortgage Co., L.P. (ARCS), a Calabasas Hills, California-based lender with 10 origination offices in the United States. ARCS has been a leading originator and servicer of agency multifamily loans for the past decade.
89
MERCANTILE BANKSHARES CORPORATION
Effective March 2, 2007, we acquired Mercantile Bankshares Corporation (Mercantile). Mercantile shareholders received an aggregate of approximately 53 million shares of PNC common stock and $2.1 billion in cash. Total consideration paid was approximately $5.9 billion in stock and cash.
2006
BLACKROCK/MLIM TRANSACTION
On September 29, 2006, Merrill Lynch contributed its investment management business (MLIM) to BlackRock in exchange for 65 million shares of newly issued BlackRock common and preferred stock. BlackRock accounted for the MLIM transaction under the purchase method of accounting. Immediately following the closing, PNC continued to own 44 million shares of BlackRock common stock representing an ownership interest of 34% of the combined company (as compared with 69% immediately prior to the closing).
We also recorded a liability at September 30, 2006 for deferred taxes of $.9 billion, related to the excess of the book value over the tax basis of our investment in BlackRock, and a liability of $.6 billion related to our obligation to provide shares of BlackRock common stock to help fund certain BlackRock long-term incentive plan (LTIP) programs. Beginning with fourth quarter 2006, we recognize gain or loss each quarter-end on our remaining liability to provide shares of BlackRock common stock to help fund certain BlackRock LTIP programs as that liability is marked to market based on changes in BlackRocks common stock price. We recognized a pretax gain of $82 million in the first quarter of 2007 from the transfer of BlackRock shares for certain payouts under one of these programs. Additional BlackRock shares were distributed to LTIP participants in the first quarter of 2008, resulting in a $3 million pretax gain.
The overall balance sheet impact of the BlackRock/MLIM transaction was an increase to our shareholders equity of $1.6 billion. The increase to equity was comprised of an after-tax gain of $1.3 billion, net of the expense associated with the LTIP liability and the deferred taxes, and an after-tax increase to capital surplus of $.3 billion. The recognition of the gain is consistent with our existing accounting policy for the sale or issuance by subsidiaries of their stock to third parties. The gain represents the difference between our basis in BlackRock stock prior to the BlackRock/MLIM transaction and the new book value per share and resulting increase in value of our investment realized from the transaction. The direct increase to capital surplus rather than inclusion in the gain resulted from the accounting treatment required due to existing BlackRock repurchase commitments or programs.
For the nine months ended September 30, 2006, our Consolidated Income Statement included our former 69% 71% ownership interest in BlackRocks net income through the closing date. However, beginning September 30, 2006, our Consolidated Balance Sheet no longer reflected the consolidation of BlackRocks balance sheet but recognized our ownership interest in BlackRock as an investment accounted for under the equity method. Since that date, our share of BlackRocks net income is reported within asset management noninterest income in PNCs Consolidated Income Statement.
NOTE 3 VARIABLE INTEREST ENTITIES
We are involved with various entities in the normal course of business that were deemed to be VIEs. We consolidated certain VIEs as of December 31, 2008 and 2007 for which we were determined to be the primary beneficiary.
Consolidated VIEs PNC Is Primary Beneficiary
| In millions | Aggregate Assets |
Aggregate Liabilities |
||||
| Partnership interests in low income housing projects (a) |
||||||
| December 31, 2008 |
$ | 1,499 | $ | 863 | ||
| December 31, 2007 |
$ | 1,108 | $ | 516 | ||
| Credit Risk Transfer Transaction (b) |
||||||
| December 31, 2008 |
$ | 1,070 | $ | 1,070 | ||
| (a) | Amounts for December 31, 2008 include National City, which PNC acquired on that date. |
| (b) | National City-related transaction. |
90
We hold significant variable interests in VIEs that have not been consolidated because we are not considered the primary beneficiary. Information on these VIEs follows:
Non-Consolidated VIEs Significant Variable Interests
| In millions | Aggregate Assets |
Aggregate Liabilities |
PNC Risk of Loss |
|||||||
| December 31, 2008 |
||||||||||
| Market Street |
$ | 4,916 | $ | 5,010 | $ | 6,965 | (a) | |||
| Collateralized debt obligations |
20 | 2 | ||||||||
| Partnership interests in tax credit investments (b) (c) (d) |
1,095 | 652 | 920 | |||||||
| Total (c) |
$ | 6,031 | $ | 5,662 | $ | 7,887 | ||||
| December 31, 2007 |
||||||||||
| Market Street |
$ | 5,304 | $ | 5,330 | $ | 9,019 | (a) | |||
| Collateralized debt obligations |
255 | 177 | 6 | |||||||
| Partnership interests in low income housing projects |
298 | 184 | 155 | |||||||
| Total |
$ | 5,857 | $ | 5,691 | $ | 9,180 | ||||
| (a) | PNCs risk of loss consists of off-balance sheet liquidity commitments to Market Street of $6.4 billion and other credit enhancements of $.6 billion at December 31, 2008. The comparable amounts were $8.8 billion and $.2 billion at December 31, 2007. |
| (b) | Amounts reported primarily represent low income housing projects. |
| (c) | Amounts include the impact of National City. |
| (d) | Aggregate assets and aggregate liabilities at December 31, 2008 represent approximate balances due to limited availability of financial information associated with the acquired National City partnerships that we did not sponsor. |
MARKET STREET
Market Street Funding LLC (Market Street) is a multi-seller asset-backed commercial paper conduit that is owned by an independent third party. Market Streets activities primarily involve purchasing assets or making loans secured by interests in pools of receivables from US corporations that desire access to the commercial paper market. Market Street funds the purchases of assets or loans by issuing commercial paper which has been rated A1/P1 by Standard & Poors and Moodys, respectively, and is supported by pool-specific credit enhancements, liquidity facilities and program-level credit enhancement. Generally, Market Street mitigates its potential interest rate risk by entering into agreements with its borrowers that reflect interest rates based upon its weighted average commercial paper cost of funds. During 2007 and 2008, Market Street met all of its funding needs through the issuance of commercial paper.
PNC Bank, N.A. provides certain administrative services, the program-level credit enhancement and 99% of liquidity facilities to Market Street in exchange for fees negotiated based on market rates. PNC recognized program administrator fees and commitment fees related to PNCs portion of the liquidity facilities of $21 million and $4 million, respectively, for the year ended December 31, 2008. The comparable amounts were $13 million and $4 million for the year ended December 31, 2007.
The commercial paper obligations at December 31, 2008 and December 31, 2007 were effectively collateralized by Market Streets assets. While PNC may be obligated to fund under the $6.4 billion of liquidity facilities for events such as commercial paper market disruptions, borrower bankruptcies, collateral deficiencies or covenant violations, our credit risk under the liquidity facilities is secondary to the risk of first loss provided by the borrower or another third party in the form of deal-specific credit enhancement, such as by the over collateralization of the assets. Deal-specific credit enhancement that supports the commercial paper issued by Market Street is generally structured to cover a multiple of expected losses for the pool of assets and is sized to generally meet rating agency standards for comparably structured transactions. In addition, PNC would be required to fund $1.0 billion of the liquidity facilities if the underlying assets are in default. See Note 25 Commitments and Guarantees for additional information.
PNC provides program-level credit enhancement to cover net losses in the amount of 10% of commitments, excluding explicitly rated AAA/Aaa facilities. PNC provides 100% of the enhancement in the form of a cash collateral account funded by a loan facility. This facility expires in March 2013. Until November 25, 2008, PNC provided only 25% of the enhancement in the form of a cash collateral account funded by a loan facility and provided a liquidity facility for the remaining 75% of program-level enhancement.
Market Street has entered into a Subordinated Note Purchase Agreement (Note) with an unrelated third party. The Note provides first loss coverage whereby the investor absorbs losses up to the amount of the Note, which was $6.6 million as of December 31, 2008. Proceeds from the issuance of the Note are held by Market Street in a first loss reserve account that will be used to reimburse any losses incurred by Market Street, PNC Bank, N.A. or other providers under the liquidity facilities and the credit enhancement arrangements.
91
We evaluated the design of Market Street, its capital structure, the Note and relationships among the variable interest holders under the provisions of FIN 46R. Based on this analysis, we are not the primary beneficiary as defined by FIN 46R and therefore the assets and liabilities of Market Street are not reflected in our Consolidated Balance Sheet.
PNC considers changes to the variable interest holders (such as new expected loss note investors and changes to program-level credit enhancement providers), changes to the terms of expected loss notes, and new types of risks related to Market Street as reconsideration events. PNC reviews the activities of Market Street on at least a quarterly basis to determine if a reconsideration event has occurred.
LOW INCOME HOUSING PROJECTS
We make certain equity investments in various limited partnerships that sponsor affordable housing projects utilizing the Low Income Housing Tax Credit (LIHTC) pursuant to Sections 42 and 47 of the Internal Revenue Code. The purpose of these investments is to achieve a satisfactory return on capital, to facilitate the sale of additional affordable housing product offerings and to assist us in achieving goals associated with the Community Reinvestment Act. The primary activities of the limited partnerships include the identification, development and operation of multi-family housing that is leased to qualifying residential tenants. Generally, these types of investments are funded through a combination of debt and equity. We typically invest in these partnerships as a limited partner.
Also, we are a national syndicator of affordable housing equity (together with the investments described above, the LIHTC investments). In these syndication transactions, we create funds in which our subsidiaries are the general partner and sell limited partnership interests to third parties, and in some cases may also purchase a limited partnership interest in the fund and/or provide mezzanine financing to the fund. The purpose of this business is to generate income from the syndication of these funds and to generate servicing fees by managing the funds. General partner activities include selecting, evaluating, structuring, negotiating, and closing the fund investments in operating limited partnerships, as well as oversight of the ongoing operations of the fund portfolio.
We evaluate our interests and third party interests in the limited partnerships in determining whether we are the primary beneficiary. The primary beneficiary determination is based on which party absorbs a majority of the variability. The primary sources of variability in LIHTC investments are the tax credits, tax benefits of losses on the investments and development and operating cash flows. We have consolidated LIHTC investments in which we absorb a majority of the variability and thus are considered the primary beneficiary. The assets are primarily included in Equity Investments and Other Assets on our Consolidated Balance Sheet with the liabilities primarily classified in Other Liabilities and Noncontrolling Interests. Neither creditors nor equity investors in the LIHTC investments have any recourse to our general credit. The consolidated aggregate assets and liabilities of these LIHTC investments are provided in the Consolidated VIEs PNC Is Primary Beneficiary table and reflected in the Other business segment.
We also have LIHTC investments in which we are not the primary beneficiary, but are considered to have a significant variable interest based on our interests in the partnership. These investments are disclosed in the Non-Consolidated VIEs Significant Variable Interests table. The table also reflects our maximum exposure to loss. Our maximum exposure to loss is equal to our legally binding equity commitments adjusted for recorded impairment and partnership results. We use the equity and cost methods to account for our investment in these entities with the investments reflected in Equity Investments on our Consolidated Balance Sheet. In addition, we increase our recognized investments and recognize a liability for all legally binding unfunded equity commitments. These liabilities are reflected in Other Liabilities on our Consolidated Balance Sheet.
CREDIT RISK TRANSFER TRANSACTION
National City Bank (NCB) sponsored a special purpose entity (SPE) trust and concurrently entered into a credit risk transfer agreement with an independent third-party to mitigate credit losses on a pool of nonconforming mortgage loans originated by its former First Franklin business unit. The SPE was formed with a small contribution from NCB and was structured as a bankruptcy-remote entity so that its creditors have no recourse to NCB. In exchange for a perfected security interest in the cash flows of the nonconforming mortgage loans, the SPE issued to NCB asset-backed securities in the form of senior, mezzanine, and subordinated equity notes. NCB has incurred credit losses equal to the subordinated equity notes. NCB currently holds the right to put the mezzanine notes to the independent third-party at par. As of December 31, 2008, the value of the mezzanine notes was $169 million. NCB holds the senior notes and will be responsible for credit losses in excess of this amount.
The SPE was deemed to be a VIE as its equity was not sufficient to finance its activities. NCB was determined to be the primary beneficiary of the SPE as it would absorb the majority of the expected losses of the SPE through its holding of all of the asset-backed securities. Accordingly, this SPE was consolidated and all of the entitys assets, liabilities, and equity are intercompany balances and are eliminated in consolidation. Nonconforming mortgage loans, including foreclosed properties, pledged as collateral to the SPE remain on the balance sheet and totaled $719 million at December 31, 2008 reflecting the impact of fair value adjustments recorded by PNC in conjunction with the acquisition.
PERPETUAL TRUST SECURITIES
We issue certain hybrid capital vehicles that qualify as capital for regulatory purposes.
92
In February 2008, PNC Preferred Funding LLC (the LLC), one of our indirect subsidiaries, sold $375 million of 8.700% Fixed-to-Floating Rate Non-Cumulative Exchangeable Perpetual Trust Securities of PNC Preferred Funding Trust III (Trust III) to third parties in a private placement. In connection with the private placement, Trust III acquired $375 million of Fixed-to-Floating Rate Non-Cumulative Perpetual Preferred Securities of the LLC (the LLC Preferred Securities). The sale was similar to the March 2007 private placement by the LLC of $500 million of 6.113% Fixed-to-Floating Rate Non-Cumulative Exchangeable Trust Securities (the Trust II Securities) of PNC Preferred Funding Trust II (Trust II) in which Trust II acquired $500 million of LLC Preferred Securities and to the December 2006 private placement by PNC REIT Corp. of $500 million of 6.517% Fixed-to-Floating Rate Non-Cumulative Exchangeable Perpetual Trust Securities (the Trust I Securities) of PNC Preferred Funding Trust I (Trust I) in which Trust I acquired $500 million of LLC Preferred Securities. PNC REIT Corp. owns 100% of LLCs common voting securities. As a result, LLC is an indirect subsidiary of PNC and is consolidated on our Consolidated Balance Sheet. Trust I, II and IIIs investment in LLC Preferred Securities is characterized as a noncontrolling interest on our Consolidated Balance Sheet since we are not the primary beneficiary of Trust I, Trust II and Trust III. This noncontrolling interest totaled approximately $1.3 billion at December 31, 2008.
PNC has contractually committed to Trust II and Trust III that if full dividends are not paid in a dividend period on the Trust II Securities or the Trust III Securities, as applicable, or the LLC Preferred Securities held by Trust II or Trust III, as applicable, PNC will not declare or pay dividends with respect to, or redeem, purchase or acquire, any of its equity capital securities during the next succeeding dividend period, other than: (i) purchases, redemptions or other acquisitions of shares of capital stock of PNC in connection with any employment contract, benefit plan or other similar arrangement with or for the benefit of employees, officers, directors or consultants, (ii) purchases of shares of common stock of PNC pursuant to a contractually binding requirement to buy stock existing prior to the commencement of the extension period, including under a contractually binding stock repurchase plan, (iii) any dividend in connection with the implementation of a shareholders rights plan, or the redemption or repurchase of any rights under any such plan, (iv) as a result of an exchange or conversion of any class or series of PNCs capital stock for any other class or series of PNCs capital stock, (v) the purchase of fractional interests in shares of PNC capital stock pursuant to the conversion or exchange provisions of such stock or the security being converted or exchanged or (vi) any stock dividends paid by PNC where the dividend stock is the same stock as that on which the dividend is being paid.
PNC Bank, N.A. has contractually committed to Trust I that if full dividends are not paid in a dividend period on the Trust I Securities, LLC Preferred Securities or any other parity equity securities issued by the LLC, neither PNC Bank, N.A. nor its subsidiaries will declare or pay dividends or other distributions with respect to, or redeem, purchase or acquire or make a liquidation payment with respect to, any of its equity capital securities during the next succeeding period (other than to holders of the LLC Preferred Securities and any parity equity securities issued by the LLC) except: (i) in the case of dividends payable to subsidiaries of PNC Bank, N.A., to PNC Bank, N.A. or another wholly-owned subsidiary of PNC Bank, N.A. or (ii) in the case of dividends payable to persons that are not subsidiaries of PNC Bank, N.A., to such persons only if, (A) in the case of a cash dividend, PNC has first irrevocably committed to contribute amounts at least equal to such cash dividend or (B) in the case of in-kind dividends payable by PNC REIT Corp., PNC has committed to purchase such in-kind dividend from the applicable PNC REIT Corp. holders in exchange for a cash payment representing the market value of such in-kind dividend, and PNC has committed to contribute such in-kind dividend to PNC Bank, N.A.
NOTE 4 LOANS, COMMITMENTS TO EXTEND CREDIT AND CONCENTRATIONS OF CREDIT RISK
Loans outstanding were as follows:
| December 31 - in millions | 2008 (a) | 2007 | ||||
| Commercial |
$ | 67,319 | $ | 28,539 | ||
| Commercial real estate |
25,736 | 8,903 | ||||
| Consumer |
52,489 | 18,393 | ||||
| Residential real estate |
21,583 | 9,557 | ||||
| Equipment lease financing |
6,461 | 2,514 | ||||
| Other |
1,901 | 413 | ||||
| Total loans |
$ | 175,489 | $ | 68,319 | ||
| (a) | Amounts at December 31, 2008 include $99.7 billion of loans related to National City. |
Loans are presented net of unearned income, net deferred loan fees, unamortized discounts and premiums, and purchase discounts and premiums totaling $4.1 billion and $990 million at December 31, 2008 and 2007, respectively.
Concentrations of credit risk exist when changes in economic, industry or geographic factors similarly affect groups of counterparties whose aggregate exposure is material in relation to our total credit exposure. Loans outstanding and related unfunded commitments are concentrated in our primary geographic markets. At December 31, 2008, no specific industry concentration exceeded 7% of total commercial loans outstanding.
In the normal course of business, we originate or purchase loan products whose contractual features, when concentrated, may increase our exposure as a holder and servicer of those loan products. Possible product terms and features that may create a concentration of credit risk would include loan products whose terms permit negative amortization, a high loan-to-value ratio, features that may expose
93
the borrower to future increases in repayments above increases in market interest rates, below-market interest rates and interest-only loans, among others.
We originate interest-only loans to commercial borrowers. These products are standard in the financial services industry and the features of these products are considered during the underwriting process to mitigate the increased risk of this product feature that may result in borrowers not being able to make interest and principal payments when due. We do not believe that these product features create a concentration of credit risk.
We also originate home equity loans and lines of credit that result in a credit concentration of high loan-to-value ratio loan products at the time of origination. In addition, these loans are concentrated in our primary geographic markets as discussed above. At December 31, 2008, $6.8 billion of the $38.3 billion of home equity loans (included in Consumer in the table above) had a loan-to-value ratio greater than 90%. These loans are collateralized primarily by 1-4 family residential properties. Included in the residential real estate category in the table above, at December 31, 2008, $5.6 billion of the $18.8 billion of residential mortgage loans were interest-only loans.
We realized a net loss on sales of commercial mortgages of $6 million in 2008, and net gains of $39 million in 2007 and $55 million in 2006. Loans held for sale are reported separately on the Consolidated Balance Sheet and are not included in the table above. Gains on sales of education loans totaled $24 million in 2007 and $33 million in 2006. In February 2008, we transferred education loans from held for sale to the loan portfolio and did not recognize any gains on sales of education loans during 2008. Interest income from total loans held for sale was $166 million for 2008, $184 million for 2007, and $157 million for 2006 and is included in Other interest income in our Consolidated Income Statement.
Net Unfunded Credit Commitments
| December 31 - in millions | 2008 (a) | 2007 | ||||
| Commercial and commercial real estate |
$ | 59,982 | $ | 42,021 | ||
| Home equity lines of credit |
23,195 | 8,680 | ||||
| Consumer credit card lines |
19,028 | 969 | ||||
| Other |
2,683 | 1,677 | ||||
| Total |
$ | 104,888 | $ | 53,347 | ||
| (a) | Amounts at December 31, 2008 include $53.9 billion of net unfunded credit commitments related to National City. |
Commitments to extend credit represent arrangements to lend funds subject to specified contractual conditions. At December 31, 2008, commercial commitments are reported net of $8.6 billion of participations, assignments and syndications, primarily to financial services companies. The comparable amount at December 31, 2007 was $8.9 billion. Commitments generally have fixed expiration dates, may require payment of a fee, and contain termination clauses in the event the customers credit quality deteriorates. Based on our historical experience, most commitments expire unfunded, and therefore cash requirements are substantially less than the total commitment. Consumer home equity lines of credit accounted for 55% of consumer unfunded credit commitments.
Unfunded credit commitments related to Market Street totaled $6.4 billion at December 31, 2008 and $8.8 billion at December 31, 2007 and are included in the preceding table primarily within the Commercial and Consumer categories.
At December 31, 2008, we pledged $32.9 billion of loans to the Federal Reserve Bank (FRB) and $50.0 billion of loans to the Federal Home Loan Bank (FHLB) as collateral for the contingent ability to borrow, if necessary.
94
NOTE 5 ASSET QUALITY
The following table sets forth nonperforming assets and related information:
| December 31 - dollars in millions | 2008 (a) | 2007 | ||||||
| Nonaccrual loans |
||||||||
| Commercial |
$ | 576 | $ | 193 | ||||
| Commercial real estate |
766 | 212 | ||||||
| Equipment lease financing |
97 | 3 | ||||||
| TOTAL COMMERCIAL LENDING |
1,439 | 408 | ||||||
| Consumer |
||||||||
| Home equity |
66 | 16 | ||||||
| Other |
4 | 1 | ||||||
| Total consumer |
70 | 17 | ||||||
| Residential real estate |
||||||||
| Residential mortgage |
139 | 26 | ||||||
| Residential construction |
14 | 1 | ||||||
| Total residential real estate |
153 | 27 | ||||||
| TOTAL CONSUMER LENDING |
223 | 44 | ||||||
| Total nonaccrual loans |
1,662 | 452 | ||||||
| Restructured loans |
2 | |||||||
| Total nonperforming loans |
1,662 | 454 | ||||||
| Foreclosed and other assets |
||||||||
| Commercial lending |
34 | 23 | ||||||
| Consumer |
11 | 8 | ||||||
| Residential real estate |
458 | 10 | ||||||
| Total foreclosed and other assets |
503 | 41 | ||||||
| Total nonperforming assets (b) (c) |
$ | 2,165 | $ | 495 | ||||
| Nonperforming loans to total loans |
.95 | % | .66 | % | ||||
| Nonperforming assets to total loans and foreclosed assets |
1.23 | .72 | ||||||
| Nonperforming assets to total assets |
.74 | .36 | ||||||
| Interest on nonperforming loans |
||||||||
| Computed on original terms |
$ | 115 | $ | 51 | ||||
| Recognized prior to nonperforming status |
60 | 32 | ||||||
| Past due loans |
||||||||
| Accruing loans past due 90 days or more |
$ | 3,259 | $ | 136 | ||||
| As a percentage of total loans |
1.86 | % | .20 | % | ||||
| (a) | Amounts at December 31, 2008 include $722 million of nonperforming assets related to National City. Nonperforming assets of National City are comprised of $250 million of nonperforming loans, including $154 million related to commercial lending and $96 million related to consumer lending, and $472 million of foreclosed and other assets. Nonperforming assets added with the National City acquisition excluded those loans that PNC impaired in accordance with SOP 03-3. See Note 6 Certain Loans Acquired in a Transfer for additional information regarding SOP 03-3 loans. |
| (b) | Excludes equity management assets carried at estimated fair value of $42 million at December 31, 2008 and $4 million at December 31, 2007. |
| (c) | Excludes loans held for sale carried at lower of cost or market value of $78 million at December 31, 2008 and $25 million at December 31, 2007, including troubled debt restructured assets of $5 million at December 31, 2008. |
Net interest income less the provision for credit losses was $2.306 billion for 2008 compared with $2.600 billion for 2007 and $2.121 billion for 2006.
Changes in the allowance for loan and lease losses were as follows:
| In millions | 2008 | 2007 | 2006 | |||||||||
| January 1 |
$ | 830 | $ | 560 | $ | 596 | ||||||
| Charge-offs |
(618 | ) | (245 | ) | (180 | ) | ||||||
| Recoveries |
79 | 45 | 40 | |||||||||
| Net charge-offs |
(539 | ) | (200 | ) | (140 | ) | ||||||
| Provision for credit losses (a) |
1,517 | 315 | 124 | |||||||||
| Acquired allowance National City |
2,224 | |||||||||||
| Acquired allowance other (b) |
20 | 152 | ||||||||||
| Net change in allowance for unfunded loan commitments and letters of credit |
(135 | ) | 3 | (20 | ) | |||||||
| December 31 |
$ | 3,917 | $ | 830 | $ | 560 | ||||||
| (a) | Amount for 2008 includes conforming provision adjustments of $504 million related to National City and $23 million related to Sterling. Amount for 2007 includes a conforming provision adjustment of $45 million related to Yardville. |
| (b) | Sterling in 2008. Amount for 2007 includes $137 million related to Mercantile and $15 million related to Yardville. |
95
Changes in the allowance for unfunded loan commitments and letters of credit were as follows:
| In millions | 2008 | 2007 | 2006 | |||||||
| Allowance at January 1 |
$ | 134 | $ | 120 | $ | 100 | ||||
| Acquired allowance National City |
74 | |||||||||
| Acquired allowance other (a) |
1 | 17 | ||||||||
| Net change in allowance for unfunded loan commitments and letters of credit |
135 | (3 | ) | 20 | ||||||
| December 31 |
$ | 344 | $ | 134 | $ | 120 | ||||
| (a) | Sterling in 2008 and Mercantile in 2007. |
Impaired loans, as defined under SFAS 114, exclude leases and smaller homogenous type loans as well as National City impaired loans accounted for pursuant to SOP 03-3. We did not recognize any interest income on loans while they were impaired in 2008, 2007 or 2006. The following table provides further detail on impaired loans and the associated allowance for loan losses:
SFAS 114 SUMMARY OF IMPAIRED LOANS (a)
| At December 31 In millions |
2008 | 2007 | ||||
| Impaired loans with an associated reserve |
$ | 1,249 | $ | 371 | ||
| Impaired loans without an associated reserve |
93 | 36 | ||||
| Total impaired loans |
$ | 1,342 | $ | 407 | ||
| Specific allowance for credit losses |
$ | 405 | $ | 124 | ||
| Average impaired loan balance |
$ | 674 | $ | 200 | ||
| (a) | Excludes residential, leasing and construction loans. |
NOTE 6 ACCOUNTING FOR CERTAIN LOANS ACQUIRED IN A TRANSFER
Loans acquired with evidence of credit quality deterioration since origination and for which it is probable at purchase that PNC will be unable to collect all contractually required payments are accounted for under SOP 03-3. Evidence of credit quality deterioration as of the purchase date includes statistics such as past due status, current borrower FICO credit scores, geographic concentration and current loan-to-value (LTV), some of which are not immediately available as of the purchase date. We will continue to evaluate this information and other credit related information as it becomes available. SOP 03-3 addresses accounting for differences between contractual cash flows and cash flows expected to be collected from our initial investment in loans if those differences are attributable, at least in part, to credit quality. SOP 03-3 requires acquired impaired loans to be recorded at fair value and prohibits carrying over or the creation of valuation allowances in the initial accounting for loans acquired in a transfer that are within the scope of this SOP. A total of $2.6 billion of National City allowance for loan losses was not carried over in purchase accounting. Excluded from the scope were leases, revolving credit arrangements and certain loans held for sale.
The fair values for loans within the scope of SOP 03-3 are determined by discounting both principal and interest cash flows expected to be collected using an observable discount rate for similar instruments with adjustments that management believes a market participant would consider in determining fair value. We estimate the cash flows expected to be collected at acquisition using internal and third party models that incorporate managements best estimate of current key assumptions, such as default rates, loss severity and payment speeds.
As of December 31, 2008, acquired loans within the scope of SOP 03-3 had a carrying value of $11.9 billion and an unpaid principal balance of $19.3 billion as detailed below:
| December 31, 2008 | ||||||
| In millions | Carrying Value | Outstanding Balance | ||||
| Commercial |
$ | 493 | $ | 1,180 | ||
| Commercial real estate |
1,340 | 2,831 | ||||
| Consumer |
3,924 | 5,785 | ||||
| Residential real estate |
6,154 | 9,482 | ||||
| Other |
10 | 14 | ||||
| Total |
$ | 11,921 | $ | 19,292 | ||
96
Acquired Loan Information
| In millions | December 31, 2008 |
||
| Contractually required payments including interest |
$ | 23,845 | |
| Less: Nonaccretable difference |
8,256 | ||
| Cash flows expected to be collected |
15,589 | ||
| Less: Accretable yield |
3,668 | ||
| Fair value of loans acquired |
$ | 11,921 | |
Under SOP 03-3, the excess of cash flows expected at acquisition over the estimated fair value is referred to as the accretable yield and is recognized in interest income over the remaining life of the loan using the constant effective yield method. The difference between contractually required payments at acquisition and the cash flows expected to be collected at acquisition is referred to as the nonaccretable difference. Changes in the expected cash flows from the date of acquisition will either impact the accretable yield or result in a charge to the provision for credit losses in the period in which the changes become probable. Subsequent decreases to the expected cash flows will generally result in a charge to the provision for credit losses resulting in an increase to the allowance for loan and lease losses, and a reclassification from accretable yield to nonaccretable difference. Subsequent increases in cash flows will result in a recovery of any previously recorded allowance for loan and lease losses, to the extent applicable, and a reclassification from nonaccretable difference to accretable yield. There was no allowance for loan and lease losses related to loans acquired within the scope of SOP 03-3 as of December 31, 2008. Disposals of loans, which may include sales of loans, receipt of payments in full by the borrower, foreclosure, or troubled debt restructurings result in removal of the loan from the SOP 03-3 portfolio at its carrying amount.
There were no changes in the accretable yield of loans during 2008 as the majority of SOP 03-3 loans were acquired in connection with the National City acquisition as of December 31, 2008.
97
NOTE 7 INVESTMENT SECURITIES
| Amortized | Unrealized | Fair | |||||||||||
| In millions | Cost | Gains | Losses | Value | |||||||||
| December 31, 2008 |
|||||||||||||
| SECURITIES AVAILABLE FOR SALE (a) |
|||||||||||||
| Debt securities |
|||||||||||||
| US Treasury and government agencies |
$ | 738 | $ | 1 | $ | 739 | |||||||
| Residential mortgage-backed |
|||||||||||||
| Agency |
22,744 | 371 | $ | (9 | ) | 23,106 | |||||||
| Nonagency |
13,205 | (4,374 | ) | 8,831 | |||||||||
| Commercial mortgage-backed |
4,305 | (859 | ) | 3,446 | |||||||||
| Asset-backed |
2,069 | 4 | (446 | ) | 1,627 | ||||||||
| State and municipal |
1,326 | 13 | (76 | ) | 1,263 | ||||||||
| Other debt |
563 | 11 | (15 | ) | 559 | ||||||||
| Total debt securities |
44,950 | 400 | (5,779 | ) | 39,571 | ||||||||
| Corporate stocks and other |
575 | (4 | ) | 571 | |||||||||
| Total securities available for sale |
$ | 45,525 | $ | 400 | $ | (5,783 | ) | $ | 40,142 | ||||
| SECURITIES HELD TO MATURITY (b) |
|||||||||||||
| Debt securities |
|||||||||||||
| Commercial mortgage-backed |
$ | 1,945 | $ | 10 | $ | (59 | ) | $ | 1,896 | ||||
| Asset-backed |
1,376 | 7 | (25 | ) | 1,358 | ||||||||
| Other debt |
10 | 10 | |||||||||||
| Total debt securities |
3,331 | 17 | (84 | ) | 3,264 | ||||||||
| Total securities held to maturity |
$ | 3,331 | $ | 17 | $ | (84 | ) | $ | 3,264 | ||||
| December 31, 2007 |
|||||||||||||
| SECURITIES AVAILABLE FOR SALE |
|||||||||||||
| Debt securities |
|||||||||||||
| U.S. Treasury and government agencies |
$ | 151 | $ | 4 | $ | 155 | |||||||
| Residential mortgage-backed |
|||||||||||||
| Agency |
9,218 | 112 | $ | (16 | ) | 9,314 | |||||||
| Nonagency |
11,929 | 6 | (297 | ) | 11,638 | ||||||||
| Commercial mortgage-backed |
5,227 | 53 | (16 | ) | 5,264 | ||||||||
| Asset-backed |
2,878 | 4 | (112 | ) | 2,770 | ||||||||
| State and municipal |
340 | 1 | (5 | ) | 336 | ||||||||
| Other debt |
85 | (1 | ) | 84 | |||||||||
| Total debt securities |
29,828 | 180 | (447 | ) | 29,561 | ||||||||
| Corporate stocks and other |
662 | 2 | 664 | ||||||||||
| Total securities available for sale |
$ | 30,490 | $ | 182 | $ | (447 | ) | $ | 30,225 | ||||
| December 31, 2006 |
|||||||||||||
| SECURITIES AVAILABLE FOR SALE |
|||||||||||||
| Debt securities |
|||||||||||||
| US Treasury and government agencies |
$ | 611 | $ | (3 | ) | $ | 608 | ||||||
| Residential mortgage-backed |
|||||||||||||
| Agency |
4,351 | $ | 13 | (33 | ) | 4,331 | |||||||
| Nonagency |
12,974 | 26 | (123 | ) | 12,877 | ||||||||
| Commercial mortgage-backed |
3,231 | 13 | (25 | ) | 3,219 | ||||||||
| Asset-backed |
1,615 | 3 | (9 | ) | 1,609 | ||||||||
| State and municipal |
140 | 1 | (2 | ) | 139 | ||||||||
| Other debt |
90 | (3 | ) | 87 | |||||||||
| Total debt securities |
23,012 | 56 | (198 | ) | 22,870 | ||||||||
| Corporate stocks and other |
321 | 1 | (1 | ) | 321 | ||||||||
| Total securities available for sale |
$ | 23,333 | $ | 57 | $ | (199 | ) | $ | 23,191 | ||||
| (a) | During the fourth quarter of 2008, we transferred $.6 billion of trading securities to the available for sale portfolio. |
| (b) | During the fourth quarter of 2008, we transferred $3.2 billion of securities available for sale to the securities held to maturity portfolio. At December 31, 2008, the balance of the after-tax unrealized loss related to the securities transferred was $342 million. |
The fair value of investment securities is impacted by interest rates, credit spreads, market volatility and illiquidity. Net unrealized gains and losses in the securities available for sale portfolio are included in shareholders equity as accumulated other comprehensive income or loss, net of tax.
98
The following table presents unrealized loss and fair value of investment securities at December 31, 2008 and December 31, 2007 for which an other-than-temporary impairment has not been recognized. These securities are segregated between investments that have been in a continuous unrealized loss position for less than twelve months and twelve months or more.
| Unrealized loss position less than 12 months |
Unrealized loss position 12 months or more |
Total | |||||||||||||||||||
| In millions | Unrealized Loss |
Fair Value |
Unrealized Loss |
Fair Value |
Unrealized Loss |
Fair Value |
|||||||||||||||
| December 31, 2008 |
|||||||||||||||||||||
| Securities available for sale |
|||||||||||||||||||||
| Debt securities |
|||||||||||||||||||||
| Residential mortgage-backed |
$ | (1,775 | ) | $ | 3,619 | ($ | 2,608 | ) | $ | 3,871 | ($ | 4,383 | ) | $ | 7,490 | ||||||
| Commercial mortgage-backed |
(482 | ) | 2,207 | (377 | ) | 1,184 | (859 | ) | 3,391 | ||||||||||||
| Asset-backed |
(102 | ) | 523 | (344 | ) | 887 | (446 | ) | 1,410 | ||||||||||||
| State and municipal |
(56 | ) | 370 | (20 | ) | 26 | (76 | ) | 396 | ||||||||||||
| Other debt |
(11 | ) | 185 | (4 | ) | 8 | (15 | ) | 193 | ||||||||||||
| Total |
$ | (2,426 | ) | $ | 6,904 | $ | (3,353 | ) | $ | 5,976 | $ | (5,779 | ) | $ | 12,880 | ||||||
| December 31, 2007 |
|||||||||||||||||||||
| Securities available for sale |
|||||||||||||||||||||
| Debt securities |
|||||||||||||||||||||
| Residential mortgage-backed |
$ | (157 | ) | $ | 6,994 | $ | (156 | ) | $ | 5,065 | $ | (313 | ) | $ | 12,059 | ||||||
| Commercial mortgage-backed |
(3 | ) | 365 | (13 | ) | 769 | (16 | ) | 1,134 | ||||||||||||
| Asset-backed |
(87 | ) | 1,519 | (25 | ) | 655 | (112 | ) | 2,174 | ||||||||||||
| State and municipal |
(4 | ) | 79 | (1 | ) | 82 | (5 | ) | 161 | ||||||||||||
| Other debt |
(1 | ) | 40 | 3 | (1 | ) | 43 | ||||||||||||||
| Total |
$ | (252 | ) | $ | 8,997 | $ | (195 | ) | $ | 6,574 | $ | (447 | ) | $ | 15,571 | ||||||
During 2008, unprecedented market volatility and relative illiquidity in certain asset sectors had an adverse impact on the valuation of certain of our investment securities. This occurred even as market interest rates (i.e., interest rate swap rates) declined at December 31, 2008 compared with December 31, 2007. At December 31, 2008, we consider the gross unrealized loss of $5.8 billion to be temporary as we had the positive ability and intent for the foreseeable future to hold these securities until recovery of fair value.
Other-than-temporary impairment charges are reflected in net securities gains (losses) on our Consolidated Income Statement. These charges include the impact of declines in both credit quality and liquidity.
Impairments
During 2008, we recorded other-than-temporary impairment charges totaling $312 million.
| | We recorded charges totaling $151 million related to eight residential mortgage-backed securities. The fair value of these eight securities was approximately $184 million as of December 31, 2008. |
| | We recorded charges totaling $87 million related to two securities collateralized by first-lien residential mortgage loans and five securities collateralized by second-lien residential mortgage loans. The fair value of these seven securities was $82 million as of December 31, 2008. |
| | We recorded charges totaling $74 million related to our investment in preferred stock of FHLMC and FNMA. The fair value of these securities was approximately $2 million as of December 31, 2008. |
Information relating to securities gains and losses is set forth in the following table.
Securities Gains and Losses
| Year ended December 31 In millions |
Proceeds | Gross Gains |
Gross Losses (a) |
Net Gains (Losses) |
Tax (Benefit) |
||||||||||||
| 2008 |
$ | 10,283 | $ | 114 | $ | 320 | $ | (206 | ) | $ | (72 | ) | |||||
| 2007 |
6,056 | 20 | 25 | (5 | ) | (2 | ) | ||||||||||
| 2006 |
11,102 | 2 | 209 | (207 | ) | (72 | ) | ||||||||||
| (a) | Includes other-than-temporary impairment charges of $312 million for 2008. |
The fair value of securities pledged to secure public and trust deposits and repurchase agreements and for other purposes was $22.5 billion at December 31, 2008 and $24.2 billion at December 31, 2007. The pledged securities include positions held in our portfolio of investment securities, trading securities, and securities accepted as collateral from others that we are permitted by contract or custom to sell or repledge.
99
The fair value of securities accepted as collateral that we are permitted by contract or custom to sell or repledge was $1.6 billion at December 31, 2008 and $2.3 billion at December 31, 2007 and is a component of federal funds sold and resale agreements on our Consolidated Balance Sheet. Of the permitted amount, $461 million was repledged to others at December 31, 2008 and $1.5 billion was repledged to others at December 31, 2007.
The following table presents, by remaining contractual maturity, the amortized cost, fair value and weighted-average yield of debt securities at December 31, 2008.
Contractual Maturity Of Debt Securities
| December 31, 2008 Dollars in millions |
1 Year or Less |
After 1 Year through 5 Years |
After 5 Years through 10 Years |
After 10 Years |
Total | |||||||||||||||
| SECURITIES AVAILABLE FOR SALE |
||||||||||||||||||||
| US Treasury and government agencies |
$ | 83 | $ | 84 | $ | 552 | $ | 19 | $ | 738 | ||||||||||
| Residential mortgage-backed |
758 | 9,890 | 1,397 | 23,904 | 35,949 | |||||||||||||||
| Commercial mortgage-backed |
37 | 52 | 4,217 | 4,306 | ||||||||||||||||
| Asset-backed |
22 | 92 | 488 | 1,467 | 2,069 | |||||||||||||||
| State and municipal |
100 | 226 | 186 | 813 | 1,325 | |||||||||||||||
| Other debt |
7 | 464 | 59 | 33 | 563 | |||||||||||||||
| Total debt securities available for sale |
$ | 970 | $ | 10,793 | $ | 2,734 | $ | 30,453 | $ | 44,950 | ||||||||||
| Fair value |
$ | 971 | $ | 10,789 | $ | 2,702 | $ | 25,109 | $ | 39,571 | ||||||||||
| Weighted-average yield, GAAP basis |
6.09 | % | 5.02 | % | 6.06 | % | 5.53 | % | 5.45 | % | ||||||||||
| SECURITIES HELD TO MATURITY |
||||||||||||||||||||
| Commercial mortgage-backed |
$ | 130 | $ | 66 | $ | 1,749 | $ | 1,945 | ||||||||||||
| Asset-backed |
$ | 43 | 789 | 395 | 149 | 1,376 | ||||||||||||||
| Other debt |
1 | 9 | 10 | |||||||||||||||||
| Total debt securities held to maturity |
$ | 43 | $ | 919 | $ | 462 | $ | 1,907 | $ | 3,331 | ||||||||||
| Fair value |
$ | 42 | $ | 907 | $ | 455 | $ | 1,860 | $ | 3,264 | ||||||||||
| Weighted-average yield, GAAP basis |
5.35 | % | 5.00 | % | 4.27 | % | 5.20 | % | 5.02 | % | ||||||||||
Based on current interest rates and expected prepayment speeds, the total weighted-average expected maturity of mortgage-backed securities was 2 years and 9 months, of commercial mortgage-backed securities was 4 years and 5 months and of asset-backed securities was 4 years and 11 months at December 31, 2008. Weighted-average yields are based on historical cost with effective yields weighted for the contractual maturity of each security. At December 31, 2008, there were no securities of a single issuer, other than Fannie Mae and Freddie Mac, which exceeded 10% of total shareholders equity.
NOTE 8 FAIR VALUE
Fair Value Measurement
SFAS 157 defines fair value as the price that would be received to sell an asset or the price paid to transfer a liability on the measurement date. The standard focuses on the exit price in the principal or most advantageous market for the asset or liability in an orderly transaction between willing market participants.
SFAS 157 establishes a fair value reporting hierarchy to maximize the use of observable inputs when measuring fair value and defines the three levels of inputs as noted below. The financial instruments in Level 3 are typically less liquid.
Level 1
Quoted prices in active markets for identical assets or liabilities. Level 1 assets and liabilities may include debt securities, equity securities and listed derivative contracts that are traded in an active exchange market and certain US Government and agency-backed securities that are actively traded in over-the-counter markets.
100
Level 2
Observable inputs other than Level 1 such as: quoted prices for similar assets or liabilities in active markets, quoted prices for identical or similar assets or liabilities in markets that are not active, or other inputs that are observable or can be corroborated to observable market data for substantially the full term of the asset or liability. Level 2 assets and liabilities may include debt securities, equity securities and listed derivative contracts with quoted prices that are traded in markets that are not active, and certain debt and equity securities and over-the-counter derivative contracts whose fair value is determined using a pricing model without significant unobservable inputs. This category generally includes certain mortgage-backed debt securities, private-issuer securities, other asset-backed securities, corporate debt securities and derivative contracts.
Level 3
Unobservable inputs that are supported by minimal or no market activity and that are significant to the fair value of the assets or liabilities. Level 3 assets and liabilities may include financial instruments whose value is determined using pricing models with internally developed assumptions, discounted cash flow methodologies, or similar techniques, as well as instruments for which the determination of fair value requires significant management judgment or estimation. This category generally includes certain commercial mortgage loans held for sale, private equity investments, certain available for sale securities, certain trading securities and certain financial derivative contracts. Nonrecurring items, primarily certain nonaccrual and other loans held for sale and commercial mortgage servicing rights, are also included in this category.
Assets and liabilities measured at fair value on a recurring basis, including instruments for which PNC has elected the fair value option, are summarized below. As prescribed by SFAS 157, the assets and liabilities of National City acquired in a purchase business combination on December 31, 2008 were excluded from the table below and related SFAS 157 and SFAS 159 disclosures.
Fair Value Measurements Summary
| December 31, 2008 | ||||||||||||
| In millions | Level 1 | Level 2 | Level 3 | Total Fair Value |
||||||||
| Assets |
||||||||||||
| Securities available for sale |
$ | 347 | $ | 21,633 | $ | 4,837 | $ | 26,817 | ||||
| Financial derivatives (a) |
16 | 5,582 | 125 | 5,723 | ||||||||
| Trading securities (b) |
89 | 529 | 73 | 691 | ||||||||
| Commercial mortgage loans held for sale (c) |
1,400 | 1,400 | ||||||||||
| Customer resale agreements (d) |
1,072 | 1,072 | ||||||||||
| Equity investments |
571 | 571 | ||||||||||
| Other assets |
144 | 6 | 150 | |||||||||
| Total assets |
$ | 452 | $ | 28,960 | $ | 7,012 | $ | 36,424 | ||||
| Liabilities |
||||||||||||
| Financial derivatives (e) |
$ | 2 | $ | 4,387 | $ | 22 | $ | 4,411 | ||||
| Trading securities sold short (f) |
182 | 207 | 389 | |||||||||
| Other liabilities |
9 | 9 | ||||||||||
| Total liabilities |
$ | 184 | $ | 4,603 | $ | 22 | $ | 4,809 | ||||
| (a) | Included in other assets on the Consolidated Balance Sheet. |
| (b) | Included in trading securities on the Consolidated Balance Sheet. Fair value includes net unrealized losses of $27.5 million. |
| (c) | Included in loans held for sale on the Consolidated Balance Sheet. PNC has elected the fair value option under SFAS 159 for certain commercial mortgage loans held for sale. |
| (d) | Included in federal funds sold and resale agreements on the Consolidated Balance Sheet. PNC has elected the fair value option under SFAS 159 for this item. |
| (e) | Included in other liabilities on the Consolidated Balance Sheet. |
| (f) | Included in other borrowed funds on the Consolidated Balance Sheet. |
101
The table below presents a reconciliation for January 1, 2008 to December 31, 2008 of assets and liabilities measured at fair value on a recurring basis using Level 3 inputs.
| Level 3 Instruments Only In millions |
Securities available for sale (c) |
Financial derivatives (c) |
Trading securities (c) |
Commercial mortgage loans held for sale (d) |
Equity investments (c) |
Other assets (c) |
Total Assets |
Financial derivatives (c) |
Total Liabilities |
|||||||||||||||||||||||||||
| December 31, 2007 |
$ | 285 | $ | 130 | $ | 2,018 | $ | 568 | $ | 4 | $ | 3,005 | $ | 326 | $ | 326 | ||||||||||||||||||||
| Impact of SFAS 157 and SFAS 159 adoption |
2 | 2 | 4 | |||||||||||||||||||||||||||||||||
| Balance, January 1, 2008 |
285 | 132 | 2,020 | 568 | 4 | 3,009 | 326 | 326 | ||||||||||||||||||||||||||||
| Total realized/unrealized gains or losses (a): |
||||||||||||||||||||||||||||||||||||
| Included in earnings (b) |
(9 | ) | $ | (4 | ) | (251 | ) | (30 | ) | (2 | ) | (296 | ) | (297 | ) | (297 | ) | |||||||||||||||||||
| Included in other comprehensive income |
(164 | ) | (164 | ) | ||||||||||||||||||||||||||||||||
| Purchases, issuances, and settlements, net |
515 | 18 | (369 | ) | 33 | 4 | 201 | (8 | ) | (8 | ) | |||||||||||||||||||||||||
| Transfers into Level 3, net |
4,201 | 2 | 59 | 4,262 | 1 | 1 | ||||||||||||||||||||||||||||||
| December 31, 2008 |
$ | 4,837 | $ | 125 | $ | 73 | $ | 1,400 | $ | 571 | $ | 6 | $ | 7,012 | $ | 22 | $ | 22 | ||||||||||||||||||
| (a) Losses for assets are bracketed which losses for liabilities are not. |
||||||||||||||||||||||||||||||||||||
| (b) Attributable to unrealized gains or losses related to assets or liabilities held at December 31, 2008: |
$ | 16 | $ | 1 | $ | (213 | ) | $ | (50 | ) | $ | (246 | ) | $ | (37 | ) | $ | (37 | ) | |||||||||||||||||
| (c) | Carried at fair value prior to our adoption of SFAS 157. |
| (d) | We elected the fair value option under SFAS 159 for this item. |
The after-tax adjustment to beginning retained earnings from the adoption of SFAS 157 and SFAS 159 related to Level 3 fair value measurements was approximately $1 million each.
Net gains (realized and unrealized) relating to Level 3 assets and liabilities were $1 million for 2008. This amount included net unrealized losses of $209 million. These amounts were included in other noninterest income in the Consolidated Income Statement.
During 2008, securities transferred into Level 3 from Level 2 exceeded securities transferred out by $4.3 billion. These primarily related to private issuer asset-backed securities, auction rate securities, residential mortgage-backed securities and corporate bonds and occurred due to reduced volume of recently executed transactions and the lack of corroborating market price quotations for these instruments. Other Level 3 assets include commercial mortgage loans held for sale, private equity investments and other assets.
Nonrecurring Fair Value Changes
We may be required to measure certain other financial assets at fair value on a nonrecurring basis. These adjustments to fair value usually result from the application of lower-of-cost-or-market accounting or write-downs of individual assets due to impairment. The amounts below for nonaccrual loans and loans held for sale represent the carrying value of loans for which adjustments are primarily based on the appraised value of collateral or the present value of expected future cash flows, which often results in significant management assumptions and input with respect to the determination of fair value. The fair value determination of the equity investment resulting in an impairment loss included below was based on observable market data for other comparable entities as adjusted for internal assumptions and unobservable inputs. The amounts below for commercial mortgage servicing rights reflect an impairment of certain strata of these assets. The fair value of commercial mortgage servicing rights is estimated by using an internal valuation model. The model calculates the present value of estimated future net servicing cash flows considering estimates on servicing revenue and costs, discount rates and prepayment speeds. Annually, this model is subject to an internal review process to validate controls and model results.
102
Fair Value Measurements Nonrecurring
| In millions | December 31, Total Fair |
Total losses for year ended December 31, 2008 |
|||||||
| Assets |
|||||||||
| Nonaccrual loans |
$ | 250 | $ | (99 | ) | ||||
| Loans held for sale |
101 | (2 | ) | ||||||
| Equity investment |
75 | (73 | ) | ||||||
| Commercial mortgage servicing rights |
560 | (35 | ) | ||||||
| Total assets |
$ | 986 | $ | (209 | ) | ||||
| (a) | All Level 3. |
Fair Value Option
Commercial Mortgage Loans Held For Sale
Effective January 1, 2008, we elected to account for commercial mortgage loans classified as held for sale and intended for securitization at fair value under the provisions of SFAS 159. Based on the significance of unobservable inputs, we classify this portfolio as Level 3. As such, a synthetic securitization methodology was used historically to value the loans and the related unfunded commitments on an aggregate basis based upon current commercial mortgage-backed securities (CMBS) market structures and conditions. The election of the fair value option aligns the accounting for the commercial mortgages with the related hedges. It also eliminates the requirements of hedge accounting under SFAS 133. Due to the inactivity in the CMBS securitization market in 2008, we determined the fair value of commercial mortgage loans held for sale by using a whole loan valuation methodology. Based on the significance of unobservable inputs, we classified this portfolio as Level 3. Valuation assumptions included observable inputs based on whole loan sales, both observed in the market and actual sales from our portfolio and new loan origination spreads during the quarter. Adjustments were made to the assumptions to account for uncertainties, including market conditions, and liquidity. Credit risk was included as part of our valuation process for these loans by considering expected rates of return for market participants for similar loans in the marketplace.
PNC has not elected the fair value option for the remainder of our loans held for sale portfolio as the amounts are not significant and hedge accounting is not used for these loans.
At December 31, 2008, commercial mortgage loans held for sale for which the fair value option had been elected had an aggregate fair value of $1.4 billion and an aggregate outstanding principal balance of $1.6 billion.
Interest income on these loans is recorded as earned and reported in the Consolidated Income Statement in the caption Interest Income Other. Net losses resulting from changes in fair value of these loans of $251 million for 2008 were recorded in other noninterest income. The impact on earnings of offsetting hedges is not reflected in these amounts. Changes in fair value due to instrument-specific credit risk for 2008 were not material. The changes in fair value of these loans were partially offset by changes in the fair value of the related financial derivatives that economically hedged these loans.
Customer Resale Agreements and Bank Notes
Effective January 1, 2008, we elected to account for structured resale agreements and structured bank notes at fair value, which are economically hedged using free-standing financial derivatives.
The fair value for structured resale agreements and structured bank notes is determined using a model which includes observable market data as inputs such as interest rates. Readily observable market inputs to this model can be validated to external sources, including yield curves, implied volatility or other market related data. Changes in fair value due to instrument-specific credit risk for 2008 were not material. At December 31, 2008, structured resale agreements with an aggregate fair value of $1.1 billion were included in federal funds sold and resale agreements on our Consolidated Balance Sheet. The aggregate outstanding principal balance was $980 million. Interest income on structured resale agreements is reported in the Consolidated Income Statement in the caption Interest Income Other.
103
The following table summarizes the financial instruments for which we elected the fair value option effective January 1, 2008 and the related cumulative-effect adjustment to retained earnings.
Fair Value Option Adoption
| In millions | December 31, 2007 |
Retained Net Gain |
January 1, 2008 |
|||||||
| Assets |
||||||||||
| Customer resale agreements (a) |
$ | 738 | $ | 23 | $ | 761 | ||||
| Commercial mortgage loans held for sale |
2,018 | 2 | 2,020 | |||||||
| Liabilities |
||||||||||
| Bank notes |
11 | 11 | ||||||||
| Cumulative-effect adjustment, before taxes |
25 | |||||||||
| Tax impact |
(9 | ) | ||||||||
| Cumulative-effect adjustment, after taxes |
$ | 16 | ||||||||
| (a) | Includes structured resale agreements that are economically hedged with derivatives. |
The following table summarizes the changes in fair value included in other noninterest income in the Consolidated Income Statement for items for which we elected the fair value option.
Fair Value Option Changes in Fair Value
| Total gains (losses) | ||||
| In millions | For the year ended December 31, 2008 |
|||
| Assets |
||||
| Customer resale agreements (a) |
$ | 69 | ||
| Commercial mortgage loans held for sale (a) |
(251 | ) | ||
| (a) | The impact on earnings of offsetting hedges is not reflected in these amounts. |
The following table provides fair values and aggregate unpaid principal balances of items for which we elected the fair value option.
Fair Value Option Fair Value and Principal Balances
| In millions | Fair Value December 31, |
Aggregate Unpaid December 31, |
Difference | |||||||
| Customer resale agreements |
$ | 1,072 | $ | 980 | $ | 92 | ||||
| Commercial mortgage loans held for sale |
||||||||||
| Performing loans |
$ | 1,376 | $ | 1,572 | $ | (196 | ) | |||
| Nonaccrual loans |
24 | 27 | (3 | ) | ||||||
| Total |
$ | 1,400 | $ | 1,599 | $ | (199 | ) | |||
104
FAIR VALUE OF FINANCIAL INSTRUMENTS (SFAS 107)
| 2008 (a) | 2007 | |||||||||||||
| December 31 in millions | Carrying Amount |
Fair Value |
Carrying Amount |
Fair Value |
||||||||||
| Assets |
||||||||||||||
| Cash and short-term assets |
$ | 23,171 | $ | 23,171 | $ | 7,456 | $ | 7,456 | ||||||
| Trading securities |
1,725 | 1,725 | 3,556 | 3,556 | ||||||||||
| Investment securities |
43,473 | 43,406 | 30,225 | 30,225 | ||||||||||
| Loans held for sale |
4,366 | 4,366 | 3,927 | 3,966 | ||||||||||
| Net loans (excludes leases) |
165,112 | 162,159 | 64,976 | 65,808 | ||||||||||
| Other assets |
4,282 | 4,282 | 1,328 | 1,328 | ||||||||||
| Mortgage and other loan servicing rights |
1,890 | 1,899 | 701 | 780 | ||||||||||
| Financial derivatives |
||||||||||||||
| Fair value hedges |
889 | 889 | 283 | 283 | ||||||||||
| Cash flow hedges |
527 | 527 | 325 | 325 | ||||||||||
| Free-standing derivatives |
7,088 | 7,088 | 2,163 | 2,163 | ||||||||||
| Liabilities |
||||||||||||||
| Demand, savings and money market deposits |
116,946 | 116,946 | 56,294 | 56,294 | ||||||||||
| Time deposits |
75,919 | 76,205 | 26,402 | 26,416 | ||||||||||
| Borrowed funds |
52,872 | 53,063 | 31,254 | 31,608 | ||||||||||
| Financial derivatives |
||||||||||||||
| Fair value hedges |
1 | 1 | 93 | 93 | ||||||||||
| Cash flow hedges |
||||||||||||||
| Free-standing derivatives |
6,057 | 6,057 | 2,298 | 2,298 | ||||||||||
| Unfunded loan commitments and letters of credit |
338 | 338 | 129 | 129 | ||||||||||
| (a) | Amounts include National City. |
The aggregate fair values in the table above do not represent the underlying market value of PNC as the table excludes the following:
| | real and personal property, |
| | lease financing, |
| | loan customer relationships, |
| | deposit customer intangibles, |
| | retail branch networks, |
| | fee-based businesses, such as asset management and brokerage, and |
| | trademarks and brand names. |
Refer to Fair Value Measurement section of this Note 8 for a definition of fair value.
We used the following methods and assumptions to estimate fair value amounts for financial instruments.
GENERAL
For short-term financial instruments realizable in three months or less, the carrying amount reported in our Consolidated Balance Sheet approximates fair value. Unless otherwise stated, the rates used in discounted cash flow analyses are based on market yield curves.
CASH AND SHORT-TERM ASSETS
The carrying amounts reported in the Consolidated Balance Sheet for cash and short-term investments approximate fair values primarily due to their short-term nature. For purposes of this disclosure only, short-term assets include the following:
| | due from banks, |
| | interest-earning deposits with banks, |
| | federal funds sold and resale agreements, |
| | cash collateral, |
| | customers acceptance liability, and |
| | accrued interest receivable. |
SECURITIES
Securities include both the investment securities and trading portfolios. We use prices sourced from pricing services, dealer quotes or recent trades to determine the fair value of securities. Approximately 75% of our positions are valued using pricing services provided by the Lehman Index and IDC. Lehman Index prices are set with reference to market activity for highly liquid assets such as agency
105
mortgage-backed securities, and matrix priced for other assets, such as CMBS and asset-backed securities. IDC primarily uses matrix pricing for the instruments we value using this service, such as agency adjustable rate mortgage securities, agency CMOs and municipal bonds. Dealer quotes received are typically non-binding and corroborated with other dealers quotes, by reviewing valuations of comparable instruments, or by comparison to internal valuations. The majority of our securities are classified as Level 2 in the fair value hierarchy. In circumstances where market prices are limited or unavailable, valuations may require significant management judgments or adjustments to determine fair value. In these cases, the securities are classified as Level 3.
NET LOANS AND LOANS HELD FOR SALE
Fair values are estimated based on the discounted value of expected net cash flows incorporating assumptions about prepayment rates, credit losses, servicing fees and costs. For revolving home equity loans, this fair value does not include any amount for new loans or the related fees that will be generated from the existing customer relationships. In the case of nonaccrual loans, scheduled cash flows exclude interest payments. Refer to the Fair Value Option section of this Note 8 regarding the fair value of commercial mortgage loans held for sale. Residential mortgage loans are valued based on quoted market prices, where available, prices for other traded mortgage loans with similar characteristics, and purchase commitments and bid information received from market participants. These loans are regularly traded in active markets and observable pricing information is available from market participants. The prices are adjusted as necessary to include the embedded servicing value in the loans and to take into consideration the specific characteristics of certain loans that are priced based on the pricing of similar loans. These adjustments represent unobservable inputs to the valuation but are not considered significant to the fair value of the loans. Loans are presented net of the allowance for loan and lease losses.
OTHER ASSETS
Other assets as shown in the accompanying table include the following:
| | noncertificated interest-only strips, |
| | FHLB and FRB stock, |
| | equity investments carried at cost and fair value, and |
| | private equity investments carried at fair value. |
Investments accounted for under the equity method, including our investment in BlackRock, are not included in the accompanying table.
The carrying amounts of private equity investments are recorded at fair value. The valuation procedures applied to direct investments include techniques such as multiples of adjusted earnings of the entity, independent appraisals, anticipated financing and sales transactions with third parties, or the pricing used to value the entity in a recent financing transaction. We value indirect investments in private equity funds based on the financial statements that we receive from their managers. Due to the time lag in our receipt of the financial information and based on a review of investments and valuation techniques applied, adjustments to the manager provided value are made when available recent investment portfolio company or market information indicates a significant change in value from that provided by the general partner.
Fair value of the noncertificated interest-only strips is estimated based on the discounted value of expected net cash flows. The aggregate carrying value of our equity investments carried at cost and FHLB and FRB stock was $3.1 billion at December 31, 2008 and $766 million as of December 31, 2007, both of which approximate fair value at each date.
MORTGAGE AND OTHER LOAN SERVICING ASSETS
Fair value is based on the present value of the estimated future cash flows, incorporating assumptions as to prepayment speeds, discount rates, escrow balances, interest rates, cost to service and other factors. We have numerous controls in place intended to ensure that our fair values are appropriate. An independent model review group reviews our valuation models and validates them for their intended use.
For commercial mortgage loan servicing assets, key valuation assumptions at December 31, 2008 and December 31, 2007 included prepayment rates ranging from 4% 16% and 10% 16%, respectively, and discount rates ranging from 8% 10% for both periods, which resulted in an estimated fair value of $873 million and $773 million, respectively.
For residential mortgage servicing assets, key assumptions at December 31, 2008 were a weighted average constant prepayment rate of 33%, weighted average life of 2.3 years and a discount rate, calculated as the spread over forward interest rate swap rates of 6.37%, resulting in a fair value of $1.0 billion.
DEPOSITS
The carrying amounts of noninterest-bearing demand and interest-bearing money market and savings deposits approximate fair values. For time deposits, which include foreign deposits, fair values are estimated based on the discounted value of expected net cash flows assuming current interest rates.
106
BORROWED FUNDS
The carrying amounts of federal funds purchased, commercial paper, repurchase agreements, proprietary trading short positions, cash collateral, other short-term borrowings, acceptances outstanding and accrued interest payable are considered to be their fair value because of their short-term nature. For all other borrowed funds, fair values are estimated based on dealer quotes.
UNFUNDED LOAN COMMITMENTS AND LETTERS OF CREDIT
The fair value of unfunded loan commitments and letters of credit is our estimate of the cost to terminate them. For purposes of this disclosure, this fair value is the sum of the deferred fees currently recorded by us on these facilities and the liability established on these facilities related to their creditworthiness.
FINANCIAL DERIVATIVES
For exchange-traded contracts, fair value is based on quoted market prices. For nonexchange-traded contracts, fair value is based on dealer quotes, pricing models or quoted prices for instruments with similar characteristics.
NOTE 9 GOODWILL AND OTHER INTANGIBLE ASSETS
A summary of the changes in goodwill by business segment during 2008 follows:
Goodwill
| In millions | Dec. 31 2007 |
Additions/ Adjustments |
Dec. 31 2008 |
|||||||
| Retail Banking |
$ | 5,614 | $ | 354 | $ | 5,968 | ||||
| Corporate & Institutional Banking |
1,491 | 118 | 1,609 | |||||||
| Global Investment Servicing |
1,229 | 4 | 1,233 | |||||||
| BlackRock |
57 | (13 | ) | 44 | ||||||
| Asset Management Group |
14 | 14 | ||||||||
| Total |
$ | 8,405 | $ | 463 | $ | 8,868 | ||||
Assets and liabilities of acquired entities are recorded at estimated fair value as of the acquisition date and are subject to refinement as information relative to the fair values at that date becomes available. Revisions would likely result in subsequent adjustments to goodwill. The goodwill and other intangible assets related to Sterling are reported in the Retail Banking and Corporate & Institutional Banking business segments.
At December 31, 2008, no goodwill was recognized in connection with the National City acquisition as the fair value of net assets acquired exceeded the purchase price. The allocation of the purchase price may be modified through 2009 as more information, such as appraisals, contracts, reviews of legal documentation, and selected key borrower data, is obtained about the fair value of assets acquired and liabilities assumed and may result in goodwill.
The gross carrying amount, accumulated amortization and net carrying amount of other intangible assets by major category consisted of the following:
Other Intangible Assets
| December 31 - in millions | 2008 (a) | 2007 | ||||||
| Customer-related and other intangibles |
||||||||
| Gross carrying amount |
$ | 1,291 | $ | 708 | ||||
| Accumulated amortization |
(361 | ) | (263 | ) | ||||
| Net carrying amount |
$ | 930 | $ | 445 | ||||
| Mortgage and other loan servicing rights |
||||||||
| Gross carrying amount |
$ | 2,286 | $ | 1,001 | ||||
| Impairment charge |
(35 | ) | ||||||
| Accumulated amortization |
(361 | ) | (300 | ) | ||||
| Net carrying amount |
$ | 1,890 | $ | 701 | ||||
| Total |
$ | 2,820 | $ | 1,146 | ||||
| (a) | Amounts at December 31, 2008 include National City. |
Our acquisition of National City resulted in the addition of $569 million of core deposit and other relationship intangibles at December 31, 2008. Core deposits include noninterest and interest-bearing demand accounts, savings and money market accounts. In addition, mortgage servicing rights increased $1.2 billion primarily related to the National City acquisition. The intangibles were valued utilizing a discounted cash flows model.
107
While certain of our other intangible assets have finite lives and are amortized primarily on a straight-line basis, commercial mortgage and other loan servicing rights and certain core deposit intangibles are amortized on an accelerated basis. Residential mortgage servicing rights are carried at fair value and not amortized.
For customer-related intangibles, the estimated remaining useful lives range from less than one year to 14 years, with a weighted-average remaining useful life of approximately 10 years. Our commercial mortgage and other loan servicing rights are amortized primarily over a period of 2 to 13 years in proportion to the estimated net servicing cash flows from the related loans.
We recognize as an other intangible asset the right to service mortgage loans for others. Commercial mortgage servicing rights are purchased in the open market and originated when loans are sold with servicing retained. Commercial mortgage servicing rights are initially recorded at fair value. These rights are subsequently measured using the amortization method. Accordingly, the commercial mortgage servicing rights are amortized in proportion to and over the period of estimated net servicing income.
Residential mortgage servicing rights of $1 billion were recognized in connection with the acquisition of National City. We have elected to subsequently measure residential mortgage servicing rights at fair value consistent with how we manage the risk of these assets.
Amortizable commercial mortgage servicing rights are periodically evaluated for impairment. For purposes of impairment, the commercial mortgage servicing rights are stratified based on asset type, which characterizes the predominant risk of the underlying financial asset. If the carrying amount of any individual stratum exceeds its fair value, a valuation reserve is established with a corresponding charge to Corporate Services on our Consolidated Income Statement.
The fair value of commercial and residential mortgage servicing rights is estimated by using an internal valuation model. The model calculates the present value of estimated future net servicing cash flows considering estimates on servicing revenue and costs, discount rates and prepayment speeds.
Changes in the commercial mortgage servicing rights were as follows:
Commercial Mortgage Servicing Rights
| In millions | 2008 | 2007 | ||||||
| Balance at January 1 |
$ | 694 | $ | 471 | ||||
| Additions (a) |
300 | 310 | ||||||
| Amortization expense |
(95 | ) | (87 | ) | ||||
| Balance at December 31 |
899 | 694 | ||||||
| Impairment charge |
(35 | ) | ||||||
| Net carrying amount at December 31 |
$ | 864 | $ | 694 | ||||
| (a) | Includes $210 million in 2008 as part of the National City acquisition. |
Servicing revenue from both commercial and residential mortgage servicing assets and liabilities generated contractually specified servicing fees, net interest income from servicing portfolio deposit balances, and ancillary fees totaling $171 million in 2008, $192 million in 2007 and $139 million in 2006. We also generate servicing revenue from fee-based activities provided to others.
Amortization expense on intangible assets for 2008, 2007 and 2006 was $228 million, $173 million and $99 million, respectively. The 2008 amortization expense includes a $35 million impairment charge for certain mortgage servicing rights due to the effect of lower interest rates. Amortization expense on existing intangible assets for 2009 through 2013 is estimated to be as follows:
| | 2009: $297 million, |
| | 2010: $232 million, |
| | 2011: $227 million, |
| | 2012: $206 million, and |
| | 2013: $180 million. |
108
The changes in the carrying amount of goodwill and net other intangible assets during 2008 follows:
Changes in Goodwill and Other Intangibles
| In millions | Goodwill | Customer- Related |
Servicing Rights |
|||||||||
| Balance at December 31, 2007 |
$ | 8,405 | $ | 445 | $ | 701 | ||||||
| Additions/adjustments: |
||||||||||||
| National City acquisition |
569 | 1,228 | ||||||||||
| Sterling acquisition |
593 | 21 | 4 | |||||||||
| Hilliard Lyons divestiture |
(140 | ) | ||||||||||
| Harris Williams contingent consideration |
44 | |||||||||||
| Other acquisitions |
(21 | ) | (3 | ) | ||||||||
| Mortgage and other loan servicing rights |
90 | |||||||||||
| BlackRock |
(13 | ) | ||||||||||
| Other |
(7 | ) | ||||||||||
| Impairment charge |
(35 | ) | ||||||||||
| Amortization |
(98 | ) | (95 | ) | ||||||||
| Balance at December 31, 2008 |
$ | 8,868 | $ | 930 | $ | 1,890 | ||||||
Our investment in BlackRock changes when BlackRock repurchases its shares in the open market or issues shares for an acquisition or pursuant to its employee compensation plans. We adjust goodwill when BlackRock repurchases its shares at an amount greater (or less) than book value per share and this results in an increase (or decrease) in our percentage ownership interest.
We conduct a goodwill impairment test on our reporting units at least annually or more frequently if any adverse triggering events occur. Based on the results of our analysis, there were no impairment charges related to goodwill recognized in 2008, 2007 or 2006. The fair value of our reporting units is determined by using discounted cash flow and market comparability methodologies.
NOTE 10 SECURITIZATION ACTIVITY
We contributed commercial mortgage loans to securitizations with servicing retained of $.4 billion in 2008 and $2.2 billion in 2007 for cash in loan sales transactions. All loan amounts are derecognized from our Consolidated Balance Sheet at the time of transfer. Mortgage servicing rights continue to be held by us as transferor.
These transactions resulted in a pretax net loss including valuation adjustments of $22 million in 2008 and a pretax net gain including valuation adjustments of $20 million in 2007. We continue to perform servicing and recognized servicing assets of $3 million in 2008 and $14 million in 2007 at the time of sale.
In securitizations, loans are typically transferred to a qualifying special purpose entity (QSPE) that is demonstrably distinct from the transferor to transfer the risks from our Consolidated Balance Sheet. A QSPE is a bankruptcy-remote trust allowed to perform only certain passive activities. In addition, these entities are self-liquidating and typically structured as Real Estate Mortgage Investment Conduits (REMICs) for tax purposes. The QSPEs are generally financed by issuing certificates for various levels of senior and subordinated tranches. QSPEs are exempt from consolidation under the provisions of FIN 46R.
These sale and servicing transactions are structured without recourse to us. Our exposure is limited to standard representations and warranties as seller of the loans and responsibilities as servicer of the QSPEs assets. In certain circumstances as a servicer for these entities, we advance principal and interest payments to the securitization trust. We have a risk of loss if the borrower does not ultimately make the principal and interest payment. However, the advance is senior secured above the highest rated tranche in the securitization.
Also, in certain situations, we are named as special servicing asset manager. The overall objective of the special servicer is to restore the defaulted loan to performing status or to develop a disposition strategy that results in the highest recovery on a net present value basis, thus protecting the interests of the trust and its investors.
See Note 9 Goodwill and Other Intangible Assets for additional information regarding servicing assets.
With our acquisition of National City on December 31, 2008, we acquired residual and other interests associated with National Citys credit card, automobile, mortgage, and SBA loans securitizations. In addition, we also assumed certain continuing involvement activities in these securitization transactions.
The credit card, automobile, and mortgage securitizations were transacted through QSPEs sponsored by National City. These QSPEs were financed primarily through the issuance and sale of beneficial interests to independent third parties and were not consolidated on
109
National Citys balance sheet. Consolidation of these QSPEs could be considered if circumstances or events subsequent to the securitization transaction dates would cause the entities to lose their qualified status. No such events have occurred. Qualitative and quantitative information about these securitizations follows.
The following summarizes the assets and liabilities of the National City-sponsored securitization QSPEs at December 31, 2008.
| (In millions) | Credit Card | Automobile | Mortgage | ||||||
| Assets (a) |
$ | 2,129 | $ | 250 | $ | 319 | |||
| Liabilities |
1,824 | 250 | 319 | ||||||
| (a) | Represents period-end outstanding principal balances of loans transferred to the securitization QSPEs. |
Credit Card Loans
At December 31, 2008, National Citys credit card securitization series 2005-1, 2006-1, 2007-1, 2008-1, 2008-2, and 2008-3 were outstanding. Our continuing involvement in the securitized credit cards receivables consists primarily of servicing and a pro-rata undivided interest in all credit card receivables, or sellers interest, in the QSPE. Servicing fees earned approximate current market rates for servicing fees; therefore, no servicing asset or liability existed at December 31, 2008. We hold a clean-up call repurchase option to the extent a securitization series extends past its scheduled note principal payoff date. To the extent this occurs, the clean-up call option is triggered when the principal balance of the asset-backed notes of any series reaches 5% of the initial principal balance of the asset-back notes issued at the securitization date. Our sellers interest ranks equally with the investors interests in the trust. As the amount of the assets in the securitized pool fluctuates due to customer payments, purchases, cash advances, and credit losses, the carrying amount of the sellers interest will vary. However, we are required to maintain sellers interest at a minimum level of 5% of the initial invested amount in each series to ensure sufficient assets are available for allocation to the investors interests. Sellers interest, which is recognized in portfolio loans on the Consolidated Balance Sheet, was well above the minimum level at December 31, 2008.
Retained interests acquired consisted of sellers interest, an interest-only strip, and asset-backed securities issued by the credit card securitization QSPE. The initial carrying values of these retained interests were determined based upon their fair values at December 31, 2008. Sellers interest is recognized in portfolio loans on the Consolidated Balance Sheet and totaled approximately $315 million at December 31, 2008. The interest-only strips are recognized in other assets on the Consolidated Balance Sheet and totaled approximately $20 million at December 31, 2008. The asset-backed securities are recognized in investment securities on the Consolidated Balance Sheet and totaled approximately $25 million at December 31, 2008. These retained interests represent the maximum exposure to loss associated with our involvement in this securitization.
Automobile Loans
At December 31, 2008, National Citys auto securitization 2005-A was outstanding. Our continuing involvement in the securitized automobile loans consists primarily of servicing and limited requirements to repurchase transferred loans for breaches of representations and warranties. As servicer, we hold a cleanup call on the serviced loans which gives us an option to repurchase the transferred loans when their outstanding principal balances reach 5% of the initial outstanding principal balance of the automobile loans securitized.
The Class A notes issued by National Citys 2005-A auto securitization were purchased by a third-party commercial paper conduit. National Citys subsidiary, National City Bank, along with other financial institutions, agreed to provide backup liquidity to the conduit. The conduit holds various third-party assets including beneficial interests in the cash flows of trade receivables, credit cards and other financial assets. The conduit has no interests in subprime mortgage loans. The conduit relies upon commercial paper for its funding. In the event of a disruption in the commercial paper markets, the conduit could experience a liquidity event. At such time, the conduit may require National City Bank to purchase a 49% interest in a note representing a beneficial interest in National Citys securitized automobile loans. Another financial institution, affiliated with the conduit, has committed to purchase the remaining 51% interest in this same note. Upon the conduits request, National City Bank would pay cash equal to the par value of the notes, less the corresponding portion of all defaulted loans, plus accrued interest. In return, National City Bank would be entitled to undivided interest in the cash flows of the collateral underlying the note. National City Bank receives an annual commitment fee of 7 basis points for providing this backup liquidity. As of December 31, 2008, the conduit has never experienced any difficulty in accessing the commercial paper markets. Our acquired commitment declines commensurate with the unpaid principal balance of the automobile loans securitized by National City. The commitment amount, which totaled approximately $115 million at December 31, 2008, represents our maximum exposure to the conduit. This commitment expires in December 2009 but may be renewed annually for an additional 12 months by mutual agreement of the parties.
110
Retained interests acquired consisted of an interest-only strip and asset-backed securities issued by the automobile securitization QSPE. The interest-only strip and asset-backed securities are recognized in other assets and investment securities, respectively, on the Consolidated Balance Sheet and their initial carrying value was determined based upon their fair value at the date of acquisition. At December 31, 2008, the fair value of the interest-only strip and retained asset-backed securities totaled approximately $9 million and $15 million, respectively. These retained interests represent the maximum exposure to loss associated with our involvement in this securitization.
Jumbo Mortgages
At December 31, 2008, National Citys jumbo mortgage securitization series 2008-1 was outstanding. Our continuing involvement in the securitized mortgage loans consists primarily of servicing and limited requirements to repurchase transferred loans for breaches of representations and warranties. As servicer, we hold a cleanup call repurchase option when the outstanding principal balances of the transferred loans reach 5% of the initial outstanding principal balance of the mortgage loans securitized.
SBA Loans
We have no continuing involvement in the SBA loans securitized by National City. The SBA loans were sold servicing released and National City was not the sponsor of the securitizations special purpose entity.
Retained interests acquired consisted solely of interest-only strips. These retained interests are recognized in other assets on the Consolidated Balance Sheet, totaled approximately $3 million at December 31, 2008, and represent the maximum exposure to loss associated with our involvement in this securitization. The initial carrying value of these retained interests was determined based upon their fair value at the date of acquisition.
The following is a summary of owned and securitized loans, which are managed on a combined basis.
| December 31, 2008 | ||||||
| In Millions | Principal Balance |
Loans Past Due 30 Days or More |
||||
| Loans managed |
||||||
| Credit card |
$ | 3,731 | $ | 177 | ||
| Automobile |
289 | 13 | ||||
| Jumbo mortgages |
866 | 78 | ||||
| SBA |
118 | 8 | ||||
| Total loans managed |
$ | 5,004 | $ | 276 | ||
| Less: Loans securitized |
||||||
| Credit card |
$ | 1,824 | $ | 73 | ||
| Automobile |
250 | 9 | ||||
| Jumbo mortgages |
319 | 5 | ||||
| SBA |
118 | 8 | ||||
| Total loans securitized |
$ | 2,511 | $ | 95 | ||
| Less: Loans held for securitization |
||||||
| Jumbo mortgages |
$ | 9 | $ | 4 | ||
| Loans held in portfolio |
$ | 2,484 | $ | 177 | ||
The tables below present the weighted-average assumptions used to measure the fair values of our acquired retained interests and servicing assets as of December 31, 2008. Fair value was determined by discounting the future cash flows of these assets. The sensitivity of these fair values to immediate 10% and 20% adverse changes in key assumptions is also shown. These sensitivities are hypothetical. Changes in fair value based on a 10% variation in assumptions generally cannot be extrapolated because the relationship of the change in the assumption to the change in fair value may not be linear. Also, the effect of a variation in a particular assumption on the fair value of the retained interests is calculated without changing any other assumption; in reality, changes in one factor may result in changes in another (for example, increases in market interest rates may result in lower prepayments and increased credit losses), which might magnify or counteract the sensitivities.
111
Credit Card Loans
| December 31, 2008 Dollars in millions |
Fair Value |
Weighted- (in months) |
Variable Annual Coupon Rate To Investors |
Monthly Principal Repayment Rate |
Expected Annual Credit Losses |
Annual Discount Rate |
Yield | |||||||||||||||||
| Interest-only strip (a) |
$ | 19.6 | 3.3 | 1.19 | % | 17.54 | % | 5.18 | % | 15.00 | % | 12.55 | % | |||||||||||
| Decline in fair value: |
||||||||||||||||||||||||
| 10% adverse change |
$ | .1 | $ | 1.4 | $ | 2.3 | $ | 5.4 | ||||||||||||||||
| 20% adverse change |
$ | .3 | $ | 2.6 | $ | 4.7 | $ | 10.8 | ||||||||||||||||
| (a) | Series 2005-1, 2006-1, 2007-1, 2008-1, 2008-2, and 2008-3. |
Automobile Loans
| December 31, 2008 Dollars in millions |
Fair Value |
Weighted- (in months) |
Monthly (% ABS) (a) |
Expected Cumulative Credit Losses |
Annual Discount Rate |
Weighted- Average Coupon |
|||||||||||||||
| Interest-only strip (b) |
$ | 9.2 | 1.7 | 1.26 | % | 1.49 | % | 12.00 | % | 7.06 | % | ||||||||||
| Decline in fair value: |
|||||||||||||||||||||
| 10% adverse change |
$ | .2 | $ | .5 | $ | .5 | |||||||||||||||
| 20% adverse change |
$ | .4 | $ | .1 | $ | 1.0 | |||||||||||||||
| Servicing asset (b) |
$ | .6 | 2.6 | 1.26 | % | 1.49 | % | 10.00 | % | 7.06 | % | ||||||||||
| Decline in fair value: |
|||||||||||||||||||||
| 10% adverse change |
|||||||||||||||||||||
| 20% adverse change |
$ | .1 | |||||||||||||||||||
| (a) | Absolute prepayment speed. |
| (b) | Series 2005-A. |
NOTE 11 PREMISES, EQUIPMENT AND LEASEHOLD IMPROVEMENTS
Premises, equipment and leasehold improvements, stated at cost less accumulated depreciation and amortization, were as follows:
| December 31 - in millions | 2008 (a) | 2007 | ||||||
| Land |
$ | 577 | $ | 250 | ||||
| Buildings |
1,215 | 1,053 | ||||||
| Equipment |
2,773 | 2,029 | ||||||
| Leasehold improvements |
531 | 433 | ||||||
| Total |
5,096 | 3,765 | ||||||
| Accumulated depreciation and amortization |
(1,867 | ) | (1,764 | ) | ||||
| Net book value |
$ | 3,229 | $ | 2,001 | ||||
| (a) | Amounts at December 31, 2008 included $1.2 billion related to National City. |
Depreciation expense on premises, equipment and leasehold improvements totaled $225 million in 2008, $178 million in 2007 and $180 million in 2006. Amortization expense, primarily for capitalized internally developed software, was $44 million in 2008, $40 million in 2007 and $44 million in 2006.
We lease certain facilities and equipment under agreements expiring at various dates through the year 2067. We account for these as operating leases. Rental expense on such leases amounted to $202 million in 2008, $207 million in 2007 and $193 million in 2006.
Required minimum annual rentals that we owe on noncancelable leases having initial or remaining terms in excess of one year totaled $2.6 billion at December 31, 2008 and $1.2 billion at December 31, 2007. Minimum annual rentals for the years 2009 through 2014 and thereafter are as follows:
| | 2009: $329 million, |
| | 2010: $309 million, |
| | 2011: $270 million, |
| | 2012: $242 million, |
| | 2013: $217 million, and |
| | 2014 and thereafter: $1.2 billion. |
NOTE 12 DEPOSITS
The aggregate amount of time deposits with a denomination of $100,000 or more was $26.8 billion at December 31, 2008 and $14.8 billion at December 31, 2007.
112
Total time deposits of $75.9 billion at December 31, 2008 have contractual maturities for the years 2009 through 2014 and thereafter as follows:
| | 2009: $44.9 billion, |
| | 2010: $12.8 billion, |
| | 2011: $4.9 billion, |
| | 2012: $7.7 billion, |
| | 2013: $1.3 billion, and |
| | 2014 and thereafter: $4.3 billion. |
NOTE 13 BORROWED FUNDS
Bank notes at December 31, 2008 totaling $1.0 billion have interest rates ranging from 2.75% to 5.70% with approximately $500 million maturing in 2009. Senior and subordinated notes consisted of the following:
| December 31, 2008 Dollars in millions |
Outstanding | Stated Rate | Maturity | |||||
| Senior |
$ | 12,622 | .23 5.50 | % | 2009 2047 | |||
| Subordinated |
||||||||
| Junior |
2,898 | 2.77 10.18 | % | 2028 2068 | ||||
| All other |
8,310 | 2.35 9.65 | % | 2009 2019 | ||||
| Total subordinated |
11,208 | |||||||
| Total senior and subordinated |
$ | 23,830 | ||||||
Included in outstandings for the senior and subordinated notes in the table above are basis adjustment increases of $81 million and $551 million, respectively, related to fair value accounting hedges as of December 31, 2008.
In December 2008, we issued the following senior notes totaling $2.9 billion under the FDICs Temporary Liquidity Guarantee Program-Debt Guarantee Program:
| | $2 billion of fixed rate senior notes due June 2012. These notes pay interest semiannually at a fixed rate of 2.3%. |
| | $500 million of fixed rate senior notes due June 2011. These notes pay interest semiannually at a fixed rate of 1.875%. |
| | $400 million of floating rate senior notes due June 2011. Interest will be reset quarterly to 3-month LIBOR plus 28 basis points and interest will be paid quarterly. |
Each of these series of senior notes is guaranteed by the FDIC and is backed by the full faith and credit of the United States of America through June 30, 2012.
Total borrowed funds of $52.2 billion at December 31, 2008 have scheduled or anticipated repayments for the years 2009 through 2014 and thereafter as follows:
| | 2009: $18.6 billion, |
| | 2010: $9.4 billion, |
| | 2011: $5.2 billion, |
| | 2012: $4.8 billion, |
| | 2013: $4.0 billion, and |
| | 2014 and thereafter: $10.2 billion. |
Included in borrowed funds are FHLB borrowings of $18.1 billion at December 31, 2008, $9.0 billion of which are collateralized by a blanket lien on residential mortgage and other real estate-related loans and mortgage-backed and treasury securities and $224 million are collateralized by pledged mortgage-backed and treasury securities. The remaining $8.9 billion, assumed in the National City acquisition, are collateralized by a blanket lien on residential mortgage and home equity loans and mortgage-backed securities. FHLB advances of $5.1 billion have scheduled maturities of less than one year. The remainder of the FHLB borrowings have balances that will mature from 2010 2030, with interest rates ranging from 0% 7.33%.
113
As part of the National City acquisition, PNC assumed liability for the conversion of $1.4 billion of convertible senior notes. Interest on these notes is payable semiannually at a fixed rate of 4.0%. The maturity date of these notes is February 1, 2011. PNC may not redeem these notes prior to their maturity date. Holders may convert the notes, at their option, prior to November 15, 2010 under certain circumstances, including (i) if the trading price of the notes is less than a defined threshold measured against the market value of PNC common stock, (ii) any time after March 31, 2008, if the market price of PNC common stock exceeds 130% of the conversion price of the notes in effect on the last trading day of the immediately preceding calendar quarter, or (iii) upon the occurrence of certain specific events. After November 15, 2010, the holders may convert their notes at any time through the third scheduled trading date preceding the maturity date. The initial conversion rate equals 2.0725 shares per $1,000 face value of notes. The conversion rate will be subject to adjustment for stock splits, stock dividends, cash dividends in excess of certain thresholds, stock repurchases where the price exceeds market values, and certain other events. Upon conversion, PNC will pay cash equal to the principal balance of the notes and may issue shares of its common stock for any conversion value, determined over a 40 day observation period, that exceeds the principal balance of the notes being converted. The maximum number of net common shares that PNC may be required to issue is 3.6 million shares, subject to potential adjustment in the case of certain events, make-whole fundamental changes, or early termination.
The holders of the convertible senior notes may elect: i) in the case of a make-whole fundamental change, to convert the notes prior to the effective time of such change, in which case the conversion rate will be increased as provided by a formula set forth in the indenture supplement governing the convertible senior notes; or ii) upon the effective time of any fundamental change, to require PNC to repurchase the convertible senior notes at their principal amount plus accrued but unpaid interest. Generally, a fundamental change includes an acquisition of more than 50% of PNCs common stock, certain mergers, consolidations or other business combinations, if PNCs continuing directors are less than the majority of the Board of Directors, a liquidation or dissolution, or PNCs common stock is not listed on any US national securities exchange. These rights may discourage a business combination or other transaction that is otherwise favored by certain shareholders.
The $2.9 billion of junior subordinated debt included in the above table represents the only debt redeemable prior to maturity. The call price and related premiums are discussed in Note 14 Capital Securities of Subsidiary Trusts.
114
NOTE 14 CAPITAL SECURITIES OF SUBSIDIARY TRUSTS
At December 31, 2008, capital securities totaling $3.5 billion represented non-voting preferred beneficial interests in the assets of the following (Trusts acquired with National City follow in a separate table):
| Trust | Date Formed | Description of Capital Securities | Redeemable | |||
| PNC Capital Trust C |
June 1998 | $200 million due June 1, 2028, bearing interest at a floating rate per annum equal to 3-month LIBOR plus 57 basis points. The rate in effect at December 31, 2008 was 2.773%. | On or after June 1, 2008 at par. | |||
| PNC Capital Trust D |
December 2003 | $300 million of 6.125% capital securities due December 15, 2033. | On or after December 18, 2008 at par. | |||
| PNC Capital Trust E |
February 2008 | $450 million of 7.75% capital securities due March 15, 2068. | On or after March 15, 2013 at par. * | |||
| James Monroe Statutory Trust II |
July 2003 | $4 million due July 31, 2033, bearing an interest rate equal to 3-month LIBOR plus 310 basis points. The rate in effect at December 31, 2008 was 4.559%. | On or after July 31, 2008 at par. | |||
| James Monroe Statutory Trust III |
September 2005 | $8 million due December 15, 2035 at a fixed rate of 6.253%. The fixed rate remains in effect until September 15, 2010 at which time the securities pay a floating rate of LIBOR plus 155 basis points. | On or after December 15, 2010. | |||
| Yardville Capital Trust II |
June 2000 | $15 million of 9.5% capital securities due June 22, 2030. | On or after June 23, 2010 at par plus a premium of up to 4.75%. | |||
| Yardville Capital Trust III |
March 2001 | $6 million of 10.18% capital securities due June 2031. | On or after June 8, 2011 at par plus a premium of up to 5.09%. | |||
| Yardville Capital Trust IV |
February 2003 | $15 million due March 1, 2033, bearing an interest rate equal to 3-month LIBOR plus 340 basis points. The rate in effect at December 31, 2008 was 5.581%. | On or after March 1, 2008 at par. | |||
| Yardville Capital Trust V |
September 2003 | $10 million due October 8, 2033, bearing an interest rate equal to 3-month LIBOR plus 300 basis points. The rate in effect at December 31, 2008 was 7.819%. | On or after October 8, 2008 at par. | |||
| Yardville Capital Trust VI |
June 2004 | $15 million due July 23, 2034, bearing an interest rate equal to 3-month LIBOR plus 270 basis points. The rate in effect at December 31, 2008 was 6.534%. | On or after July 23, 2009 at par. | |||
| Sterling Financial Statutory Trust II |
June 2003 | $35 million due June 26, 2033 at a fixed rate of 5.55%. The fixed rate remained in effect until June 26, 2008 at which time the securities began paying a floating rate of 3-month LIBOR plus 310 basis points. The rate in effect at December 31, 2008 was 4.566%. | On or after June 26, 2008 at par. | |||
| Sterling Financial Statutory Trust III |
December 2004 | $15 million due December 15, 2034 at a fixed rate of 6%. The fixed rate remains in effect until December 15, 2009 at which time the securities pay a floating rate of 3-month LIBOR plus 189 basis points. | On or after December 15, 2009 at par. | |||
| Sterling Financial Statutory Trust IV |
February 2005 | $15 million due March 15, 2035 at a fixed rate of 6.19%. The fixed rate remains in effect until March 15, 2010 at which time the securities pay a floating rate of 3-month LIBOR plus 187 basis points. | On or after March 15, 2010 at par. | |||
| Sterling Financial Statutory Trust V |
March 2007 | $20 million due March 15, 2037 at a fixed rate of 7%. The fixed rate remained in effect until June 15, 2007 at which time the securities began paying a floating rate of 3-month LIBOR plus 165 basis points. The rate in effect at December 31, 2008 was 3.646%. | March 15, 2012 at par. | |||
| * | We may only redeem or repurchase the trust preferred securities of, and the junior subordinated notes payable to, PNC Capital Trust E prior to and including March 15, 2038 subject to having received proceeds of the issuance of certain qualified securities and subject to the other terms and conditions set forth in the applicable replacement capital covenant. As of December 31, 2008, the beneficiaries of this limitation are the holders of our $300 million of 6.125% Junior Subordinated Notes issued in December 2003. |
Effective December 31, 2008, the following Trusts were added as part of the National City acquisition.
115
| Trust | Date Formed | Description of Capital Securities | Redeemable | |||
| National City Preferred Capital Trust I |
January 2008 | $500 million due December 10, 2043 at a fixed rate of 12.00%. The fixed rate remains in effect until December 10, 2012 at which time the interest rate resets to 3-month LIBOR plus 861 basis points. | On or after December 10, 2016 at par. ** | |||
| National City Capital Trust II |
November 2006 | $750 million due November 15, 2066 at a fixed rate of 6.625%. The fixed rate remains in effect until November 15, 2036 at which time the securities pay a floating rate of one-month LIBOR plus 229 basis points. | On or after November 15, 2011 at par. *** | |||
| National City Capital Trust III |
May 2007 | $500 million due May 25, 2067 at a fixed rate of 6.625%. The fixed rate remains in effect until May 25, 2047 at which time the securities pay a floating rate of one-month LIBOR plus 212.63 basis points. | On or after May 25, 2012 at par. *** | |||
| National City Capital Trust IV |
August 2007 | $518 million due August 30, 2067 at a fixed rate of 8.00%. The fixed rate remains in effect until September 15, 2047 at which time the securities pay a floating rate of one-month LIBOR plus 348.7 basis points. | On or after August 30, 2012 at par. *** | |||
| MAF Bancorp Capital Trust I |
April 2005 | $30 million due June 15, 2035 bearing an interest rate of 3-month LIBOR plus 175 basis points. The rate in effect at December 31, 2008 was 3.746%. | On or after June 15, 2010 at par. | |||
| MAF Bancorp Capital Trust II |
August 2005 | $35 million due September 15, 2035 bearing an interest rate of 3-month LIBOR plus 140 basis points. The rate in effect at December 31, 2008 was 3.396%. | On or after September 15, 2010 at par. | |||
| Fidelity Capital Trust II |
December 2003 | $22 million due January 23, 2034 bearing an interest rate of 3-month LIBOR plus 285 basis points. The rate in effect at December 31, 2008 was 6.315%. | On or after January 23, 2009 at par. | |||
| Fidelity Capital Trust III |
October 2004 | $30 million due November 23, 2034 bearing an interest rate of 3-month LIBOR plus 197 basis points. The rate in effect at December 31, 2008 was 4.123%. | On or after November 23, 2009 at par. | |||
| ** | We may only redeem or repurchase the trust preferred securities of, and the junior subordinated notes payable to, National City Preferred Capital Trust I prior to December 10, 2016, subject to having received proceeds from the issuance of certain qualified securities and subject to the other terms and conditions set forth in the applicable replacement capital covenant. As of December 31, 2008, the beneficiaries of this limitation are the holders of our $700 million of 6.875% subordinated notes due 2019. The Trust holds $500 million of 8.729% junior subordinated notes and 3.271% Stock Purchase Contracts issued by PNC. |
| *** | We may only redeem or repurchase the trust preferred securities of, and our junior subordinated notes payable to, National City Capital Trust II, III and IV more than 10 years in advance of their legal maturity dates, subject to having received proceeds from the issuance of certain qualified securities and subject to the other terms and conditions set forth in the applicable replacement capital covenant. As of December 31, 2008, the beneficiaries of this limitation are the holders of our $700 million of 6.875% subordinated notes due 2019. |
116
All of these Trusts are wholly owned finance subsidiaries of PNC. In the event of certain changes or amendments to regulatory requirements or federal tax rules, the capital securities are redeemable in whole. The financial statements of the Trusts are not included in PNCs consolidated financial statements in accordance with GAAP.
At December 31, 2008, PNCs junior subordinated debt of $2.9 billion, net of National Cityrelated purchase accounting adjustments, represented debentures purchased and held as assets by the Trusts.
The obligations of the respective parent of each Trust, when taken collectively, are the equivalent of a full and unconditional guarantee of the obligations of such Trust under the terms of the Capital Securities. Such guarantee is subordinate in right of payment in the same manner as other junior subordinated debt. There are certain restrictions on PNCs overall ability to obtain funds from its subsidiaries. For additional disclosure on these funding restrictions, including an explanation of dividend and intercompany loan limitations, see Note 23 Regulatory Matters.
PNC is subject to restrictions on dividends and other provisions similar to or in some ways more restrictive than those potentially imposed under the Exchange Agreements with Trust II and Trust III, as described in Note 3 Variable Interest Entities. PNC is also subject to dividend restrictions as a result of our issuance of preferred stock to the US Treasury under the TARP Capital Purchase Program as described in Note 19 Shareholders Equity.
NOTE 15 EMPLOYEE BENEFIT PLANS
PENSION AND POSTRETIREMENT PLANS
We have a noncontributory, qualified defined benefit pension plan covering eligible employees. The plan derives benefits from cash balance formulas based on compensation levels, age and length of service. Pension contributions are based on an actuarially determined amount necessary to fund total benefits payable to plan participants. National City had a qualified pension plan covering substantially all employees hired prior to April 1, 2006. Pension benefits are derived from a cash balance formula, whereby credits based on salary, age, and years of service are allocated to employee accounts. The National City plan was merged with our qualified pension plan on December 31, 2008. As of the plan merger date, no changes to either plan design or benefits occurred.
We also maintain nonqualified supplemental retirement plans for certain employees. On December 31, 2008, the participants of National Citys supplemental executive retirement plans became 100% vested due to the change in control. We also provide certain health care and life insurance benefits for qualifying retired employees (postretirement benefits) through various plans. The nonqualified pension and postretirement benefit plans are unfunded. The Company reserves the right to terminate or make plan changes at any time.
117
We use a measurement date of December 31 for plan assets and benefit obligations. A reconciliation of the changes in the projected benefit obligation for qualified pension, nonqualified pension and postretirement benefit plans as well as the change in plan assets for the qualified pension plan follows:
| Qualified Pension |
Nonqualified Pension |
Postretirement Benefits |
||||||||||||||||||||||
| December 31 (Measurement Date) in millions | 2008 | 2007 | 2008 | 2007 | 2008 | 2007 | ||||||||||||||||||
| Accumulated benefit obligation at end of year |
$ | 3,493 | $ | 1,436 | $ | 253 | $ | 109 | ||||||||||||||||
| Projected benefit obligation at beginning of year |
$ | 1,507 | $ | 1,245 | $ | 113 | $ | 76 | $ | 243 | $ | 235 | ||||||||||||
| National City acquisition |
2,109 | 145 | 105 | |||||||||||||||||||||
| Other acquisitions (a) |
247 | 5 | 34 | 3 | 18 | |||||||||||||||||||
| Service cost |
44 | 42 | 2 | 2 | 3 | 3 | ||||||||||||||||||
| Interest cost |
86 | 82 | 6 | 6 | 15 | 14 | ||||||||||||||||||
| Amendments |
(17 | ) | (5 | ) | ||||||||||||||||||||
| Actuarial losses (gains) and changes in assumptions |
(18 | ) | (11 | ) | 2 | 4 | (17 | ) | (2 | ) | ||||||||||||||
| EITF 06-4 adoption |
29 | |||||||||||||||||||||||
| Participant contributions |
9 | 8 | ||||||||||||||||||||||
| Federal Medicare subsidy on benefits paid |
2 | 2 | ||||||||||||||||||||||
| Benefits paid |
(94 | ) | (98 | ) | (10 | ) | (9 | ) | (33 | ) | (30 | ) | ||||||||||||
| Projected benefit obligation at end of year |
$ | 3,617 | $ | 1,507 | $ | 263 | $ | 113 | $ | 359 | $ | 243 | ||||||||||||
| Fair value of plan assets at beginning of year |
$ | 2,019 | $ | 1,746 | ||||||||||||||||||||
| National City acquisition |
2,032 | |||||||||||||||||||||||
| Other acquisitions (a) |
242 | |||||||||||||||||||||||
| Actual return on plan assets |
(665 | ) | 129 | |||||||||||||||||||||
| Employer contribution |
$ | 10 | $ | 9 | $ | 22 | $ | 20 | ||||||||||||||||
| Participant contributions |
9 | 8 | ||||||||||||||||||||||
| Federal Medicare subsidy on benefits paid |
2 | 2 | ||||||||||||||||||||||
| Benefits paid |
(94 | ) | (98 | ) | (10 | ) | (9 | ) | (33 | ) | (30 | ) | ||||||||||||
| Fair value of plan assets at end of year |
$ | 3,292 | $ | 2,019 | ||||||||||||||||||||
| Funded status |
$ | (325 | ) | $ | 512 | $ | (263 | ) | $ | (113 | ) | $ | (359 | ) | $ | (243 | ) | |||||||
| Net amount recognized on the balance sheet |
$ | (325 | ) | $ | 512 | $ | (263 | ) | $ | (113 | ) | $ | (359 | ) | $ | (243 | ) | |||||||
| Amounts recognized in accumulated other comprehensive income consist of: |
||||||||||||||||||||||||
| Prior service cost (credit) |
(12 | ) | 2 | (22 | ) | (29 | ) | |||||||||||||||||
| Net actuarial loss |
1,004 | 198 | 30 | 30 | 14 | 31 | ||||||||||||||||||
| Amount recognized in AOCI |
$ | 992 | $ | 200 | $ | 30 | $ | 30 | $ | (8 | ) | $ | 2 | |||||||||||
| (a) | Sterling in 2008; Mercantile and Yardville in 2007. |
The fair value of the qualified pension plan assets is less than both the accumulated benefit obligation and the projected benefit obligation. The nonqualified pension plan, which contains several individual plans that are accounted for together, is unfunded. Contributions from us and, in the case of postretirement benefit plans, participant contributions cover all benefits paid under the nonqualified pension plan and postretirement benefit plans. The postretirement plan provides benefits to certain retirees that are at least actuarially equivalent to those provided by Medicare Part D and accordingly, we receive a federal subsidy as shown in the table.
PNC PENSION PLAN ASSETS
Assets related to our qualified pension plan (the Plan) are held in trust (the Trust). The trustee is PNC Bank, N.A. The Trust is exempt from tax pursuant to section 501(a) of the Internal Revenue Code (the Code). The Plan is qualified under section 401(a) of the Code. Plan assets consist primarily of listed domestic and international equity securities and US government, agency, and corporate debt securities and real estate investments. Plan assets do not include common stock, preferred stock or debt of PNC.
The Pension Plan Administrative Committee (the Committee) adopted the current Pension Plan Investment Policy Statement, including the updated target allocations and allowable ranges shown below, on August 13, 2008.
The long-term investment strategy for pension plan assets is to:
| | Meet present and future benefit obligations to all participants and beneficiaries, |
| | Cover reasonable expenses incurred to provide such benefits, including expense incurred in the administration of the Trust and the Plan, |
| | Provide sufficient liquidity to meet benefit and expense payment requirements on a timely basis, and |
| | Provide a total return that, over the long term, maximizes the ratio of trust assets to liabilities by maximizing investment return, at an appropriate level of risk. |
118
The Plans specific investment objective is to meet or exceed the investment policy benchmark over the long term. The investment policy benchmark compares actual performance to a weighted market index, and measures the contribution of active investment management and policy implementation. This investment objective is expected to be achieved over the long term (one or more market cycles) and is measured over rolling five-year periods. Total return calculations are time-weighted and are net of investment-related fees and expenses.
The asset strategy allocations for the Trust at the end of 2008 and 2007, and the target allocation range, by asset category, are as follows:
| Target Allocation Range |
Percentage of Plan Assets by Strategy at December 31 |
||||||||
| PNC Pension Plan | 2008 | 2007 | |||||||
| Asset Category |
|||||||||
| Equity securities |
49-69 | % | 58 | % | 62 | % | |||
| Fixed income securities |
32-39 | % | 39 | % | 34 | % | |||
| Real estate |
4-6 | % | 3 | % | 4 | % | |||
| Other |
0-5 | % | | | |||||
| Total |
100 | % | 100 | % | |||||
The asset category represents the allocation of Plan assets in accordance with the investment objective of each of the Plans investment managers. Certain domestic equity investment managers utilize derivatives and fixed income securities as described in their Investment Management Agreements to achieve their investment objective under the Investment Policy Statement. Other investment managers may invest in eligible securities outside of their assigned asset category to meet their investment objectives. The actual percentage of the fair value of total plan assets held as of December 31, 2008 for equity securities, fixed income securities, real estate and all other assets are 32%, 55%, 0%, and 13%, respectively.
We believe that, over the long term, asset allocation is the single greatest determinant of risk. Asset allocation will deviate from the target percentages due to market movement, cash flows, and investment manager performance. Material deviations from the asset allocation targets can alter the expected return and risk of the Trust. On the other hand, frequent rebalancing to the asset allocation targets may result in significant transaction costs, which can impair the Trusts ability to meet its investment objective. Accordingly, the Trust portfolio is periodically rebalanced to maintain asset allocation within the target ranges described above.
In addition to being diversified across asset classes, the Trust is diversified within each asset class. Secondary diversification provides a reasonable basis for the expectation that no single security or class of securities will have a disproportionate impact on the total risk and return of the Trust.
The Committee selects investment managers for the Trust based on the contributions that their respective investment styles and processes are expected to make to the investment performance of the overall portfolio. The managers Investment Objectives and Guidelines, which are a part of each managers Investment Management Agreement, document performance expectations and each managers role in the portfolio. The Committee uses the Investment Objectives and Guidelines to establish, guide, control and measure the strategy and performance for each manager.
The purpose of investment manager guidelines is to:
| | Establish the investment objective and performance standards for each manager, |
| | Provide the manager with the capability to evaluate the risks of all financial instruments or other assets in which the managers account is invested, and |
| | Prevent the manager from exposing its account to excessive levels of risk, undesired or inappropriate risk, or disproportionate concentration of risk. |
The guidelines also indicate which investments and strategies the manager is permitted to use to achieve its performance objectives, and which investments and strategies it is prohibited from using.
Where public market investment strategies may include the use of derivatives and/or currency management, language is incorporated in the managers guidelines to define allowable and prohibited transactions and/or strategies. Derivatives are typically employed by investment managers to modify risk/return characteristics of their portfolio(s), implement asset allocation changes in a cost-effective manner, or reduce transaction costs. Under the managers investment guidelines, derivatives may not be used solely for speculation or leverage. Derivatives are used only in circumstances where they offer the most efficient economic means of improving the risk/reward profile of the portfolio.
119
BlackRock, Global Investment Servicing and our Retail Banking business segments receive compensation for providing investment management, trustee and custodial services for the majority of the Trust portfolio. Compensation for such services is paid by PNC. Non-affiliate service providers for the Trust are compensated from plan assets.
NATIONAL CITY PENSION PLAN ASSETS
Assets related to the pension plan investments of the former National City qualified pension plan are held in trust. The trustee is National City Bank. The Trust is exempt from tax pursuant to section 501(a) of the Code. The plan is qualified under section 401(a) of the Code. Plan assets consist primarily of listed domestic and international equity securities and US government, agency, and corporate debt securities and real estate investments. Plan assets do include common stock of PNC as discussed below.
The asset allocation for National Citys defined benefit pension plan as of the measurement date, by asset category is as follows:
| Percentage of Plan Assets | |||
| National City Pension Plan | December 31 2008 | ||
| Asset Category |
|||
| Equity securities |
42 | % | |
| Fixed income securities |
9 | % | |
| Cash and cash equivalents |
49 | % | |
| Total |
100 | % |
The investment objective for the National City qualified pension plan is to maximize total return with tolerance for slightly above average risk. Asset allocation strongly favors equities, with a target allocation of approximately 80% equity securities, 15% fixed income securities, and 5% cash. Due to volatility in the market, the target allocation is not always desirable as asset allocations will fluctuate. A core equity position of large cap stocks will be maintained. However, more aggressive or volatile sectors will be meaningfully represented in the asset mix in pursuit of higher returns. Higher volatility investment strategies such as credit risk, structured finance, and international bonds will be appropriate strategies in conjunction with the core position. As of December 31, 2008, the plan had a temporary large cash and cash equivalents balance due to a contribution of $850 million made by National City to the plan on December 30, 2008 which had not yet been fully invested.
Equity securities included $9 million of National City common stock at December 31, 2008, representing 5,048,833 shares at a closing price of $1.81. In conjunction with PNCs acquisition of National City, these shares were exchanged into 197,914 shares of PNC common stock.
The following table provides information regarding our estimated future cash flows related to our various plans, including the impact of the National City plans:
ESTIMATED CASH FLOWS
| Postretirement Benefits | ||||||||||||||
| In millions | Qualified Pension |
Nonqualified Pension |
Gross Benefit |
Reduction in PNC Benefit Payments Due to Medicare Part D Subsidy |
||||||||||
| Estimated 2009 |
||||||||||||||
| employer contributions |
| $ | 29 | $ | 35 | $ | 2 | |||||||
| Estimated future |
||||||||||||||
| benefit |
||||||||||||||
| payments |
||||||||||||||
| 2009 |
$ | 247 | $ | 29 | $ | 35 | $ | 2 | ||||||
| 2010 |
253 | 30 | 36 | 2 | ||||||||||
| 2011 |
262 | 28 | 34 | 2 | ||||||||||
| 2012 |
267 | 28 | 34 | 2 | ||||||||||
| 2013 |
277 | 25 | 34 | 2 | ||||||||||
| 2014 2018 |
1,499 | 109 | 164 | 9 | ||||||||||
The qualified pension plan contributions are deposited into the Trust, and the qualified pension plan benefit payments are paid from the Trust. For the other plans, total contributions and the benefit payments are the same and represent expected benefit amounts, which are paid from general assets. Postretirement benefits are net of participant contributions.
120
The components of net periodic benefit cost/(income) and other amounts recognized in other comprehensive income were as follows. This table excludes the impact of the National City plans which we acquired on December 31, 2008.
| Qualified Pension Plan | Nonqualified Pension Plan | Postretirement Benefits | |||||||||||||||||||||||||||||||||
| Year ended December 31 in millions | 2008 | 2007 | 2006 | 2008 | 2007 | 2006 | 2008 | 2007 | 2006 | ||||||||||||||||||||||||||
| Net periodic cost consists of: |
|||||||||||||||||||||||||||||||||||
| Service cost |
$ | 44 | $ | 42 | $ | 34 | $ | 2 | $ | 2 | $ | 1 | $ | 3 | $ | 3 | $ | 2 | |||||||||||||||||
| Interest cost |
86 | 82 | 68 | 6 | 6 | 4 | 15 | 14 | 13 | ||||||||||||||||||||||||||
| Expected return on plan assets |
(160 | ) | (156 | ) | (129 | ) | |||||||||||||||||||||||||||||
| Amortization of prior service cost |
(2 | ) | (1 | ) | (7 | ) | (7 | ) | (6 | ) | |||||||||||||||||||||||||
| Amortization of actuarial losses |
2 | 16 | 2 | 2 | 3 | 1 | |||||||||||||||||||||||||||||
| Net periodic cost |
$ | (32 | ) | $ | (30 | ) | $ | (12 | ) | $ | 10 | $ | 10 | $ | 8 | $ | 11 | $ | 10 | $ | 10 | ||||||||||||||
| Other changes in plan assets and benefit obligations recognized in other comprehensive income: |
|||||||||||||||||||||||||||||||||||
| Current year prior service cost/(credit) |
$ | (17 | ) | $ | (5 | ) | |||||||||||||||||||||||||||||
| Amortization of prior service (cost)/credit |
2 | $ | 7 | 7 | |||||||||||||||||||||||||||||||
| Current year actuarial loss/(gain) |
807 | $ | 16 | $ | 2 | $ | 4 | (17 | ) | (2 | ) | ||||||||||||||||||||||||
| Amortization of actuarial (loss)/gain |
(2 | ) | (2 | ) | (2 | ) | |||||||||||||||||||||||||||||
| Total recognized in OCI |
792 | 14 | 2 | (10 | ) | ||||||||||||||||||||||||||||||
| Total recognized in net periodic cost and OCI |
$ | 760 | $ | (16 | ) | $ | 10 | $ | 12 | $ | 1 | $ | 10 | ||||||||||||||||||||||
The weighted-average assumptions used (as of the beginning of each year) to determine net periodic costs shown above were as follows:
| Net Periodic Cost Determination | |||||||||
| Year ended December 31 | 2008 | 2007 | 2006 | ||||||
| Discount rate |
|||||||||
| Qualified pension |
5.95 | % | 5.70 | % | 5.50 | % | |||
| Nonqualified pension |
5.75 | 5.60 | 5.40 | ||||||
| Postretirement benefits |
5.95 | 5.80 | 5.60 | ||||||
| Rate of compensation increase (average) |
4.00 | 4.00 | 4.00 | ||||||
| Assumed health care cost trend rate |
|||||||||
| Initial trend |
9.50 | 10.00 | 10.00 | ||||||
| Ultimate trend |
5.00 | 5.00 | 5.00 | ||||||
| Year ultimate reached |
2014 | 2012 | 2011 | ||||||
| Expected long-term return on plan assets |
8.25 | 8.25 | 8.25 | ||||||
The weighted-average assumptions used (as of the end of each year) to determine year-end obligations for pension and postretirement benefits were as follows:
| At December 31 | ||||||
| 2008 | 2007 | |||||
| Discount rate |
||||||
| Qualified pension |
6.05 | % | 5.95 | % | ||
| Nonqualified pension |
5.90 | 5.75 | ||||
| Postretirement benefits |
5.95 | 5.95 | ||||
| Rate of compensation increase (average) |
4.00 | 4.00 | ||||
| Assumed health care cost trend rate |
||||||
| Initial trend |
9.00 | 9.50 | ||||
| Ultimate trend |
5.00 | 5.00 | ||||
| Year ultimate reached |
2014 | 2014 | ||||
The discount rate assumptions were determined independently for each plan reflecting the duration of each plans obligations. Specifically, a yield curve was produced for a universe containing the majority of US-issued Aa grade corporate bonds, all of which were non-callable (or callable with make-whole provisions). Excluded from this yield curve were the 10% of the bonds with the highest yields and the 10% with the lowest yields. For each plan, the discount rate was determined as the level equivalent rate that would produce the same present value obligation as that using spot rates aligned with the projected benefit payments.
121
The expected return on plan assets is a long-term assumption established by considering historical and anticipated returns of the asset classes invested in by the pension plan and the allocation strategy currently in place among those classes. We review this assumption at each measurement date and adjust it if warranted.
The health care cost trend rate assumptions shown in the preceding tables relate only to the postretirement benefit plans. A one-percentage-point change in assumed health care cost trend rates would have the following effects:
| Year ended December 31, 2008 In millions |
Increase | Decrease | |||||
| Effect on total service and interest cost |
$ | 1 | | ||||
| Effect on year-end benefit obligation |
9 | $ | (8 | ) | |||
Under SFAS 158, unamortized actuarial gains and losses and prior service costs and credits are recognized in AOCI each December 31, while amortization of these amounts through net periodic benefit cost occurs in accordance with SFAS 87 and SFAS 106. The estimated amounts that will be amortized in 2009 are as follows:
| 2009 Estimate | ||||||||||
| Year ended December 31 In millions |
Qualified Pension |
Nonqualified Pension |
Postretirement Benefits |
|||||||
| Prior service cost (credit) |
$ | (2 | ) | | $ | (5 | ) | |||
| Net actuarial loss |
80 | | | |||||||
| Total |
$ | 78 | | $ | (5 | ) | ||||
DEFINED CONTRIBUTION PLANS
We have a contributory, qualified defined contribution plan that covers substantially all employees except those covered by other plans as identified below. Under this plan, employee contributions up to 6% of eligible compensation as defined by the plan are matched 100%, subject to Code limitations. The plan is a 401(k) plan and includes an employee stock ownership (ESOP) feature. Employee contributions are invested in a number of investment options available under the plan, including a PNC common stock fund and several BlackRock mutual funds, at the direction of the employee. All shares of PNC common stock held by the plan are part of the ESOP. Employee contributions to the plan for 2008, 2007 and 2006 were matched primarily by shares of PNC common stock held in treasury, except in the case of those participants who have exercised their diversification election rights to have their matching portion in other investments available within the plan. Employee benefits expense related to this plan was $57 million in 2008, $52 million in 2007 and $52 million in 2006. We measured employee benefits expense as the fair value of the shares and cash contributed to the plan by PNC.
We have a separate qualified defined contribution plan that covers substantially all US-based Global Investment Servicing employees not covered by our plan. The plan is a 401(k) plan and includes an ESOP feature. Under this plan, employee contributions of up to 6% of eligible compensation as defined by the plan may be matched annually based on Global Investment Servicing performance levels. Participants must be employed as of December 31 of each year to receive this annual contribution. The performance-based employer matching contribution will be made primarily in shares of PNC common stock held in treasury, except in the case of those participants who have exercised their diversification election rights to have their matching portion in other investments available within the plan. Mandatory employer contributions to this plan are made in cash and include employer basic and transitional contributions. Employee-directed contributions are invested in a number of investment options available under the plan, including a PNC common stock fund and several BlackRock mutual funds, at the direction of the employee. Employee benefits expense for this plan was $11 million in 2008, $10 million in 2007 and $9 million in 2006. We measured employee benefits expense as the fair value of the shares and cash contributed to the plan.
We also maintain a nonqualified supplemental savings plan for certain employees.
We also maintain a defined contribution plan for National City legacy employees. Substantially all National City legacy employees are eligible to contribute a portion of their pretax compensation to the plan. PNC may make contributions to the plan for employees with one or more years of service in the form of company common stock in varying amounts depending on participant contribution levels. PNC reserves the right to terminate or make plan changes at any time.
NOTE 16 STOCK-BASED COMPENSATION PLANS
We have long-term incentive award plans (Incentive Plans) that provide for the granting of incentive stock options, nonqualified stock options, stock appreciation rights, incentive shares/performance units, restricted stock, restricted share units, other share-based awards and dollar-denominated awards to executives and, other than incentive stock options, to non-employee directors. Certain Incentive Plan awards may be paid in stock, cash or a combination of stock and cash. We grant a substantial portion of our stock-based compensation awards during the first quarter of the year. As of December 31, 2008, no stock appreciation rights were outstanding.
122
NONQUALIFIED STOCK OPTIONS
Options are granted at exercise prices not less than the market value of common stock on the grant date. Generally, options granted since 1999 become exercisable in installments after the grant date. Options granted prior to 1999 are mainly exercisable 12 months after the grant date. No option may be exercisable after 10 years from its grant date. Payment of the option exercise price may be in cash or shares of common stock at market value on the exercise date. The exercise price may be paid in previously owned shares.
Generally, options granted under the Incentive Plans vest ratably over a three-year period as long as the grantee remains an employee or, in certain cases, retires from PNC. For all options granted prior to the adoption of SFAS 123R, we recognized compensation expense over the three-year vesting period. If an employee retired prior to the end of the three-year vesting period, we accelerated the expensing of all unrecognized compensation costs at the retirement date. As required under SFAS 123R, we recognize compensation expense for options granted to retirement-eligible employees after January 1, 2006 during the first twelve months subsequent to the grant, in accordance with the service period provisions of the options.
During the third quarter of 2008, we granted approximately one million options to certain senior executives. While these options generally contain the same terms and conditions as previous option grants, cliff vesting will occur on or after the third anniversary from the grant date if the market price of PNC stock exceeds the grant date price by 20% or more over a specified time period. These options were approved by the Personnel and Compensation Committee of the Board of Directors. The grant date fair value was $6.59 per option.
OPTIONS ISSUED FOR STERLING ACQUISITION
On April 4, 2008, in connection with the closing of the Sterling acquisition, we issued 325,489 PNC stock options upon conversion of all outstanding and unexercised Sterling options at that date. Of the total options issued, 159,676 were issued as nonqualified stock options, and the remaining 165,813 were issued as incentive stock options. These PNC options carry generally the same terms and conditions as the original Sterling options. Per the merger agreement, all outstanding options were deemed fully vested at the acquisition date. Accordingly, no ongoing stock option expense will be recognized for these options. The purchase price consideration for the Sterling acquisition included approximately $3.3 million related to these options.
OPTIONS ISSUED FOR NATIONAL CITY ACQUISITION
On December 31, 2008, in connection with the closing of the National City acquisition, we issued approximately 1.7 million PNC stock options upon conversion of all outstanding and unexercised National City options at that date. Of the total options issued, approximately 1.4 million were issued as nonqualified stock options, and the remaining 0.3 million were issued as incentive stock options. These PNC options carry generally the same terms and conditions as the original National City options. Per the merger agreement, all outstanding options were deemed fully vested at the acquisition date. Accordingly, no ongoing stock option expense will be recognized for these options. The purchase price consideration for the National City acquisition included approximately $2.0 million related to these options.
A summary of stock option activity follows:
| Year ended December 31, 2008 In thousands, except weighted-average data |
Shares | Weighted- average exercise price |
Weighted- average remaining contractual life |
Aggregate intrinsic value |
|||||||
| Outstanding, January 1 |
14,326 | $ | 62.15 | ||||||||
| Granted |
3,308 | 60.35 | |||||||||
| Sterling acquisition |
325 | 63.94 | |||||||||
| Exercised |
(3,175 | ) | 55.11 | ||||||||
| Cancelled |
(247 | ) | 57.97 | ||||||||
| Prior to National City acquisition |
14,537 | 63.39 | |||||||||
| National City acquisition |
1,744 | 636.31 | |||||||||
| Outstanding, December 31 |
16,281 | $ | 124.75 | 5.6 years | $ | 4,909 | |||||
| Vested and expected to vest, December 31 (a) |
15,971 | $ | 125.90 | 5.6 years | $ | 4,909 | |||||
| Exercisable, December 31 |
11,373 | $ | 151.03 | 4.3 years | $ | 4,909 | |||||
| (a) | Adjusted for estimated forfeitures on unvested options. |
The weighted-average grant-date fair value of options granted in 2008, 2007 and 2006 was $7.27, $11.37 and $10.75 per option, respectively. To determine stock-based compensation expense under SFAS 123R, the grant-date fair value is applied to the options granted with a reduction made for estimated forfeitures.
At December 31, 2007 and 2006, options for 10,496,000 and 10,743,000 shares of common stock, respectively, were exercisable at a weighted-average price of $59.95 and $58.38, respectively. The total intrinsic value of options exercised during 2008, 2007 and 2006 was $59 million, $52 million and $111 million, respectively.
123
Cash received from option exercises under all Incentive Plans for 2008, 2007 and 2006 was approximately $167 million, $111 million and $233 million, respectively. The actual tax benefit realized for tax deduction purposes from option exercises under all Incentive Plans for 2008, 2007 and 2006 was approximately $58 million, $39 million and $82 million, respectively.
There were no options granted in excess of market value in 2008, 2007 or 2006. Shares of common stock available during the next year for the granting of options and other awards under the Incentive Plans were 36,307,172 at December 31, 2008. Total shares of PNC common stock authorized for future issuance under equity compensation plans totaled 37,842,957 shares at December 31, 2008, which includes shares available for issuance under the Incentive Plans, the Employee Stock Purchase Plan as described below, and a director plan.
During 2008, we issued approximately 3.1 million shares from treasury stock in connection with stock option exercise activity. As with past exercise activity, we intend to utilize treasury stock for future stock option exercises.
As permitted under SFAS 123R, we recognized compensation expense for stock options on a straight-line basis over the pro rata vesting period. Total compensation expense recognized related to PNC stock options in 2008 was $22 million compared with $29 million in 2007 and $31 million in 2006.
Awards granted to non-employee directors in 2008 and 2007 include 25,381 and 20,944 deferred stock units, respectively, awarded under the Outside Directors Deferred Stock Unit Plan. A deferred stock unit is a phantom share of our common stock, which requires liability accounting treatment under SFAS 123R until such awards are paid to the participants as cash. As there are no vesting or service requirements on these awards, total compensation expense is recognized in full on all awarded units on the date of grant.
OPTION PRICING ASSUMPTIONS
For purposes of computing stock option expense, we estimated the fair value of stock options primarily by using the Black-Scholes option-pricing model. Option pricing models require the use of numerous assumptions, many of which are very subjective.
We used the following assumptions in the option pricing models to determine 2008, 2007 and 2006 stock option expense:
| | The risk-free interest rate is based on the US Treasury yield curve, |
| | The dividend yield represents average yields over the previous three-year period, |
| | Volatility is measured using the fluctuation in month-end closing stock prices over a period which corresponds with the average expected option life, but in no case less than a five-year period, and |
| | The expected life assumption represents the period of time that options granted are expected to be outstanding and is based on a weighted average of historical option activity. |
| Weighted-average for the year ended December 31 |
2008 | 2007 | 2006 | ||||||
| Risk-free interest rate |
3.1 | % | 4.8 | % | 4.5 | % | |||
| Dividend yield |
3.3 | 3.4 | 3.7 | ||||||
| Volatility |
18.5 | 18.8 | 20.5 | ||||||
| Expected life |
5.7 yrs. | 4.3 yrs. | 5.1 yrs. |
INCENTIVE/PERFORMANCE UNIT SHARE AWARDS AND RESTRICTED STOCK/UNIT AWARDS
The fair value of nonvested incentive/performance unit share awards and restricted stock/unit awards is initially determined based on prices not less than the market value of our common stock price on the date of grant. Incentive/performance unit share awards are subsequently valued subject to the achievement of one or more financial and other performance goals over a three-year period. The Personnel and Compensation Committee of the Board of Directors approves the final award payout with respect to incentive/performance unit share awards. Restricted stock/unit awards have various vesting periods ranging from 12 months to 60 months. There are no financial or performance goals associated with any of our restricted stock/unit awards.
124
The weighted-average grant-date fair value of incentive/performance unit share awards and restricted stock/unit awards granted in 2008, 2007 and 2006 was $59.25, $73.83 and $67.36 per share, respectively. We recognize compensation expense for such awards ratably over the corresponding vesting and/or performance periods for each type of program. Total compensation expense recognized related to incentive/performance unit share awards and restricted stock/unit awards during 2008 was approximately $51 million compared with $42 million in 2007 and $45 million in 2006.
A summary of nonvested incentive/performance unit shares and restricted stock/unit share activity follows:
| Shares in thousands | Nonvested Performance |
Weighted- Average Grant Date Fair Value |
Nonvested Stock/ |
Weighted- Average Grant Date Fair Value |
|||||||
| Dec. 31, 2007 |
316 | $ | 66.28 | 1,869 | $ | 60.20 | |||||
| Granted |
176 | 53.27 | 548 | 55.20 | |||||||
| Vested |
(652 | ) | 50.92 | ||||||||
| Forfeited |
(30 | ) | 62.75 | ||||||||
| Dec. 31, 2008 |
492 | $ | 61.63 | 1,735 | $ | 62.07 | |||||
In the chart above, the weighted-average grant-date fair value of incentive/performance unit share awards and restricted stock/unit awards is measured by reducing the grant date price by the present value of dividends expected to be paid on the underlying shares and for estimated forfeitures on restricted stock/unit awards.
At December 31, 2008, there was $39 million of unrecognized deferred compensation expense related to nonvested share-based compensation arrangements granted under the Incentive Plans. This cost is expected to be recognized as expense over a period of no longer than five years. The total fair value of incentive/performance unit share and restricted stock /unit awards vested during 2008, 2007 and 2006 was approximately $41 million, $79 million and $63 million, respectively.
LIABILITY AWARDS
In 2008, 2007 and 2006 we granted a performance unit incentive award each year to a senior executive. The grant is share-denominated with an initial specified target number of 47,000 share units for 2008, 26,400 share units for 2007 and 30,000 share units for 2006. The potential award is dependent on the achievement of certain performance criteria over a three-year period ending December 31, 2008 for the 2006 grant, December 31, 2009 for the 2007 grant, and December 31, 2010 for the 2008 grant. Final awarded performance units will be paid only in cash.
Additionally, beginning in 2008, we granted other cash-payable restricted share units to certain executives. The grants were made primarily as part of an annual bonus incentive deferral plan. While there are time-based, service-related vesting criteria, there are no market or performance criteria associated with these awards. Compensation expense recognized related to these awards was recorded in prior periods as part of annual cash bonus criteria. As of December 31, 2008, there were 91,449 of these cash-payable restricted share units outstanding.
A summary of all nonvested, cash-payable restricted share unit activity follows:
| In thousands | Nonvested Restricted |
Aggregate Intrinsic Value |
|||
| Outstanding, January 1, 2008 |
57 | ||||
| Granted |
145 | ||||
| Outstanding, December 31, 2008 (a) |
202 | $ | 9,878 | ||
| (a) | There were no share units vested and received or forfeited during 2008. |
Total compensation expense recognized related to liability awards, including market valuation adjustments recorded during 2008 on these awards, resulted in a net reduction to expense of approximately $1.1 million. The corresponding amounts for 2007 and 2006 were approximately $1 million of net expense recognized in each year.
125
EMPLOYEE STOCK PURCHASE PLAN
As of December 31, 2008, our ESPP has approximately 1.2 million shares available for issuance. Full-time employees with six months and part-time employees with 12 months of continuous employment with us are eligible to participate in the ESPP at the commencement of the next six-month offering period. Eligible participants may purchase our common stock at 95% of the fair market value on the last day of each six-month offering period. No charge to earnings is recorded with respect to the ESPP.
Shares issued pursuant to the ESPP were as follows:
| Year ended December 31 | Shares | Price Per Share | |||
| 2008 |
133,563 | $ | 54.25 and $46.55 | ||
| 2007 |
111,812 | 68.00 and 62.37 | |||
| 2006 |
105,041 | 66.66 and 70.34 | |||
BLACKROCK LTIP PROGRAMS
BlackRock adopted the 2002 LTIP program to help attract and retain qualified professionals. At that time, PNC agreed to transfer up to four million of the shares of BlackRock common stock then held by us to help fund the 2002 LTIP and future programs approved by BlackRocks board of directors, subject to certain conditions and limitations. Prior to 2006, BlackRock granted awards of approximately $233 million under the 2002 LTIP program, of which approximately $208 million were paid on January 30, 2007. The award payments were funded by 17% in cash from BlackRock and approximately one million shares of BlackRock common stock transferred by PNC and distributed to LTIP participants. As permitted under the award agreements, employees elected to put 95% of the stock portion of the awards back to BlackRock. These shares were retained by BlackRock as treasury stock. We recognized a pretax gain of $82 million in the first quarter of 2007 from the transfer of BlackRock shares. The gain was included in other noninterest income and reflected the excess of market value over book value of the one million shares transferred in January 2007. Additional BlackRock shares were distributed to LTIP participants during the first quarter of 2008, resulting in a $3 million pretax gain in other noninterest income.
BlackRock granted awards in 2007 under an additional LTIP program, all of which are subject to achieving earnings performance goals prior to the vesting date of September 29, 2011. Of the shares of BlackRock common stock that we have agreed to transfer to fund their LTIP programs, approximately 1.6 million shares have been committed to fund the awards vesting in 2011 and the amount remaining would then be available for future awards.
Noninterest income for 2008 included a $243 million pretax gain related to our commitment to fund additional BlackRock LTIP programs. This gain represented the mark-to-market adjustment related to our remaining BlackRock LTIP common shares obligation as of December 31, 2008 and resulted from the decrease in the market value of BlackRock common shares for 2008. Noninterest income for 2007 and 2006 included pretax charges totaling $209 million and $12 million, respectively, related to an increase in the market value of BlackRock common shares for these periods.
Additionally, we reported noninterest expense of $33 million in 2006 related to the BlackRock LTIP awards.
NOTE 17 FINANCIAL DERIVATIVES
We use a variety of derivative financial instruments to help manage interest rate, market and credit risk and reduce the effects that changes in interest rates may have on net income, fair value of assets and liabilities, and cash flows. These instruments include interest rate swaps, interest rate caps and floors, futures contracts, and total return swaps.
Fair Value Hedging Strategies
We enter into interest rate swaps, caps, floors and futures derivative contracts to hedge bank notes, Federal Home Loan Bank borrowings, senior debt and subordinated debt for changes in fair value primarily due to changes in interest rates.
Adjustments related to the ineffective portion of fair value hedging instruments are recorded in interest expense or noninterest income depending on the hedged item.
Cash Flow Hedging Strategies
We enter into interest rate swap contracts to modify the interest rate characteristics of designated commercial loans from variable to fixed in order to reduce the impact of changes in future cash flows due to interest rate changes. We hedged our exposure to the variability of future cash flows for all forecasted transactions for a maximum of 10 years for hedges converting floating-rate commercial loans to fixed. The fair value of these derivatives is reported in other assets or other liabilities and offset in accumulated other comprehensive income (loss) for the effective portion of the derivatives. We subsequently reclassify any unrealized gains or losses related to these swap contracts from accumulated other comprehensive income (loss) into interest income in the same period or periods during which the hedged forecasted transaction affects earnings. Ineffectiveness of the strategies, if any, is recognized immediately in earnings.
126
During the next twelve months, we expect to reclassify to earnings $230 million of pretax net gains, or $149 million after-tax, on cash flow hedge derivatives currently reported in accumulated other comprehensive loss. This amount could differ from amounts actually recognized due to changes in interest rates and the addition of other hedges subsequent to December 31, 2008. These net gains are anticipated to result from net cash flows on receive fixed interest rate swaps that would impact interest income recognized on the related floating rate commercial loans.
As of December 31, 2008 we have determined that there were no hedging positions where it was probable that certain forecasted transactions may not occur within the originally designated time period.
The ineffective portion of the change in value of our fair value and cash flow hedge derivatives resulted in a net gain of $8 million for 2008, a net loss of $1 million for 2007, and a net loss of $4 million in 2006.
Free-Standing Derivatives
To accommodate customer needs, we also enter into financial derivative transactions primarily consisting of interest rate swaps, interest rate caps and floors, futures, swaptions, and foreign exchange and equity contracts. We primarily manage our market risk exposure from customer positions through transactions with third-party dealers. The credit risk associated with derivatives executed with customers is essentially the same as that involved in extending loans and is subject to normal credit policies. We may obtain collateral based on our assessment of the customer. For derivatives not designated as an accounting hedge, the gain or loss is recognized in noninterest income.
Also included in free-standing derivatives are transactions that we enter into for risk management and proprietary purposes that are not designated as accounting hedges, primarily interest rate, basis and total rate of return swaps, interest rate caps, floors and futures contracts, credit default swaps, option and foreign exchange contracts and certain interest rate-locked loan origination commitments as well as commitments to buy or sell mortgage loans.
Basis swaps are agreements involving the exchange of payments, based on notional amounts, of two floating rate financial instruments denominated in the same currency, one tied to one reference rate and the other tied to a second reference rate (e.g., swapping payments tied to one-month LIBOR for payments tied to three-month LIBOR). We use these contracts to mitigate the impact on earnings of exposure to a certain referenced interest rate.
We purchase credit default swaps (CDS) to mitigate the risk of economic loss on a portion of our loan exposure. We also sell loss protection to mitigate the net premium cost and the impact of mark-to-market accounting on the CDS in cases where we buy protection to hedge the loan portfolio and to take proprietary trading positions. The fair values of these derivatives typically are based on the change in value, due to changing credit spreads.
Interest rate lock commitments for, as well as commitments to buy or sell, mortgage loans that we intend to sell are considered free-standing derivatives. Our interest rate exposure on certain commercial and residential mortgage interest rate lock commitments as well as commercial and residential mortgage loans held for sale is economically hedged with total rate of return swaps, pay-fixed interest rate swaps, credit derivatives and forward sales agreements. These contracts mitigate the impact on earnings of exposure to a certain referenced rate. The fair value of loan commitments is based on the estimated fair value of the underlying loan and the probability that the loan will fund within the terms of the commitment. The fair value of the loan commitment also takes into account the fair value of the embedded servicing right pursuant to SAB 109.
Free-standing derivatives also include positions we take based on market expectations or to benefit from price differentials between financial instruments and the market based on stated risk management objectives.
Derivatives Used to Hedge MSRs
The derivative portfolio also includes derivative financial instruments not included in SFAS 133 hedging strategies. The majority of these derivatives are used to manage interest rate and prepayment risk related to residential mortgage servicing rights (MSRs), residential and commercial real estate loans held for sale, and interest rate lock commitments, all of which are carried at fair value consistent with the accounting for the derivatives.
Derivative Counterparty Credit Risk
By purchasing and writing derivative contracts we are exposed to credit risk if the counterparties fail to perform. We seek to minimize credit risk through credit approvals, limits, monitoring procedures and collateral requirements. We generally enter into transactions with counterparties that carry high quality credit ratings. Nonperformance risk including credit risk is included in the determination of the estimated net fair value.
127
We enter into risk participation agreements to share some of the credit exposure with other counterparties related to interest rate derivative contracts or to take on credit exposure to generate revenue. We will make/receive payments under these guarantees if a customer defaults on its obligation to perform under certain credit agreements. Risk participation agreements entered into prior to July 1, 2003 were considered financial guarantees and therefore are not included in derivatives. Agreements entered into subsequent to June 30, 2003 are included in the derivatives table that follows. We determine that we meet our objective of reducing credit risk associated with certain counterparties to derivative contracts when the participation agreements share in their proportional credit losses of those counterparties.
We generally have established agreements with our major derivative dealer counterparties that provide for exchanges of marketable securities or cash to collateralize either partys positions. At December 31, 2008, we held cash, which is included in other borrowed funds on our Consolidated Balance Sheet, US government securities and mortgage-backed securities with a total fair value of $1.4 billion. We pledged cash, which is included in short-term investments on our Consolidated Balance Sheet, and US government securities of $1.2 billion under these agreements.
The total notional or contractual amounts, estimated net fair value and credit risk for derivatives were as follows:
| December 31, 2008 | December 31, 2007 | |||||||||||||||||||
| In millions | Notional/ Contractual amount |
Estimated net fair value |
Credit risk (b) |
Notional/ Contractual amount |
Estimated net fair value |
Credit risk (b) |
||||||||||||||
| ACCOUNTING HEDGES |
||||||||||||||||||||
| Fair value hedges |
$ | 9,888 | $ | 888 | $ | 889 | $ | 10,568 | $ | 190 | $ | 283 | ||||||||
| Cash flow hedges |
5,618 | 527 | 527 | 7,856 | 325 | 325 | ||||||||||||||
| Total |
$ | 15,506 | $ | 1,415 | $ | 1,416 | $ | 18,424 | $ | 515 | $ | 608 | ||||||||
| FREE-STANDING DERIVATIVES |
||||||||||||||||||||
| Interest rate contracts |
$ | 146,137 | $ | 503 | $ | 4,828 | $ | 170,889 | $ | 4 | $ | 1,224 | ||||||||
| Equity contracts |
984 | (4 | ) | 72 | 1,824 | (69 | ) | 144 | ||||||||||||
| Foreign exchange contracts |
8,972 | (3 | ) | 320 | 15,741 | 13 | 153 | |||||||||||||
| Credit derivatives |
2,937 | 205 | 287 | 5,823 | 42 | 96 | ||||||||||||||
| Options |
3,334 | 177 | 315 | 64,448 | 87 | 496 | ||||||||||||||
| Risk participation agreements |
3,290 | 3 | 1,183 | |||||||||||||||||
| Residential mortgage servicing rights |
52,980 | 109 | 1,136 | |||||||||||||||||
| Commitments related to mortgage-related assets |
18,853 | (12 | ) | 69 | 3,190 | 10 | 15 | |||||||||||||
| Other (a) |
773 | 56 | 58 | 642 | (201 | ) | ||||||||||||||
| Total |
$ | 238,260 | $ | 1,031 | $ | 7,088 | $ | 263,740 | $ | (114 | ) | $ | 2,128 | |||||||
| (a) | Relates to PNCs obligation to help fund certain BlackRock LTIP programs and to certain customer-related derivatives. |
| (b) | Credit risk amounts reflect the replacement cost for contracts in a gain position in the event of nonperformance by all counterparties. |
128
NOTE 18 EARNINGS PER SHARE
The following table sets forth basic and diluted earnings per common share calculations:
| Year ended December 31 - in millions, except share and per share data | 2008 | 2007 | 2006 | |||||||||
| Basic |
||||||||||||
| Net income |
$ | 914 | $ | 1,491 | $ | 2,599 | ||||||
| Less: |
||||||||||||
| Net income attributable to noncontrolling interests |
32 | 24 | 4 | |||||||||
| Dividends distributed to common shareholders |
896 | 801 | 627 | |||||||||
| Dividends distributed to preferred shareholders (c) |
21 | 1 | ||||||||||
| Dividends distributed to nonvested restricted shares |
5 | 5 | 5 | |||||||||
| Undistributed net income (loss) |
$ | (40 | ) | $ | 661 | $ | 1,962 | |||||
| Percentage of undistributed income allocated to common shares |
99.5 | % | 99.4 | % | 99.1 | % | ||||||
| Undistributed income (loss) allocated to common shares |
$ | (40 | ) | $ | 658 | $ | 1,944 | |||||
| Plus common dividends |
896 | 801 | 627 | |||||||||
| Net income attributable to basic common shares |
$ | 856 | $ | 1,459 | $ | 2,571 | ||||||
| Basic weighted-average common shares outstanding (in thousands) |
343,980 | 331,300 | 291,758 | |||||||||
| Basic earnings per common share |
$ | 2.49 | $ | 4.40 | $ | 8.81 | ||||||
| DILUTED |
||||||||||||
| Net income attributable to basic common shares |
$ | 856 | $ | 1,459 | $ | 2,571 | ||||||
| Less: BlackRock common stock equivalents |
12 | 16 | 6 | |||||||||
| Plus: Convertible dividends distributed to preferred shareholders (c) |
1 | |||||||||||
| Net income attributable to diluted common shares |
$ | 844 | $ | 1,443 | $ | 2,566 | ||||||
| Basic weighted-average common shares outstanding (in thousands) |
343,980 | 331,300 | 291,758 | |||||||||
| Dilutive potential common shares (a) (b) |
1,867 | 2,562 | 2,894 | |||||||||
| Diluted weighted-average common shares outstanding (in thousands) |
345,847 | 333,862 | 294,652 | |||||||||
| Diluted earnings per common share |
$ | 2.44 | $ | 4.32 | $ | 8.71 | ||||||
| (a) Convertible preferred dividends in 2008 and 2007 totaled less than $.5 million |
||||||||||||
| (b) Excludes stock options considered to be anti-dilutive (in thousands) |
8,815 | 4,135 | 4,230 | |||||||||
| (c) Excludes warrants considered to be anti-dilutive (in thousands) |
19,410 | |||||||||||
Basic earnings per share is calculated using the two-class method to determine income attributable to common stockholders. The two-class method requires undistributed earnings for the period, which represents net income less common and participating security dividends (if applicable) declared or paid, to be allocated between the common and participating security stockholders based upon their respective rights to receive dividends. Participating securities include unvested restricted shares that contain nonforfeitable rights to dividends. Income attributable to common stockholders is then divided by the weighted-average common shares outstanding for the period.
Diluted earnings per common share takes into consideration common stock equivalents issuable pursuant to convertible preferred stock, convertible debentures, warrants, unexercised stock options and unvested shares/units. Diluted earnings per common shares is calculated under the more dilutive of either the treasury method or the two-class method.
129
NOTE 19 SHAREHOLDERS EQUITY
Preferred Stock
Information related to preferred stock is as follows:
| Preferred Shares | |||||||
| December 31 Shares in thousands |
Liquidation value per |
2008 | 2007 | ||||
| Authorized |
|||||||
| $1 par value |
16,960 | 16,985 | |||||
| Issued and outstanding |
|||||||
| Series A |
$ | 40 | 6 | 7 | |||
| Series B |
40 | 1 | 1 | ||||
| Series C |
20 | 119 | 128 | ||||
| Series D |
20 | 171 | 186 | ||||
| Series K |
10,000 | 50 | |||||
| Series L |
100,000 | 2 | |||||
| Series N |
100,000 | 76 | |||||
| Total issued and outstanding |
425 | 322 | |||||
On December 31, 2008, we issued $7.6 billion of Fixed Rate Cumulative Perpetual Preferred Stock, Series N, to the US Treasury under the US Treasurys Troubled Asset Relief Program (TARP) Capital Purchase Program, together with a warrant to purchase shares of common stock of PNC described below. Series N dividends are payable on the 15th of February, May, August and November beginning February 15, 2009. Dividends will be paid at a rate of 5.00% through February 15, 2014 and 9.00% thereafter. This preferred stock is redeemable at par plus accrued and unpaid dividends subject to the approval of our primary banking regulators.
130
Under the TARP Capital Purchase Program, there are restrictions on common and preferred dividends and common share repurchases associated with the preferred stock issued to the US Treasury. As is typical with cumulative preferred stock, dividend payments for this preferred stock must be current before dividends can be paid on junior shares, including our common stock, or junior shares can be repurchased or redeemed. Also, the US Treasurys consent is required for any increase in common dividends per share above the most recent level prior to October 14, 2008 until the third anniversary of the preferred stock issuance as long as the US Treasury continues to hold any of the preferred stock. Further, during that same period, the US Treasurys consent is required, unless the preferred stock is no longer held by the US Treasury, for any share repurchases with limited exceptions, most significantly purchases of common shares in connection with any benefit plan in the ordinary course of business consistent with past practice.
As part of the National City transaction, we issued 9.875% Fixed-to-Floating Rate Non-Cumulative Preferred Stock, Series L in exchange for National Citys Fixed-to-Floating Rate Non-Cumulative Preferred Stock, Series F. Dividends are payable if and when declared each 1st of February, May, August and November. Dividends will be paid at a rate of 9.875% prior to February 1, 2013 and at a rate of three-month LIBOR plus 633 basis points beginning February 1, 2013. The Series L is redeemable at PNCs option, subject to a replacement capital covenant for the first ten years after issuance and subject to Federal Reserve approval, if then applicable, on or after February 1, 2013 at a redemption price per share equal to the liquidation preference plus any declared but unpaid dividends.
Also as part of the National City transaction, we established the PNC Non-Cumulative Perpetual Preferred Stock, Series M, which mirrors in all material respects the former National City Non-Cumulative Perpetual Preferred Stock, Series E. PNC has designated 5,751 preferred shares, liquidation value $100,000 per share, for this series. No shares have yet been issued; however, National City issued stock purchase contracts for 5,001 shares of its Series E Preferred Stock (now replaced by the PNC Series M as part of the National City transaction) to the National City Preferred Capital Trust I in connection with the issuance by that Trust of $500 million of 12.000% Fixed-to-Floating Rate Normal Automatic Preferred Enhanced Capital Securities (the Normal APEX Securities) in January 2008 by the Trust. It is expected that the Trust will purchase 5,001 of the Series M preferred shares pursuant to these stock purchase contracts on December 10, 2012 or on an earlier date and possibly as late as December 10, 2013. The Trust has pledged the $500,100,000 principal amount of National City 8.729% Junior Subordinated Notes due 2043 held by the Trust and their proceeds to secure this purchase obligation.
If Series M shares are issued prior to December 10, 2012, any dividends on such shares will be calculated at a rate per annum equal to 12.000% until December 10, 2012, and thereafter, at a rate per annum that will be reset quarterly and will equal three-month LIBOR for the related dividend period plus 8.610%. Dividends will be payable if and when declared by the Board at the dividend rate so indicated applied to the liquidation preference per share of the Series M Preferred Stock. The Series M is redeemable at PNCs option, subject to a replacement capital covenant for the first ten years after issuance and subject to Federal Reserve approval, if then applicable, on or after December 10, 2012 at a redemption price per share equal to the liquidation preference plus any declared but unpaid dividends.
As a result of the National City transaction, we assumed National Citys obligations under replacement capital covenants with respect to (i) the Normal APEX Securities and our Series M shares and (ii) National Citys 6,000,000 of Depositary Shares (each representing 1/4000th of an interest in a share of our 9.875% Fixed-to-Floating Rate Non-Cumulative Preferred Stock, Series L), whereby we agreed not to cause the redemption or repurchase of the Normal APEX or Depositary Shares, as applicable, or the underlying Preferred Stock and/or junior subordinated notes, as applicable, unless such repurchases or redemptions are made from the proceeds of the issuance of certain qualified securities and pursuant to the other terms and conditions set forth in the replacement capital covenant with respect to the Normal APEX (the APEX RCC) or the replacement capital covenant with respect to the Depositary Shares (the Depositary Shares RCC), as applicable.
As of December 31, 2008, each of the APEX RCC and the Depositary Shares RCC are for the benefit of holders of our $700 million of 6.875% Subordinated Notes Due 2019.
In May 2008, we issued $500 million of Depositary Shares, each representing a fractional interest in a share of PNC Fixed-to-Floating Non-Cumulative Perpetual Preferred Stock, Series K. Dividends are payable if and when declared beginning November 21, 2008 and then each May 21 and November 21 until May 21, 2013. After that date, dividends will be payable each 21st of August, November, February and May. Dividends will be paid at a rate of 8.25% prior to May 21, 2013 and at a rate of three-month LIBOR plus 422 basis points beginning May 21, 2013.
Series A through D are cumulative and, except for Series B, are redeemable at our option. Annual dividends on Series A, B and D preferred stock total $1.80 per share and on Series C preferred stock total $1.60 per share. Holders of Series A through D preferred stock are entitled to a number of votes equal to the number of full shares of common stock into which such preferred stock is convertible. Series A through D preferred stock have the following conversion privileges: (i) one share of Series A or Series B is convertible into eight shares of PNC common stock; and (ii) 2.4 shares of Series C or Series D are convertible into four shares of PNC common stock.
131
TARP Warrant
A warrant issued to the US Treasury in connection with the preferred stock described above enables the US Treasury to purchase up to approximately 16.9 million shares of PNC common stock at an exercise price of $67.33 per share. However, if PNC receives aggregate gross proceeds of at least $7.6 billion from one or more qualified equity offerings on or before December 31, 2009, the number of shares of PNC common stock underlying the warrant then held by the US Treasury will be reduced by 50% of the number of shares originally underlying the warrant.
The warrant is immediately exercisable in full or in part, provided that the US Treasury may not transfer or exercise a portion of the warrant representing in the aggregate more than 50% of the shares underlying the warrant prior to the earlier of (i) December 31, 2009 and (ii) the date on which PNC has received aggregate gross proceeds of not less than 100% of the $7.6 billion preferred stock issue price from one or more qualified equity offerings. The warrant expires on December 31, 2018.
The TARP warrant was valued at $304 million at December 31, 2008 and is included in Capital surplus-common stock and other on our Consolidated Balance Sheet.
National City Warrants
As part of the National City transaction, warrants issued by National City converted into warrants to purchase PNC common stock. The holder has the option to exercise 28,022 warrants, on a daily basis, commencing June 15, 2011 and ending on July 15, 2011, and 28,023 warrants, on a daily basis, commencing July 18, 2011 and ending on October 20, 2011. The strike price of these warrants is $750 per share. Upon exercise, PNC will deliver common shares with a market value equal to the number of warrants exercised multiplied by the excess of the market price of PNC common stock over the strike price. The maximum number of shares that could be required to be issued is approximately 5.0 million, subject to adjustment in the case of certain events, make-whole fundamental changes or early termination. PNC has reserved 5.0 million shares for issuance pursuant to the warrants and 3.6 million shares for issuance pursuant to the related convertible senior notes.
Other Shareholders Equity Matters
We have a dividend reinvestment and stock purchase plan. Holders of preferred stock and PNC common stock may participate in the plan, which provides that additional shares of common stock may be purchased at market value with reinvested dividends and voluntary cash payments. Common shares issued pursuant to this plan were: 716,819 shares in 2008, 571,271 shares in 2007 and 535,394 shares in 2006.
At December 31, 2008, we had reserved approximately 94.7 million common shares to be issued in connection with certain stock plans and the conversion of certain debt and equity securities.
Effective October 4, 2007, our Board of Directors terminated the 2005 stock repurchase program and approved a new stock repurchase program to purchase up to 25 million shares of PNC common stock on the open market or in privately negotiated transactions. The 2007 program will remain in effect until fully utilized or until modified, superseded or terminated. We did not repurchase any shares during 2008 under the 2007 program. During 2007, we purchased 11 million common shares at a total cost of approximately $800 million under the 2005 and 2007 programs.
132
NOTE 20 OTHER COMPREHENSIVE INCOME
Details of other comprehensive income (loss) are as follows (in millions):
| Pretax | Tax | After-tax | ||||||||||
| Net unrealized securities gains (losses) |
||||||||||||
| Balance at January 1, 2006 |
$ | (240 | ) | |||||||||
| 2006 activity |
||||||||||||
| Increase in net unrealized gain for securities held at year-end |
$ | 129 | $ | (46 | ) | 83 | ||||||
| Less: net losses realized in net income (a) |
(101 | ) | 35 | (66 | ) | |||||||
| Net unrealized securities gains |
230 | (81 | ) | 149 | ||||||||
| Balance at December 31, 2006 |
(91 | ) | ||||||||||
| 2007 activity |
||||||||||||
| Increase in net unrealized losses for securities held at year-end |
(134 | ) | 52 | (82 | ) | |||||||
| Less: net losses realized in net income (a) |
(9 | ) | 3 | (6 | ) | |||||||
| Net unrealized securities losses |
(125 | ) | 49 | (76 | ) | |||||||
| Balance at December 31, 2007 |
(167 | ) | ||||||||||
| 2008 activity |
||||||||||||
| Increase in net unrealized losses for securities held at year-end |
(5,423 | ) | 1,992 | (3,431 | ) | |||||||
| Less: net gains realized in net income (a) |
44 | (16 | ) | 28 | ||||||||
| Net unrealized securities losses |
(5,467 | ) | 2,008 | (3,459 | ) | |||||||
| Balance at December 31, 2008 |
$ | (3,626 | ) | |||||||||
| (a) | Pretax amounts represent net unrealized gains (losses) as of the prior year-end date that were realized in the subsequent year when the related securities were sold. These amounts differ from net securities losses included in the Consolidated Income Statement primarily because they do not include gains or losses realized on securities that were purchased and then sold during the same year. |
| Pretax | Tax | After-tax | ||||||||||
| Net unrealized gains (losses) on cash flow hedge derivatives |
||||||||||||
| Balance at January 1, 2006 |
$ | (26 | ) | |||||||||
| 2006 activity |
||||||||||||
| Increase in net unrealized gains on cash flow hedge derivatives |
$ | 13 | $ | (5 | ) | 8 | ||||||
| Less: net gains realized in net income |
(7 | ) | 2 | (5 | ) | |||||||
| Net unrealized gains on cash flow hedge derivatives |
20 | (7 | ) | 13 | ||||||||
| Balance at December 31, 2006 |
(13 | ) | ||||||||||
| 2007 activity |
||||||||||||
| Increase in net unrealized gains on cash flow hedge derivatives |
283 | (104 | ) | 179 | ||||||||
| Less: net gains realized in net income |
(14 | ) | 5 | (9 | ) | |||||||
| Net unrealized gains on cash flow hedge derivatives |
297 | (109 | ) | 188 | ||||||||
| Balance at December 31, 2007 |
175 | |||||||||||
| 2008 activity |
||||||||||||
| Increase in net unrealized gains on cash flow hedge derivatives |
344 | (127 | ) | 217 | ||||||||
| Less: net gains realized in net income |
29 | (11 | ) | 18 | ||||||||
| Net unrealized gains on cash flow hedge derivatives |
315 | (116 | ) | 199 | ||||||||
| Balance at December 31, 2008 |
$ | 374 | ||||||||||
133
|
Pretax
|
Tax
|
After-tax
|
||||||||||||
| Pension, other postretirement and postemployment benefit plan adjustments |
||||||||||||||
| Balance at January 1, 2006 |
$ | (15 | ) | |||||||||||
| 2006 Activity |
||||||||||||||
| SFAS 87 adjustment |
$ | (2 | ) | $ | 1 | (1 | ) | |||||||
| SFAS 158 adjustment, net |
(203 | ) | 71 | (132 | ) | |||||||||
| Total 2006 activity |
(205 | ) | 72 | (133 | ) | |||||||||
| Balance at December 31, 2006 |
(148 | ) | ||||||||||||
| 2007 Activity |
(49 | ) | 20 | (29 | ) | |||||||||
| Balance at December 31, 2007 |
(177 | ) | ||||||||||||
| 2008 Activity |
(775 | ) | 285 | (490 | ) | |||||||||
| Balance at December 31, 2008 |
$ | (667 | ) | |||||||||||
| Other (b) |
||||||||||||||
| Balance at January 1, 2006 |
$ | 14 | ||||||||||||
| 2006 Activity |
$ | 6 | $ | (3 | ) | 3 | ||||||||
| Balance at December 31, 2006 |
17 | |||||||||||||
| 2007 Activity |
24 | (19 | ) | 5 | ||||||||||
| Balance at December 31, 2007 |
22 | |||||||||||||
| 2008 Activity |
||||||||||||||
| Foreign currency translation adj. |
(129 | ) | 46 | (83 | ) | |||||||||
| BlackRock deferred tax adj. |
31 | 31 | ||||||||||||
| Total 2008 activity |
(129 | ) | 77 | (52 | ) | |||||||||
| Balance at December 31, 2008 |
$ | (30 | ) | |||||||||||
| (b) | Consists of foreign currency translation adjustments, deferred tax adjustments on BlackRocks other comprehensive income (2008 and 2007), and interest-only strip valuation adjustments (2007 and 2006). |
The accumulated balances related to each component of other comprehensive income (loss) are as follows:
| December 31 in millions | 2008 | 2007 | ||||||
| Net unrealized securities gains (losses) |
$ | (3,626 | ) | $ | (167 | ) | ||
| Net unrealized gains on cash flow hedge derivatives |
374 | 175 | ||||||
| Pension, other postretirement and post employment benefit plan adjustments |
(667 | ) | (177 | ) | ||||
| Other |
(30 | ) | 22 | |||||
| Accumulated other comprehensive (loss) |
$ | (3,949 | ) | $ | (147 | ) | ||
NOTE 21 INCOME TAXES
The components of income taxes are as follows:
| Year ended December 31 In millions |
2008 | 2007 | 2006 | |||||||
| Current |
||||||||||
| Federal |
$ | 553 | $ | 491 | $ | 565 | ||||
| State |
69 | 58 | 46 | |||||||
| Total current |
622 | 549 | 611 | |||||||
| Deferred |
||||||||||
| Federal |
(235 | ) | 61 | 752 | ||||||
| State |
(26 | ) | 17 | |||||||
| Total deferred |
(261 | ) | 78 | 752 | ||||||
| Total |
$ | 361 | $ | 627 | $ | 1,363 | ||||
134
Significant components of deferred tax assets and liabilities are as follows:
| December 31 - in millions | 2008 | 2007 | |||||
| Deferred tax assets |
|||||||
| Allowance for loan and lease losses |
$ | 1,564 | $ | 370 | |||
| Net unrealized securities losses |
2,121 | 90 | |||||
| Compensation and benefits |
813 | 322 | |||||
| Unrealized losses on loans |
1,825 | ||||||
| Other |
1,918 | 370 | |||||
| Total deferred tax assets |
8,241 | 1,152 | |||||
| Deferred tax liabilities |
|||||||
| Leasing |
1,292 | 1,011 | |||||
| Goodwill and Intangibles |
636 | 255 | |||||
| Mortgage servicing rights |
332 | ||||||
| BlackRock basis difference |
1,265 | 1,234 | |||||
| Other |
968 | 184 | |||||
| Total deferred tax liabilities |
4,493 | 2,684 | |||||
| Net deferred asset (liability) |
$ | 3,748 | $ | (1,532 | ) | ||
A reconciliation between the statutory and effective tax rates follows:
| Year ended December 31 | 2008 | 2007 | 2006 | ||||||
| Statutory tax rate |
35.0 | % | 35.0 | % | 35.0 | % | |||
| Increases (decreases) resulting from |
|||||||||
| State taxes |
2.4 | 2.3 | .8 | ||||||
| Tax-exempt interest |
(1.7 | ) | (.8 | ) | (.3 | ) | |||
| Life insurance |
(2.3 | ) | (1.7 | ) | (.6 | ) | |||
| Dividend received deduction |
(3.1 | ) | (1.6 | ) | (.2 | ) | |||
| Tax credits |
(4.2 | ) | (2.9 | ) | (.9 | ) | |||
| Tax gain on sale of Hilliard Lyons |
4.1 | ||||||||
| Other |
(1.9 | ) | (.7 | ) | .6 | ||||
| Effective tax rate |
28.3 | % | 29.6 | % | 34.4 | % |
At December 31, 2008 we had available $124 million of federal and $1.7 billion of state income tax net operating loss carryforward originating from acquired companies and $33 million in other state net operating loss carryforwards. A $23 million valuation allowance is recorded against the deferred tax asset associated with the $1.7 billion of state income tax net operating losses. The net operating loss carryforwards will expire from 2009 through 2028.
At December 31, 2008 we had available $119 million of federal and $4 million of state tax credit carryforwards originating from acquired companies. The tax credit carryforwards will expire from 2026 through 2028.
No deferred US income taxes have been provided on certain undistributed earnings of non-US subsidiaries, which amounted to $59 million at December 31, 2008. As of December 31, 2008, these earnings are considered to be reinvested for an indefinite period of time. It is not practicable to determine the deferred tax liability on these earnings.
Retained earnings at December 31, 2008 included $117 million in allocations for bad debt deductions of former thrift subsidiaries for which no income tax has been provided. Under current law, if certain subsidiaries use these bad debt reserves for purposes other than to absorb bad debt losses, they will be subject to Federal income tax at the current corporate tax rate.
135
As of December 31, 2008 and 2007, we had a liability for uncertain tax positions, excluding interest and penalties of $257 million and $57 million, respectively. A reconciliation of the beginning and ending balance of unrecognized tax benefits is as follows:
| Changes in Unrecognized Tax Benefits (in millions): |
2008 | 2007 | ||||||
| Balance of gross unrecognized tax benefits at January 1 |
$ | 57 | $ | 49 | ||||
| Increases: |
||||||||
| Positions taken during a prior period |
203 | (a) | 52 | (b) | ||||
| Positions taken during the current period |
1 | |||||||
| Decreases: |
||||||||
| Positions taken during a prior period |
(3 | ) | (2 | ) | ||||
| Settlements with taxing authorities |
(39 | ) | ||||||
| Reductions resulting from lapse of statute of limitations |
(4 | ) | ||||||
| Balance of gross unrecognized tax benefits at December 31 |
$ | 257 | $ | 57 | ||||
| (a) | Includes $202 million acquired from National City. |
| (b) | Includes $42 million acquired from Mercantile. |
| December 31, 2008 - in millions | |||
| Unrecognized tax benefits related to: |
|||
| Acquired companies within measurement period: |
|||
| Temporary differences |
$ | 39 | |
| Permanent differences |
163 | ||
| Other: |
|||
| Temporary differences |
12 | ||
| Permanent differences |
43 | ||
| Total |
$ | 257 | |
Under SFAS 141(R) which became effective January 1, 2009, any changes after the measurement period (a maximum of twelve months from date of acquisition) to unrecognized tax benefits of acquired companies associated with permanent differences would result in an adjustment to income tax expense. If all the unrecognized tax benefits were recognized after the measurement period, $133 million would affect the effective tax rate. Certain changes within the measurement period would result in a purchase accounting adjustment associated with the particular acquisition.
Any changes in the amounts of unrecognized tax benefits related to temporary differences would result in a reclassification to deferred tax liability; any changes in the amounts of unrecognized tax benefits related to other permanent differences (per above table) would result in an adjustment to income tax expense and therefore our effective tax rate. The unrecognized tax benefits related to other permanent items above that if recognized would affect the effective tax rate is $30 million. This is less than the total amount of unrecognized tax benefit related to permanent differences because a portion of those unrecognized benefits relate to state tax matters.
It is reasonably possible that the liability for uncertain tax positions could increase or decrease in the next twelve months due to completion of tax authorities exams or the expiration of statutes of limitations. Management estimates that the liability for uncertain tax positions could decrease by $5 million within the next twelve months.
The consolidated federal income tax returns of The PNC Financial Services Group, Inc. and subsidiaries through 2003 have been audited by the Internal Revenue Service and we have resolved all disputed matters through the IRS appeals division. The Internal Revenue Service is currently examining the 2004 through 2006 consolidated federal income tax returns of The PNC Financial Services Group, Inc. and subsidiaries.
The consolidated federal income tax returns of National City Corporation and subsidiaries through 2004 have been audited by the Internal Revenue Service and we have reached agreement in principle on resolution of all disputed matters through the IRS appeals division. However, because the agreement is still subject to execution of a closing agreement we have not treated it as effectively settled. The Internal Revenue Service is currently examining the 2005 through 2007 consolidated federal income tax returns of National City Corporation and subsidiaries, and we expect the 2008 federal income tax return to begin being audited as soon as it is filed.
136
New York, New Jersey, Maryland and New York City are principally where we were subject to state and local income tax prior to our acquisition of National City. The state of New York is currently in the process of closing the 2002 to 2004 audit and will begin auditing the years 2005 and 2006. New York City is currently auditing 2004 and 2005. However, years 2002 and 2003 remain subject to examination by New York City pending completion of the New York state audit. Through 2006, BlackRock is included in our New York and New York City combined tax filings and constituted most of the tax liability. Years subsequent to 2004 remain subject to examination by New Jersey and years subsequent to 2005 remain subject to examination by Maryland.
National City was principally subject to state and local income tax in California, Florida, Illinois, Indiana, and Missouri. Audits currently in process for these states include: California (2003-2004), Illinois (2004-2006) and Missouri (2003-2005). We will now also be principally subject to tax in those states. In the ordinary course of business we are routinely subject to audit by the taxing authorities of these states and at any given time a number of audits will be in process.
Our policy is to classify interest and penalties associated with income taxes as income taxes. At January 1, 2008, we had accrued $91 million of interest related to tax positions, most of which related to our cross-border leasing transactions. The total accrued interest and penalties at December 31, 2008 was $164 million. While the leasing related interest decreased with a payment to the IRS, the $73 million net increase primarily resulted from our acquisition of National City.
NOTE 22 SUMMARIZED FINANCIAL INFORMATION OF BLACKROCK
As required by SEC Regulation S-X, summarized consolidated financial information of BlackRock follows (in millions).
| December 31 | 2008 | 2007 | |||||
| Total assets |
$ | 19,924 | $ | 22,561 | |||
| Total liabilities |
$ | 7,364 | $ | 10,382 | |||
| Non-controlling interests |
491 | 578 | |||||
| Stockholders equity |
12,069 | 11,601 | |||||
| Total liabilities, non-controlling interests and stockholders equity |
$ | 19,924 | $ | 22,561 | |||
| Year ended December 31 | 2008 | 2007 | |||||
| Total revenue |
$ | 5,064 | $ | 4,845 | |||
| Total expenses |
3,471 | 3,551 | |||||
| Operating income |
1,593 | 1,294 | |||||
| Non-operating income (expense) |
(577 | ) | 526 | ||||
| Income before income taxes |
1,016 | 1,820 | |||||
| Income tax expense |
387 | 463 | |||||
| Net Income |
629 | 1,357 | |||||
| Less: net income (loss) attributable to non-controlling interests |
(155 | ) | 364 | ||||
| Net income attributable to BlackRock |
$ | 784 | $ | 993 | |||
NOTE 23 REGULATORY MATTERS
We are subject to the regulations of certain federal and state agencies and undergo periodic examinations by such regulatory authorities.
The access to and cost of funding new business initiatives including acquisitions, the ability to pay dividends, the level of deposit insurance costs, and the level and nature of regulatory oversight depend, in large part, on a financial institutions capital strength. The minimum US regulatory capital ratios are 4% for tier 1 risk-based, 8% for total risk-based and 4% for leverage. However, regulators may require higher capital levels when particular circumstances warrant. To qualify as well capitalized, regulators require banks to maintain capital ratios of at least 6% for tier 1 risk-based, 10% for total risk-based and 5% for leverage. At December 31, 2008 and December 31, 2007, each of our domestic bank subsidiaries met the well capitalized capital ratio requirements.
137
The following table sets forth regulatory capital ratios for PNC and its significant bank subsidiaries, PNC Bank, N.A. and National City Bank.
Regulatory Capital
| Amount | Ratios | |||||||||||
| December 31 Dollars in millions | 2008 | 2007 | 2008 | 2007 | ||||||||
| Risk-based capital |
||||||||||||
| Tier 1 |
||||||||||||
| PNC |
$ | 24,287 | $ | 7,815 | 9.7 | % | 6.8 | % | ||||
| PNC Bank, N.A. |
8,338 | 7,851 | 7.1 | 7.6 | ||||||||
| National City Bank (a) |
12,567 | 10.1 | ||||||||||
| Total |
||||||||||||
| PNC |
33,116 | 11,803 | 13.2 | 10.3 | ||||||||
| PNC Bank, N.A. |
12,104 | 10,616 | 10.3 | 10.2 | ||||||||
| National City Bank (a) |
17,208 | 13.8 | ||||||||||
| Leverage |
||||||||||||
| PNC |
NM | NM | 17.5 | 6.2 | ||||||||
| PNC Bank, N.A. |
NM | NM | 6.3 | 6.8 | ||||||||
| National City Bank (a) |
NM | 8.8 | ||||||||||
| (a) | Acquired on December 31, 2008. |
NMNot meaningful.
The principal source of parent company cash flow is the dividends it receives from its subsidiary banks, which may be impacted by the following:
| | Capital needs, |
| | Laws and regulations, |
| | Corporate policies, |
| | Contractual restrictions, and |
| | Other factors. |
Also, there are statutory and regulatory limitations on the ability of national banks to pay dividends or make other capital distributions. The amount available for dividend payments to the parent company by PNC Bank, N.A. without prior regulatory approval was approximately $351 million at December 31, 2008. National City Bank had no statutory dividend capacity as of December 31, 2008.
Under federal law, bank subsidiaries generally may not extend credit to the parent company or its non-bank subsidiaries on terms and under circumstances that are not substantially the same as comparable extensions of credit to nonaffiliates. No extension of credit may be made to the parent company or a non-bank subsidiary which is in excess of 10% of the capital stock and surplus of such bank subsidiary or in excess of 20% of the capital and surplus of such bank subsidiary as to aggregate extensions of credit to the parent company and its non-bank subsidiaries. Such extensions of credit, with limited exceptions, must be fully collateralized by certain specified assets. In certain circumstances, federal regulatory authorities may impose more restrictive limitations.
Federal Reserve Board regulations require depository institutions to maintain cash reserves with the Federal Reserve Bank (FRB). At December 31, 2008, the balance outstanding at the FRB was $14 billion.
NOTE 24 LEGAL PROCEEDINGS
National City Matters
In December 2008, we completed the acquisition of National City through the merger of National City into The PNC Financial Services Group, Inc. As a result, we are now responsible for litigation pending against National City and its subsidiaries at that time. We will also be responsible for future litigation arising out of the conduct of the business of National City and its subsidiaries before the acquisition.
The lawsuits and other matters described below arise from National Citys business prior to the merger. We may be responsible for indemnifying individual defendants in these lawsuits and other matters.
See also National City Acquisition-Related Litigation below for information regarding litigation filed against PNC and National City relating to the merger and Regulatory and Governmental Inquiries for information regarding regulatory matters with respect to National City.
138
Visa. Beginning in June 2005, a series of antitrust lawsuits were filed against Visa®, MasterCard®, and several major financial institutions, including cases naming National City (since merged into PNC) and its subsidiary, National City Bank of Kentucky, since merged into National City Bank. The cases, which were brought as class actions on behalf of all persons or business entities who have accepted Visa® or MasterCard®, have been consolidated for pretrial proceedings in the United States District Court for the Eastern District of New York. The plaintiffs, merchants operating commercial businesses throughout the U.S. and trade associations, allege that the defendants conspired to fix the prices for general purpose card network services, resulting in the payment of inflated interchange fees, in violation of the antitrust laws. In January 2009, the plaintiffs filed amended and supplemental complaints adding, among other things, allegations that the restructuring of Visa and MasterCard, each of which included an initial public offering, violated the antitrust laws. The plaintiffs seek injunctive relief, actual and treble damages and attorneys fees. National City and National City Bank entered into judgment and loss sharing agreements with Visa and other financial institutions with respect to this litigation. On January 8, 2008, the district court dismissed plaintiffs claims for damages incurred prior to January 1, 2004. This litigation is also subject to the indemnification obligations described in Note 25 Commitments and Guarantees. PNC Bank, N.A. is not named a defendant in any of this litigation nor is it a party to the judgment or loss sharing agreements but is subject to these indemnification obligations.
Merrill Lynch. In December 2006, National City Bank completed the sale of its First Franklin nonprime mortgage origination and servicing platform to Merrill Lynch Bank & Trust Co., FSB. By letters dated April 10, 2008 and June 16, 2008, Merrill Lynch notified National City Bank of its indemnification claim pursuant to the purchase agreement. Merrill Lynch alleges that National City Bank breached certain representations or warranties contained in the purchase agreement related to Merrill Lynchs alleged repurchases of mortgage loans originated by First Franklin prior to its sale to Merrill Lynch as well as mortgage loans as to which it faces repurchase demands. Merrill Lynch also asserts that National City Bank is responsible for indemnifying it for certain settled or pending lawsuits against First Franklin.
ERISA Cases. Commencing in January 2008, a series of substantially similar lawsuits were brought against National City, the Administrative Committee of the National City Savings and Investment Plan (the Plan), National City Bank (as trustee), and some of National Citys officers and directors. These cases have been consolidated in the United States District Court for the Northern District of Ohio, and the plaintiffs have filed a consolidated amended complaint. The consolidated action is brought as a class action on behalf of all participants in or beneficiaries of the Plan at any time between September 5, 2006 and the present and whose Plan accounts included investments in National City common stock, as well as all participants in or beneficiaries of the Plan and whose accounts were invested in Allegiant Funds from March 25, 2002 to the present. The consolidated complaint alleges breaches of fiduciary duty under the Employee Retirement Income Security Act of 1974 (ERISA) relating to, among other things, National City stock being offered as an investment alternative in the Plan, conflicts of interest, and monitoring and disclosure obligations. The consolidated complaint also alleges that the Administrative Committee defendants breached their fiduciary duties under ERISA, engaged in prohibited transactions by authorizing or causing the Plan to invest in Allegiant Funds, and violated ERISA duties of loyalty by virtue of National Citys receipt of financial benefits in the forms of fees paid to Allegiant for managing the mutual funds. The complaint seeks equitable relief (including a declaration that defendants breached their ERISA fiduciary duties, an order compelling the defendants to make good any losses to the Plan caused by their actions, the imposition of a constructive trust on any profits earned by the defendants from their actions and restitution), unspecified money damages and attorneys fees and costs. A motion to dismiss the amended consolidated complaint is pending.
In February 2009, a lawsuit was filed in the United States District Court for the Northern District of Ohio against National City, National City Bank, the Administrative Committee of the National City Savings and Investment Plan, Harbor Federal Savings Bank, the Harbor Employees Stock Ownership Plan Committee and certain National City and Harbor directors and officers. This lawsuit was brought as a class action on behalf of all participants in or beneficiaries of the Harbor ESOP between December 1, 2006 and the present whose account in the Harbor ESOP held National City stock (including National City units), and who continued to be employed by National City through December 31, 2007. The complaint alleges breaches of fiduciary duties under ERISA relating to, among other things, National City stock being offered as an investment alternative, an alleged lock-up of National City stock, failure to pay benefits, conflicts of interest, and monitoring and disclosure obligations. The complaint seeks equitable relief (including a declaration that the defendants breached their ERISA fiduciary duties, an injunction prohibiting further breaches, an order compelling the defendants to make good any losses to the Plan caused by their actions, the imposition of a constructive trust on any profits earned by the defendants from their actions and restitution), unspecified money damages and attorneys fees and costs.
139
Derivative Cases. Commencing in January 2008, a series of shareholder derivative complaints were filed in the United States District Court for the Northern District of Ohio, the Chancery Court for the State of Delaware and the Cuyahoga County, Ohio, Court of Common Pleas against certain officers and directors of National City. Subsequently, the complaints filed in Delaware were voluntarily dismissed and the complaints filed in Ohio state court were consolidated and stayed pending resolution of the federal court cases. A consolidated complaint has been filed in the federal court, and there is a pending motion to dismiss that case. These suits make substantially similar allegations against certain officers and directors of National City for, among other things, breaches of fiduciary duty, waste of corporate assets, unjust enrichment and (in the federal court case) violations of the Securities Exchange Act of 1934, based on claims, among others, that National City issued inaccurate information to investors about the status of its business and prospects, and that the defendants caused National City to repurchase shares of its stock at artificially inflated prices. The complaints seek unspecified money damages and equitable relief (including restitution and certain corporate governance changes) against the individual defendants on behalf of National City, as well as attorneys fees and costs.
Securities and State Law Fiduciary Cases. Several lawsuits have been filed against National City and its officers and directors alleging misrepresentations and omissions in violation of the federal securities laws in connection with statements and disclosures relating in one or more cases to, among other things, the nature, quality, performance and risks of National Citys non-prime, construction and home equity portfolios, its loan loss reserves, its financial condition, and related allegedly false and misleading financial statements. Some of the lawsuits allege state common law violations. In some cases, the lawsuits were brought in an individual capacity, with the others brought as class actions. The relief sought generally includes unspecified damages, attorneys fees and expenses, and, where indicated below, equitable relief. The following is a summary of the significant lawsuits in this category:
| | In January 2008, a lawsuit was filed in the United States District Court for the Northern District of Ohio against National City and certain officers and directors of National City. As amended, this lawsuit is being brought as a class action on behalf of purchasers of National Citys stock during the period April 30, 2007 to April 21, 2008 and also on behalf of everyone who acquired National City stock pursuant to a registration statement filed in connection with its acquisition of MAF Bancorp in 2007. The complaint alleges violations of federal securities laws regarding public statements and disclosures. A motion to dismiss the complaint is pending. |
| | In April 2008, a lawsuit was filed in the Cuyahoga County, Ohio, Court of Common Pleas against National City, certain officers and directors of National City, and its auditor, Ernst & Young, LLP. The complaint was brought as a class action on behalf of all current and former National City employees who acquired stock pursuant to and/or traceable to a December 1, 2006 registration statement filed in connection with the acquisition of Harbor Federal Savings Bank and who were participants in the Harbor Bank Employees Stock Ownership Plan and the Harbor Bank Stock Incentive Plan. The plaintiffs allege that the registration statement contained false and misleading statements and omissions in violation of the federal securities laws. Defendants removed the case to the United States District Court for the Northern District of Ohio and filed a motion to dismiss the complaint. The federal court has subsequently remanded the case back to the Ohio state court. |
| | In May 2008, a lawsuit was filed on behalf of an individual plaintiff in the Franklin County, Ohio, Court of Common Pleas against National City, certain directors of National City, and Corsair Co-Invest, L.P. and unnamed other investors participating in the April 2008 capital infusion into National City alleging that National Citys directors breached their fiduciary duties by entering into this capital infusion transaction. In addition to monetary damages and attorneys fees and costs, the complaint seeks a declaratory judgment that the Corsair transaction is void and/or voidable and injunctive relief rescinding the Corsair transaction. A motion to dismiss the case is pending. |
| | In August 2008, a lawsuit was filed in the Palm Beach County, Florida, Circuit Court against National City and certain officers and directors of National City. The lawsuit was brought as a class action on behalf of all who acquired National City stock pursuant to and/or traceable to the registration statement filed in connection with National Citys acquisition of Fidelity Bankshares, Inc. The complaint alleges that the registration statement contained false and misleading statements and omissions in violation of the federal securities laws. This lawsuit was removed to federal court in Florida and then transferred to the United States District Court for the Northern District of Ohio. A motion to remand to state court is pending. |
| | In October 2008, a lawsuit was filed in the United States District Court for the Western District of Pennsylvania against National City. In December 2008, the complaint was amended to add as defendants Corsair Capital, LLC, Corsair NC Co-Invest, L.P. and unnamed other investors participating in the April 2008 capital infusion into National City. As amended, the lawsuit is brought as a class action on behalf of all shareholders of National City who owned shares as of October 24, 2008. The amended complaint alleges breaches of fiduciary duties in connection with the capital infusion and misstatements and omissions relating to the effect of the capital infusion, National Citys ability to participate in the TARP Capital Purchase Program, and National Citys capital position and financial stability in violation of the federal securities laws. This case was conditionally transferred to the United States District Court for the Northern District of Ohio. The plaintiffs have filed a motion to vacate this transfer. |
140
| | In December 2008, a lawsuit was filed in the United States District Court for the Northern District of Ohio against National City and some of its officers and directors. The plaintiff, an arbitrage fund, seeks to represent a class of all who purchased National Citys 4.0% Convertible Senior Notes Due 2011 pursuant to and/or traceable to the registration statement and prospectus supplement issued in connection with the January 2008 offering of these notes and all who purchased these notes in the open market between January 23 and September 30, 2008. The complaint alleges that the registration statement and prospectus supplement contained false and misleading statements and omissions in violation of the federal securities laws. |
National City Acquisition-Related Litigation
National City is a defendant in numerous lawsuits filed in and after October 2008 as class actions on behalf of National City stockholders. These lawsuits are pending in the Delaware Chancery Court (all of which were consolidated into a single lawsuit), the United States District Court for the Northern District of Ohio and the Cuyahoga County, Ohio, Court of Common Pleas. The consolidated Delaware case and most of the Ohio cases include PNC as a defendant. All of these lawsuits also name as defendants National Citys directors and one of the Ohio federal lawsuits names National City officers as defendants.
The complaints in these cases allege that the National City directors breached their fiduciary duties to the stockholders of National City in connection with the proposed transaction with PNC. The lawsuits generally allege that National City directors breached their fiduciary duties by, among other things, causing National City to enter into the proposed transaction at an allegedly inadequate and unfair price, engaging in self-dealing and acting with divided loyalties, and failing to disclose material information to the stockholders. Some lawsuits allege violations of the federal securities laws. In the cases naming PNC as a defendant, PNC is alleged to have aided and abetted the other defendants breaches of fiduciary duties. The various complaints seek, among other remedies, an accounting, imposition of a constructive trust, unspecified damages, rescission, costs of suit, and attorneys fees.
In addition, the plaintiffs in one of the pending derivative lawsuits against the National City directors in the Cuyahoga County Court of Common Pleas and in the pending derivative lawsuit in federal court in Ohio, each referred to above, have moved to amend their complaints to add merger-related claims, including claims that National Citys directors agreed to sell National City in order to extinguish their own personal liability in derivative litigation pending against them. PNC is not named as a defendant in either of these proposed amended complaints. In December 2008, the Ohio state court denied the plaintiffs motion to lift the stay and to conduct expedited discovery in support of the proposed amended complaint.
In December 2008, the defendants entered into a memorandum of understanding with the plaintiffs regarding the settlement of the Delaware lawsuit, as well as one of the cases pending in the Cuyahoga County, Ohio, Court of Common Pleas and the merger-related claims in the derivative case pending in the Ohio state court. In connection with the settlement contemplated by the memorandum of understanding, National City made additional disclosures related to the proposed merger. Following completion of confirmatory discovery by counsel to the plaintiffs, the parties entered into a stipulation of settlement on February 2, 2009. The stipulation of settlement is subject to customary conditions, including court approval following notice to National Citys stockholders. In February 2009, the Court of Chancery preliminarily approved a class of all persons who were National City common stockholders during the period from the close of business on October 23, 2008 through (and including) December 31, 2008. The Court of Chancery also preliminarily approved the settlement and has scheduled a hearing in May 2009 at which the court will consider the fairness, reasonableness, and adequacy of the settlement. If the settlement is finally approved by the court, it will resolve and release all claims in all actions that were or could have been brought challenging any aspect of the proposed merger, the merger agreement, and any disclosure made in connection therewith. In addition, in connection with the settlement, the parties contemplate that plaintiffs counsel will file a petition in the Court of Chancery for an award of attorneys fees and expenses to be paid by PNC.
Adelphia
Some of our subsidiaries are defendants (or have potential contractual contribution obligations to other defendants) in several pending lawsuits brought during late 2002 and 2003 arising out of the bankruptcy of Adelphia Communications Corporation and its subsidiaries.
One of the lawsuits was brought on Adelphias behalf by the unsecured creditors committee and equity committee in Adelphias consolidated bankruptcy proceeding and was removed to the United States District Court for the Southern District of New York by order dated February 9, 2006. Pursuant to Adelphias plan of reorganization, this lawsuit will be prosecuted by a contingent value vehicle, known as the Adelphia Recovery Trust. In October 2007, the Adelphia Recovery Trust filed an amended complaint in this lawsuit, adding defendants and making additional allegations.
141
In June 2008, the district court granted in part defendants motion to dismiss. The court dismissed the principal bankruptcy law claims that had not previously been dismissed by the Bankruptcy Court, including claims alleging voidable preference payments, fraudulent transfers, and equitable disallowance. The effect of this ruling is to dismiss from this lawsuit all claims against most of the defendants but leave pending against PNC and other original members of Adelphia loan syndicates and then-affiliated investment banks the other claims. In December 2008, the court granted a motion made on behalf of a number of defendants to enter final judgment on the dismissed claims to permit immediate appellate review of the issues resolved by the district court in June 2008 and by the bankruptcy court prior to the filing of the amended complaint. The district court has scheduled the case for trial in February 2010.
The other lawsuits were brought by holders of debt and equity securities of Adelphia and have been consolidated for pretrial purposes in the United States District Court for the Southern District of New York.
The pending lawsuits arise out of lending and investment banking activities engaged in by PNC subsidiaries and many other financial services companies. Collectively, with respect to some or all of the defendants, the lawsuits allege federal law claims (including violations of federal securities and banking laws), violations of common law duties, aiding and abetting such violations, voidable preference payments, and fraudulent transfers, among other matters. The lawsuits seek monetary damages (including in some cases punitive or treble damages), interest, attorneys fees and other expenses, and a return of the alleged voidable preference and fraudulent transfer payments, among other remedies.
Sterling Financial Corporation Matters
In April 2008, we completed the acquisition of Sterling through the merger of Sterling Financial Corporation into The PNC Financial Services Group, Inc. As a result, we are now responsible for litigation pending against Sterling and its subsidiaries at that time. We will also be responsible for future litigation arising out of the conduct of the business of Sterling and its subsidiaries before the acquisition.
All of the matters described below arise in connection with Sterlings commercial finance subsidiary, Equipment Finance LLC, which we refer to as EFI. We provide additional information regarding the EFI situation in our Registration Statement on Form S-4 relating to the merger.
See also Regulatory and Governmental Inquiries for information regarding regulatory matters with respect to Sterling and the EFI situation.
Several class action lawsuits were filed in May, June and July 2007 in the United States District Courts for the Eastern District of Pennsylvania and the Southern District of New York related to the EFI situation. In October 2007, the lawsuits filed in New York were transferred to the Pennsylvania court for coordinated pretrial proceedings. In February 2008, the plaintiffs filed a consolidated amended complaint on behalf of those who purchased Sterling common stock during the period from April 27, 2004 through May 24, 2007. This complaint names Sterling, Bank of Lancaster County, N.A. (a predecessor to a bank subsidiary of Sterling), EFI, and members of their management as defendants. The plaintiffs allege violations of the federal securities laws, including allegations that Sterlings public statements and filings fraudulently omitted information and included fraudulent misrepresentations about the improprieties at EFI as well as about their impact on Sterlings earnings and related matters. The plaintiffs assert that the price for Sterling stock was fraudulently inflated during the class period due to the alleged omissions and misrepresentations, and seek unspecified damages, interest, attorneys fees and costs. (As a result of our acquisition of Sterling, we may be responsible for indemnifying individual defendants in connection with this lawsuit.) We have a tentative agreement to settle this lawsuit, which is subject to customary conditions, including court approval following notice to the class. The amount of this settlement would not be material to PNC.
In addition, a group of shareholders who received Sterling common shares as consideration in Sterling acquisition transactions have brought a separate lawsuit asserting claims similar to those in the consolidated amended complaint. Our motion to dismiss this complaint is pending. Other shareholders who received Sterling shares in acquisitions have also threatened to file similar lawsuits.
CBNV Mortgage Litigation
Between 2001 and 2003, on behalf of either individual plaintiffs or a class of plaintiffs, several separate actions were filed in state and federal courts against Community Bank of Northern Virginia (CBNV) and other defendants challenging the validity of second mortgage loans the defendants made to the plaintiffs. CBNV was merged into one of Mercantiles banks prior to Mercantiles acquisition by PNC. These cases were either filed in, or removed to, the United States District Court for the Western District of Pennsylvania.
142
In August 2006, a proposed settlement agreement covering an action in which the plaintiffs and class members have second mortgages that were assigned to Residential Finance Corporation (RFC) was submitted to the district court for its approval. In January 2008, the district court conditionally certified a class for settlement purposes, preliminarily approved the proposed settlement agreement, and directed that the settlement agreement be submitted to the class members for their consideration. In August 2008, the district court entered an order giving final approval to the settlement agreement. Some objecting class members have appealed that order to the Third Circuit Court of Appeals. Separately, other individuals, whose loans were not acquired by RFC, have actions pending on behalf of themselves or a class alleging claims similar to those asserted in the settled action with respect to the RFC loans. In one of these actions, the alleged class overlaps the class in the settled action. These actions remain pending in the district court.
In January 2008, the district court also issued an order sending back to state court in North Carolina the claims of two class members. These two plaintiffs then sought to represent a class of North Carolina borrowers in state court, but the federal district court in Pennsylvania enjoined class proceedings in March 2008. In April 2008, the General Court of Justice, Superior Court Division, for Wake County, North Carolina granted these two plaintiffs motion for summary judgment on their individual claims in this case. We have appealed this order to the North Carolina Court of Appeals.
The plaintiffs in all of these lawsuits seek unquantified monetary damages, rescission of loans, interest, attorneys fees and other expenses.
BAE Derivative Litigation
In September 2007, a derivative lawsuit was filed on behalf of BAE Systems plc by a holder of its American Depositary Receipts against current and former directors and officers of BAE, Prince Bandar bin Sultan, PNC (as successor to Riggs National Corporation and Riggs Bank, N.A.), Joseph L. Allbritton, Robert L. Allbritton, and Barbara Allbritton. The complaint alleges that BAE directors and officers breached their fiduciary duties by making or permitting to be made improper or illegal bribes, kickbacks and other payments with respect to a military contract obtained in the mid-1980s from the Saudi Arabian Ministry of Defense, and that Prince Bandar was the primary recipient or beneficiary of these payments. The complaint also alleges that Riggs, together with the Allbrittons (as former directors, officers and controlling persons of Riggs), acted as the primary intermediaries through which the payments were laundered and actively concealed, and aided and abetted the BAE defendants breaches of fiduciary duties. In September 2008, the United States District Court for the District of Columbia granted the motions of all defendants to dismiss the plaintiffs complaint. Plaintiff has appealed to the United States Court of Appeals for the District of Columbia Circuit. As it relates to PNC, plaintiff is seeking unquantified monetary damages (including punitive damages), an accounting, interest, attorneys fees and other expenses. As a result of our acquisition of Riggs, PNC may be responsible for indemnifying the Allbrittons in connection with this lawsuit.
Regulatory and Governmental Inquiries
As a result of the regulated nature of our business and that of a number of our subsidiaries, particularly in the banking and securities areas, we and our subsidiaries are the subject of investigations and other forms of regulatory inquiry, in some cases as part of regulatory reviews of specified activities at multiple industry participants. Among the areas in which there is currently significant regulatory interest are practices in the mutual fund and mortgage lending businesses. Several of our subsidiaries have received requests for information and other inquiries from governmental and regulatory authorities in these areas.
In June 2008, National City was notified that the Chicago Regional Office of the SEC is conducting an informal investigation of National City. The SEC has requested that National City provide the SEC with documents concerning, among other things, its loan underwriting experience, allowance for loan losses, marketing practices, dividends, bank regulatory matters and the sale of First Franklin Financial Corporation.
The SEC is conducting a non-public investigation into the EFI situation at Sterling. The United States Attorneys Office for the Eastern District of Pennsylvania is also investigating the EFI situation.
Our practice is to cooperate fully with regulatory and governmental investigations, audits and other inquiries, including those described above. Such investigations, audits and other inquiries may lead to remedies such as fines, restitution or alterations in our business practices.
Other
In addition to the proceedings or other matters described above, PNC and persons to whom we may have indemnification obligations, in the normal course of business, are subject to various other pending and threatened legal proceedings in which claims for monetary damages and other relief are asserted. We do not anticipate, at the present time, that the ultimate aggregate liability, if any, arising out of such other legal proceedings will have a material adverse effect on our financial position. However, we cannot now determine whether or not any claims asserted against us or others to whom we may have indemnification obligations, whether in the proceedings or other matters specifically described above or otherwise, will have a material adverse effect on our results of operations in any future reporting period.
143
See Note 25 Commitments and Guarantees for additional information regarding the Visa indemnification and our obligation to provide indemnification to current and former officers, directors, employees and agents of PNC and companies we have acquired, including National City.
NOTE 25 COMMITMENTS AND GUARANTEES
EQUITY FUNDING AND OTHER COMMITMENTS
Our unfunded commitments at December 31, 2008 included private equity investments of $540 million and other investments of $178 million.
STANDBY LETTERS OF CREDIT
We issue standby letters of credit and have risk participations in standby letters of credit and bankers acceptances issued by other financial institutions, in each case to support obligations of our customers to third parties, such as remarketing programs for customers variable rate demand notes. Net outstanding standby letters of credit totaled $10.3 billion at December 31, 2008.
If the customer fails to meet its financial or performance obligation to the third party under the terms of the contract or there is a need to support a remarketing program, then upon the request of the guaranteed party, we would be obligated to make payment to them. The standby letters of credit and risk participations in standby letters of credit and bankers acceptances outstanding on December 31, 2008 had terms ranging from less than one year to 14 years. The aggregate maximum amount of future payments PNC could be required to make under outstanding standby letters of credit and risk participations in standby letters of credit and bankers acceptances was $13.7 billion at December 31, 2008, of which $5.1 billion support remarketing programs.
Assets valued as of December 31, 2008 of approximately $.9 billion secured certain specifically identified standby letters of credit. Approximately $3.4 billion in recourse provisions from third parties was also available for this purpose as of December 31, 2008. In addition, a portion of the remaining standby letters of credit and letter of credit risk participations issued on behalf of specific customers is also secured by collateral or guarantees that secure the customers other obligations to us. The carrying amount of the liability for our obligations related to standby letters of credit and risk participations in standby letters of credit and bankers acceptances was $119 million at December 31, 2008.
STANDBY BOND PURCHASE AGREEMENTS AND OTHER LIQUIDITY FACILITIES
We enter into standby bond purchase agreements to support municipal bond obligations. At December 31, 2008, the aggregate of our commitments under these facilities was $452 million. We also enter into certain other liquidity facilities to support individual pools of receivables acquired by commercial paper conduits including Market Street. At December 31, 2008, our total commitments under these facilities were $6.6 billion, of which $6.4 billion was related to Market Street.
INDEMNIFICATIONS
We are a party to numerous acquisition or divestiture agreements under which we have purchased or sold, or agreed to purchase or sell, various types of assets. These agreements can cover the purchase or sale of:
| | Entire businesses, |
| | Loan portfolios, |
| | Branch banks, |
| | Partial interests in companies, or |
| | Other types of assets. |
These agreements generally include indemnification provisions under which we indemnify the third parties to these agreements against a variety of risks to the indemnified parties as a result of the transaction in question. When PNC is the seller, the indemnification provisions will generally also provide the buyer with protection relating to the quality of the assets we are selling and the extent of any liabilities being assumed by the buyer. Due to the nature of these indemnification provisions, we cannot quantify the total potential exposure to us resulting from them.
We provide indemnification in connection with securities offering transactions in which we are involved. When we are the issuer of the securities, we provide indemnification to the underwriters or placement agents analogous to the indemnification provided to the purchasers of businesses from us, as described above. When we are an underwriter or placement agent, we provide a limited indemnification to the issuer related to our actions in connection with the offering and, if there are other underwriters, indemnification to the other underwriters intended to result in an appropriate sharing of the risk of participating in the offering. Due to the nature of these indemnification provisions, we cannot quantify the total potential exposure to us resulting from them.
We enter into certain types of agreements that include provisions for indemnifying third parties, such as:
| | Agreements relating to providing various servicing and processing functions to third parties, |
| | Agreements relating to the creation of trusts or other legal entities to facilitate leasing transactions, commercial and residential mortgage-backed securities transactions (loan securitizations) and certain other off-balance sheet transactions, |
| | Confidentiality agreements, |
| | Syndicated credit agreements, as a syndicate member, |
144
| | Sales of individual loans and equipment leases, |
| | Arrangements with brokers to facilitate the hedging of derivative and convertible arbitrage activities, and |
| | Litigation settlement agreements. |
Due to the nature of these indemnification provisions, we cannot calculate our aggregate potential exposure under them.
We enter into certain types of agreements, including leases, assignments of leases, and subleases, in which we agree to indemnify third parties for acts by our agents, assignees and/or sublessees, and employees. Due to the nature of these indemnification provisions, we cannot calculate our aggregate potential exposure under them.
We enter into contracts for the delivery of technology service in which we indemnify the other party against claims of patent and copyright infringement by third parties. Due to the nature of these indemnification provisions, we cannot calculate our aggregate potential exposure under this type of indemnification.
We engage in certain insurance activities which require our employees to be bonded. We satisfy this bonding requirement by issuing letters of credit which were insignificant at December 31, 2008.
In the ordinary course of business, we enter into contracts with third parties under which the third parties provide services on behalf of PNC. In many of these contracts, we agree to indemnify the third party service provider under certain circumstances. The terms of the indemnity vary from contract to contract and the amount of the indemnification liability, if any, cannot be determined.
We are a general or limited partner in certain asset management and investment limited partnerships, many of which contain indemnification provisions that would require us to make payments in excess of our remaining funding commitments. While in certain of these partnerships the maximum liability to us is limited to the sum of our unfunded commitments and partnership distributions received by us, in the others the indemnification liability is unlimited. As a result, we cannot determine our aggregate potential exposure for these indemnifications.
Pursuant to their bylaws, PNC and its subsidiaries provide indemnification to directors, officers and, in some cases, employees and agents against certain liabilities incurred as a result of their service on behalf of or at the request of PNC and its subsidiaries. PNC and its subsidiaries also advance on behalf of covered individuals costs incurred in connection with certain claims or proceedings, subject to written undertakings by each such individual to repay all amounts advanced if it is ultimately determined that the individual is not entitled to indemnification. We generally are responsible for similar indemnifications and advancement obligations that companies we acquire (including Riggs, Sterling and National City), had to their officers, directors and sometimes employees and agents at the time of acquisition. We advanced such costs on behalf of several such individuals (including some from Riggs and Sterling) with respect to pending litigation or investigations during 2008. It is not possible for us to determine the aggregate potential exposure resulting from the obligation to provide this indemnity or to advance such costs.
In connection with the lending of securities facilitated by Global Investment Servicing as an intermediary on behalf of certain of its clients, we provide indemnification to those clients against the failure of the borrowers to return the securities. The market value of the securities lent is fully secured on a daily basis; therefore, the exposure to us is limited to temporary shortfalls in the collateral as a result of short-term fluctuations in trading prices of the loaned securities. At December 31, 2008, the total maximum potential exposure as a result of these indemnity obligations was $7.9 billion, although the collateral at the time exceeded that amount.
VISA INDEMNIFICATION
Our payment services business issues and acquires credit and debit card transactions through Visa U.S.A. Inc. card association or its affiliates (Visa).
In October 2007 Visa completed a restructuring and issued shares of Visa Inc. common stock to its financial institution members (Visa Reorganization) in contemplation of its initial public offering (IPO). As part of the Visa Reorganization, we received our proportionate share of a class of Visa Inc. common stock allocated to the US members. Prior to the IPO, the US members were obligated to indemnify Visa for judgments and settlements related to specified litigation. In accordance with GAAP, during the fourth quarter of 2007 we recorded a liability and pretax operating expense of $82 million representing our estimate of the fair value of our indemnification obligation for potential losses arising from this litigation.
Visas IPO occurred in March 2008. Visa redeemed 2.2 million of our investment in Visa Class B common shares for cash out of the proceeds of the IPO. Accordingly, we recognized a pretax gain of $95 million during the first quarter of 2008 in other noninterest income in connection with this redemption. In addition, Visa set aside $3 billion of the IPO proceeds in an escrow account for the benefit of the US member financial institutions to fund the expenses of the litigation as well as the members proportionate share of any judgments or settlements that may arise out of the litigation. Therefore, we reduced our indemnification liability proportionately based upon the escrowed amount via a credit to noninterest expense of $43 million pretax during the first quarter of 2008.
In October 2008, Visa reached a settlement with Discover Financial Services related to another of the specified litigation. As a result, we recorded an incremental indemnification liability of $13 million.
145
Based on the cumulative impact of this settlement and previous settlements, Visa determined that additional escrow funds were necessary and set aside an additional $1.1 billion in cash for the remaining specified litigation cases in the fourth quarter 2008. In connection with Visas cash allocation to the escrow fund, Visa reduced the Visa B common share to Visa A common share conversion ratio from approximately 71% to 63%. We determined that these actions effectively settled a proportionate share of our estimated indemnification liability for the remaining specified litigation. As a result, we reduced our indemnification liability by $16 million with a corresponding credit to noninterest expense.
As a result of the acquisition of National City, we became party to judgment and loss sharing agreements with Visa and certain other banks. The judgment and loss sharing agreements were designed to apportion financial responsibilities arising from any potential adverse judgment or negotiated settlements related to the specified litigation. The acquisition of National City resulted in the recognition of an additional indemnification liability of $224 million. As a result of the indemnification provision in Section 2.05j of the Visa By-Laws and/or the indemnification provided through the judgment and loss sharing agreements, PNCs Visa indemnification liability at December 31, 2008 totaled $260 million.
RECOURSE AGREEMENTS
We are authorized to originate, underwrite, close to fund and service commercial mortgage loans and then sell them to FNMA under FNMAs DUS program. We have similar arrangements with FHLMC.
Under these programs, we generally assume up to one-third of the risk of loss on unpaid principal balances through a loss share arrangement. At December 31, 2008, the potential exposure to loss was $5.7 billion. Accordingly, we maintain a reserve for such potential losses which approximates the fair value of this exposure. At December 31, 2008, the unpaid principal balance outstanding of loans sold as a participant in these programs was $18.6 billion. The fair value of the loss share arrangement in the form of reserves for losses under these programs, totaled $79 million as of December 31, 2008 and is included in other liabilities on our Consolidated Balance Sheet. If payment is required under these programs, we would not have a contractual interest in the collateral underlying the mortgage loans on which losses occurred, although the value of the collateral is taken into account in determining our share of such losses. The serviced loans are not included on our Consolidated Balance Sheet.
National City sold residential mortgage loans and home equity lines of credit (collectively, loans) in the normal course of business. These agreements usually require certain representations concerning credit information, loan documentation, collateral, and insurability. On a regular basis, investors may request PNC to indemnify them against losses on certain loans or to repurchase loans which the investors believe do not comply with applicable representations. Upon completion of its own investigation as to the validity of the claim, PNC will repurchase or provide indemnification on such loans. Indemnification requests are generally received within two years subsequent to the date of sale.
Management maintains a liability for estimated losses on loans expected to be repurchased, or on which indemnification is expected to be provided, and regularly evaluates the adequacy of this recourse liability based on trends in repurchase and indemnification requests, actual loss experience, known and inherent risks in the loans, and current economic conditions. At December 31, 2008 the liability for estimated losses on repurchase and indemnification claims was $406 million.
OTHER GUARANTEES
We write caps and floors for customers, risk management and proprietary trading purposes. At December 31, 2008, the fair value of the written caps and floors liability on our Consolidated Balance Sheet was $12 million. Our ultimate obligation under written options is based on future market conditions and is only quantifiable at settlement. We manage our market risk exposure from customer positions through transactions with third-party dealers.
146
CREDIT DEFAULT SWAPS
| December 31, 2008 Dollars in millions |
Notional amount |
Estimated net fair value |
Weighted- Average Remaining Maturity In Years |
||||||
| Credit Default Swaps Guarantees |
|||||||||
| Single name |
$ | 278 | $ | (38 | ) | 3.84 | |||
| Index traded |
677 | (42 | ) | 4.84 | |||||
| Total (a) |
$ | 955 | $ | (80 | ) | 4.54 | |||
| Credit Default Swaps Beneficiaries |
|||||||||
| Single name |
$ | 974 | $ | 84 | 3.82 | ||||
| Index traded |
1,008 | 201 | 31.82 | ||||||
| Total (b) |
$ | 1,982 | $ | 285 | 18.06 | ||||
| Total (c) |
$ | 2,937 | $ | 205 | 13.67 | ||||
| (a) | Includes $883 million of investment grade credit default swaps with a rating of Baa3 or above and $72 million of subinvestment grade based on published rating agency information. |
| (b) | Includes $1.7 billion of investment grade credit default swaps with a rating of Baa3 or above and $263 million of subinvestment grade based on published rating agency information. |
| (c) | The referenced/underlying assets for these credit default swaps is approximately 70% corporate debt, 27% commercial mortgage backed securities and 3% related to loans. |
We enter into credit default swaps under which we buy loss protection from or sell loss protection to a counterparty for the occurrence of a credit event of a reference entity. The fair value of the contracts sold on our Consolidated Balance Sheet was a net liability of $80 million at December 31, 2008. The maximum amount we would be required to pay under the credit default swaps in which we sold protection, assuming all reference obligations experience a credit event at a total loss, without recoveries, was $955 million at December 31, 2008.
We have also entered into various contingent performance guarantees through credit risk participation arrangements with terms ranging from less than one year to 23 years. As of December 31, 2008 the notional amount of risk participations agreements was $1.9 billion with a weighted-average remaining maturity of 3 years. The fair value of these agreements on our Consolidated Balance Sheet was a net liability of $3 million. Based on the Corporations internal risk rating process, 98% of the notional amount of the risk participations agreements outstanding had underlying swap counterparties with internal credit ratings of pass, indicating the expected risk of loss is currently low, while 2% had underlying swap counterparties with internal risk ratings below pass, indicating a higher degree of risk of default. We will be required to make payments under these guarantees if a customer defaults on its obligation to perform under certain credit agreements with third parties. Assuming all underlying swap counterparties defaulted, the maximum potential exposure from these agreements as of December 31, 2008 would be $128 million based on the fair value of the underlying swaps.
CONTINGENT PAYMENTS IN CONNECTION WITH CERTAIN ACQUISITIONS
A number of the acquisition agreements to which we are a party and under which we have purchased various types of assets, including the purchase of entire businesses, partial interests in companies, or other types of assets, require us to make additional payments in future years if certain predetermined goals are achieved or not achieved within a specific time period. Due to the nature of the contract provisions, we cannot quantify our total exposure that may result from these agreements.
147
NOTE 26 PARENT COMPANY
Summarized financial information of the parent company is as follows:
Income Statement
| Year ended December 31 - in millions | 2008 | 2007 | 2006 | |||||||||
| OPERATING REVENUE |
||||||||||||
| Dividends from: |
||||||||||||
| Bank subsidiaries and bank holding company |
$ | 1,012 | $ | 1,078 | $ | 710 | ||||||
| Non-bank subsidiaries |
168 | 74 | 69 | |||||||||
| Interest income |
4 | 15 | 16 | |||||||||
| Noninterest income |
18 | 23 | 9 | |||||||||
| Total operating revenue |
1,202 | 1,190 | 804 | |||||||||
| OPERATING EXPENSE |
||||||||||||
| Interest expense |
152 | 160 | 93 | |||||||||
| Other expense |
46 | 84 | 46 | |||||||||
| Total operating expense |
198 | 244 | 139 | |||||||||
| Income before income taxes and equity in undistributed net income of subsidiaries |
1,004 | 946 | 665 | |||||||||
| Income tax benefits |
(50 | ) | (78 | ) | (60 | ) | ||||||
| Income before equity in undistributed net income of subsidiaries |
1,054 | 1,024 | 725 | |||||||||
| Equity in undistributed net income of subsidiaries: |
||||||||||||
| Bank subsidiaries and bank holding company |
(125 | ) | 229 | 1,653 | ||||||||
| Non-bank subsidiaries |
(47 | ) | 214 | 217 | ||||||||
| Net income |
$ | 882 | $ | 1,467 | $ | 2,595 | ||||||
Balance Sheet
| December 31 - in millions | 2008 (a) | 2007 | ||||
| ASSETS |
||||||
| Cash and due from banks |
$ | 15 | $ | 20 | ||
| Short-term investments |
140 | 58 | ||||
| Investment securities |
164 | |||||
| Loans (b) |
2,275 | |||||
| Investments in: |
||||||
| Bank subsidiaries and bank holding company |
27,960 | 15,776 | ||||
| Non-bank subsidiaries |
2,378 | 2,214 | ||||
| Other assets |
1,821 | 614 | ||||
| Total assets |
$ | 34,753 | $ | 18,682 | ||
| LIABILITIES |
||||||
| Subordinated debt |
$ | 4,122 | $ | 968 | ||
| Senior debt |
2,707 | |||||
| Other borrowed funds |
2 | |||||
| Nonbank affiliate borrowings |
945 | 2,478 | ||||
| Accrued expenses and other liabilities |
1,554 | 382 | ||||
| Total liabilities |
9,330 | 3,828 | ||||
| EQUITY |
||||||
| Shareholders equity |
25,422 | 14,854 | ||||
| Noncontrolling interests |
1 | |||||
| Total equity |
25,423 | 14,854 | ||||
| Total liabilities and equity |
$ | 34,753 | $ | 18,682 | ||
| (a) | Includes the impact of National City. |
| (b) | Balance represents National City loans with subsidiaries. |
148
Commercial paper and all other debt issued by PNC Funding Corp, a wholly owned finance subsidiary, is fully and unconditionally guaranteed by the parent company. In addition, in connection with certain affiliates commercial and residential mortgage servicing operations, the parent company has committed to maintain such affiliates net worth above minimum requirements.
The parent company received net income tax refunds of $92 million in 2008, $65 million in 2007 and $35 million in 2006. Such refunds represent the parent companys portion of consolidated income taxes. The parent company paid interest of $147 million in 2008, $146 million in 2007 and $113 million in 2006.
Statement Of Cash Flows
| Year ended December 31 - in millions | 2008 | 2007 | 2006 | |||||||||
| OPERATING ACTIVITIES |
||||||||||||
| Net income |
$ | 882 | $ | 1,467 | $ | 2,595 | ||||||
| Adjustments to reconcile net income to net cash provided (used) by operating activities: |
||||||||||||
| Equity in undistributed net (earnings) of subsidiaries |
172 | (443 | ) | (1,870 | ) | |||||||
| Other |
156 | 61 | 103 | |||||||||
| Net cash provided by operating activities |
1,210 | 1,085 | 828 | |||||||||
| INVESTING ACTIVITIES |
||||||||||||
| Net capital returned from (contributed to) subsidiaries |
(8,298 | ) | (165 | ) | 300 | |||||||
| Investment securities: |
||||||||||||
| Sales and maturities |
1,090 | 3,440 | ||||||||||
| Purchases |
(800 | ) | (3,437 | ) | ||||||||
| Net cash received from (paid for) acquisitions |
1,431 | (2,231 | ) | |||||||||
| Other |
(104 | ) | (26 | ) | (311 | ) | ||||||
| Net cash used in investing activities |
(6,971 | ) | (2,132 | ) | (8 | ) | ||||||
| FINANCING ACTIVITIES |
||||||||||||
| Borrowings from non-bank subsidiary |
2,100 | 3,910 | 210 | |||||||||
| Repayments on borrowings from non-bank subsidiary |
(3,633 | ) | (1,432 | ) | (210 | ) | ||||||
| Other short-term borrowed funds |
103 | |||||||||||
| Acquisition of treasury stock |
(234 | ) | (963 | ) | (531 | ) | ||||||
| Cash dividends paid to shareholders |
(923 | ) | (806 | ) | (633 | ) | ||||||
| TARP warrant |
304 | |||||||||||
| Treasury stock |
375 | 253 | 343 | |||||||||
| Preferred stock-TARP |
7,275 | |||||||||||
| Preferred stock-other |
492 | |||||||||||
| Net cash provided by (used in) financing activities |
5,756 | 1,065 | (821 | ) | ||||||||
| Increase (decrease) in cash and due from banks |
(5 | ) | 18 | (1 | ) | |||||||
| Cash and due from banks at beginning of year |
20 | 2 | 3 | |||||||||
| Cash and due from banks at end of year |
$ | 15 | $ | 20 | $ | 2 | ||||||
NOTE 27 SEGMENT REPORTING
We have changed our business organization structure and management reporting in conjunction with our acquisition of National City. As a result, we have seven reportable business segments, which include:
| | Retail Banking |
| | Corporate & Institutional Banking |
| | Asset Management Group |
| | Residential Mortgage Banking |
| | BlackRock |
| | Global Investment Servicing |
| | Distressed Assets Portfolio |
149
Prior period amounts have been reclassified as appropriate to conform to our current period presentation.
Results of individual businesses are presented based on our management accounting practices and management structure. There is no comprehensive, authoritative body of guidance for management accounting equivalent to GAAP; therefore, the financial results of our individual businesses are not necessarily comparable with similar information for any other company. We refine our methodologies from time to time as our management accounting practices are enhanced and our businesses and management structure change. Financial results are presented, to the extent practicable, as if each business operated on a stand-alone basis. As permitted under GAAP, we have aggregated the business results for certain similar operating segments for financial reporting purposes.
The business segment results in this Note 27 do not include the impact of National City, which we acquired on December 31, 2008.
Assets receive a funding charge and liabilities and capital receive a funding credit based on a transfer pricing methodology that incorporates product maturities, duration and other factors. Capital is intended to cover unexpected losses and is assigned to the banking and servicing businesses using our risk-based economic capital model. We have assigned to Retail Banking capital equal to 6% of funds to reflect the capital required for well-capitalized domestic banks and to approximate market comparables for this business. The capital assigned for Global Investment Servicing reflects its legal entity shareholders equity.
BlackRock business segment results for the first nine months of 2006 reflected our majority ownership in BlackRock during that period. Subsequent to the September 29, 2006 BlackRock/MLIM transaction closing, which had the effect of reducing our ownership interest at that time to approximately 34%, our investment in BlackRock has been accounted for under the equity method but continues to be a separate reportable business segment of PNC. The fair value of our investment in BlackRock at December 31, 2008 was approximately $5.8 billion. Our BlackRock business segment information for the first nine months of 2006 included in this Note 27 was not restated.
We have allocated the allowances for loan and lease losses and unfunded loan commitments and letters of credit based on our assessment of risk inherent in the business segment loan portfolios. Our allocation of the costs incurred by operations and other shared support areas not directly aligned with the businesses is primarily based on the use of services.
Total business segment financial results differ from total consolidated results. The impact of these differences is reflected in the Other category in the business segment tables. Other includes residual activities that do not meet the criteria for disclosure as a separate reportable business, such as gains or losses related to BlackRock transactions including LTIP share distributions and obligations, earnings and gains or losses related to Hilliard Lyons for 2008, integration costs, asset and liability management activities including net securities gains or losses and certain trading activities, exited businesses, equity management activities, alternative investments, intercompany eliminations, most corporate overhead, and differences between business segment performance reporting and financial statement reporting (GAAP), including the presentation of net income attributable to noncontrolling interests.
Assets, revenue and earnings attributable to foreign activities were not material in the periods presented for comparative purposes.
BUSINESS SEGMENT PRODUCTS AND SERVICES
Retail Banking provides deposit, lending, brokerage, trust, investment management, and cash management services to consumer and small business customers within our primary geographic markets. Our customers are serviced through our branch network, call centers and the internet. The branch network is located primarily in Pennsylvania, Ohio, New Jersey, Michigan, Maryland, Illinois, Indiana, Kentucky, Florida, Missouri, Virginia, Delaware, Washington, D.C., and Wisconsin.
Corporate & Institutional Banking provides lending, treasury management, and capital markets-related products and services to mid-sized corporations, government and not-for-profit entities, and selectively to large corporations. Lending products include secured and unsecured loans, letters of credit and equipment leases. Treasury management services include cash and investment management, receivables management, disbursement services, funds transfer services, information reporting, and global trade services. Capital markets-related products and services include foreign exchange, derivatives, loan syndications, mergers and acquisitions advisory and related services to middle-market companies, securities underwriting, and securities sales and trading. Corporate & Institutional Banking also provides commercial loan servicing, and real estate advisory and technology solutions for the commercial real estate finance industry. Corporate & Institutional Banking provides products and services generally within our primary geographic markets, with certain products and services offered nationally.
Asset Management Group includes personal wealth management for high net worth and ultra high net worth clients and institutional asset management. Wealth management products and services include financial planning, customized investment management, private banking, tailored credit solutions and trust management and administration for individuals and their families. Institutional asset management provides investment management, custody, and retirement planning services. The institutional clients include corporations, foundations and unions and charitable endowments located primarily in our geographic footprint. This segment includes the asset management businesses acquired through the National City acquisition and the legacy PNC wealth management business
150
previously included in the Retail Banking segment. The results for this business segment in this Note 27 do not include the impact of National City, which we acquired on December 31, 2008.
Residential Mortgage Banking directly originates first lien residential mortgage loans on a nationwide basis with a significant presence within the retail banking footprint and also originates loans through joint venture partners. Mortgage loans represent loans collateralized by one-to-four-family residential real estate and are made to borrowers in good credit standing. These loans are typically underwritten to third party standards and sold to primary mortgage market aggregators (Fannie Mae, Freddie Mac, Ginnie Mae, Federal Home Loan Banks and third-party investors) with servicing retained. The mortgage servicing operation performs all functions related to servicing first mortgage loans for various investors. Certain loans originated through our joint ventures are serviced by a joint venture partner. The significant majority of the business activities in this business segment were acquired with National City. Accordingly, no financial information for this business segment is included in this Note 27 for the years presented.
BlackRock is one of the largest publicly traded investment management firms in the United States. BlackRock manages assets on behalf of institutional and individual investors worldwide through a variety of fixed income, cash management, equity and balanced and alternative investment separate accounts and funds. In addition, BlackRock provides risk management, investment system outsourcing and financial advisory services globally to institutional investors. At December 31, 2008, PNCs ownership interest in BlackRock was approximately 33%.
Global Investment Servicing is a leading provider of processing, technology and business intelligence services to asset managers, broker-dealers, and financial advisors worldwide. Securities services include custody, securities lending, and accounting and administration for funds registered under the Investment Company Act of 1940 and alternative investments. Investor services include transfer agency, subaccounting, and distribution. Financial advisor services include managed accounts and information management. This business segment services shareholder accounts both domestically and internationally. International locations include Ireland, Poland and Luxembourg.
Distressed Assets Portfolio includes residential real estate development loans, cross-border leases, subprime residential mortgage loans, brokered home equity loans and certain other residential real estate loans. These loans require special servicing and management oversight given current market conditions. The majority of these loans are from acquisitions, primarily National City. Accordingly, no financial information for this business segment is included in this Note 27 for the years presented.
151
Results Of Businesses
| Year ended December 31 In millions |
Retail Banking |
Corporate & Institutional Banking |
Asset Management Group |
BlackRock | Global Investment Servicing |
Other | Consolidated | |||||||||||||||||
| 2008 |
||||||||||||||||||||||||
| INCOME STATEMENT |
||||||||||||||||||||||||
| Net interest income (expense) |
$ | 1,593 | $ | 1,302 | $ | 130 | $ | (31 | ) | $ | 829 | $ | 3,823 | |||||||||||
| Noninterest income |
1,137 | 536 | 429 | $ | 261 | 947 | 57 | 3,367 | ||||||||||||||||
| Total revenue |
2,730 | 1,838 | 559 | 261 | 916 | 886 | 7,190 | |||||||||||||||||
| Provision for credit losses |
388 | 575 | 6 | 548 | 1,517 | |||||||||||||||||||
| Depreciation and amortization |
125 | 22 | 7 | 73 | 140 | 367 | ||||||||||||||||||
| Other noninterest expense |
1,664 | 923 | 356 | 662 | 426 | 4,031 | ||||||||||||||||||
| Earnings (loss) before income taxes |
553 | 318 | 190 | 261 | 181 | (228 | ) | 1,275 | ||||||||||||||||
| Income taxes (benefit) |
225 | 103 | 71 | 54 | 63 | (155 | ) | 361 | ||||||||||||||||
| Earnings (loss) |
$ | 328 | $ | 215 | $ | 119 | $ | 207 | $ | 118 | $ | (73 | ) | $ | 914 | |||||||||
| Inter-segment revenue |
$ | 2 | $ | 14 | $ | 15 | $ | 15 | $ | 22 | $ | (68 | ) | |||||||||||
| Average Assets (a) |
$ | 32,922 | $ | 47,050 | $ | 3,001 | $ | 4,240 | $ | 5,278 | $ | 49,530 | $ | 142,021 | ||||||||||
| 2007 |
||||||||||||||||||||||||
| INCOME STATEMENT |
||||||||||||||||||||||||
| Net interest income (expense) |
$ | 1,741 | $ | 998 | $ | 133 | $ | (32 | ) | $ | 75 | $ | 2,915 | |||||||||||
| Noninterest income |
1,016 | 758 | 461 | $ | 334 | 863 | 358 | 3,790 | ||||||||||||||||
| Total revenue |
2,757 | 1,756 | 594 | 334 | 831 | 433 | 6,705 | |||||||||||||||||
| Provision for credit losses |
133 | 127 | 3 | 52 | 315 | |||||||||||||||||||
| Depreciation and amortization |
116 | 17 | 7 | 60 | 103 | 303 | ||||||||||||||||||
| Other noninterest expense |
1,515 | 820 | 332 | 577 | 725 | 3,969 | ||||||||||||||||||
| Earnings (loss) before income taxes |
993 | 792 | 252 | 334 | 194 | (447 | ) | 2,118 | ||||||||||||||||
| Income taxes (benefit) |
373 | 280 | 94 | 84 | 66 | (270 | ) | 627 | ||||||||||||||||
| Earnings (loss) |
$ | 620 | $ | 512 | $ | 158 | $ | 250 | $ | 128 | $ | (177 | ) | $ | 1,491 | |||||||||
| Inter-segment revenue |
$ | 6 | $ | 9 | $ | 17 | $ | 16 | $ | 17 | $ | (65 | ) | |||||||||||
| Average Assets (a) |
$ | 31,608 | $ | 36,416 | $ | 2,619 | $ | 4,259 | $ | 2,476 | $ | 46,040 | $ | 123,418 | ||||||||||
| 2006 |
||||||||||||||||||||||||
| INCOME STATEMENT |
||||||||||||||||||||||||
| Net interest income (expense) |
$ | 1,464 | $ | 792 | $ | 120 | $ | 20 | $ | (38 | ) | $ | (113 | ) | $ | 2,245 | ||||||||
| Noninterest income |
873 | 781 | 343 | 1,135 | 917 | 2,278 | 6,327 | |||||||||||||||||
| Total revenue |
2,337 | 1,573 | 463 | 1,155 | 879 | 2,165 | 8,572 | |||||||||||||||||
| Provision for credit losses |
83 | 42 | (2 | ) | 1 | 124 | ||||||||||||||||||
| Depreciation and amortization |
61 | 18 | 5 | 29 | 57 | 105 | 275 | |||||||||||||||||
| Other noninterest expense |
1,257 | 760 | 263 | 828 | 646 | 457 | 4,211 | |||||||||||||||||
| Earnings before income taxes |
936 | 753 | 197 | 298 | 176 | 1,602 | 3,962 | |||||||||||||||||
| Income taxes |
347 | 270 | 73 | 104 | 52 | 517 | 1,363 | |||||||||||||||||
| Earnings |
$ | 589 | $ | 483 | $ | 124 | $ | 194 | $ | 124 | $ | 1,085 | $ | 2,599 | ||||||||||
| Inter-segment revenue |
$ | 7 | $ | 9 | $ | 6 | $ | 28 | $ | 12 | $ | (62 | ) | |||||||||||
| Average Assets (a) |
$ | 23,939 | $ | 26,969 | $ | 2,465 | $ | 3,937 | $ | 2,204 | $ | 35,498 | $ | 95,012 | ||||||||||
| (a) | Period-end balances for BlackRock and Global Investment Servicing. |
152
The report of our former independent registered public accounting firm follows:
REPORT OF INDEPENDENT REGISTERED PUBLIC ACCOUNTING FIRM
To the Board of Directors and Shareholders of
The PNC Financial Services Group, Inc.
Pittsburgh, Pennsylvania
We have audited, before the effects of adjustments described in Notes 27 and 1 to the accompanying consolidated financial statements, respectively, to retrospectively change the composition of reportable segments and to retrospectively apply changes in accounting principles for noncontrolling interests and earnings per share, the consolidated statements of income, changes in equity, and cash flows of The PNC Financial Services Group, Inc. and subsidiaries (the Company) for the year ended December 31, 2006 (the 2006 consolidated statements of income, changes in equity, and cash flows before the effects of the aforementioned adjustments are not separately presented herein). These financial statements are the responsibility of the Companys management. Our responsibility is to express an opinion on these financial statements based on our audit.
We conducted our audit in accordance with the standards of the Public Company Accounting Oversight Board (United States). Those standards require that we plan and perform the audit to obtain reasonable assurance about whether the financial statements are free of material misstatement. An audit includes examining, on a test basis, evidence supporting the amounts and disclosures in the financial statements. An audit also includes assessing the accounting principles used and significant estimates made by management, as well as evaluating the overall financial statement presentation. We believe that our audit provides a reasonable basis for our opinion.
In our opinion, such consolidated financial statements, before the effects of the aforementioned adjustments to retrospectively change the composition of reportable segments and to retrospectively apply changes in accounting principles for noncontrolling interests and earnings per share, (not separately presented herein) present fairly, in all material respects, the results of operations and cash flows of The PNC Financial Services Group, Inc. and subsidiaries for the year ended December 31, 2006, in conformity with accounting principles generally accepted in the United States of America.
We were not engaged to audit, review, or apply any procedures to the adjustments described in Notes 27 and 1 to the accompanying consolidated financial statements, respectively, to retrospectively change the composition of reportable segments and to retrospectively apply changes in accounting principles for noncontrolling interests and earnings per share and, accordingly, we do not express an opinion or any other form of assurance about whether such retrospective adjustments are appropriate and have been properly applied. Those retrospective adjustments were audited by other auditors.
As discussed in Note 1 to the consolidated financial statements, the Company adopted Statement of Financial Accounting Standard No. 158, Employers Accounting for Defined Benefit Pension and Other Postretirement Plans an amendment of FASB Statements No. 87, 88, 106, and 132(R) as of December 31, 2006.
As discussed in Note 1 to the consolidated financial statements, the accompanying consolidated statement of cash flows for the year ended December 31, 2006 has been restated.
As a result of the transaction discussed in Note 2 to the consolidated financial statements, the Company no longer consolidates BlackRock, Inc. (BlackRock). Beginning September 30, 2006, the Company recognized its investment in BlackRock using the equity method of accounting.
/s/ Deloitte & Touche LLP
Pittsburgh, Pennsylvania
March 1, 2007 (February 4, 2008 as to the effects of the restatement discussed in Note 1)
153
Audited consolidated financial statements of BlackRock, Inc. (BlackRock) as of December 31, 2008 and 2007 and for each of the three years ended December 31, 2008, are incorporated herein by reference to Item 9.01 of BlackRocks Current Report on Form 8-K (Commission File Number 001-33099) dated September 17, 2009.
154