SLIDE PRESENTATION
Published on December 8, 2009

The PNC
Financial Services Group, Inc. Goldman Sachs Financial Services Conference December 8, 2009 Exhibit 99.1 |

2 Cautionary Statement Regarding Forward-Looking Information and Adjusted Information This presentation includes snapshot information about PNC used by way of
illustration. It is not intended as a full business or financial review and
should be viewed in the context of all of the information made available by PNC in its SEC filings. The presentation also contains forward-looking statements regarding our outlook or expectations relating to
PNCs future business, operations, financial condition, financial performance,
capital and liquidity levels, and asset quality. Forward-looking statements are necessarily subject to numerous assumptions, risks and uncertainties, which change over time. The forward-looking statements in this presentation are qualified by the factors affecting
forward-looking statements identified in the more detailed Cautionary Statement
included in the Appendix, which is included in the version of the presentation materials posted on our corporate website at www.pnc.com/investorevents. We provide greater detail regarding some of
these factors in our 2008 Form 10-K and 2009 Form 10-Qs, including in the Risk
Factors and Risk Management sections of those reports, and in our other SEC filings (accessible on the SECs website at www.sec.gov and on or through our corporate website at
www.pnc.com/secfilings). We have included web addresses here and elsewhere in
this presentation as inactive textual references only. Information on these websites is not part of this document. Future events or circumstances may change our outlook or expectations and may also affect the
nature of the assumptions, risks and uncertainties to which our forward-looking
statements are subject. The forward-looking statements in this presentation speak only as of the date of this presentation. We do not assume any duty and do not undertake to update those
statements. In this presentation, we may refer to adjusted results to help illustrate the impact of certain
types of items. This information supplements our results as reported in
accordance with GAAP and should not be viewed in isolation from, or a substitute for, our GAAP results. We believe that this additional information and the reconciliations we provide may be useful to
investors, analysts, regulators and others as they evaluate the impact of these items
on our results for the periods presented. In certain discussions, we may also provide information on yields and margins for all
interest-earning assets calculated using net interest income on a
taxable-equivalent basis by increasing the interest income earned on tax-exempt assets to make it fully equivalent to interest income earned on taxable investments. We believe this adjustment may be useful when comparing
yields and margins for all earning assets. This presentation may also include discussion of other non-GAAP financial measures, which, to
the extent not so qualified therein or in the Appendix, is qualified by GAAP
reconciliation information available on our corporate website at www.pnc.com under About PNCInvestor Relations. |

3 Key Messages PNCs business model has performed well in 2009 PNC is well-positioned to navigate the uncertain environment PNC has realistic opportunities for growth PNCs Business Model Has Delivered Solid Results and Is Expected to Deliver Growth During the Economic Recovery. |

4 2009 Highlights 1 Continued to transition the balance sheet by: - Realigning our deposit mix - Maintaining strong bank liquidity - Repositioning the investment securities portfolio - Increasing reserves - Strengthening capital ratios Posted year-to-date net income of $1.3 billion Captured more than $800 million of annualized integration cost savings on a 3Q09 basis Successfully completed first phase of National City conversion in November PNCs Performance Validates Realistic Opportunities for Growth. (1) Highlights as of or for the nine months ended September 30, 2009 except for conversion as
noted. Business Model Performance - 2009 |

5 2009 National Recognition Business Model Performance - 2009 BusinessWeek 50 top performing companies Most Admired Companies, Fortune magazine One of Americas Most Shareholder-Friendly Companies, Institutional Investor magazine 100 Best Companies for Working Mothers, Working Mother Top 50 Companies for Executive Women, National Association for Female Executives Top 125 Companies for Employee Training, Training magazine CIO 100 for Technology Excellence, CIO magazine Committee for Economic Development (CED) Trustee Leadership Award for PNCs Grow Up Great Early Education Initiative |

6 An Environment of Change Economic, Regulatory and Operating Environment Economic environment - Subdued recovery - Unemployment - Interest rates Regulatory environment - PNCs culture and principles - Impact on competitors - Consumer and small business needs Operating environment - Changing consumer behaviors - Meeting needs of businesses PNCs Vision, Values and Business Model Position Us Well to Successfully Navigate the Uncertain Environment. |

7 PNCs Framework for Success Execute on and deliver the PNC business model Capitalize on integration opportunities Emphasize continuous improvement culture Leverage credit that meets our risk/return criteria Focus on cross selling PNCs deep product offerings Focus front door on risk-adjusted returns Leverage back door credit liquidation capabilities Maximize credit portfolio value Reposition deposit gathering strategies Action Plans 0.62% >$800 million 44% 2.3% 87% September 30, 2009 1.30%+ $1.2 billion >50% 0.3%-0.5% 80%-90% Target Return on average assets (nine months ended) Key Metrics Loan to deposit ratio (as of) Provision to average loans (nine months ended, annualized) Noninterest income/total revenue (nine months ended) Integration cost savings (third quarter, annualized) Executing our strategies PNC Business Model Staying core funded Returning to a moderate risk profile Growing high quality, diverse revenue streams Creating positive operating leverage PNCs Plans for Growth |

8 Realistic Opportunities for Growth Leverage product depth, cross sell capabilities, balance sheet and improved markets PNC Is Well-Positioned for Growth. Return to a moderate risk profile Credit Exceed cost saves and normalize expenses Expense Revenue PNCs Plans for Growth |
9 Total franchise YTD09 sales 130% of YTD goal 3Q09 sales up 21% vs. 1Q09 YTD09 sales 143% of YTD goal All markets above YTD goal YTD09 sales 113% of YTD goal 75% of markets above YTD goal Legacy PNC markets¹ Legacy National City markets ² Product Sales Across the Franchise Corporate Banking Wealth Management Institutional Investments Business Bank- Commercial Sept. 09 YTD annualized sales contribution by region Sales highlights Products Legacy PNC markets ¹ 61% Legacy National City markets ² 39% PNC Has Significant Sales Momentum Going into 2010. PNC Has Significant Sales Momentum Going into 2010. (1) Includes overlap markets where PNC had a higher deposit share than National City prior to the
acquisition. (2) Includes overlap markets where National City had a higher deposit
share than PNC prior to the acquisition. PNCs Plans for Growth |

10
Cross-Sell Across the Franchise PNC Is Leading the Way in Delivering the Brand to Our Acquired PNC Is Leading the Way in Delivering the Brand to Our Acquired Markets. Markets. % of year-to-date cross sell goal through September 30, 2009 116% 113% 114% 79% 137% 118% Legacy National City markets ¹ Legacy PNC markets ² Total PNC (1) Includes overlap markets where National City had a higher deposit share than PNC prior to the
acquisition. (2) Includes overlap markets where PNC had a higher deposit share than
National City prior to the acquisition. Treasury management Capital markets PNCs Plans for Growth |
11
PNC access schools Retail and Mortgage Banking Opportunities PNCs History of Building and Deepening Relationships Creates Tremendous Opportunity Across the Consumer Space. University banking potential Leveraging mortgage banking Estimated # of students 295,000 415,000 3.3 million 2.0 million PNC alliances PNC target market schools Other potential HH with multiservices Average deposit balance Average HH DDA profit Incremental value of a Legacy PNC mortgage relationship vs. a non-mortgage relationship +37% +42% +64% % difference with a mortgage relationship PNCs Plans for Growth |
12
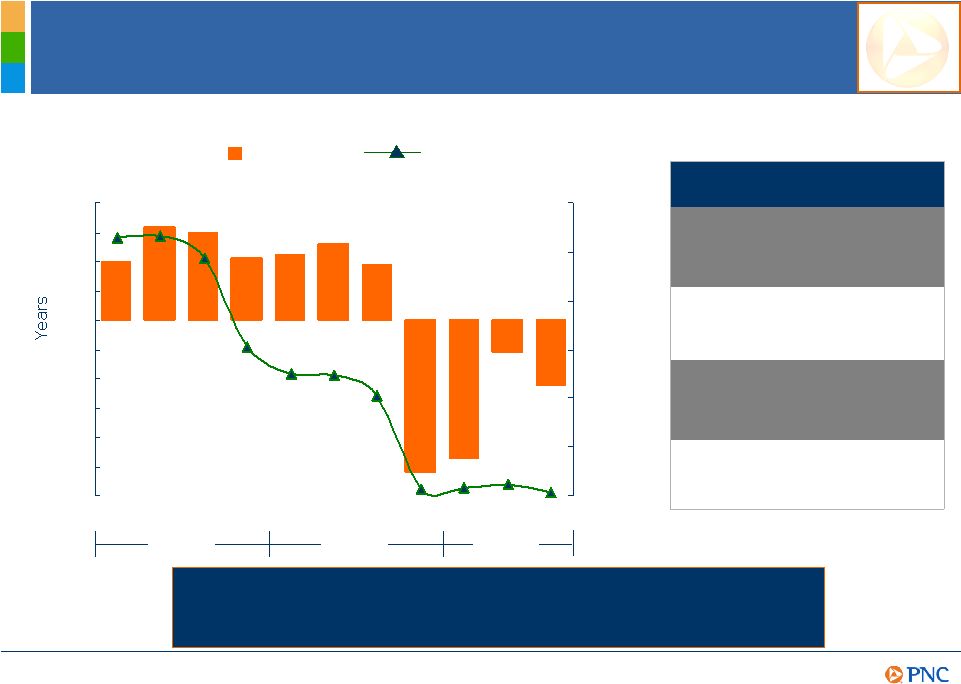
(6) (5) (4) (3) (2) (1) 0 1 2 3 4 0% 1% 2% 3% 4% 5% 6% Balance Sheet Management PNC Duration of Equity (At Quarter End) Fed Funds Effective Rate (At Quarter End) 2007 2008 2009 1.4% 100 bps increase (5.5%) 100 bps decrease Effect on NII in 2 nd year from gradual interest rate change over preceding 12 months Effect on NII in 1 st year from gradual interest rate change over following 12 months PNC 3Q09 NII Sensitivity (2.0%) .9% 100 bps decrease 100 bps increase Q1 Q2 Q3 Q4 Q1 Q2 Q3 Q4 Q1 Q2 Q3 PNCs Balance Sheet Is Well-Positioned to Take Advantage of Improvement in Loan Demand. PNCs Plans for Growth |
13
Integration Cost Savings Year-to-date cost savings of more than $460 million Implemented common vendor and expense policies and approval guidelines Implementing multi-year plan to help maximize the value of physical space owned and leased Began consolidation of 93 mortgage operations sites into two centers - Chicago and Pittsburgh Streamlining systems and support functions operations, marketing, communications, technology, finance, other staff Completed divestiture of 61 Western Pennsylvania National City branches in 3Q09 Integration cost savings highlights Captured cost saves $120 $140 $200 1Q09 2Q09 3Q09 Expect to exceed original $1.2 billion annualized cost save goal PNCs Plans for Growth |
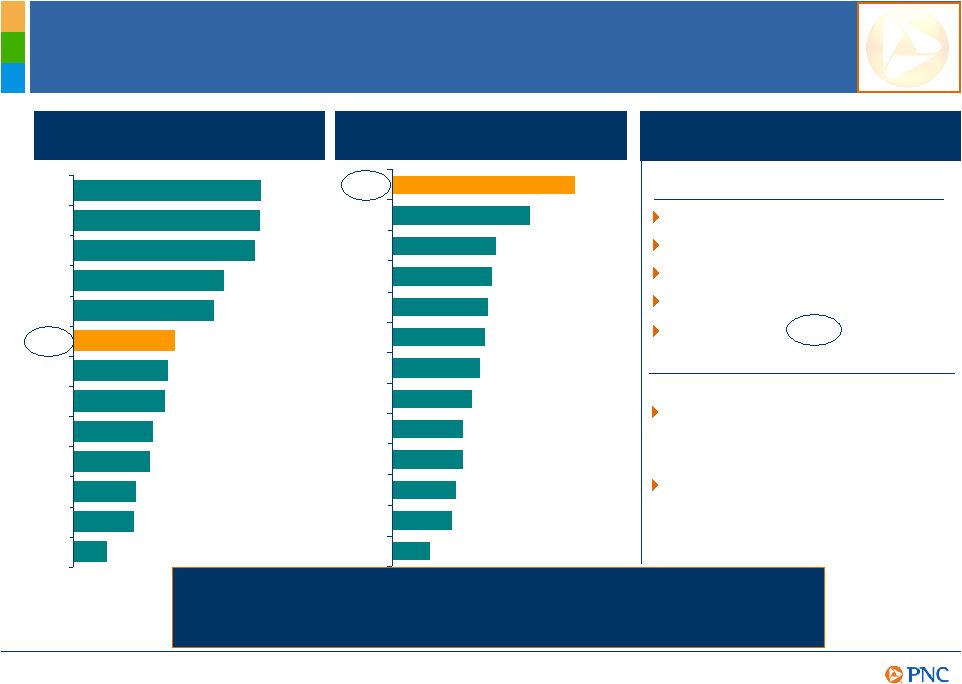
14
Loss coverage ² : Commercial real estate 10% Commercial 5% Residential real estate 9% Consumer 3% Total loans 7% 3Q09 Reserves, Net Charge-offs Nearly 1,300 people dedicated to loss mitigation and loan modification Additional 350 people consulting on commercial real estate PNC September 30, 2009 Reserves to total loans / net charge-offs to average loans ¹ 1.9 1.5 1.3 1.3 1.2 1.2 1.2 1.1 1.0 1.0 1.0 1.0 0.8 PNC MTB BBT FITB JPM WFC USB KEY COF CMA RF BAC STI 4.7% 4.7% 4.6% 4.0% 3.8% 3.0% 2.9% 2.8% 2.6% 2.5% 2.2% 2.2% 1.7% JPM COF FITB KEY BAC PNC WFC RF USB STI BBT CMA MTB Reserves / total loans PNCs Plans for Growth PNC Expects Its Credit Costs to Be Lower Relative to Peers as the Economy Recovers. Peer source: SNL DataSource. (1) Net charge-offs to average loans ratio is annualized. (2)
Calculated as the allowance for loan and lease losses combined with the remaining fair
value marks on loans acquired from National City that were impaired per FASB ASC 310-30 as a percentage of the outstanding loan portfolio at September 30, 2009. |

15
Capital Ratios 10.0% 1Q09 2Q09 4.9% 5.3% 1Q09 2Q09 Tier 1 common ratio Tier 1 risk-based ratio 5.5% 10.5% 10.9% 3Q09 3Q09 PNC capital ratios already reflect impact of fair value marks as of September 30, 2009, fair value marks were approximately $6.6 billion Increased common equity by $3.5 billion from 4Q08 to 3Q09 Plan to repay TARP when appropriate in a shareholder- friendly manner subject to regulatory approval PNCs gain related to BlackRocks December 1, 2009 merger with Barclays Global Investors equals approximately 30 basis points of PNCs risk-weighted assets Highlights 4.8% 9.7% 4Q08 4Q08 PNCs Plans for Growth PNC Is Focused on Disciplined Uses of Capital During this PNC Is Focused on Disciplined Uses of Capital During this Challenging Time. Challenging Time. Ratios and common equity as of quarter end. (1) Fair value marks relate to loans acquired from
National City that were impaired per FASB ASC 310-30. (2) Estimated after
tax-gain of $700 million divided by risk-weighted assets of $233.4 billion at September 30, 2009. 2 1 |
16
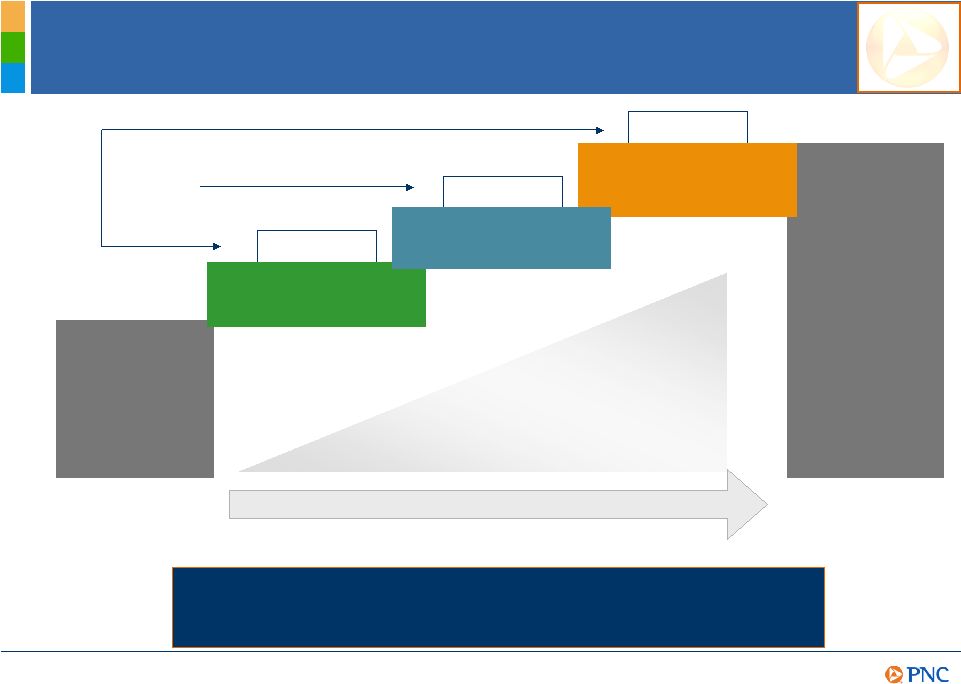
Getting from Here to There PNC Is Recognized for Delivering on Our Growth Initiatives. PNC Is Recognized for Delivering on Our Growth Initiatives. .62% return on average assets Potential Sept 30, 2009 YTD Economic recovery 1.30% return on average assets Realistic opportunities to reach tactical goal of 1.30% ROAA Levers PNCs Plans for Growth Credit Improvement in credit costs Revenue Revenue growth enhancements Expense Integration cost save capture |

17
Summary PNC Continues to Build a Great Company. PNC Continues to Build a Great Company. PNC performance during the recession validates our business model PNCs execution leaves us well-positioned to navigate the changing environment PNCs realistic opportunities for growth are expected to deliver significant value |

18
Cautionary Statement Regarding Forward-Looking Information Appendix This presentation includes snapshot information about PNC used by way of illustration
and is not intended as a full business or financial review. It should not be
viewed in isolation but rather in the context of all of the information made available by PNC in its SEC filings. We also make statements in this presentation, and we may from time to time make other statements,
regarding our outlook or expectations for earnings, revenues, expenses, capital levels,
liquidity levels, asset quality and/or other matters regarding or affecting PNC that
are forward-looking statements within the meaning of the Private Securities Litigation Reform Act. Forward-looking statements are typically identified by words such as believe, plan, expect,
anticipate, intend, outlook, estimate, forecast, will, project and other similar words and expressions. Forward-looking statements are subject to
numerous assumptions, risks and uncertainties, which change over time. Forward-looking statements speak only as of the date they are made. We do not assume any duty
and do not undertake to update our forward-looking statements. Actual results
or future events could differ, possibly materially, from those that we anticipated in our forward-looking statements, and future results could differ materially from our historical
performance. Our forward-looking statements are subject to the following principal risks and
uncertainties. We provide greater detail regarding some of these factors in our
2008 Form 10-K and 2009 Form 10-Qs, including in the Risk Factors and Risk Management sections of those reports, and in our other SEC filings. Our forward-looking statements may also be subject to other
risks and uncertainties, including those that we may discuss elsewhere in this
presentation or in our filings with the SEC, accessible on the SECs website at www.sec.gov and on or through our corporate website at www.pnc.com/secfilings. We have included these web addresses
as inactive textual references only. Information on these websites is not part of
this document. Our businesses and financial results are affected by business and economic conditions, both
generally and specifically in the principal markets in which we operate. In particular,
our businesses and financial results may be impacted by: o
Changes in interest rates and valuations in the debt, equity and other financial
markets. o
Disruptions in the liquidity and other functioning of financial markets, including such disruptions
in the markets for real estate and other assets commonly securing financial products.
o
Actions by the Federal Reserve and other government agencies, including those that impact money
supply and market interest rates. o
Changes in our customers, suppliers and other counterparties performance in
general and their creditworthiness in particular. o
Changes in levels of unemployment. o
Changes in customer preferences and behavior, whether as a result of changing business and economic
conditions or other factors. A continuation of recent turbulence in significant
portions of the US and global financial markets, particularly if it worsens, could impact our performance, both directly by affecting our revenues and the value of our assets and
liabilities and indirectly by affecting our counterparties and the economy generally.
Our business and financial performance could be impacted as the financial
industry restructures in the current environment, both by changes in the
creditworthiness and performance of our counterparties and by changes in the competitive and regulatory landscape. Given current economic and financial market conditions, our forward-looking financial
statements are subject to the risk that these conditions will be substantially
different than we are currently expecting. These statements are based on our current expectations that interest rates will remain low through 2009 with continued wide market credit spreads, and our view
that national economic trends currently point to the end of recessionary conditions in
the later half of 2009 followed by a subdued recovery in 2010. |

19
Legal and regulatory developments could have an impact on our ability to operate our
businesses or our financial condition or results of operations or our competitive
position or reputation. Reputational impacts, in turn, could affect matters such as business generation and retention, our ability to attract and retain management, liquidity, and funding. These legal and regulatory developments
could include: o
Changes resulting from legislative and regulatory responses to the current economic and financial
industry environment, including current and future conditions or restrictions imposed as
a result of our participation in the TARP Capital Purchase Program. o
Other legislative and regulatory reforms, including
broad-based restructuring of financial industry regulation as well as changes to laws and regulations involving tax, pension, bankruptcy, consumer protection, and other aspects of the
financial institution industry. o
Increased litigation risk from recent regulatory and other governmental developments.
o
Unfavorable resolution of legal proceedings or other claims and regulatory and other governmental
inquiries. o
The results of the regulatory examination and supervision process, including our failure to satisfy
the requirements of agreements with governmental agencies. o
Changes in accounting policies and principles. Our issuance of securities to the US Department of the Treasury may limit our ability to return
capital to our shareholders and is dilutive to our common shares. If we are unable
previously to redeem the shares, the dividend rate increases substantially after five years. Our business and operating results are affected by our ability to identify and effectively manage
risks inherent in our businesses, including, where appropriate, through the effective
use of third-party insurance, derivatives, and capital management techniques, and by our ability to meet evolving regulatory capital standards. The adequacy of our intellectual property protection, and the extent of any costs associated with
obtaining rights in intellectual property claimed by others, can impact our business and
operating results. Our ability to anticipate and respond to technological changes can
have an impact on our ability to respond to customer needs and to meet competitive
demands. Our ability to implement our business initiatives and strategies could affect
our financial performance over the next several years. Competition can have an impact
on customer acquisition, growth and retention, as well as on our credit spreads and product pricing, which can affect market share, deposits and revenues. Our business and operating results can also be affected by widespread natural disasters, terrorist
activities or international hostilities, either as a result of the impact on the economy
and capital and other financial markets generally or on us or on our customers, suppliers or other counterparties specifically. Also, risks and uncertainties that could affect the results anticipated in forward-looking
statements or from historical performance relating to our equity interest in BlackRock,
Inc. are discussed in more detail in BlackRocks filings with the SEC, including in the Risk Factors sections of BlackRocks reports. BlackRocks SEC filings are accessible on the SECs website and on or through
BlackRocks website at www.blackrock.com. This material is referenced for
informational purposes only and should not be deemed to constitute a part of this document. In addition, our recent acquisition of National City Corporation (National City)
presents us with a number of risks and uncertainties related both to the acquisition
itself and to the integration of the acquired businesses into PNC. These risks and uncertainties include the following: The anticipated benefits of the transaction, including anticipated cost savings and strategic
gains, may be significantly harder or take longer to achieve than expected or may not be
achieved in their entirety as a result of unexpected factors or events. Cautionary
Statement Regarding Forward-Looking Information (continued)
Appendix |

20
Cautionary Statement Regarding Forward-Looking Information (continued)
Appendix Our ability to achieve anticipated results from this transaction is dependent on the state going
forward of the economic and financial markets, which have been under significant stress
recently. Specifically, we may incur more credit losses from National Citys loan portfolio than expected. Other issues related to achieving anticipated financial results include the possibility that deposit attrition or attrition
in key client, partner and other relationships may be greater than expected. Legal proceedings or other claims made and governmental investigations currently pending against
National City, as well as others that may be filed, made or commenced relating to
National Citys business and activities before the acquisition, could adversely impact our financial results. Our ability to achieve anticipated results is also dependent on our ability to bring National
Citys systems, operating models, and controls into conformity with ours and to do
so on our planned time schedule. The integration of National Citys business and operations into PNC, which will include conversion of National Citys different systems and procedures, may take longer than anticipated or be more
costly than anticipated or have unanticipated adverse results relating to National
Citys or PNCs existing businesses. PNCs ability to integrate National City successfully may be adversely affected by the fact that this transaction has resulted in PNC entering several markets where PNC did not previously have any
meaningful retail presence. In addition to the National City transaction, we grow our business from time to time by acquiring
other financial services companies. Acquisitions in general present us with
risks, in addition to those presented by the nature of the business acquired, similar to some or all of those described above relating to the National City acquisition. Any annualized, proforma, estimated, third party or consensus numbers in this presentation are used
for illustrative or comparative purposes only and may not reflect actual results.
Any consensus earnings estimates are calculated based on the earnings projections made by analysts who cover that company. The analysts opinions, estimates or forecasts (and therefore the consensus earnings
estimates) are theirs alone, are not those of PNC or its management, and may not
reflect PNCs or other companys actual or anticipated results. |

21
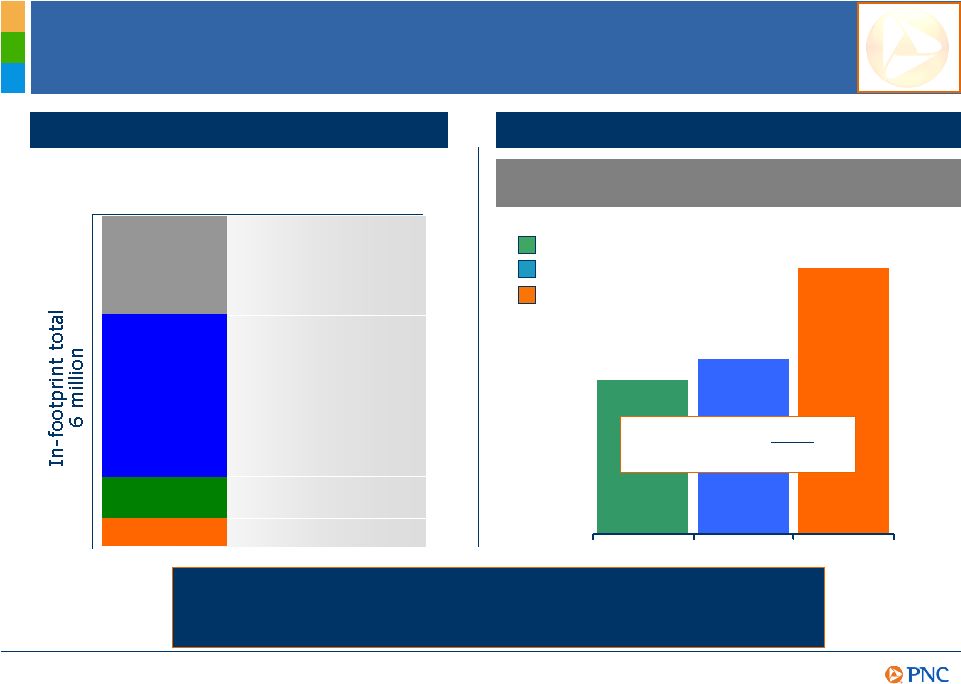
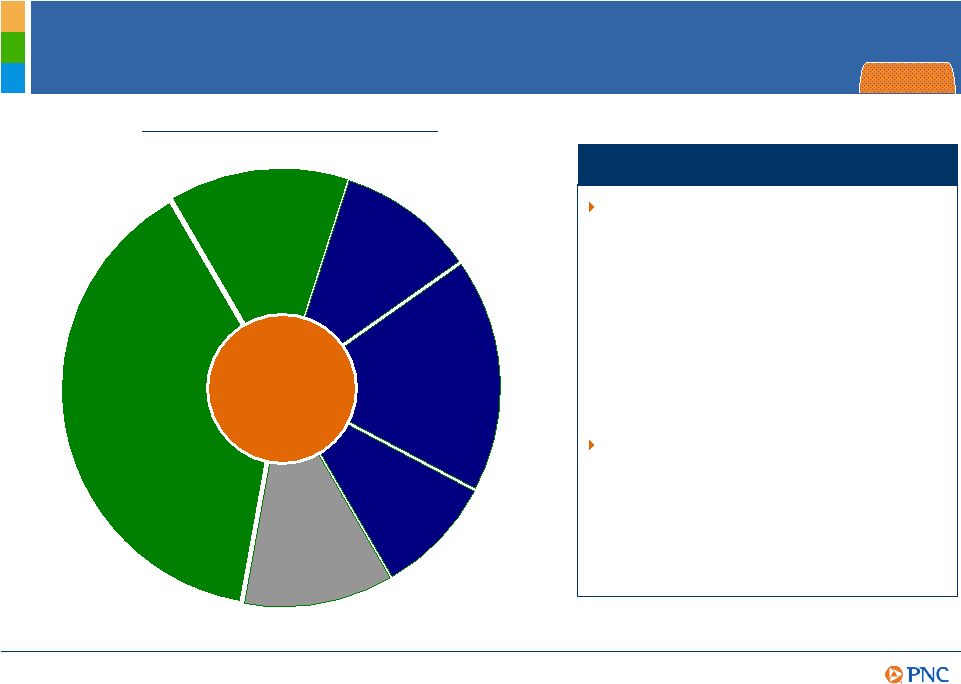
Balance Sheet Overview Change from ($8) 2 - ($3) ($7) (3) (5) $1 ($8) (8) (4) $4 June 30, 2009 ($20) $271 Total liabilities and equity ($10) $42 Borrowed funds (13) 11 Other time/savings ($9) $184 Total deposits (4) 16 Other (7) 51 Retail CDs $11 $122 Transaction deposits 3 29 Shareholders equity (16) 56 Other assets (15) 161 Total loans ($20) $271 Total assets $54 Sept. 30, 2009 $11 Dec. 31, 2008 Investment securities Category (billions)
Loans/Assets 59% Investment securities/Assets 20% Loans/Deposits 87% Tier 1 risk-based ratio 10.9% Tier 1 common ratio 5.5% Sept. 30, 2009 Key Ratios Appendix |
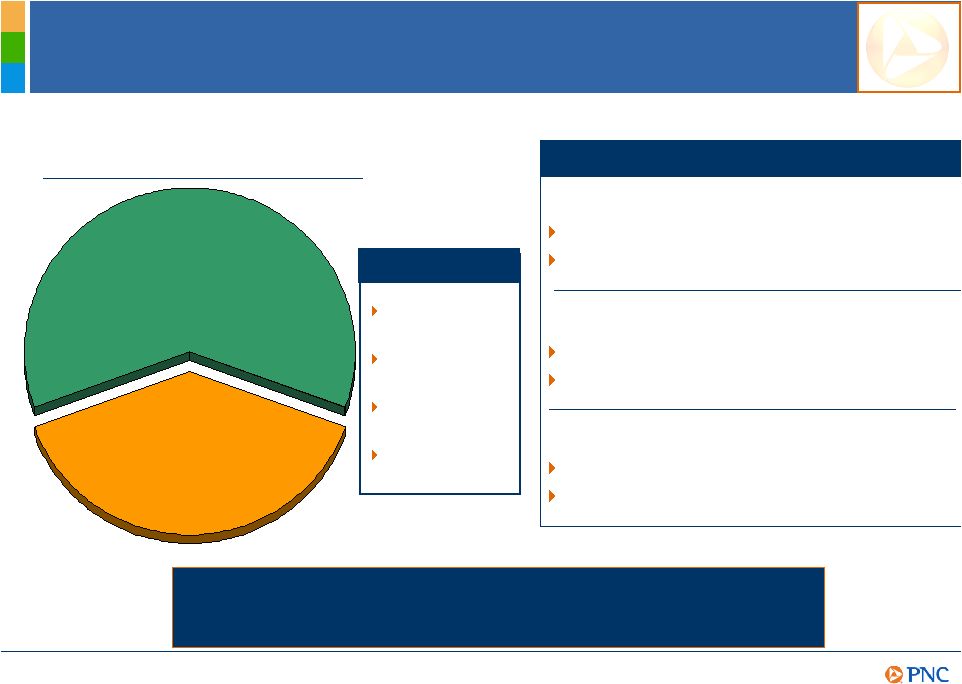
22
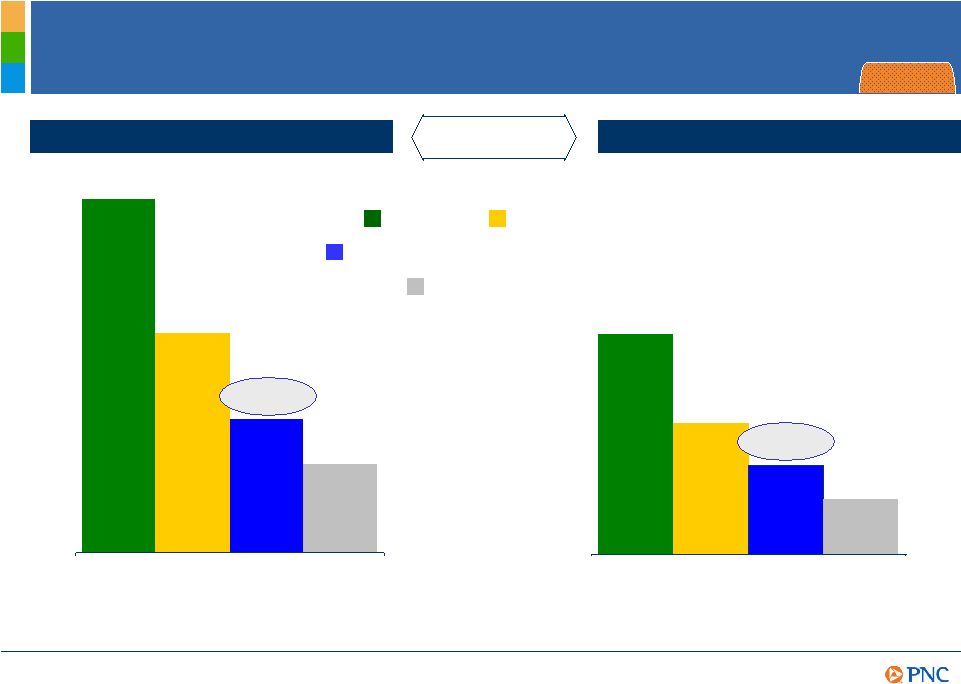
Loan Portfolio Commercial and equipment leasing $62.3 Commercial real estate $21.4 3Q09 Total loans $160.6 Home Equity $29.6 Residential real estate $11.1 Distressed ¹ $19.7 Other consumer $16.5 As of September 30, 2009. (1) Includes commercial and equipment leasing, commercial real estate,
home equity, residential real estate and other consumer loans assigned to the
Distressed Assets Portfolio segment totaling approximately $19.7 billion at September 30, 2009. Further information regarding the categories of loans in the Distressed Assets Portfolio
segment and in the overall loan portfolio is provided in the Appendix. (2) Impaired
loans and/or fair value marks relate to loans acquired from National City that were impaired per FASB ASC 310-30. Held for Investment (billions) Core portfolio of $141 billion - Primarily in our footprint with a majority collateralized - Relatively well balanced - No sector concentrations in commercial portfolio - Core CRE well diversified in terms of asset classes and geography - Core consumer 71% home equity and residential real estate Distressed portfolio of $20 billion - Includes impaired loans with a carrying value of $7.8 billion marked down by 37% 2 - Overall carried at about 75% of customer outstandings considering allowance and fair value marks 2 Highlights 39% 13% 10% 19% 7% 12% Appendix |

23
Credit Quality Trends (1) Excludes loans that are government insured/guaranteed, primarily residential mortgages.
Excludes loans acquired from National City that were impaired. These loans are
excluded as they were recorded at estimated fair value when acquired and are currently
considered performing loans due to the accretion of interest in purchase accounting. (2) Prior quarter net charge-offs would not include National City, which PNC acquired on December 31, 2008. (3) Net charge-offs
to average loans percentages are annualized. $4.3 $4.6 $4.8 Allowance for loan and lease losses Allowance and fair value marks (billions,
except percentages) 8.3 7.5 6.6 Fair value marks $12.6 $12.1 $11.4 Total allowance and fair value marks 7.0% 7.0% 6.8% Total allowance and fair value marks/outstanding loan balances 11% 3% 8% Change from prior quarter Net charge-offs (millions, except percentages) Nonperforming loans (millions, except percentages) Accruing loans past due 1 (millions, except percentages) $2,136 $2,195 $2,380 30 89 days $501 $1,043 $875 90 days or more 27% 108% (16%) Change from prior quarter 1.01% 1.89% 1.59% NCOs/average loans 3 $431 $795 $650 Total net charge-offs N/M 2 84% (18%) Change from prior quarter 78% 40% 23% Change from prior quarter $2,960 $4,156 $5,126 Total nonperforming loans 2.52% 930 $3,226 2Q09 1.73% 3.19% Nonperforming loans/total loans 413 1,260 Consumer lending $2,547 $3,866 Commercial lending 1Q09 3Q09 Appendix |
24
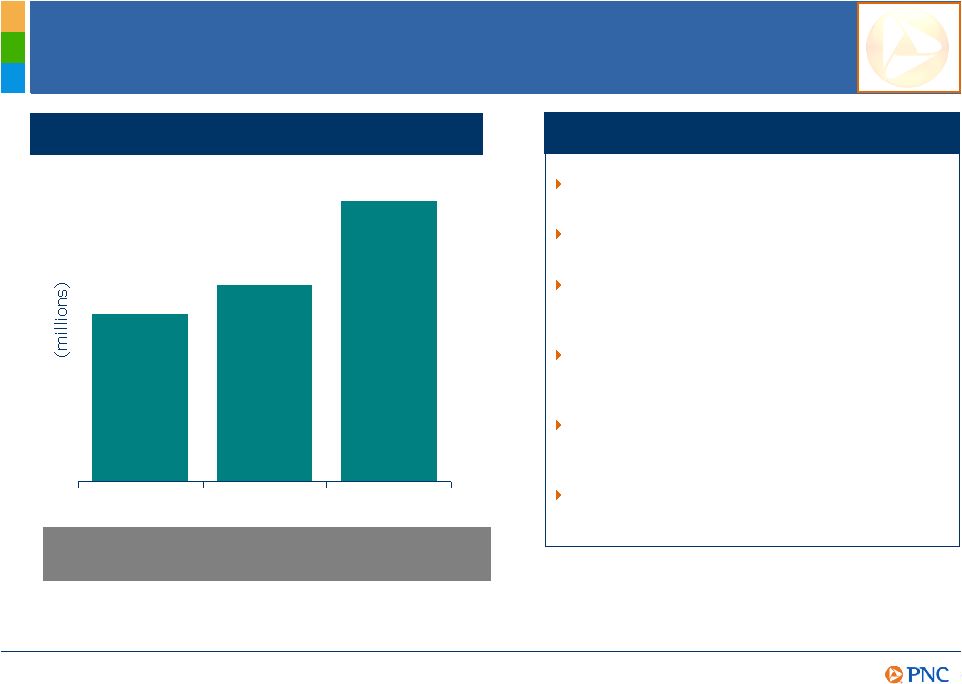
Pretax Pre-Provision Earnings 1 (1) For the nine months ended September 30, 2009, total revenue of $11.906 billion less noninterest
expense of $7.365 billion equals pretax pre-provision earnings of $4.541 billion. For the three months ended September 30, 2009, total revenue of $4.048 billion less noninterest expense of $2.379 billion equals pretax pre-provision earnings of $1.669 billion.
Further information is provided later in the Appendix. $4.0 $2.4 $1.7 $0.9 $11.9 $7.4 $4.5 $2.9 Nine months ended Revenue Expense Pretax pre-provision earnings Provision (billions) September 30 2009 Three months ended Appendix |

25
Investment Securities Portfolio Made significant progress improving the risk profile Increased purchases of Treasuries and government agency securities Sold non-agency residential mortgage-backed securities at a gain 3Q09 unrealized pretax loss of $2.2 billion improved by $3.2 billion since 4Q08 Improved credit related OTTI 1 trend from ($155) million in 2Q09 to ($129) million in 3Q09 Highlights $45.5 $52.0 Total amortized cost (billions) 7% 4% 8% 2% 21% 45% 13% % of portfolio 3Q09 4Q08 5% Asset-backed Period end securities available for sale - amortized cost basis 2% US Treasury and government agencies Residential mortgage-backed 50% Agency 29% Non-Agency Commercial mortgage-backed 0% Agency 9% Non-Agency 5% Other (1) Other-than-temporary impairments. Appendix |

26
Non-GAAP to GAAP Reconcilement Appendix In millions, for the three months ended Pretax Net income Reported net income (loss) ($246) National City conforming provision for credit losses $504 328 Net income (loss) excluding National City conforming provision for credit losses $82 December 31, 2008 PNC believes that information adjusted for the impact of this item may be useful due to the extent
to which the item is not indicative of our ongoing operations. Nine months ended
March 31, 2009 June 30, 2009 Sept. 30, 2009 June 30, 2009 in millions Total revenue $3,871 $3,987 $4,048 $11,906 Noninterest expense 2,328 2,658 2,379 7,365 Pretax pre-provision earnings $1,543 $1,329 $1,669 $4,541 PNC believes that pretax pre-provision earnings is useful as a tool to help evaluate ability to
provide for credit costs through operations. Three months ended As of September 30, 2009, in millions Total PNC Loans assigned to the Distressed Assets Portfolio segment Total PNC after reassigning Distressed Asset Portfolio loans % of core PNC loan portfolio % of total PNC loan portfolio Commercial and equipment leasing $63,211 $892 $62,319 44% 39% Commerical real estate 24,064 2,659 21,405 15% 13% Total core commercial lending $83,724 59% 52% Other consumer 16,505 11 $16,494 12% 10% Home equity 36,370 6,772 29,598 21% 19% Residential real estate 20,458 9,348 11,110 8% 7% Total core consumer lending $57,202 41% 36% Total core portfolio $140,926 100% 88% Distressed 19,682 12% Total loans $160,608 $19,682 $160,608 100% |

27
Peer Group of Banks Appendix The PNC Financial Services Group, Inc. PNC BB&T Corporation BBT Bank of America Corporation BAC Capital One Financial, Inc. COF Comerica Inc. CMA Fifth Third Bancorp FITB JPMorgan Chase JPM KeyCorp KEY M&T Bank MTB Regions Financial Corporation RF SunTrust Banks, Inc. STI U.S. Bancorp USB Wells Fargo & Company WFC Ticker |