SLIDE PRESENTATION
Published on May 27, 2009

The PNC
Financial Services Group, Inc. Sanford C. Bernstein Strategic Decisions Conference May 27, 2009 Exhibit 99.1 |

2 Cautionary Statement Regarding Forward-Looking Information and Adjusted Information This presentation includes snapshot information about PNC used by way of illustration. It is not intended as a full business or financial review and should be viewed in the context of all of the information made available by PNC in its SEC
filings. The presentation also contains forward-looking statements regarding
our outlook or expectations relating to PNCs future business, operations, financial condition, financial performance, capital and liquidity levels, and asset quality. Forward-looking statements are necessarily subject
to numerous assumptions, risks and uncertainties, which change over time. The forward-looking statements in this presentation are qualified by the factors affecting
forward-looking statements identified in the more detailed Cautionary Statement included in the Appendix, which is included in the version of the presentation materials posted on our corporate website at www.pnc.com/investorevents. We provide greater detail regarding these factors in our first quarter 2009 Form 10-Q and 2008 Form 10-K, including in the Risk Factors and Risk Management sections, and in our other SEC filings (accessible on the
SECs website at www.sec.gov and on or through our corporate website at
www.pnc.com/secfilings). We have included web addresses here and elsewhere in this presentation as inactive textual references only. Information on these websites is not part of this document. Future events or circumstances may change our outlook or expectations and may also affect the
nature of the assumptions, risks and uncertainties to which our forward-looking
statements are subject. The forward-looking statements in this presentation speak only as of the date of this presentation. We do not assume any duty and do not undertake to update those statements. In this presentation, we may sometimes refer to adjusted results to help illustrate the impact of certain types of items. This information supplements our results as reported in accordance with GAAP and should not be viewed in isolation from, or a substitute for, our GAAP results. We provide these adjusted amounts and reconciliations so that investors, analysts, regulators and
others will be better able to evaluate the impact of these items on our results for the
periods presented. We believe that information as adjusted for the impact of the specified items may be useful due to the extent to which these items are not indicative of our ongoing operations. In certain discussions, we may also provide information on yields and margins for all
interest-earning assets calculated using net interest income on a
taxable-equivalent basis by increasing the interest income earned on tax-exempt assets to make it fully equivalent to interest income earned on taxable investments. We believe this adjustment may be useful when comparing yields and
margins for all earning assets. This presentation may also include a discussion of other
non-GAAP financial measures, which, to the extent not so qualified therein or in the Appendix, is qualified by GAAP reconciliation information available on our corporate website at
www.pnc.com under About PNCInvestor Relations. |
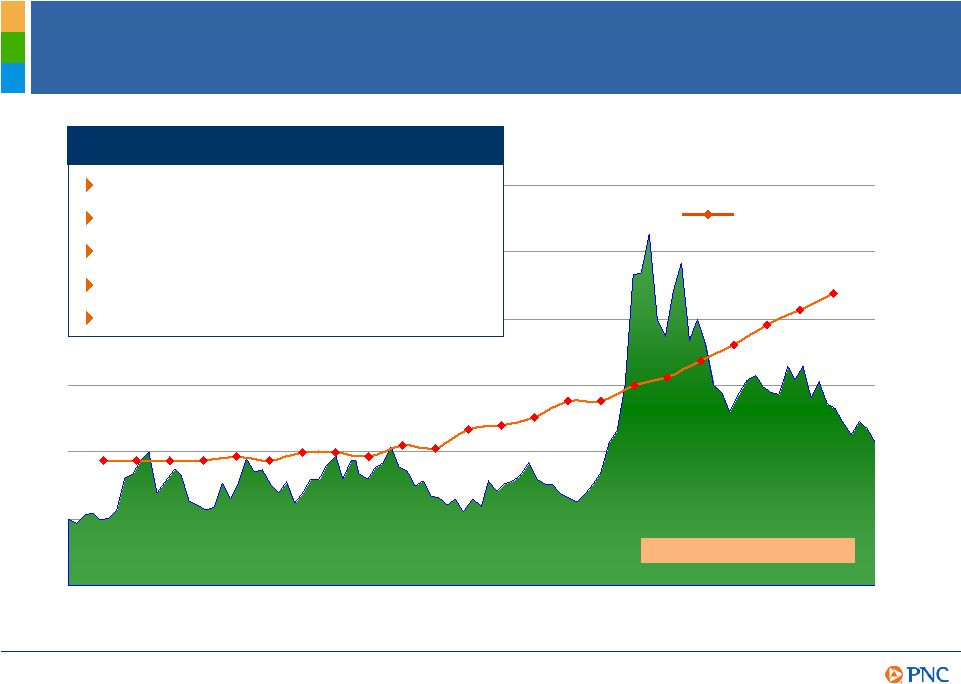
3 A Challenging Operating Environment 0 15 30 45 60 75 90 May 2009 June 2007 December 2007 June 2008 December 2008 CBOE VOLATILITY INDEX Severe volatility Rising unemployment Potential regulatory changes Altered competitive landscape Changing customer needs High levels of uncertainty 4.7% 8.9% Unemployment |

4 Key Messages PNCs successful business model is built to deliver solid results over the long term PNC is off to a strong start in 2009 with 1Q09 net income up 38% versus 1Q08 Strategic execution should leave PNC well- positioned to deliver long term shareholder value |

5 Returning to an overall moderate risk profile Leveraging the brand to grow high quality revenue streams A focus on continuous improvement while investing in innovation Disciplined approach to capital management Strong execution capabilities PNCs Business Model PNCs Business Model |

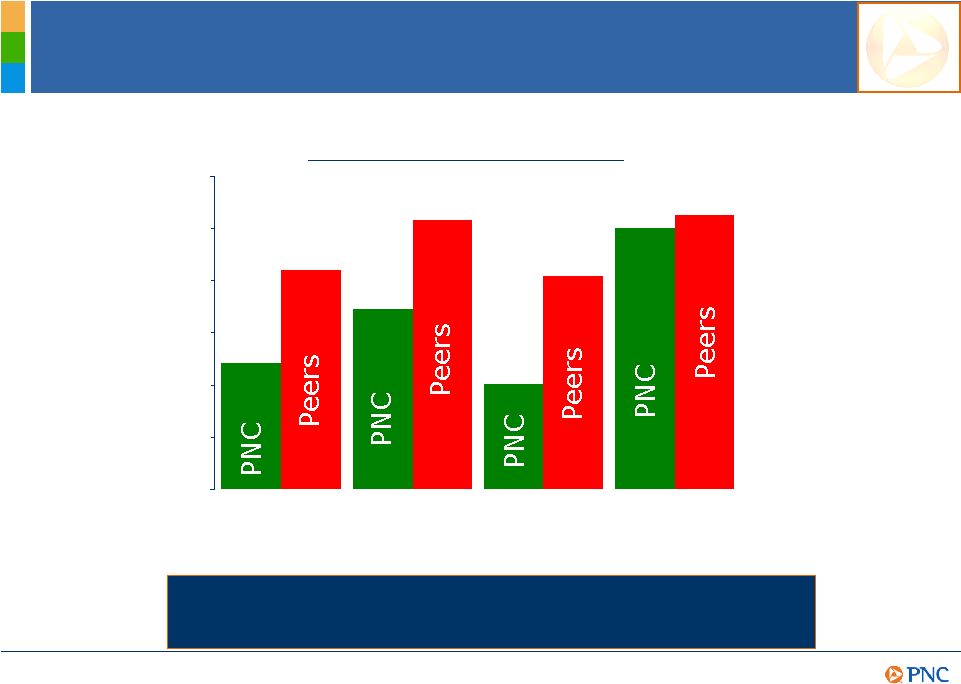
6 PNCs Business Model Positioned Us Well Pretax pre-provision earnings growth Average noninterest-bearing deposit growth Average total deposit growth Average total loan growth 0% 3% 2007 2008 0% 11% 3 year CAGR 6% 11% 5 year CAGR (19%) 11% 3 year CAGR (15%) 9% 5 year CAGR (27%) 15% 2007 2008 12% 14% 5 year CAGR 10% 7% 14% 12% 11% Peers 14% 10% 15% 15% 17% PNC 2007 2008 3 year CAGR 5 year CAGR 3 year CAGR 2007 2008 Growth rates are through December 31, 2008. Averages for total loans, total deposits, and
noninterest bearing deposits are for the year ended, as applicable. (1) Peer comparison
source: SNL DataSource; Peers represents average of banks identified in the Appendix other than PNC. (2) Total revenue less noninterest expense. Further information for PNC is
provided in the Appendix. and gathering low cost deposits
left us well- positioned to deliver long term value. PNCs Business Model PNCs focus on the banking basics of responsible lending
1 2 |
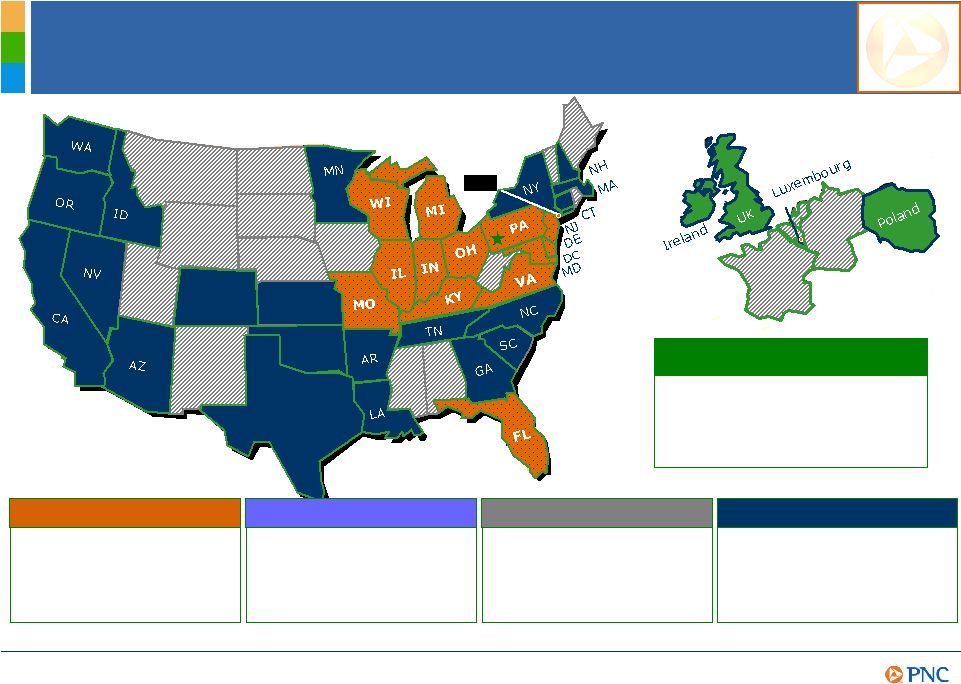
7 Footprint covering nearly 1/3 of the U.S. population Retail A Powerful Franchise BlackRock (offices in 22 countries) BLK CO TX KS OK Global Investment Servicing (international offices) A leading provider of processing, technology and business solutions to the global investment industry Corporate & Institutional A leader in serving middle-market customers and government entities Asset Management One of the nations largest bank-held asset managers Residential Mortgage One of the nations largest mortgage platforms PNCs Business Model |
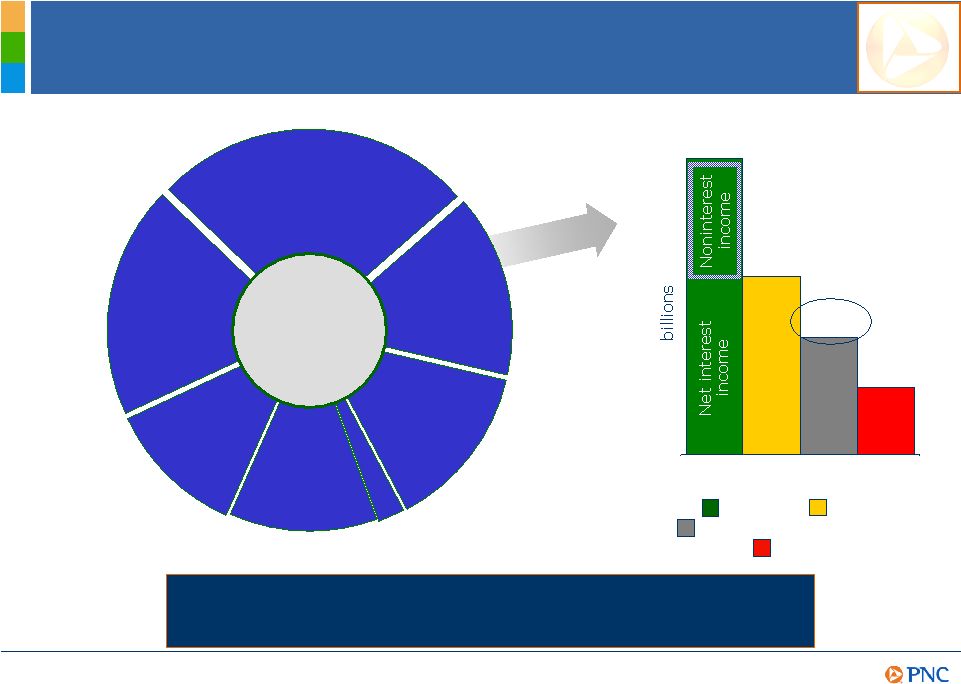
8 Diverse Revenue Streams and Strong Pretax Pre-Provision Earnings PNC Is Recognized for Our Ability to Create Positive Operating PNC Is Recognized for Our Ability to Create Positive Operating Leverage in Anticipation of Increased Credit Costs. Leverage in Anticipation of Increased Credit Costs. Fund servicing $199 Asset management $189 Consumer services $316 Corporate services $245 Residential mortgage $431 Deposit service charges $224 Other $(38) 1Q09 total noninterest income $1.6B (2)% 1Q09 - Noninterest income categories in millions Strong Start to 2009 1Q09 $3.87 $2.33 $1.54 $.88 Revenue Expense Pretax pre-provision earnings Provision (1) Total revenue less noninterest expense. Further information is provided in the Appendix. 13% 12% 20% 27% 16% 14% 1 |

9 Balance Sheet Composition 5 15 Interest-earning deposits with banks 100% 10 5 17 68% 100% 15 60 16 1 3% % of total $286 29 14 48 $195 $286 43 171 46 4 $7 March 31, 2009 Total liabilities and equity Equity Other liabilities Borrowed funds Deposits Total assets Other assets and allowance for loan and lease losses Loans Investment securities Loans held for sale Cash and short-term investments billions (1) Amounts include items for which PNC has elected the fair value option under SFAS 159. (2)
Peers represents average of banks identified in the Appendix, other than PNC. Strong Start to 2009 March 31, 2009 Key Ratios Loans/Assets PNC Peers 60% 64% Loans/Deposits PNC Peers 88% 104% PNCs Commitment to Returning to a Moderate Risk Profile Remains a Top Priority for Creating Long-Term Value. 1 2 1 2 |
10
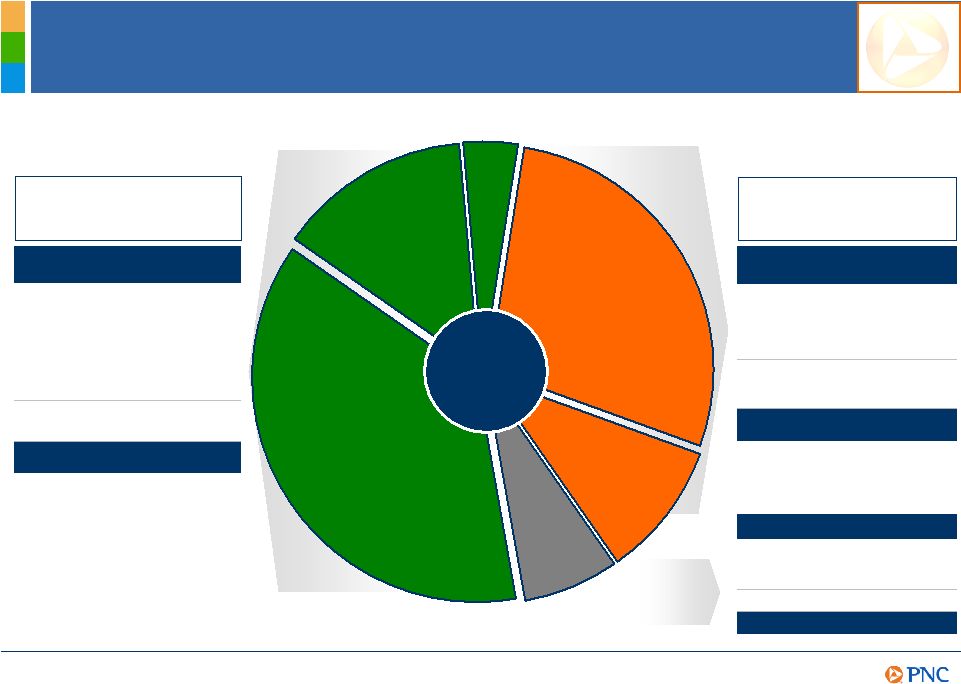
PNCs Loan Mix Strong Start to 2009 $64.4 Commercial Commercial real estate 1Q09 Total loans $171.4 Consumer Residential real estate Impaired 1 Equipment leasing $48.3 $16.7 $11.9 $6.3 $23.8 Nonperforming loans .55% NPLs / consumer lending $0.4 Consumer lending 0.3 Residential real estate $0.1 Consumer 1.2 Commercial real estate Nonperforming loans 2.63% NPLs / comml lending $2.5 Commercial lending 0.1 Equipment leasing $1.2 Commercial Impaired loans 1 39% Fair value mark $11.9 Total 9.5 Consumer lending $2.4 Comml lending Commercial lending of $97 billion represents 57% of total loans Consumer lending of $74 billion represents 43% of total loans Information in billions. (1) Loans acquired in the National City acquisition and impaired in accordance with AICPA Statement of Position 03-3 (SOP 03-3). |
11
PNCs Relative Credit Risk Profile Peer comparison source: SNL DataSource; Peers represents average of banks identified in the Appendix other than PNC. PNC as reported. (1) As of or for the three months ended March 31, 2009. Net charge-offs
percentage is annualized. 0.00% 0.50% 1.00% 1.50% 2.00% 2.50% 3.00% Nonperforming loans to total loans Nonperforming assets to total assets Net charge- offs to average loans (three months ended) Allowance for loan and lease losses to loans 1.73% 2.59% 1.21% 2.11% 1.01% 2.05% 2.51% 2.63% Key 1Q09 Metrics Strong Start to 2009 PNCs Commitment to Prudent Risk Management Is Reflected in Our Credit Metrics. 1 |
12
Strengthening Capital Strong Start to 2009 9.7% 4Q08 1Q09 4.8% 4.9% as reported 4Q08 1Q09 Conducted under more adverse economic conditions Emphasis on Tier 1 common Completed at-the- market offering to raise a modest $600 million in required common equity Supervisory capital assessment program Tier 1 common ratio Tier 1 risk-based ratio 5.2% proforma¹
10.0% as reported 10.3% proforma¹
(1) Includes approximately $600 million in common equity raised through an at-the-market
offering in May 2009. PNC Remains Well-Positioned in Terms of
Capital. |
13
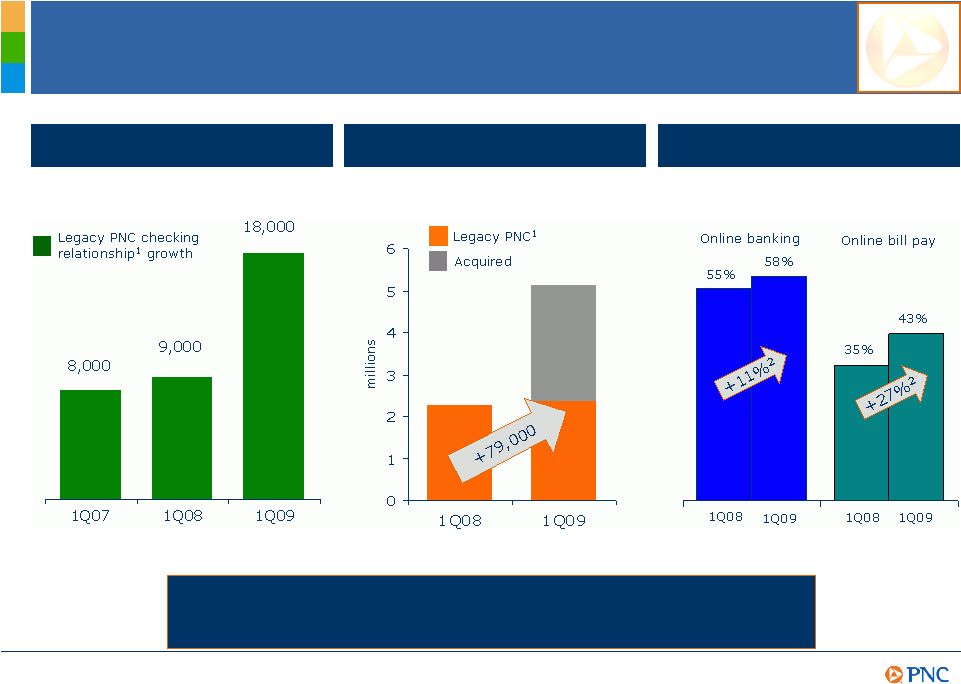
Growing and Deepening Checking Relationships Strategic Execution Growth during the quarter Total retail checking relationships PNC Is Leading the Way in Building Relationships. PNC Is Leading the Way in Building Relationships. Deepening relationships % of legacy PNC consumer DDA households using: (1) Legacy PNC checking relationships exclude relationships added from National City and other
acquisitions. (2) Reflects growth in users. |

14
Virtual Wallet Strategic Execution One of our fastest growing consumer bases Gen-Y will outnumber any other generation by 2017 Total income will surpass Baby Boomers by 2017 PNC Is Leading the Way in Product Innovation. PNC Is Leading the Way in Product Innovation. Average new accounts opened per day at 175+ since launch From 1Q08 to 1Q09 PNC has grown our Gen-Y customer base by 13% Virtual Wallet customers average higher balances and transactions than checking-only accounts High retention rates have greatly exceeded our expectations A slick personal finance tool BUSINESSWEEK A truly inspired effort NETBANKER One of the boldest enhancements to the online banking experience CELENT |

15
A relentless focus on implementing the PNC model Returning to an overall moderate risk profile Leveraging the brand to grow high quality revenue streams A focus on continuous improvement while investing in innovation Disciplined approach to capital management Strong execution capabilities Summary PNC Continues to Build a Great Company. PNC Continues to Build a Great Company. Strategic Execution |

16
Cautionary Statement Regarding Forward-Looking Information Appendix This presentation includes snapshot information about PNC used by way of illustration
and is not intended as a full business or financial review. It should not be
viewed in isolation but rather in the context of all of the information made available by PNC in its SEC filings. We also make statements in this presentation, and we may from time to time make other statements,
regarding our outlook or expectations for earnings, revenues, expenses, capital levels,
liquidity levels, asset quality and/or other matters regarding or affecting PNC that are forward-looking statements within the meaning of the Private Securities Litigation Reform Act. Forward-looking
statements are typically identified by words such as believe,
expect, anticipate, intend, outlook, estimate, forecast, will, project and other similar words and expressions. Forward-looking statements are subject to numerous assumptions, risks and uncertainties, which change over
time. Forward-looking statements speak only as of the date they are made. We do not assume any duty
and do not undertake to update our forward-looking statements. Actual results or
future events could differ, possibly materially, from those that we anticipated in our forward-looking statements, and future results could differ materially from our historical performance. Our forward-looking statements are subject to the following principal risks and
uncertainties. We provide greater detail regarding some of these factors in our
first quarter 2009 Form 10-Q and 2008 Form 10-K, including in the Risk Factors and Risk Management sections of those reports, and in our other SEC filings. Our forward-looking statements may also be subject to other risks and
uncertainties, including those that we may discuss elsewhere in this presentation or in
our filings with the SEC, accessible on the SECs website at www.sec.gov and on or through our corporate website at www.pnc.com/secfilings. We have included these web addresses as inactive textual references
only. Information on these websites is not part of this document.
Our businesses and financial results are affected by business and economic conditions, both
generally and specifically in the principal markets in which we operate. In particular,
our businesses and financial results may be impacted by: o
Changes in interest rates and valuations in the debt, equity and other financial
markets. o
Disruptions in the liquidity and other functioning of financial markets, including such disruptions
in the markets for real estate and other assets commonly securing financial products.
o
Actions by the Federal Reserve and other government agencies, including those that impact money
supply and market interest rates. o
Changes in our customers, suppliers and other counterparties performance in
general and their creditworthiness in particular. o
Changes in customer preferences and behavior, whether as a result of changing business and
economic conditions or other factors.
A continuation of recent turbulence in significant portions of the US and global financial markets,
particularly if it worsens, could impact our performance, both directly by affecting our
revenues and the value of our assets and liabilities and indirectly by affecting our counterparties and the economy generally.
Our business and financial performance could be impacted as the financial industry restructures in
the current environment, both by changes in the creditworthiness and performance of our
counterparties and by changes in the competitive landscape.
Given current economic and financial market conditions, our forward-looking
financial statements are subject to the risk that these conditions will be substantially
different than we are currently expecting. These statements are based on our current expectations that interest rates will remain low through 2009 with continued wide market credit spreads, and our view that national economic trends
currently point to a continuation of severe recessionary conditions in 2009 followed by
a subdued recovery. |

17
Cautionary Statement Regarding Forward-Looking Information (continued)
Appendix
Legal and regulatory developments could have an impact on our ability to operate our businesses or
our financial condition or results of operations or our competitive position or
reputation. Reputational impacts, in turn, could affect matters such as business generation and retention, our ability to attract and retain management, liquidity, and funding. These legal and
regulatory developments could include: o
Changes resulting from the Emergency Economic Stabilization Act of 2008, the American Recovery and Reinvestment Act of
2009, and other developments in response to the current economic and financial industry environment,
including current and future conditions or restrictions imposed as a result of our
participation in the TARP Capital Purchase Program. o
Legislative and regulatory reforms generally, including changes to laws and regulations
involving tax, pension, bankruptcy, consumer protection, and other aspects of the
financial institution industry. o
Increased litigation risk from recent regulatory and other governmental developments. o
Unfavorable resolution of legal proceedings or regulatory and other governmental inquiries.
o
The results of the regulatory examination and supervision process, including our failure to
satisfy the requirements of agreements with governmental agencies. o
Changes in accounting policies and principles.
Our issuance of securities to the US Department of the Treasury may limit our ability to return
capital to our shareholders and is dilutive to our common shares. If we are
unable previously to redeem the shares, the dividend rate increases substantially after five years.
We intend to meet the requirement under the Supervisory Capital Assessment Program that we increase
the common shareholders equity component of Tier 1 capital by $600 million through
a combination of growth in retained earnings and other capital raising alternatives. Our
ability to increase common shareholders equity through capital raising transactions will be dependent on market conditions at the time of the transactions. Market conditions will also affect the extent to which such transactions
are dilutive to our existing common shareholders. If we fail to meet this
requirement in advance of the November 9, 2009 deadline in the manner we plan to do so, we would likely be required to meet the requirement through conversion of a portion of the preferred stock issued to the US Treasury
under the TARP Capital Purchase Program into mandatorily convertible preferred stock or by otherwise issuing common equity securities to the US Treasury. Such a transaction could be more dilutive to our common shareholders than other means of meeting this requirement and
could result in the imposition of additional limitations on the conduct of our business by the
US Treasury.
Our business and operating results are affected by our ability to identify and effectively manage
risks inherent in our businesses, including, where appropriate, through the
effective use of third-party insurance, derivatives, and capital management techniques.
The adequacy of our intellectual property protection, and the extent of any costs associated with
obtaining rights in intellectual property claimed by others, can impact our
business and operating results.
Our ability to anticipate and respond to technological changes can have an impact on our ability to
respond to customer needs and to meet competitive demands.
Our ability to implement our business initiatives and strategies could affect our financial
performance over the next several years.
Competition can have an impact on customer acquisition, growth and retention, as well as on our
credit spreads and product pricing, which can affect market share, deposits
and revenues.
Our business and operating results can also be affected by widespread natural disasters, terrorist
activities or international hostilities, either as a result of the impact on
the economy and capital and other financial markets generally or on us or on our customers, suppliers or other counterparties specifically. |

18
Cautionary Statement Regarding Forward-Looking Information (continued)
Appendix Also, risks and uncertainties that could affect the results anticipated in
forward-looking statements or from historical performance relating
to our equity interest in BlackRock, Inc. are discussed in more detail in BlackRocks filings with the SEC, including in the Risk Factors sections of BlackRocks reports. BlackRocks SEC
filings are accessible on the SECs website and on or through BlackRocks website at www.blackrock.com. This material is referenced for
informational purposes only and should not be deemed to constitute a
part of this document. In addition, our recent acquisition of National City Corporation (National
City) presents us with a number of risks and uncertainties
related both to the acquisition transaction itself and to the integration of the acquired businesses into PNC. These risks and uncertainties include the following: The anticipated benefits of the transaction, including anticipated cost savings
and strategic gains, may be significantly harder or take longer to
achieve than expected or may not be achieved in their entirety as a result of unexpected factors or events. Our ability to achieve anticipated results from this transaction is dependent on
the state going forward of the economic and financial markets, which
have been under significant stress recently. Specifically, we may incur more credit losses from National Citys loan portfolio than expected. Other issues related to achieving
anticipated financial results include the possibility that deposit
attrition or attrition in key client, partner and other relationships may be greater than expected. Litigation and governmental investigations currently pending against National
City, as well as others that may be filed or commenced relating to
National Citys business and activities before the acquisition, could adversely impact our financial results. Our ability to achieve anticipated results is also dependent on our ability to
bring National Citys systems, operating models, and controls
into conformity with ours and to do so on our planned time schedule. The integration of National Citys business and operations into PNC, which will include conversion of National Citys
different systems and procedures, may take longer than anticipated or
be more costly than anticipated or have unanticipated adverse results relating to National Citys or PNCs existing businesses. PNCs ability to integrate National City successfully may be
adversely affected by the fact that this transaction will result in
PNC entering several markets where PNC did not previously have any meaningful retail presence. In addition to the National City transaction, we grow our business from time to
time by acquiring other financial services companies. Acquisitions in
general present us with risks, in addition to those presented by the nature of the business acquired, similar to some or all of those described above relating to the National City
acquisition. Any annualized, proforma, estimated, third party or consensus numbers in this
presentation are used for illustrative or comparative purposes only
and may not reflect actual results. Any consensus earnings estimates are calculated based on the earnings projections made by analysts who cover that company. The
analysts opinions, estimates or forecasts (and therefore the consensus earnings estimates) are theirs alone, are not those of PNC or its
management, and may not reflect PNCs, National Citys, or
other companys actual or anticipated results. |

19
Non-GAAP to GAAP Reconcilement Appendix Dec 31 Mar 31 2008 2009 Change in millions Total revenue $1,676 $3,871 Noninterest expense 1,129 2,328 Pretax pre-provision earnings $547 $1,543 $996 For the three months ended 2003 2004 2005 2006 (a) 2007 2008 '07-'08 Change '05-'08 CAGR '03-'08 CAGR Total revenue $5,253 $5,541 $6,327 $8,572 $6,705 $7,190 Noninterest expense 3,476 3,712 4,306 4,443 4,296 4,430 Pretax pre-provision earnings $1,777 $1,829 $2,021 $4,129 $2,409 $2,760 15% 11% 9% (a) Includes the impact on both revenue and expense of the BlackRock/MLIM transaction. PNC believes that pretax pre-provision earnings is useful as a tool to help evaluate ability to
provide for credit costs through operations. For the year ended December 31
|

20
Peer Group of Banks Appendix The PNC Financial Services Group, Inc. PNC BB&T Corporation BBT Bank of America Corporation BAC Capital One Financial, Inc. COF Comerica Inc. CMA Fifth Third Bancorp FITB JPMorgan Chase JPM KeyCorp KEY M&T Bank MTB Regions Financial Corporation RF SunTrust Banks, Inc. STI U.S. Bancorp USB Wells Fargo & Company WFC Ticker |