SLIDE PRESENTATION
Published on May 20, 2008

The PNC
Financial Services Group, Inc. Lehman Brothers Financial Services Conference London May 20, 2008 Exhibit 99.1 |

Cautionary
Statement Regarding Forward-Looking Information and Adjusted Information This presentation contains forward-looking statements regarding our outlook or expectations
relating to PNCs future business, operations, financial condition, financial
performance and asset quality. Forward-looking statements are necessarily subject to numerous assumptions, risks and uncertainties, which change over time. The forward-looking statements in this presentation are qualified by the factors affecting
forward-looking statements identified in the more detailed Cautionary Statement included in the Appendix, which is included in the version of the presentation materials posted on our corporate website at www.pnc.com/investorevents. We provide greater detail regarding these factors in our 2007 Form 10-K and first quarter 2008 Form 10-Q, including in the Risk Factors and Risk Management sections, and in our other SEC reports (accessible on the
SECs website at www.sec.gov and on or through our corporate website at
www.pnc.com/secfilings). Future events or circumstances may change our outlook or
expectations and may also affect the nature of the assumptions, risks and uncertainties to which our forward-looking statements are subject. The forward-looking statements
in this presentation speak only as of the date of this presentation. We do not assume any duty and do not undertake to update those statements. In this presentation, we will sometimes refer to adjusted results to help illustrate the impact of
the deconsolidation of BlackRock near the end of third quarter 2006 and the impact of
certain types of items. Unless otherwise indicated, adjusted results reflect, as applicable, the following types of adjustments: (1) 2006 and earlier periods reflect the impact of the deconsolidation of BlackRock by adjusting as if we had recorded our BlackRock investment on the equity method prior to its deconsolidation; (2) adjusting 2006 periods, as
applicable, to exclude the impact of the third quarter 2006 gain on the BlackRock/MLIM transaction and losses on the repositioning of PNCs securities and mortgage loan portfolios; (3) adjusting fourth quarter 2006 and 2007 periods to exclude the net mark-to-market adjustments on PNCs
remaining BlackRock LTIP shares obligation and, as applicable, the gain PNC recognized
in first quarter 2007 in connection with the companys transfer of BlackRock shares to satisfy a portion of its BlackRock LTIP shares obligation; (4) adjusting 2007 and 2006 periods to exclude, as applicable, integration costs related to
acquisitions and to the BlackRock/MLIM transaction; (5) adjusting 2007 periods, as applicable, for the fourth quarter 2007 Visa litigation charge; and (6) adjusting, as appropriate, for the tax impact of these adjustments. We have provided these adjusted amounts
and reconciliations so that investors, analysts, regulators and others will be better able to evaluate the impact of these items on our results for the periods presented, in addition to providing a basis of comparability for the impact of the BlackRock deconsolidation given the magnitude of the
impact of deconsolidation on various components of our income statement and balance sheet. We believe that information as adjusted for the impact of the specified items may be useful due to the extent to which these items are not indicative of our ongoing operations as the result of our
management activities on those operations. While we have not provided other
adjustments for the 2007 and earlier periods discussed, this is not intended to imply that there could not have been other similar types of adjustments, but any such adjustments would not have been similar in magnitude to the amount of the adjustments shown. In certain discussions, we may also provide revenue information on a taxable-equivalent basis
by increasing the interest income earned on tax- exempt assets to make it fully
equivalent to interest income earned on taxable investments. We believe this adjustment may be useful when comparing yields and margins for all earning assets. This presentation may also include a discussion of other non-GAAP financial measures, which, to
the extent not so qualified therein or in the Appendix, is qualified by GAAP reconciliation information available on our corporate website at www.pnc.com under About PNC - Investor Relations. |

Clear
strategies and strong execution Maintaining a moderate risk profile Creating positive operating leverage - Ability to grow high-quality diverse revenue streams - A well-positioned balance sheet for strong net interest income growth - A continuous improvement culture Building capital flexibility and strong liquidity PNC - Designed to Consistently Deliver Strong Results A business model differentiated by: |

PNC Corporate
Profile Market cap $24 billion Assets $140 billion Loans $71 billion Deposits $80 billion Branches 1,096 ATMs 3,903 Employees 27,335 Highlights¹
(1) As of March 31, 2008, not including market cap. Market cap as of May 6, 2008. Loans
are net of unearned income. One of the largest financial services companies in the United States Diversified mix of business segments: - Retail Banking - Corporate & Institutional Banking - PFPC - BlackRock Focus on enterprise risk management Commitment to long-term shareholder value History of serving our key constituencies Overview |

Key Growth
Statistics PNC Has a Demonstrated Ability to Deliver Solid Results 7% 10% Net interest income 7% 9%¹
Noninterest income 8% 10%¹
Total revenue Peers 2 PNC Compound annual growth 2003-2007 (1%) 5% Diluted EPS 4% 10% Net income 12% 19% Assets (1) PNC noninterest income and total revenue are presented as adjusted for the deconsolidation of
BlackRock, BlackRock/MLIM transaction integration costs, and gains/losses related to
PNCs BlackRock LTIP shares obligation, and are reconciled to GAAP amounts in the Appendix. PNC reported CAGR was 4% for noninterest income and 6% for total revenue. (2) Peers reflects average of the
super-regional banks identified in the Appendix other than PNC. |
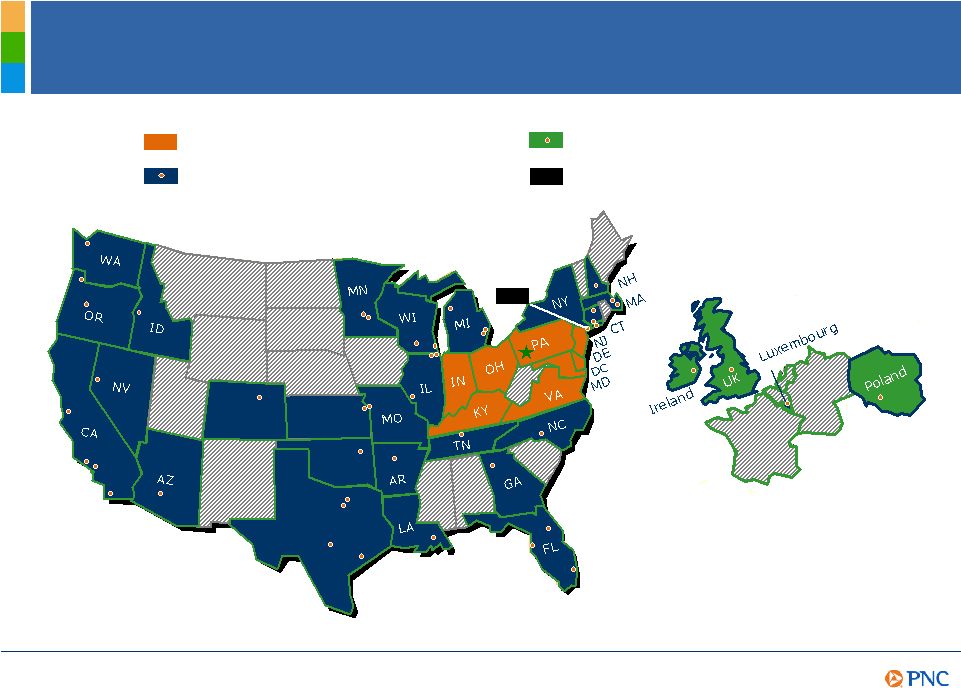
PNC
Franchise Retail Banking Footprint Corporate & Institutional Offices PFPC International Offices BlackRock Headquarters (60 offices in 19 countries) BLK CO TX KS BLK |

PNC 2008
Execution Highlights Delivered solid 1Q08 results in a difficult environment 1Q08 net income of $377 million or $1.09 per diluted share Posted strong revenue growth Created positive operating leverage Maintained a well-positioned balance sheet Asset quality performed as expected Strengthened our Tier 1 capital ratio Increased our dividend PNCs Ability to Execute Yielded Positive Results, Despite Market Volatility |

Clear
strategies and strong execution Maintaining a moderate risk profile Creating positive operating leverage - Ability to grow high-quality diverse revenue streams - A well-positioned balance sheet for strong net interest income growth - A continuous improvement culture Building capital flexibility and strong liquidity PNC - Designed to Consistently Deliver Strong Results A business model differentiated by: |
PNC
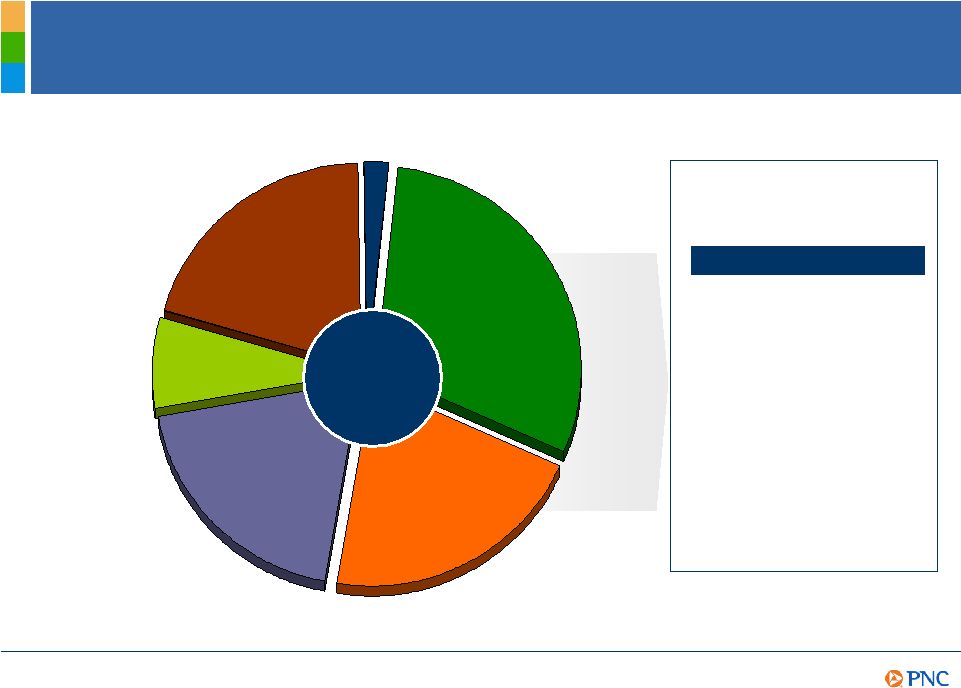
51 % Wachovia 59 Wells Fargo 65 US Bancorp 65 Regions 67 BB&T 68 SunTrust 69 Fifth Third 73 National City 75 KeyCorp 75 Comerica 78 Balanced Asset Mix Less Dependent on Credit Cash, FF sold, other short- term investments Other Assets Consumer loans, including residential mortgage Commercial lending Securities available for sale Loans held for sale 30% 21% 19% 7% 2% 21% Total Assets $140 billion As of March 31, 2008. Peer comparison source: SNL DataSource. Loans/Assets As of March 31, 2008 |

Consumer Loan
Portfolio Auto 5% Residential mortgage 32% Home Equity Portfolio Credit Statistics¹
First lien positions 39% In-footprint exposure 93% Weighted average: Loan to value 72% FICO scores 725 Net charge-offs²
0.35% 90 days past due 0.42% Other 14% Home equity 49% Residential Mortgage Portfolio Credit Statistics¹
Weighted average: Loan to value 67% FICO scores 747 Net charge-offs²
0.02% 90 days past due 0.91% As of March 31, 2008. (1) Includes loans from acquired portfolios for which lien position and loan-to-value
information was limited and represents most recent FICO scores we have on file, where applicable. (2) For the quarter ended March 31, 2008. Total portfolio $29 billion |

Commercial
Lending Portfolio Commercial - other 58% Asset- based 12% Commercial real estate 22% Equip. leasing 8% Total portfolio $42 billion As of March 31, 2008. (1) Excludes $44 million charge-off increase due to the realignment of charge-off policies in the first quarter of 2008. Percentage including the impact of the realignment was .72%. $.273 $9.1 Total .042 1.3 Other --- .4 Land .007 .6 Hotel .003 .7 Industrial .014 .9 Multi-family .016 1.5 Retail .007 1.6 Office $.184 $2.1 Residential Commercial Lending Portfolio Statistics Comml net charge-offs to average comml loans, adjusted .29%¹
Nonperforming comml loans to total comml loans 1.25% Largest nonperforming asset $20 million Average nonperforming commercial
loan $490 thousand Commercial Real Estate Type Outstanding Nonperforming billions
billions Commercial Real Estate Statistics CRE net charge-offs to average CRE
loans .49% Nonperforming CRE loans to total CRE
loans 3.02% Average
nonperforming CRE loan $2 million |
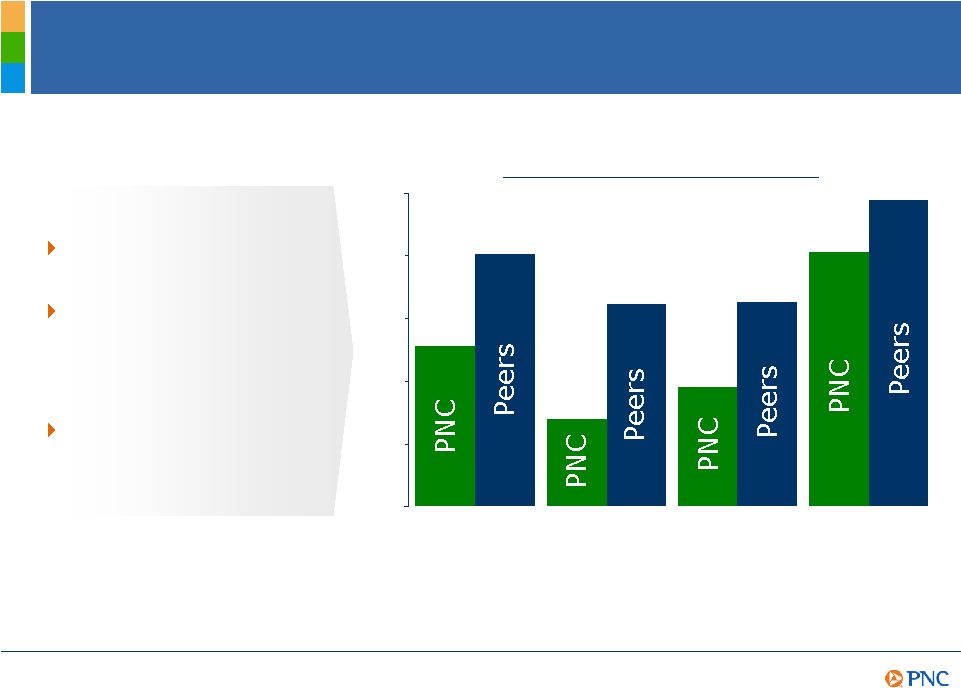
Strategic
Decisions and Operating Discipline Result in a Strong Relative Credit Risk Profile
Peer comparison source: SNL DataSource; Peer Group represents average of super-regional
banks identified in the Appendix other than PNC. PNC as reported. 0.00% 0.30% 0.60% 0.90% 1.20% 1.50% Nonperforming loans to total loans Nonperforming assets to total assets Net charge- offs to average loans (three months ended) Allowance for loans and lease losses to loans .77% 1.21% .42% .97% .57% .98% 1.22% 1.47% Key 1Q08 Metrics Credit decisions driven by risk-adjusted returns Minimal exposure to subprime mortgages, high-yield bridge and leveraged finance loans Highly granular portfolio |

Clear
strategies and strong execution Maintaining a moderate risk profile Creating positive operating leverage - Ability to grow high-quality diverse revenue streams - A well-positioned balance sheet for strong net interest income growth - A continuous improvement culture Building capital flexibility and strong liquidity PNC - Designed to Consistently Deliver Strong Results A business model differentiated by: |
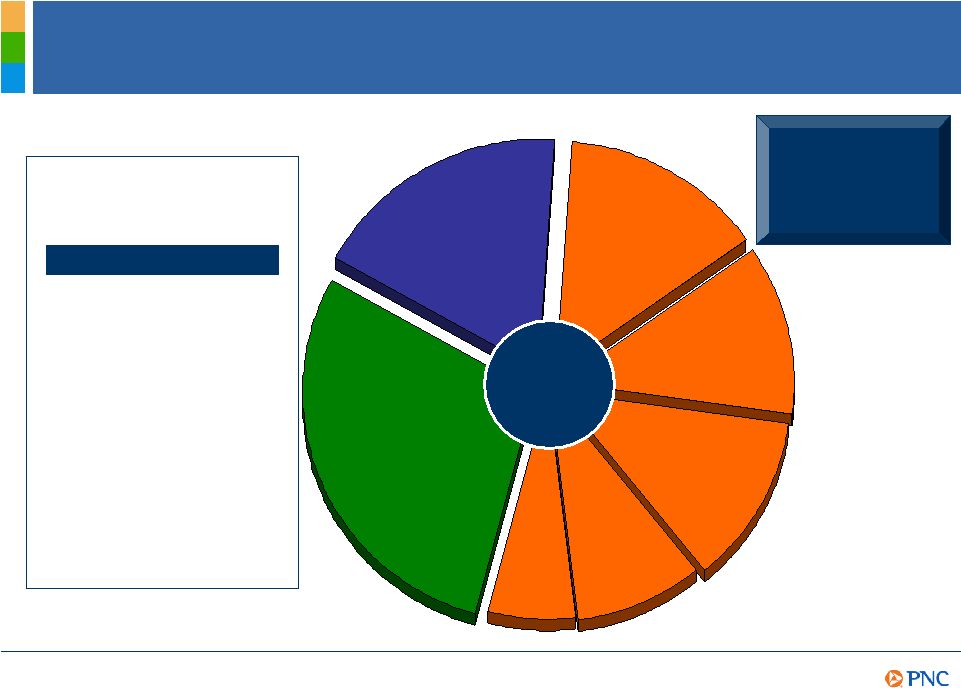
PNC 53 % US Bancorp 53 National City 52 Fifth Third 52 SunTrust 48 Regions 47 Wells Fargo 46 BB&T 43 KeyCorp 43 Wachovia 39 Comerica 33 Diverse and Valuable Revenue Stream Deposit and other net interest income Loan net interest income 14% 29% 18% Asset management 12% Consumer services and deposit charges 12% Fund servicing 9% Corporate services 6% Other Noninterest Income to Total Revenue 1Q08 Total revenue $1.8 billion For the three months ended March 31, 2008. The sum of deposit NII and loan NII equals GAAP
net interest income. Further information regarding revenue mix is provided in the
Appendix. Peer comparison source: SNL DataSource. 1Q08 Contribution to
Total Revenue Revenue growth +13% 1Q08 vs. 1Q07 |
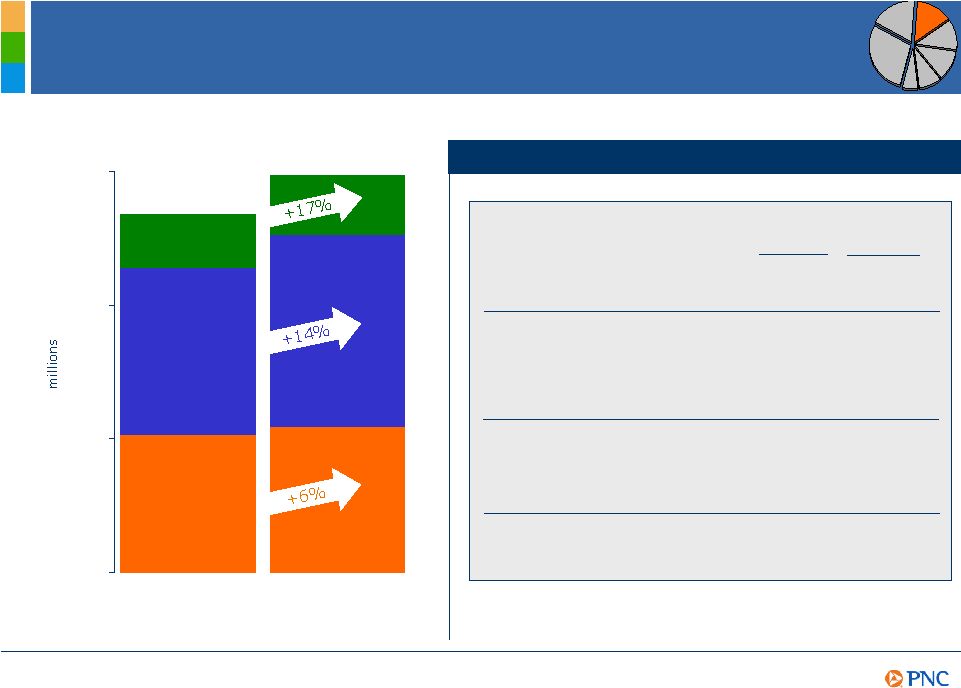
Retail
checking relationships (millions) 2.31 +17%²
Consumer online banking users 55% +18%³
Consumer online bill-pay users 35% +61%³
Retail average deposits 4 (billions) Noninterest-bearing demand $10.5 +18% Total transaction deposits $37.4 +14% Financial consultants¹
387 +11% Consumer Services, Deposit Charges and Brokerage (1) Excludes brokerage revenue associated with Hilliard Lyons of $29 million and $33 million for 1Q08 and 1Q07, respectively, and financial consultants associated with Hilliard Lyons. The sale of Hilliard Lyons was completed on March 31,
2008. (2) Amounts at March 31, 2007 do not include the impact of Mercantile. (3) Reflects growth in users. (4) For quarter ended March
31. March 31 2008 Key drivers $0 $75 $150 $225 1Q08 1Q07 Revenue Sources¹
Consumer services Deposit charges Brokerage - PNC Investments Change vs. March 31 2007 |
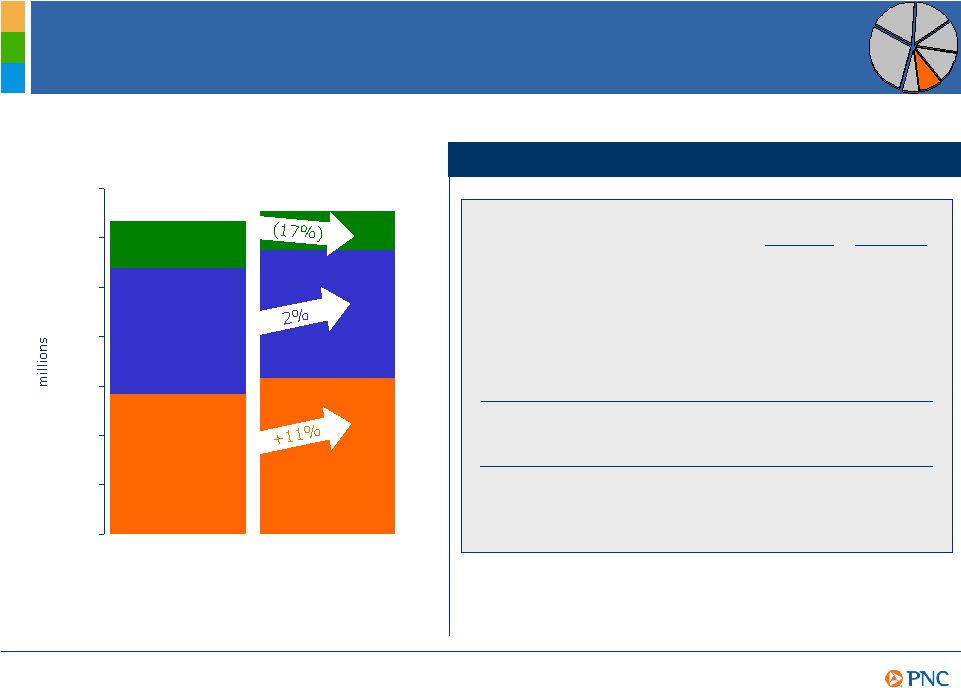
BlackRock¹
AUM (billions) Equity and balanced $427 Fixed income 515 Cash management 349 Alternative investments 74 Total $1,364 Change from March 31, 2007 +18% PNC Wealth Management AUM (billions) Equity $36 Fixed income 17 Liquidity/Other 12 Total $65 Asset Management (1) Represents total BlackRock, Inc. amounts. PNC owned 33% of BlackRock at March 31,
2008. March 31, 2008 Key drivers $0 $75 $150 $225 1Q08 1Q07 PNC Wealth Management BlackRock Revenue Sources |
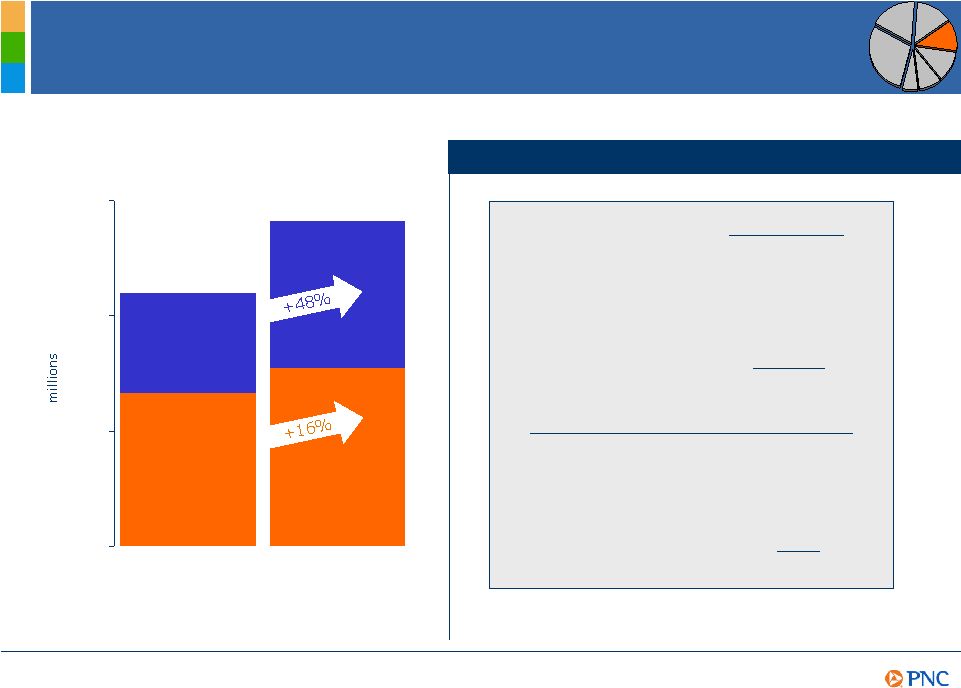
Fund
Servicing $0 $50 $100 $150 $200 $250 1Q08 1Q07 Accounting/administration net fund assets (billions) Domestic $875 +20% Offshore $125 +37% Custody fund assets (billions) $476 +9% Total assets serviced (billions) $2,600 +18% Shareholder accounts (millions) Transfer agency 19 +6% Subaccounting 57 +14% Change vs. March 31 2007 March 31 2008 Key drivers Investor services Securities services Financial advisor services Revenue Sources |
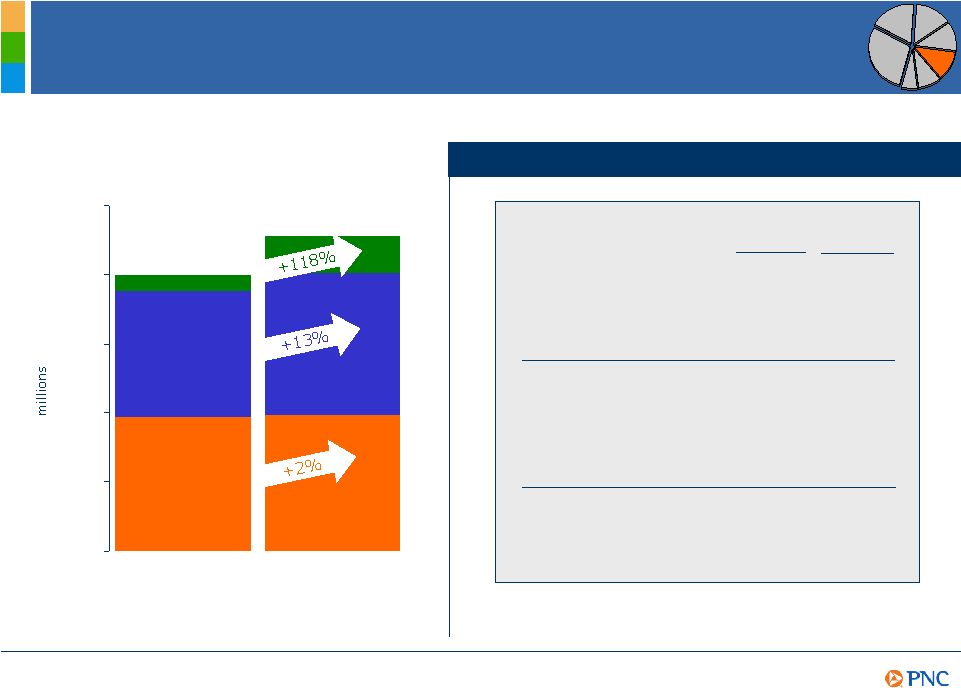
Corporate
Services Key drivers $0 $25 $50 $75 $100 $125 $150 $175 1Q08 1Q07 Corporate & Institutional (average billions) Noninterest-bearing demand deposits $7.5 +6% Money market deposits $5.0 +11% Loans $24.4 +25% Commercial mortgage servicing portfolio (at March 31,
billions)
$244 +18% Commercial card (including
P-card)
Transaction volume +32% Processed dollar volume +26% Change vs. 1Q07 1Q08 Treasury management Capital markets and other Mortgage servicing Revenue Sources |
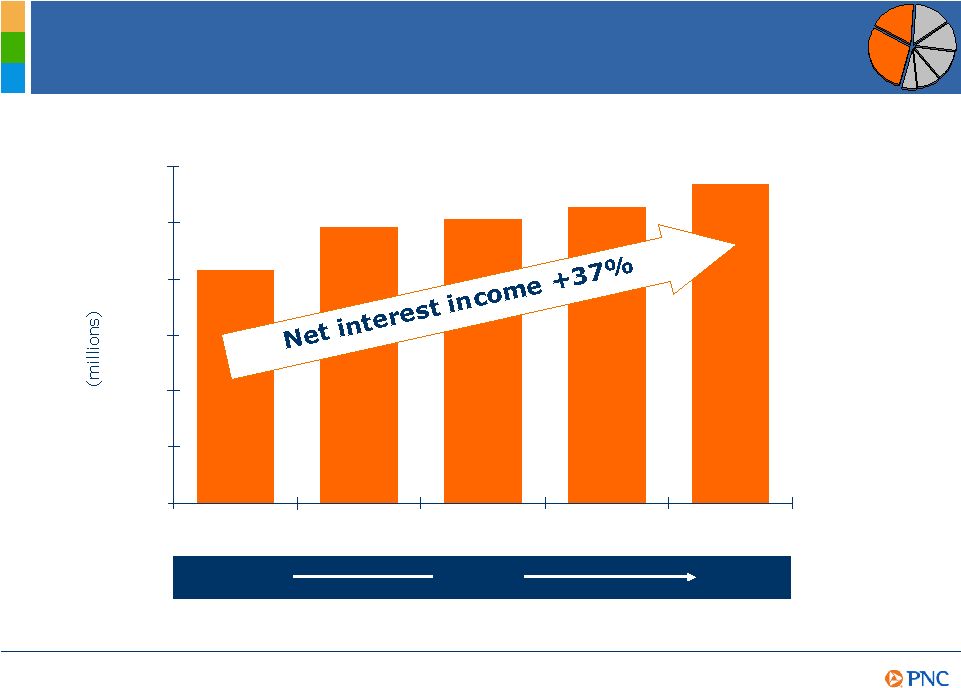
Strong Net
Interest Income Growth $623 $738 $761 $793 $854 $0 $150 $300 $450 $600 $750 $900 1Q07 2Q07 3Q07 4Q07 1Q08 Net interest margin 2.95% 3.09% +14bps |
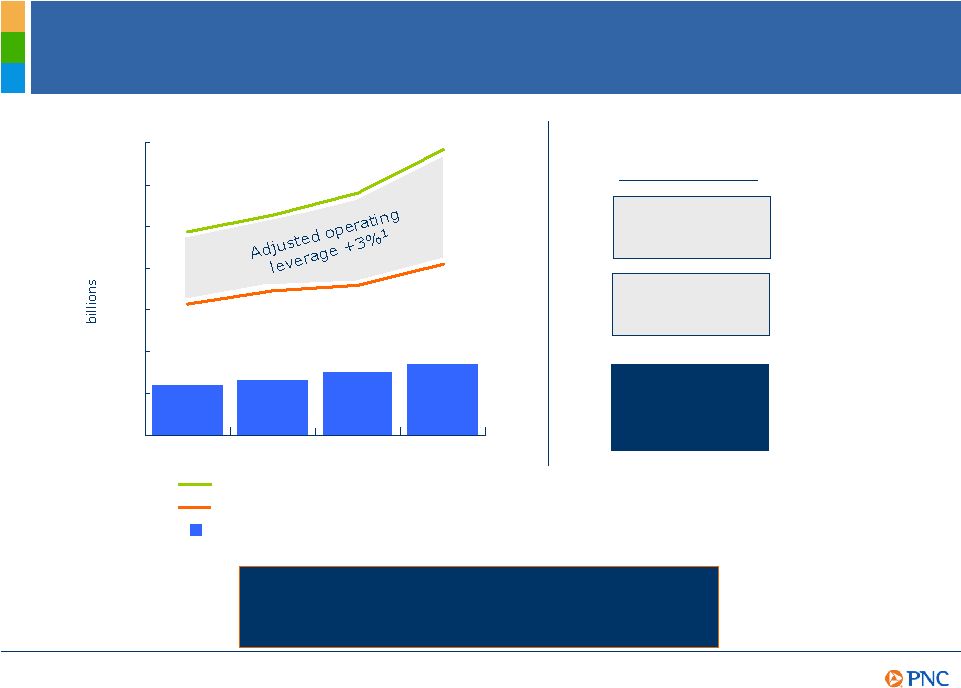
$0 $1 $2 $3 $4 $5 $6 $7 Creating Positive Operating Leverage Adjusted revenue²
Adjusted noninterest expense³
Adjusted net income 4 $1.2 $1.3 $1.5 (1) As reported: revenue 7%, expense 5%, operating leverage 2%. Adjusted amounts are reconciled to GAAP amounts in the Appendix. (2) As reported $5.5 billion, $6.3 billion, $8.6 billion, $6.7 billion for 2004, 2005, 2006, 2007,
respectively. (3) As reported $3.7 billion, $4.3 billion, $4.4 billion, $4.3 billion for
2004, 2005, 2006, 2007, respectively. (4) As reported $1.2 billion, $1.3 billion, $2.6
billion, $1.5 billion for 2004, 2005, 2006, 2007, respectively. 2004 2005 2006 Revenue +13% Expense +10% 1Q08 vs. 1Q07 Operating Leverage +3% $1.7 2007 PNCs Disciplined Growth Strategies Help Drive Positive Operating Leverage
and EPS Growth |

Clear
strategies and strong execution Maintaining a moderate risk profile Creating positive operating leverage - Ability to grow high-quality diverse revenue streams - A well-positioned balance sheet for strong net interest income growth - A continuous improvement culture Building capital flexibility and strong liquidity PNC - Designed to Consistently Deliver Strong Results A business model differentiated by: |
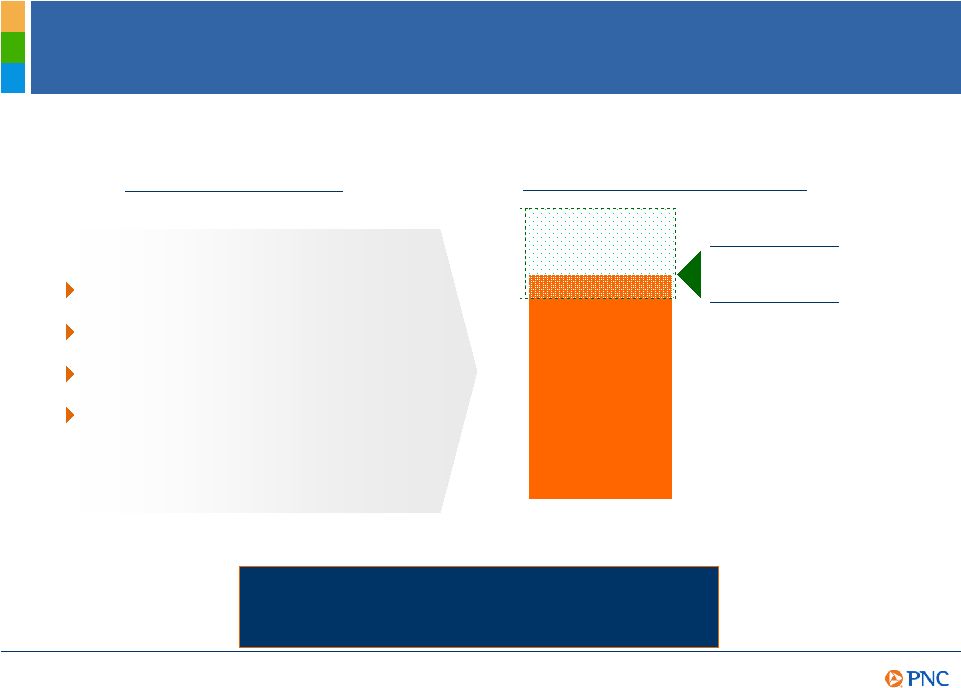
Strong
earnings Access to capital markets Return to shareholders Investing in our businesses Target Range Building Our Capital Flexibility Tier 1 Capital Ratio 7.7% (at March 31, 2008) Sources/Uses PNCs Execution and Disciplined Use of Capital Help Build Flexibility 8.5% 7.5% |

Well-Positioned from a Liquidity Standpoint Net loans and leases to total deposits Net non-core funding dependence Net short-term liabilities to total assets On hand liquidity to total liabilities Reliance on wholesale funding Source: Bank Research Spotlight, Lehman Brothers, Global Equity Research, March 25, 2008 [Data as of 3Q07], SNL Financial. Peer Group Composite Ranking Lehman Brothers Criteria 1 PNC 2 Regions 3 Comerica 4 Fifth Third 5 BB&T 6 SunTrust 7 Wachovia 8 KeyCorp 9 Wells Fargo 10 National City 11 US Bancorp |

Summary
PNC Is Continuing to Build a Great Company Clear strategies and strong execution Commitment to a moderate risk profile Ability to grow high quality revenue streams Focus on continuous improvement Disciplined capital management processes Strong liquidity PNCs
leave us well-positioned for the future |

Cautionary
Statement Regarding Forward-Looking Information Appendix We make statements in this presentation, and we may from time to time make other statements, regarding our outlook or expectations for earnings, revenues, expenses and/or other matters regarding or affecting PNC that are
forward-looking statements within the meaning of the Private Securities Litigation Reform Act. Forward-looking statements are typically identified by words such as believe, expect, anticipate, intend, outlook, estimate, forecast, will, project and other similar words and expressions. Forward-looking statements are subject to numerous assumptions, risks and uncertainties, which
change over time. Forward-looking statements speak only as of the date they
are made. We do not assume any duty and do not undertake to update our forward-looking statements. Because forward-looking statements are subject to assumptions and uncertainties, actual results or future events could differ, possibly materially, from those that we anticipated in our forward-looking statements, and future results could differ
materially from our historical performance. Our forward-looking statements are
subject to the following principal risks and uncertainties. We provide greater detail regarding some of these factors in our 2007 Form 10-K and our Form 10-Q for the quarter ended March 31, 2008,
including in the Risk Factors and Risk Management sections of those reports, and in our
other SEC reports. Our forward-looking statements may also be subject to other risks and uncertainties, including those that we may discuss elsewhere in this presentation or in our filings with the SEC,
accessible on the SECs website at www.sec.gov and on or through our corporate
website at www.pnc.com/secfilings. Our businesses and financial results are
affected by business and economic conditions, both generally and specifically in the principal markets in which we operate. In particular, our businesses and financial results may be impacted
by: Changes in interest rates and valuations in the debt, equity and other financial markets. Disruptions in the liquidity and other functioning of financial markets, including such
disruptions in the markets for real estate and other assets commonly securing financial
products. Actions by the Federal Reserve and other government agencies, including
those that impact money supply and market interest rates. Changes in our
customers, suppliers and other counterparties performance in general and their creditworthiness in particular. Changes in customer preferences and behavior, whether as a result of changing business and
economic conditions or other factors. A continuation of recent turbulence in
significant portions of the global financial markets could impact our performance, both directly by affecting our revenues and the value of our assets and liabilities and indirectly by affecting the economy
generally. Given current economic and financial market conditions, our
forward-looking financial statements are subject to the risk that these conditions will be substantially different than we are currently expecting. These statements are based on our
current expectations that interest rates will remain low through 2008 with continued wide market credit spreads and our view that national economic conditions currently point toward a mild recession. Our operating results are affected by our liability to provide shares of BlackRock common
stock to help fund certain BlackRock long-term incentive plan (LTIP)
programs, as our LTIP liability is adjusted quarterly (marked-to-market) based on changes in BlackRocks common stock price and the number of remaining committed shares, and we recognize gain or loss on such shares at such
times as shares are transferred for payouts under the LTIP programs. Legal and regulatory developments could have an impact on our ability to operate our
businesses or our financial condition or results of operations or our competitive
position or reputation. Reputational impacts, in turn, could affect matters such as business generation and retention, our ability to attract and retain management, liquidity, and funding. These legal
and regulatory developments could include: (a) the unfavorable resolution of
legal proceedings or regulatory and other governmental inquiries; (b) increased litigation risk from recent regulatory and other governmental developments; (c) the results of the regulatory examination process, our failure to satisfy the requirements of agreements with governmental agencies, and regulators future use of supervisory and enforcement tools; (d) legislative and regulatory reforms, including changes to laws and regulations involving tax, pension, education lending, and the protection of
confidential customer information; and (e) changes in accounting policies and
principles. |

Cautionary
Statement Regarding Forward-Looking Information (continued)
Appendix Our business and operating results are affected by our ability to identify and effectively
manage risks inherent in our businesses, including, where appropriate, through the
effective use of third-party insurance, derivatives, and capital management techniques. The adequacy of our intellectual property protection, and the extent of any costs associated
with obtaining rights in intellectual property claimed by others, can impact our business and operating results. Our ability to anticipate and respond to technological changes can have an impact on our
ability to respond to customer needs and to meet competitive demands. Our ability to implement our business initiatives and strategies could affect our financial performance over the next several years. Competition can have an impact on customer acquisition, growth and retention, as well as on
our credit spreads and product pricing, which can affect market share, deposits and revenues. Our business and operating results can also be affected by widespread natural disasters,
terrorist activities or international hostilities, either as a result of the impact on the economy and capital and other financial markets generally or on us or on our customers, suppliers or other counterparties specifically. Also, risks and uncertainties that could affect the results anticipated in
forward-looking statements or from historical performance relating to our equity
interest in BlackRock, Inc. are discussed in more detail in BlackRocks filings with the SEC, including in the Risk Factors sections of BlackRocks reports. BlackRocks SEC filings are accessible on the SECs
website and on or through BlackRocks website at www.blackrock.com. We grow our business from time to time by acquiring other financial services companies. Acquisitions in general present us with risks in addition to those presented by the nature of the business acquired. In particular, acquisitions may be
substantially more expensive to complete (including as a result of costs incurred in connection with the integration of the acquired company) and the anticipated benefits (including anticipated cost savings and strategic gains) may be significantly harder or take longer to achieve than expected. In some cases, acquisitions involve our entry into new businesses or new geographic or other markets, and these situations also present risks
resulting from our inexperience in these new areas. As a regulated financial
institution, our pursuit of attractive acquisition opportunities could be negatively impacted due to regulatory delays or other regulatory issues. Regulatory and/or legal issues related to the pre-acquisition
operations of an acquired business may cause reputational harm to PNC following the
acquisition and integration of the acquired business into ours and may result in additional future costs arising as a result of those issues. Our recent acquisition of Sterling Financial Corporation
(Sterling) presents regulatory and litigation risk, as a result of financial irregularities at Sterlings commercial finance subsidiary, that may impact our financial
results. Any annualized, proforma, estimated, third party or consensus numbers in this
presentation are used for illustrative or comparative purposes only and may not reflect
actual results. Any consensus earnings estimates are calculated based on the earnings projections made by analysts who cover that company. The analysts opinions, estimates or forecasts (and therefore the consensus earnings estimates) are theirs alone, are not those of PNC or its management, and may not reflect PNCs or other companys actual or
anticipated results. |

Non-GAAP
to GAAP Reconcilement Appendix In millions, for the three months ended March 31, 2008 December 31, 2007 March 31, 2007 December 31, 2007 March 31, 2007 Net interest income $854 $793 $623 8% 37% Loan net interest income 324 304 232 7% 40% Deposit net interest income 530 489 391 8% 36% Noninterest income 967 834 991 16% (2%) Total revenue $1,821 $1,627 $1,614 12% 13% Fund servicing $228 $215 $203 6% 12% Asset management 212 225 165 (6%) 28% Consumer services 170 179 157 (5%) 8% Corporate services 164 180 159 (9%) 3% Service charges on deposits 82 90 77 (9%) 6% Net securities gains (losses) 41 (1) (3) NM NM Other 70 (54) 233 NM (70%) Noninterest income $967 $834 $991 16% (2%) % Change for 1Q08 vs. Dollars in millions 2007 % of Segments Retail Banking $893 52% Corporate & Institutional Banking 432 25% BlackRock (a) 253 15% PFPC 128 8% Total business segment earnings 1,706 Other (a) (239) Total consolidated net income $1,467 (a) Pre-tax BlackRock/MLIM transaction integration costs totaling $4 million ($3 million after-tax) for the year ended December 31, 2007 have been reclassified from BlackRock to "Other." Year ended December 31 Earnings (Loss) |

Non-GAAP
to GAAP Reconcilement Appendix For the year ended December 31, 2007 PNC PNC In millions As Reported Adjustments (a) As Adjusted Net interest income $2,915 $2,915 Noninterest income 3,790 $131 3,921 Total revenue 6,705 131 6,836 Provision for credit losses 315 (45) 270 Noninterest expense 4,296 (184) 4,112 Income before income taxes 2,094 360 2,454 Income taxes 627 125 752 Net income $1,467 $235 $1,702 Diluted earnings per share 4.35 0.70 5.05 BlackRock For the year ended December 31, 2006 PNC Deconsolidation and BlackRock PNC In millions As Reported Adjustments (a) Other Adjustments Equity Method As Adjusted Net interest income $2,245 $(10) $2,235 Noninterest income 6,327 $(1,812) (1,087) $144 3,572 Total revenue 8,572 (1,812) (1,097) 144 5,807 Provision for credit losses 124 124 Noninterest expense 4,443 (91) (765) 3,587 Income before minority interest and income taxes 4,005 (1,721) (332) 144 2,096 Minority interest in income of BlackRock 47 18 (65) Income taxes 1,363 (658) (130) 7 582 Net income $2,595 $(1,081) $(137) $137 $1,514 Diluted earnings per share 8.73 (3.65) (0.46) 0.46 5.08 (a) Includes the impact of the following pretax items: $2,078 million gain on BlackRock/MLIM transaction, $196 million securities portfolio rebalancing loss, $101 million of BlackRock/MLIM transaction integration costs ($91 million of noninterest expense and $10 million impact on noninterest income), $48 million mortgage loan portfolio repositioning loss, and $12 million net loss related to our BlackRock LTIP shares obligation. The net tax impact of these items is reflected in the adjustment to income taxes. (a) Amounts adjusted to exclude the impact of the following pretax items: (1) the gain of $83 million recognized in connection with PNC's transfer of BlackRock shares to satisfy a portion of our BlackRock LTIP shares obligation, (2) the $210 million net loss representing the mark-to-market adjustment on our remaining BlackRock LTIP shares obligation, (3) acquisition integration costs totaling $151 million, and (4) Visa indemnification charge of $82 million. The net tax impact of these items is reflected in the adjustment to income taxes. |

Non-GAAP
to GAAP Reconcilement Appendix For the year ended December 31, 2005 BlackRock PNC Deconsolidation and BlackRock PNC In millions As Reported Other Adjustments Equity Method As Adjusted Net interest income $2,154 $(12) $2,142 Noninterest income 4,173 (1,214) $163 3,122 Total revenue 6,327 (1,226) 163 5,264 Provision for credit losses 21 21 Noninterest expense 4,306 (853) 3,453 Income before minority interest and income taxes 2,000 (373) 163 1,790 Minority interest in income of BlackRock 71 (71) Income taxes 604 (150) 11 465 Net income $1,325 $(152) $152 $1,325 For the year ended December 31, 2004 BlackRock PNC Deconsolidation and BlackRock PNC In millions As Reported Other Adjustments Equity Method As Adjusted Net interest income $1,969 $(14) $1,955 Noninterest income 3,572 (745) $101 2,928 Total revenue 5,541 (759) 101 4,883 Provision for credit losses 52 52 Noninterest expense 3,712 (564) 3,148 Income before minority interest and income taxes 1,777 (195) 101 1,683 Minority interest in income of BlackRock 42 (42) Income taxes 538 (59) 7 486 Net income $1,197 $(94) $94 $1,197 |

Non-GAAP
to GAAP Reconcilement Appendix For the year ended December 31, 2003 BlackRock PNC Deconsolidation and BlackRock PNC In millions As Reported Other Adjustments Equity Method As Adjusted Net interest income $1,996 $(16) $1,980 Noninterest income 3,263 (604) $108 2,767 Total revenue 5,259 (620) 108 4,747 Provision for credit losses 177 177 Noninterest expense 3,467 (369) 3,098 Income before minority interest and income taxes 1,615 (251) 108 1,472 Minority interest in income of BlackRock 47 (47) Income taxes 539 (104) 8 443 Income before cumulative effect of accounting change 1,029 (100) 100 1,029 Cumulative effect of accounting change, net of tax (28) (28) Net income $1,001 $(100) $100 $1,001 Adjusted In millions 2003 2004 2005 2006 2007 '04-'07 CAGR Adjusted net interest income $1,980 $1,955 $2,142 $2,235 $2,915 14% Adjusted noninterest income 2,767 2,928 3,122 3,572 3,921 10% Adjusted total revenue 4,747 4,883 5,264 5,807 6,836 12% Adjusted noninterest expense 3,098 3,148 3,453 3,587 4,112 9% Adjusted net income 1,001 1,197 1,325 1,514 1,702 12% Adjusted diluted earnings per share 3.55 4.21 4.55 5.08 5.05 Adjusted operating leverage 3% Reported In millions 2003 2004 2005 2006 2007 '04-'07 CAGR Net interest income, as reported $1,996 $1,969 $2,154 $2,245 $2,915 14% Noninterest income, as reported 3,263 3,572 4,173 6,327 3,790 2% Total revenue, as reported 5,259 5,541 6,327 8,572 6,705 7% Noninterest expense, as reported 3,467 3,712 4,306 4,443 4,296 5% Net income, as reported 1,001 1,197 1,325 2,595 1,467 7% Diluted earnings per share 3.55 4.21 4.55 8.73 4.35 Operating leverage, as reported 2% For the year ended December 31, as adjusted For the year ended December 31, as reported |

Non-GAAP
to GAAP Reconcilement Appendix In millions PNC as reported 2003 BlackRock related adjustments (a) 2003 adjusted for BlackRock PNC as reported 2007 BlackRock related adjustments (b) 2007 adjusted for BlackRock '03-'07 CAGR, reported '03-'07 CAGR, adjusted for BlackRock Net interest income $1,996 $(16) $1,980 $2,915 $2,915 10% 10% Noninterest income 3,263 (496) 2,767 3,790 $131 3,921 4% 9% Total revenue $5,259 ($512) $4,747 $6,705 $131 $6,836 6% 10% (b) 2007 adjustments exclude the impact of the following pretax items: (1) the gain of $83 million recognized in connection with PNC's transfer of BlackRock shares to satisfy a portion of our BlackRock LTIP shares obligation, (2) the $210 million net loss representing the mark-to-market adjustment on our remaining BlackRock LTIP shares obligation, (3) and BlackRock/MLIM transaction integration costs totaling $4 million. For the year ended December 31 (a) 2003 amounts adjusted to reflect the impact of the deconsolidation of BlackRock by adjusting as
if we had recorded our investment in BlackRock on the equity method. |

The PNC
Financial Services Group, Inc. PNC BB&T Corporation BBT Comerica CMA Fifth Third Bancorp FITB KeyCorp KEY National City Corporation NCC Regions Financial RF SunTrust Banks, Inc. STI U.S. Bancorp USB Wachovia Corporation WB Wells Fargo & Company WFC Ticker Peer Group of Super-Regional Banks Appendix |

PNC Awards
& Recognition The PNC Financial Services Group has been recognized nationally and
regionally for its accomplishments and success as a diversified financial services firm
that reflects the needs, values and aspirations of our customers, employees, communities and shareholders. HIGH-PERFORMANCE FRANCHISE Jim Rohr named one of the Best CEOs in America for banks/large-cap financial institutions, Institutional Investor magazine, (2008) Jim Rohr named American
Bankers Banker of the Year (2007) BusinessWeek
50 top performing companies (2007) Most Admired Companies, Fortune (2007) No. 2 among top-performing domestic banks with assets over $3 billion, ABA Journal (2007) Total Shareholder Return in peer-group*: one year return, ranked 2nd; three and
five-year return, ranked 1st, Bloomberg (2007) Harris Williams named Middle Market Investment Bank of the Year, IDD magazine (2008) EMPLOYER
OF CHOICE 100 Best Companies for Working Mothers, Working Mother (2001, 20032007) 25 Noteworthy Companies, DiversityInc (2007) Top 10 Companies for African-Americans, DiversityInc (2007) Top 100 Adoption-Friendly companies, Dave Thomas Foundation (2007) Top 100 Companies for Employee Training, Training magazine (20042007) Best 50 Women in Business, State of Pennsylvania (14 winners since 1996) TECHNOLOGY LEADER CIO 100 for Technology Excellence, CIO magazine (2003-2007) Technology Innovator in Financial Services, InformationWeek magazine (1994-2006) PFPC Product Innovation Fund Operations Awards, Source Media (2006) COMMUNITY Sesame Workshop Corporate Honoree Jim Rohr, along with co-honoree First Lady Laura Bush, for PNCs Grow Up Great Early
Education Initiative (2007) Corporate Stewardship Award Finalist, US Chamber of Commerce (2006) Woodrow Wilson Corporate Citizenship Award to Jim Rohr and PNC (2006) Worlds Most Ethical Companies, Ethisphere magazine (2007) Named 5th best corporate citizen in the financial sector, CRO magazine (2007) Outstanding overall CRA rating, Office of the Comptroller (2007) Exemplary Corporate Citizen Award for commitment to green buildings, Allegheny Group of the Sierra
Club (2007) *Peer group represents: US Bancorp, Wachovia, Comerica, Wells Fargo,
SunTrust Banks, BB&T Corporation, Regions Financial Corporation, Fifth Third Bancorp, KeyCorp, National City Corporation 1207 |