ELECTRONIC PRESENTATION SLIDES FOR EARNINGS RELEASE CONFERENCE CALL
Published on January 17, 2008

The PNC
Financial Services Group, Inc. Fourth Quarter 2007 Earnings Conference Call January 17, 2008 Exhibit 99.2 |

This
presentation contains forward-looking statements regarding our outlook or expectations relating to PNCs future business, operations, financial condition, financial performance and asset quality. Forward-looking statements are
necessarily subject to numerous assumptions, risks and uncertainties, which change over
time. The forward-looking statements in this presentation are qualified by the
factors affecting forward-looking statements identified in the more detailed Cautionary Statement included in the Appendix, which is included in the version of the presentation materials posted on our corporate website at www.pnc.com/investorevents. We provide greater detail regarding these factors in our 2006 Form 10-K, including in the Risk Factors and Risk Management sections, and in our third quarter 2007 Form 10-Q and other SEC reports (accessible
on the SECs website at www.sec.gov and on or through our corporate website at
www.pnc.com/secfilings). Future events or circumstances may change our outlook or
expectations and may also affect the nature of the assumptions, risks and uncertainties to which our forward-looking statements are subject. The forward-looking statements
in this presentation speak only as of the date of this presentation. We do not assume any duty and do not undertake to update those statements. In this presentation, we will sometimes refer to adjusted results to help illustrate the impact of
the deconsolidation of BlackRock near the end of third quarter 2006 and the impact of
certain types of items. Adjusted results reflect, as applicable, the following types of adjustments: (1) 2006 and earlier periods reflect the impact of the deconsolidation of BlackRock by adjusting as if we had recorded our BlackRock investment on the equity method prior to its deconsolidation; (2) adjusting 2006 to exclude the impact of the third
quarter 2006 gain on the BlackRock/MLIM transaction and losses on the repositioning of PNCs securities and mortgage loan portfolios; (3) adjusting fourth quarter 2006 and the 2007 periods to exclude the net mark-to-market adjustments on PNCs remaining BlackRock LTIP shares obligation and, as applicable, the gain PNC recognized in first quarter 2007 in connection with the companys transfer of BlackRock shares to satisfy a portion of its BlackRock LTIP shares obligation; (4) adjusting all 2007 and 2006 periods to exclude, as applicable, integration costs related to acquisitions and to
the BlackRock/MLIM transaction; (5) adjusting 2007 periods, as applicable, for the fourth quarter 2007 Visa litigation charge; and (6) adjusting, as appropriate, for the tax impact of these adjustments. We have provided these adjusted amounts and reconciliations so that investors,
analysts, regulators and others will be better able to evaluate the impact of these
items on our results for the periods presented, in addition to providing a basis of comparability for the impact of the BlackRock deconsolidation given the magnitude of the impact of deconsolidation on various components of our income statement and balance sheet. We believe that information as adjusted for the impact of the specified items may be useful due to the extent to which these items are not indicative of our ongoing operations as the result of our management activities on those operations.
While we have not provided other adjustments for the periods discussed, this is not intended to imply that there could not have been other similar types of adjustments, but any such adjustments would not have been similar in magnitude to the amount of the adjustments shown. In certain
discussions, we may also provide revenue information on a taxable-equivalent basis
by increasing the interest income earned on tax-exempt assets to make it fully equivalent to interest income earned on taxable investments. We believe this adjustment may be useful when comparing yields and
margins for all earning assets. This presentation may also include a discussion of other
non-GAAP financial measures, which, to the extent not so qualified therein or in the Appendix, is qualified by GAAP reconciliation information available on our corporate website at
www.pnc.com under About PNCInvestor Relations. Cautionary Statement
Regarding Forward-Looking Information and Adjusted Information
|

Strong organic
client growth Expenses well-contained Solid business segment results in an uncertain time Asset quality migrating, as expected, and at a manageable pace Well-positioned balance sheet Successful Mercantile integration Unprecedented market volatility impacts 4Q07 results 2008 - Focus on maximizing the franchise 2007 Performance Leaves PNC Well-Positioned for the Future Execution Results in a Good Year Despite a Difficult Environment |

Key
Take-Aways Executing on Our Strategy Delivers Differentiated Results Delivered solid results with diverse revenue streams in a period of extreme market volatility Continued to create positive operating leverage on a full year adjusted basis²
Maintained a moderate risk profile and balance sheet flexibility (1) Adjusted fourth quarter 2007 and full year 2007 earnings are reconciled to GAAP earnings in the
Appendix. (2) GAAP basis operating leverage for the full year 2007 period was negative primarily due to the
impact of the 2006 gain from the BlackRock/MLIM transaction and is reconciled in the
Appendix. 2007 4Q07 $5.05 $1.07 Adjusted diluted EPS¹
$4.35 $0.52 Reported diluted EPS |
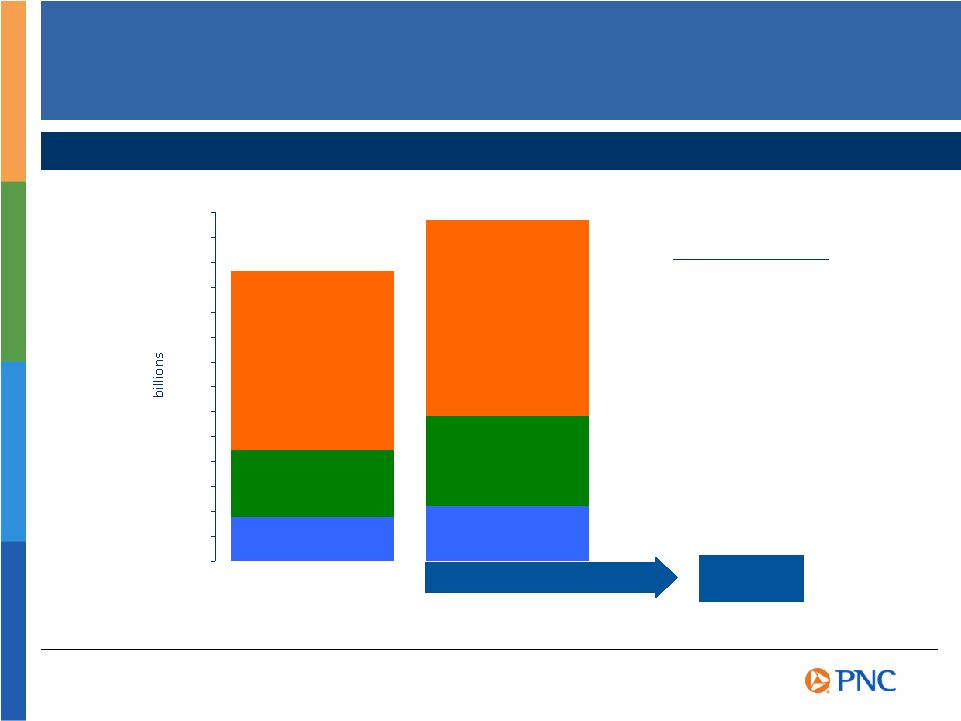
$7 $6 $5 $4 $3 $2 $1 $0 +10% +34% +25% +18% Growing High Quality, Diverse Revenue Streams Total Revenue Growth (1) Adjusted amounts are reconciled to GAAP amounts in the Appendix. (2) Unadjusted 2006 mix: noninterest income 74%, deposit net interest income 16%, loan net
interest income 10%. Unadjusted 2007 mix: noninterest income 56%, deposit net
interest income 27%, loan net interest income 17%. (3) Unadjusted % change: total revenue (22%), noninterest income (40%), deposit net interest income
34%, loan net interest income 24%. 2007 vs 2006 1,3 2006 Mix 2006 Mix Adjusted Revenue Mix for the Year Ended 1,2 2007 Mix 2007 Mix Noninterest Income 62% Deposit NII 23% Loan NII 15% Noninterest Income 57% Deposit NII 27% Loan NII 16% |
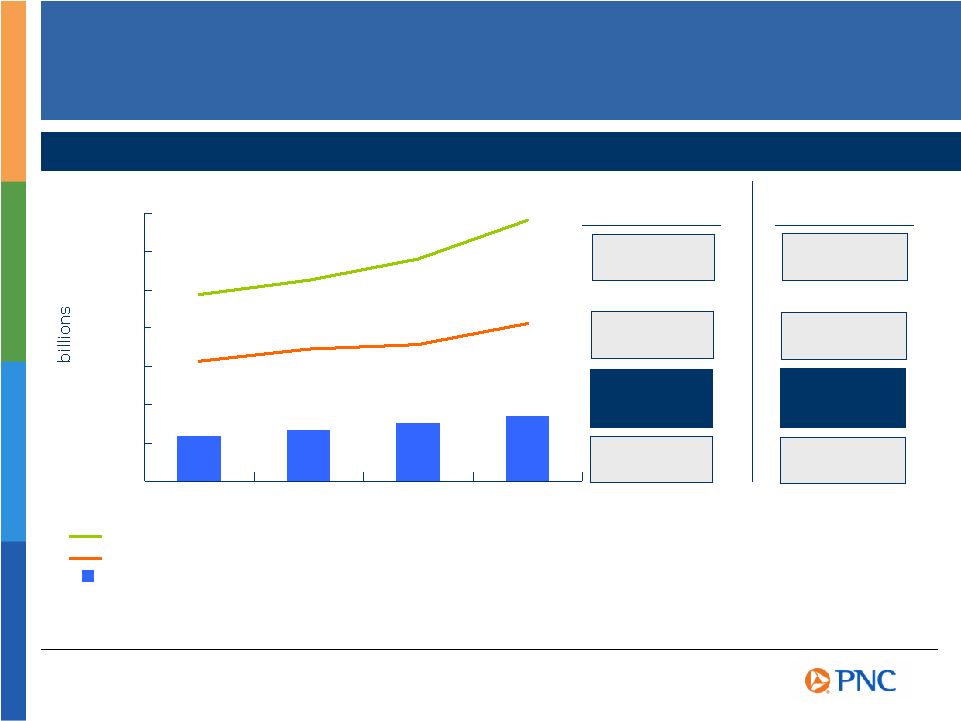
$0 $1 $2 $3 $4 $5 $6 $7 Revenue +9% Creating Positive Operating Leverage Growing Revenues Faster Than Expenses Adjusted Revenue (as reported $5.5 billion, $6.3 billion, $8.6 billion, $6.7 billion for 2004, 2005, 2006, 2007, respectively) Adjusted Noninterest Expense (as reported $3.7 billion, $4.3 billion, $4.4 billion, $4.3 billion for 2004, 2005, 2006, 2007,
respectively) Adjusted Net Income (as reported $1.2 billion, $1.3 billion, $2.6 billion, $1.5 billion for 2004, 2005, 2006, 2007,
respectively) $1.2 $1.3 $1.5 (1) As reported: revenue 24%, expense 9%, operating leverage 15%, net income 47%. (2) As reported: revenue (22%), expense (3%), operating leverage (19%), net income (43%).
(3) Adjusted amounts are reconciled to GAAP amounts in the Appendix. 2004 2005 2006 Expense +7% Net Income +12% Compound Annual Growth (2004-2006, as adjusted) 1,3 Revenue +18% Expense +15% Net Income +12% 2006-2007 As adjusted 2,3 Operating Leverage +2% Operating Leverage +3% $1.7 2007 |

Maintaining a
Moderate Risk Profile Credit decisions driven by risk-adjusted returns Minimal exposure to subprime mortgages, high- yield bridge and leveraged finance loans Relatively low commercial real estate exposure Highly granular portfolio Credit quality migrating at a manageable pace Asset Quality Active balance sheet management style Duration of equity of 2.1 years Very liquid balance sheet Low loans to deposits ratio with a low cost deposit base Relatively large securities book High fee income to total revenue Interest Rate Risk Shift to Tier 1 capital benchmark Earnings growth creates capital flexibility Dividends Share repurchase, where appropriate Access to capital markets Capital Management |

Cautionary
Statement Regarding Forward-Looking Information Appendix We make statements in this presentation, and we may from time to time make other statements, regarding our outlook or expectations for earnings, revenues, expenses and/or other matters regarding or affecting PNC that are
forward-looking statements within the meaning of the Private Securities Litigation Reform Act. Forward-looking statements are typically identified by words such as believe, expect, anticipate, intend, outlook, estimate, forecast, will, project and other similar words and expressions. Forward-looking statements are subject to numerous assumptions, risks and uncertainties, which
change over time. Forward-looking statements speak only as of the date they
are made. We do not assume any duty and do not undertake to update our forward-looking statements. Because forward-looking statements are subject to assumptions and uncertainties, actual results or future events could differ, possibly materially, from those that we anticipated in our forward-looking statements, and future results could differ
materially from our historical performance. Our forward-looking statements are
subject to the following principal risks and uncertainties. We provide greater detail regarding some of these factors in our Form 10-K for the year ended December 31, 2006, including in the Risk Factors
and Risk Management sections of that report, and in our third quarter 2007 Form
10-Q and other SEC reports. Our forward-looking statements may also be subject to other risks and uncertainties, including those that we may discuss elsewhere in this presentation or in our filings with the SEC,
accessible on the SECs website at www.sec.gov and on or through our corporate
website at www.pnc.com/secfilings. Our businesses and financial results are
affected by business and economic conditions, both generally and specifically in the principal markets in which we operate. In particular, our businesses and financial results may be impacted
by: Changes in interest rates and valuations in the debt, equity and other financial markets. Disruptions in the liquidity and other functioning of financial markets, including such
disruptions in the markets for real estate and other assets commonly securing financial
products. Actions by the Federal Reserve and other government agencies, including
those that impact money supply and market interest rates. Changes in our
customers, suppliers and other counterparties performance in general and their creditworthiness in particular. Changes in customer preferences and behavior, whether as a result of changing business and
economic conditions or other factors. A continuation of recent turbulence in
significant portions of the global financial markets could impact our performance, both directly by affecting our revenues and the value of our assets and liabilities and indirectly by affecting the economy
generally. Our operating results are affected by our liability to provide shares
of BlackRock common stock to help fund certain BlackRock long-term incentive plan
(LTIP) programs, as our LTIP liability is adjusted quarterly (marked-to-market) based on changes in BlackRocks common stock price and the number of remaining committed shares, and we recognize gain or loss on such shares at such
times as shares are transferred for payouts under the LTIP programs. Competition can have an impact on customer acquisition, growth and retention, as well as on
our credit spreads and product pricing, which can affect market share, deposits and
revenues. Our ability to implement our business initiatives and strategies
could affect our financial performance over the next several years.
|

Legal
and regulatory developments could have an impact on our ability to operate our businesses or our financial condition or results of operations or our competitive position or reputation. Reputational impacts, in turn, could affect
matters such as business generation and retention, our ability to attract and retain management, liquidity, and funding. These legal and regulatory developments could include: (a) the unfavorable resolution of legal proceedings or regulatory and other governmental inquiries; (b) increased litigation
risk from recent regulatory and other governmental developments; (c) the results of the regulatory examination process, our failure to satisfy the requirements of agreements with governmental agencies, and regulators future use of supervisory and enforcement tools; (d) legislative and regulatory reforms,
including changes to laws and regulations involving tax, pension, education lending, and the protection of confidential customer information; and (e) changes in accounting policies and principles. Our business and operating results are affected by our ability to identify and effectively
manage risks inherent in our businesses, including, where appropriate, through the
effective use of third-party insurance, derivatives, and capital management techniques. Our ability to anticipate and respond to technological changes can have an impact on our
ability to respond to customer needs and to meet competitive demands. The adequacy of our intellectual property protection, and the extent of any costs associated
with obtaining rights in intellectual property claimed by others, can impact our
business and operating results. Our business and operating results can also be
affected by widespread natural disasters, terrorist activities or international hostilities, either as a result of the impact on the economy and capital and other financial markets generally or on us or on our customers, suppliers or other counterparties specifically. Also, risks and uncertainties that could affect the results anticipated in
forward-looking statements or from historical performance relating to our equity
interest in BlackRock, Inc. are discussed in more detail in BlackRocks filings with the SEC, including in the Risk Factors sections of BlackRocks reports. BlackRocks SEC filings are accessible on the SECs
website and on or through BlackRocks website at www.blackrock.com. We grow our business from time to time by acquiring other financial services companies, including our pending Sterling Financial Corporation (Sterling) acquisition. Acquisitions in general present us with risks in addition to those presented by the nature of the business acquired. In particular, acquisitions may be substantially more expensive to complete (including as a result of
costs incurred in connection with the integration of the acquired company) and the anticipated benefits (including anticipated cost savings and strategic gains) may be significantly harder or take longer to achieve than expected. In some cases, acquisitions involve our entry into new
businesses or new geographic or other markets, and these situations also present risks resulting from our inexperience in these new areas. As a regulated financial institution, our pursuit of attractive acquisition opportunities could be negatively impacted due to regulatory delays or other regulatory
issues. Regulatory and/or legal issues related to the pre-acquisition
operations of an acquired business may cause reputational harm to PNC following the acquisition and integration of the acquired business into ours and may result in additional future costs arising as a result of those
issues. Any annualized, proforma, estimated, third party or consensus numbers in this
presentation are used for illustrative or comparative purposes only and may not reflect
actual results. Any consensus earnings estimates are calculated based on the earnings projections made by analysts who cover that company. The analysts opinions, estimates or forecasts (and therefore the consensus earnings estimates) are theirs
alone, are not those of PNC or its management, and may not reflect PNCs,
Sterlings or other companys actual or anticipated results. Cautionary
Statement Regarding Forward-Looking Information (continued)
Appendix |

The PNC
Financial Services Group, Inc. and Sterling Financial Corporation (Sterling) will be filing a proxy statement/prospectus and other relevant documents concerning the merger with the United States Securities and Exchange Commission (the SEC). WE URGE INVESTORS TO READ THE PROXY STATEMENT/PROSPECTUS AND ANY OTHER DOCUMENTS TO BE FILED WITH THE SEC IN CONNECTION WITH THE MERGER OR INCORPORATED BY REFERENCE IN THE PROXY STATEMENT/PROSPECTUS BECAUSE THEY WILL CONTAIN IMPORTANT INFORMATION. Investors will be able to obtain these documents free of charge at the SECs web site at
http://www.sec.gov. In addition, documents filed with the SEC by The PNC
Financial Services Group, Inc. will be available free of charge from Shareholder
Relations at (800) 843-2206. Documents filed with the SEC by Sterling will be available free of charge from Sterling by contacting Shareholder Relations at (877) 248-6420. The directors, executive officers, and certain other members of management and employees of
Sterling are participants in the solicitation of proxies in favor of the merger from
the shareholders of Sterling. Information about the directors and executive
officers of Sterling is included in the proxy statement for its May 8, 2007 annual
meeting of shareholders, which was filed with the SEC on April 2, 2007. Additional information regarding the interests of such participants will be included in the proxy statement/prospectus and the other relevant documents filed with the SEC when they become available. Additional Information About The PNC/Sterling Financial Corporation Transaction Appendix |

Non-GAAP
to GAAP Reconcilement Earnings Summary Appendix THREE MONTHS ENDED In millions, except per share data Adjustments, Net Diluted Adjustments, Net Diluted Adjustments, Net Diluted Pretax Income EPS Pretax Income EPS Pretax Income EPS Net income, as reported $178 $0.52 $407 $1.19 $376 $1.27 Adjustments: BlackRock LTIP (a) $128 84 .24 $50 32 .09 $12 7 .02 Visa indemnification (b) 82 53 .16 Integration costs (c) 79 50 .15 43 30 .09 10 8 .03 Net income, as adjusted $365 $1.07 $469 $1.37 $391 $1.32 YEAR ENDED Adjustments, Net Diluted Adjustments, Net Diluted In millions, except per share data Pretax Income EPS Pretax Income EPS Net income, as reported $1,467 $4.35 $2,595 $8.73 Adjustments: BlackRock LTIP (a) $127 83 .24 $12 7 .02 Visa indemnification (b) 82 53 .16 Integration costs (c) 151 99 .30 101 47 .16 Gain on BlackRock/MLIM transaction (d) (2,078) (1,293) (4.36) Securities portfolio rebalancing loss (d) 196 127 .43 Mortgage loan portfolio repositioning loss (d) 48 31 .10 Net income, as adjusted $1,702 $5.05 $1,514 $5.08 (d) Included in noninterest income on a pretax basis. December 31, 2006 (b) Our payment services business issues and acquires credit and debit card transactions through Visa U.S.A. Inc. card association or its affiliates (Visa). In October 2007, Visa completed a restructuring and issued shares of Visa Inc. common stock to its financial institution members in contemplation of its initial public offering (IPO) currently anticipated in the first quarter of 2008 (the Visa Reorganization). As part of the Visa Reorganization, we received our proportionate share of a class of Visa Inc. common stock allocated to the U.S. members. Visa expects that a portion of these shares will be redeemed for cash out of the proceeds of the IPO. The U.S. members are obligated to indemnify Visa for judgments and settlements related to specified litigation. Visa will set aside a portion of the proceeds from the IPO in an escrow account for the benefit of the U.S. member financial institutions to fund the expenses of the litigation as
well as the members' proportionate share of any judgments or settlements that may arise out of the litigation. December 31, 2007 September 30, 2007 December 31, 2006 December 31, 2007 (a) Includes the impact of the gain recognized in connection with PNC's transfer of BlackRock shares to satisfy a portion of our BlackRock LTIP shares obligation and the net mark-to-market adjustment on our remaining BlackRock LTIP shares obligation, as applicable. In accordance with GAAP, we recorded a liability and operating expense totaling $82 million before taxes in the fourth quarter of 2007 representing our estimate of the fair value of our indemnification obligation for potential losses arising from this litigation. Our estimate is based on publicly available information and other information made available to all of the affected Visa members and does not reflect any direct knowledge of the relative strengths and weaknesses of the litigation still pending or the status of any on-going settlement discussions. We believe that the IPO will be completed and cash will be available through the escrow to satisfy litigation settlements. In addition, based on estimates provided by Visa regarding its planned IPO, we believe that our ownership interest in Visa has a value significantly in excess of our indemnification liability. Our Visa shares will not generally be transferable until they can be converted into shares of the publicly traded class of stock, which cannot happen until the later of three years after the IPO or settlement of all of the specified litigation. (c) In addition to integration costs related to recent or pending PNC acquisitions reflected in the 2007 periods, the first three quarters of 2007 and all 2006 periods include BlackRock/MLIM integration costs. BlackRock/MLIM integration costs recognized by PNC in the first three quarters of 2007 and the fourth quarter of 2006 were included in noninterest income as a negative component of the "Asset management" line item, which includes the impact of our equity earnings from our investment in BlackRock. For the
first nine months of 2006, BlackRock/MLIM transaction integration costs were included in noninterest expense. |

Non-GAAP
to GAAP Reconcilement Income Statement Summary For the year ended Appendix Year ended In millions As Reported Adjustments As Adjusted (a) As Reported Adjustments As Adjusted (b) Net interest income $2,915 $2,915 $2,245 ($10) $2,235 Net interest income: % Change As Reported % Change As Adjusted Loans 1,110 1,110 895 (10) 885 24% 25% Deposits 1,805 1,805 1,350 1,350 34% 34% Noninterest Income 3,790 $131 3,921 6,327 (2,755) 3,572 (40%) 10% Total revenue 6,705 131 6,836 8,572 (2,765) 5,807 (22%) 18% Loan net interest income as a % of total revenue 16.6% 16.2% 10.4% 15.2% Deposit net interest income as a % of total revenue 26.9% 26.4% 15.7% 23.2% Noninterest income as a % of total revenue 56.5% 57.4% 73.8% 61.5% Provision for credit losses 315 (45) 270 124 124 Noninterest income 3,790 131 3,921 6,327 (2,755) 3,572 Noninterest expense 4,296 (184) 4,112 4,443 (856) 3,587 (3%) 15% Income before minority interest and income taxes 2,094 360 2,454 4,005 (1,909) 2,096 Minority interest in income of BlackRock 47 (47) Income taxes 627 125 752 1,363 (781) 582 Net income $1,467 $235 $1,702 $2,595 ($1,081) $1,514 (43%) 12% Operating Leverage - Year Ended As Reported As Adjusted Total revenue (22%) 18% Noninterest expense (3%) 15% Operating leverage (19%) 3% (a) Amounts adjusted to exclude the impact of the following pretax items: (1) the gain of $83 million recognized in connection with PNC's transfer of BlackRock shares to satisfy a portion of our BlackRock LTIP shares obligation, (2) the net mark-to-market adjustment totaling $210 million on our remaining BlackRock LTIP shares obligation, (3) acquisition integration costs totaling $151 million, and (4) Visa indemnification charge of $82 million. The net tax impact of these items
is reflected in the adjustment to income taxes. (b) Amounts adjusted to exclude the impact of the following pretax items: $2,078 million gain on BlackRock/MLIM transaction, $196 million securities portfolio rebalancing loss, $101 million of BlackRock/MLIM transaction integration costs, $48 million mortgage loan portfolio repositioning loss, and $12 million net loss related to our BlackRock LTIP shares obligation. The net tax impact of these items is reflected in the adjustment to income taxes. 2006 to 2007 Change December 31, 2007 December 31, 2006 |

Non-GAAP
to GAAP Reconcilement Income Statement Summary For the three months ended Appendix For the three months ended December 31, 2007 PNC PNC In millions As Reported Adjustments (a) As Adjusted Reported Adjusted Net interest income $793 $793 Loan net interest income 304 304 3% 3% Deposit net interest income 489 489 5% 5% Provision for credit losses 188 ($45) 143 Net interest income less provision for credit losses 605 (45) 650 Asset management 225 (1) 224 Other 609 128 737 Total noninterest income 834 127 961 (16%) (8%) Compensation and benefits 553 (10) 543 Other 660 (107) 553 Total noninterest expense 1,213 (117) 1,096 10% 4% Income before income taxes 226 289 515 Income taxes 48 102 150 Net income $178 $187 $365 (56%) (22%) For the three months ended September 30, 2007 PNC PNC In millions As Reported Adjustments (b) As Adjusted Net interest income $761 $761 Loan net interest income 294 294 Deposit net interest income 467 467 Provision for credit losses 65 65 Net interest income less provision for credit losses 696 696 Asset management 204 $2 206 Other 786 50 836 Total noninterest income 990 52 1,042 Compensation and benefits 553 (16) 537 Other 546 (25) 521 Total noninterest expense 1,099 (41) 1,058 Income before income taxes 587 93 680 Income taxes 180 31 211 Net income $407 $62 $469 % Change vs. Sept 30, 2007 (a) Amounts adjusted to exclude the impact of the following items on a pretax basis: $128 million net loss related to our BlackRock/LTIP shares obligation, $82 million Visa indemnification charge, and $79 million of acquisition integration costs. The net tax
impact of these items is reflected in the adjustment to income taxes. (b) Amounts adjusted to exclude the impact of the following items on a pretax basis: $50 million net loss related to our BlackRock/LTIP shares obligation and $43 million of acquisition integration costs. The net tax impact of these items is reflected in the
adjustment to income taxes. |

Non-GAAP
to GAAP Reconcilement Income Statement Summary 2004 to 2007 Appendix For the year ended December 31, 2007 PNC PNC In millions As Reported Adjustments (a) As Adjusted Net interest income $2,915 $2,915 Provision for credit losses 315 $(45) 270 Noninterest income 3,790 131 3,921 Noninterest expense 4,296 (184) 4,112 Income before income taxes 2,094 360 2,454 Income taxes 627 125 752 Net income $1,467 $235 $1,702 BlackRock For the year ended December 31, 2006 PNC Deconsolidation and BlackRock PNC In millions As Reported Adjustments (a) Other Adjustments Equity Method As Adjusted Net interest income $2,245 $(10) $2,235 Provision for credit losses 124 124 Noninterest income 6,327 $(1,812) (1,087) $144 3,572 Noninterest expense 4,443 (91) (765) 3,587 Income before minority interest and income taxes 4,005 (1,721) (332) 144 2,096 Minority interest in income of BlackRock 47 18 (65) Income taxes 1,363 (658) (130) 7 582 Net income $2,595 $(1,081) $(137) $137 $1,514 (a) Includes the impact of the following pretax items: $2,078 million gain on BlackRock/MLIM transaction, $196 million securities portfolio rebalancing loss, $101 million of BlackRock/MLIM transaction integration costs, $48 million mortgage loan portfolio repositioning loss, and $12 million net loss related to our BlackRock LTIP shares obligation. The net tax impact of these items is reflected in the adjustment to income
taxes. (a) Amounts adjusted to exclude the impact of the following pretax items: (1) the gain of $83 million recognized in connection with PNC's transfer of BlackRock shares to satisfy a portion of our BlackRock LTIP shares obligation, (2) the net mark-to-market adjustment totaling $210 million on our remaining BlackRock LTIP shares obligation, (3) acquisition integration costs totaling $151 million, and (4) Visa indemnification charge of $82 million. The net tax impact of these items is reflected in the adjustment to income taxes. |

Non-GAAP
to GAAP Reconcilement Income Statement Summary 2004 to 2007 (continued) Appendix For the year ended December 31, 2005 BlackRock PNC Deconsolidation and BlackRock PNC In millions As Reported Other Adjustments Equity Method As Adjusted Net interest income $2,154 $(12) $2,142 Provision for credit losses 21 21 Noninterest income 4,173 (1,214) $163 3,122 Noninterest expense 4,306 (853) 3,453 Income before minority interest and income taxes 2,000 (373) 163 1,790 Minority interest in income of BlackRock 71 (71) Income taxes 604 (150) 11 465 Net income $1,325 $(152) $152 $1,325 For the year ended December 31, 2004 BlackRock PNC Deconsolidation and BlackRock PNC In millions As Reported Other Adjustments Equity Method As Adjusted Net interest income $1,969 $(14) $1,955 Provision for credit losses 52 52 Noninterest income 3,572 (745) $101 2,928 Noninterest expense 3,712 (564) 3,148 Income before minority interest and income taxes 1,777 (195) 101 1,683 Minority interest in income of BlackRock 42 (42) Income taxes 538 (59) 7 486 Net income $1,197 $(94) $94 $1,197 |

Non-GAAP
to GAAP Reconcilement Income Statement Summary 2004 to 2007 (continued) Appendix % Change In millions 2004 2005 2006 2007 2004-2006 CAGR 2006-2007 Adjusted net interest income $1,955 $2,142 $2,235 $2,915 Adjusted noninterest income 2,928 3,122 3,572 3,921 Adjusted total revenue 4,883 5,264 5,807 6,836 9% 18% Adjusted noninterest expense 3,148 3,453 3,587 4,112 7% 15% Adjusted net income 1,197 1,325 1,514
1,702 12% 12% Adjusted operating leverage 2% 3% % Change In millions 2004 2005 2006 2007 2004-2006 CAGR 2006-2007 Net interest income, as reported $1,969 $2,154 $2,245 $2,915 Noninterest income, as reported 3,572 4,173 6,327 3,790 Total revenue, as reported 5,541 6,327 8,572 6,705 24% (22%) Noninterest expense, as reported 3,712 4,306 4,443 4,296 9% (3%) Net income, as reported 1,197 1,325 2,595
1,467 47% (43%) Operating leverage, as reported 15% (19%) For the year ended December 31, as adjusted For the year ended December 31, as reported |