SLIDE PRESENTATION AND RELATED MATERIAL
Published on August 13, 2007

The PNC
Financial Services Group, Inc. Keefe, Bruyette & Woods Large Cap Bank Conference Kohler, WI August 13, 2007 Exhibit 99.1 |

This presentation contains forward-looking statements regarding our outlook or
expectations relating to PNCs future business, operations, financial condition, financial performance and asset quality. Forward-looking statements
are necessarily subject to numerous assumptions, risks and uncertainties, which change over time. The forward-looking statements in this presentation are qualified by the factors
affecting forward-looking statements identified in the more detailed Cautionary Statement included in the Appendix, which is included in the presentation handouts and in the version of the presentation materials posted on our corporate website at www.pnc.com/investor events. We provide greater detail regarding these factors in our 2006 Form 10-K, including in the Risk Factors and Risk Management sections, and in our first and second quarter 2007 Form
10-Qs and other SEC reports (accessible on the SECs website at www.sec.gov and on or through our corporate website). Future events or circumstances may change our outlook or expectations and may also
affect the nature of the assumptions, risks and uncertainties to which our
forward-looking statements are subject. The forward-looking statements in this presentation speak only as of the date of this presentation. We do not assume any duty and do not undertake to update those statements. In this presentation, we will sometimes refer to adjusted results to help illustrate (1) the impact of BlackRock deconsolidation near the end of third quarter 2006 and the application of the equity method of accounting for our equity investment in BlackRock and (2) the impact of certain specified items, including 2006 BlackRock/MLIM transaction gain, 2006 cost of securities and mortgage portfolio repositionings, 2006 and 2007 BlackRock/MLIM transaction and Mercantile Bankshares acquisition integration costs, and 2006 and 2007 gains/losses related to our BlackRock LTIP shares obligation. We have provided these adjusted amounts and reconciliations so that investors, analysts, regulators and others will be better able to evaluate the impact of these items on our results for the periods presented, in addition to providing a basis
of comparability for the impact of the BlackRock deconsolidation given the
magnitude of the impact of deconsolidation on various components of our income statement. We believe that information as adjusted for the impact of the specified items may be useful due to the extent to which these items are not
indicative of our ongoing operations as the result of our management activities on those operations. While we have not provided other adjustments for the periods discussed, this is not intended to imply that there could not have been other similar types of adjustments, but any such adjustments would not have been similar in magnitude to those shown. In certain discussions, we also provide revenue information on a taxable-equivalent basis by
increasing the interest income earned on tax-exempt assets to make it fully equivalent to interest income earned on taxable investments. We believe this
adjustment may be useful when comparing yields and margins for all earning
assets. This presentation may also include a discussion of other non-GAAP
financial measures, which, to the extent not so qualified therein or in the Appendix, is qualified by GAAP reconciliation information available on our corporate website at www.pnc.com under About PNC Investor Relations. Cautionary Statement Regarding Forward-Looking Information and Adjusted Information |

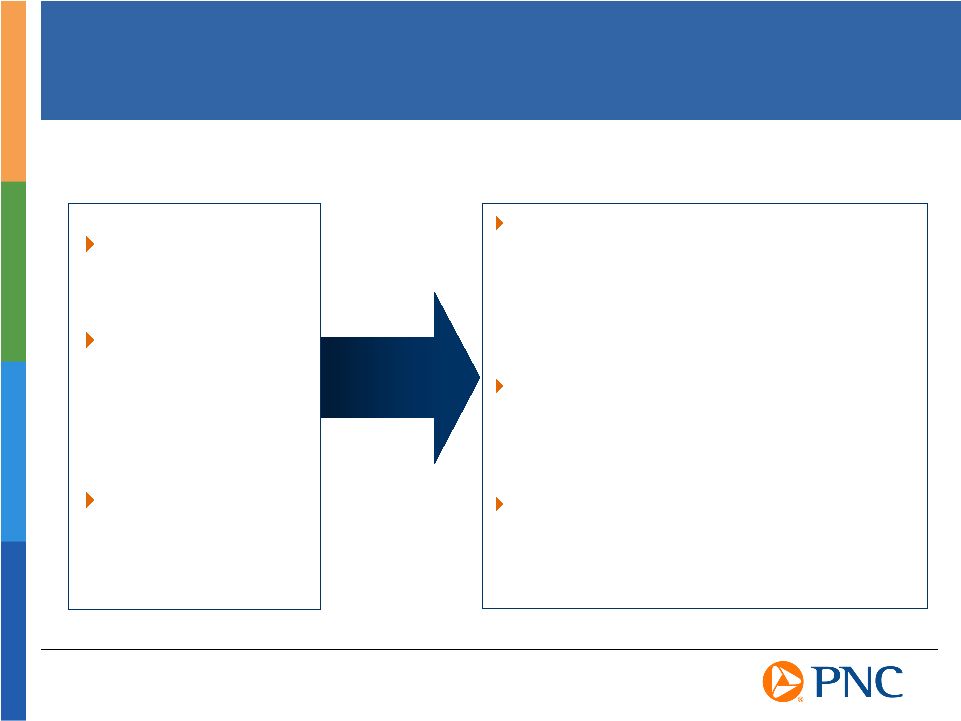
Industry
Concerns PNCs Differentiated Position High quality home equity portfolio - Relationship based - 92% in footprint - Performing well to date - Reflects our disciplined approach to credit Well-balanced commercial portfolio - Risk is diversified and granular - Proportionally less commercial real estate exposure than peers - Relatively higher concentration of asset-based lending - No hung syndications Well-positioned to perform in this environment |

A history of
execution A diversified business mix with clear strategies for growth A strong risk management process A disciplined capital deployment strategy PNC is differentiated by
|
Build a
disciplined economic capital allocation process 1990s 1990s Expand into higher growth markets and products Enhance risk management capabilities Build diversified business mix Invest in industry-leading technology platform Focus on improved customer satisfaction Expand distribution capabilities Develop strong corporate governance Deepen customer relationships with new/enhanced products Focus on expense management LEADING THE WAY
2000s 2000s Increase Brand Awareness Building a Great Company by Delivering on Our Promises |

Assets
$126 billion Total revenue $3.3 billion Net income $882 million Noninterest income to total revenue 59% Net interest margin 3.00% Nonperforming loans to total loans 0.34% Tangible common equity 5.5% Financial Highlights Strong First Half Performance Reported earnings of $2.67 per diluted share First half 2007 net income up 20% versus first half 2006 Primary businesses met or exceeded expectations Created positive operating leverage on an adjusted basis* Maintained excellent asset quality Mercantile acquisition closed and integration process well underway Announced pending acquisitions of Yardville and Sterling and closed ARCS acquisition *Adjusted numbers are reconciled to GAAP in the Appendix At or for the six months ended June 30, 2007 |

A history of
execution A diversified business mix with clear strategies for growth A strong risk management process A disciplined capital deployment strategy PNC is differentiated by
|
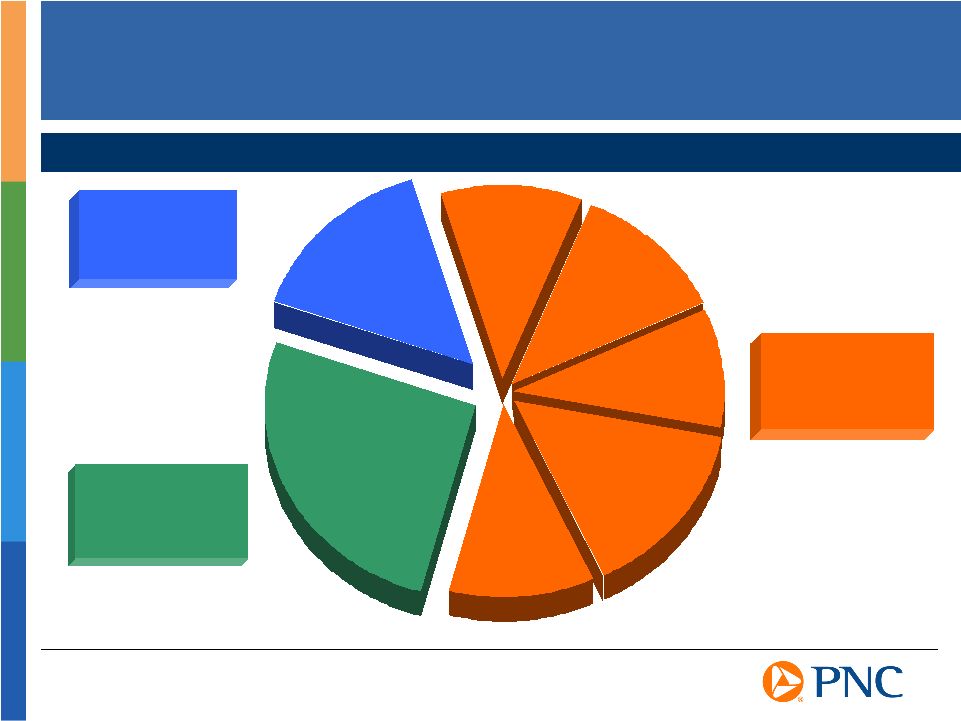
A Diversified
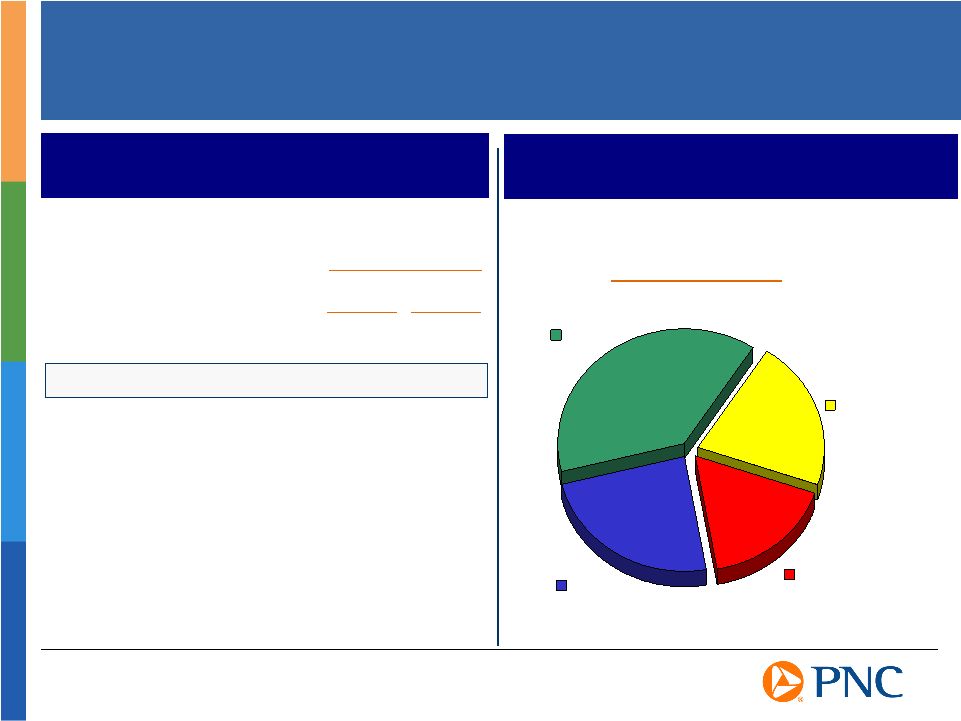
Business Mix Business Leadership Retail Banking - A leading community bank in PNC major markets - One of the nations largest bank wealth management firms Corporate & Institutional Banking - Top 10 Treasury Management business - The nations fourth largest lead arranger of asset-based loan syndications - Harris Williams - one of the nations largest M&A advisory firms for middle-market companies BlackRock - A global asset management company with over $1.2 trillion in assets under management PFPC - Among the largest providers of mutual fund transfer agency and accounting and administration services in the U.S. Winning in the Payments Space A Premier Middle- market Franchise A Leading Global Servicing Platform World Class Asset Manager First Half 2007 Business Earnings Contribution* $ millions $254 $428 $110 $63 *Business earnings reconciled to GAAP net income of $882 million in the Appendix. BlackRock segment earnings exclude our pretax share of BlackRock/MLIM integration costs totaling $3 million. Contribution 50% 30% 13% 7% |
Growing Our
Diverse Revenue Streams Deposit net interest income Loan net interest income 11% 26% 15% Asset Management 10% Consumer Services, Brokerage and Deposit Charges 12% Fund Servicing 15% Corporate Services 11% Equity Management, Trading and Other Contribution to Total Revenue For the Six Months Ended June 30, 2007 Adjusted loan net interest income increased 13% year over year* Adjusted deposit net interest income increased 30% year over year* Adjusted noninterest income increased 10% year over year* *Adjusted noninterest income, deposit net interest income, loan net interest income and growth
percentages are reconciled to GAAP in the Appendix. Unadjusted growth:
noninterest income (19%), deposit net interest income 30%, and loan net interest income 11%. |
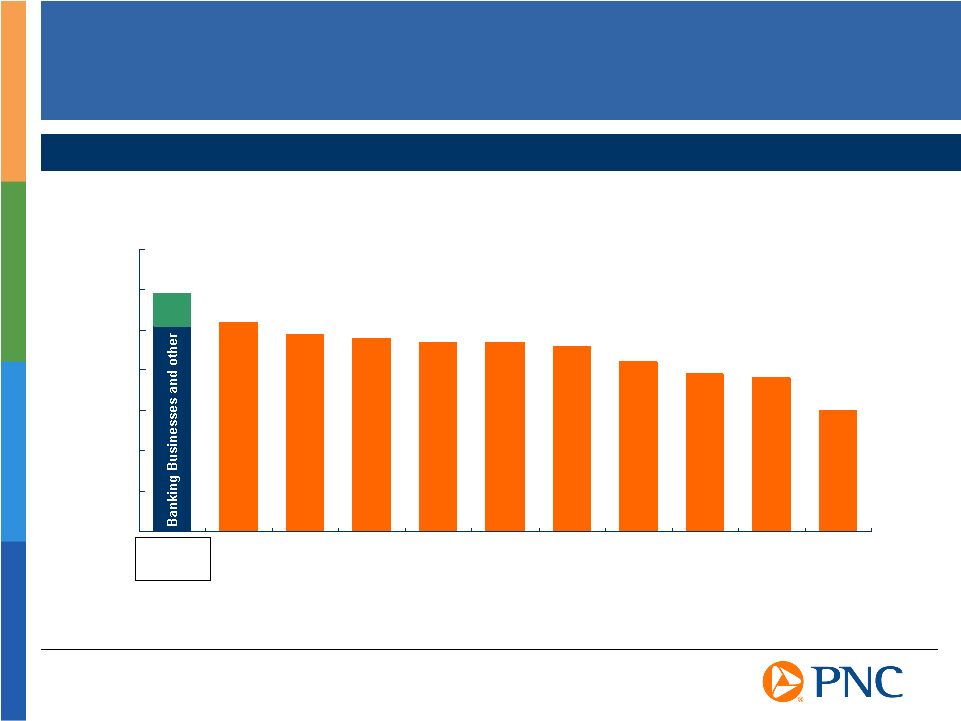
0% 10% 20% 30% 40% 50% 60% 70% USB KEY FITB WB WFC STI BBT NCC RF CMA Differentiated Fee-Based Businesses Source: SNL DataSource, PNC as reported For the six months ended June 30, 2007 PFPC & BLK Noninterest Income to Total Revenue PNC |

Build brand
awareness to acquire, retain, and deepen customer relationships Redeploy capital to high return, high growth products and markets Strategies for Growth |
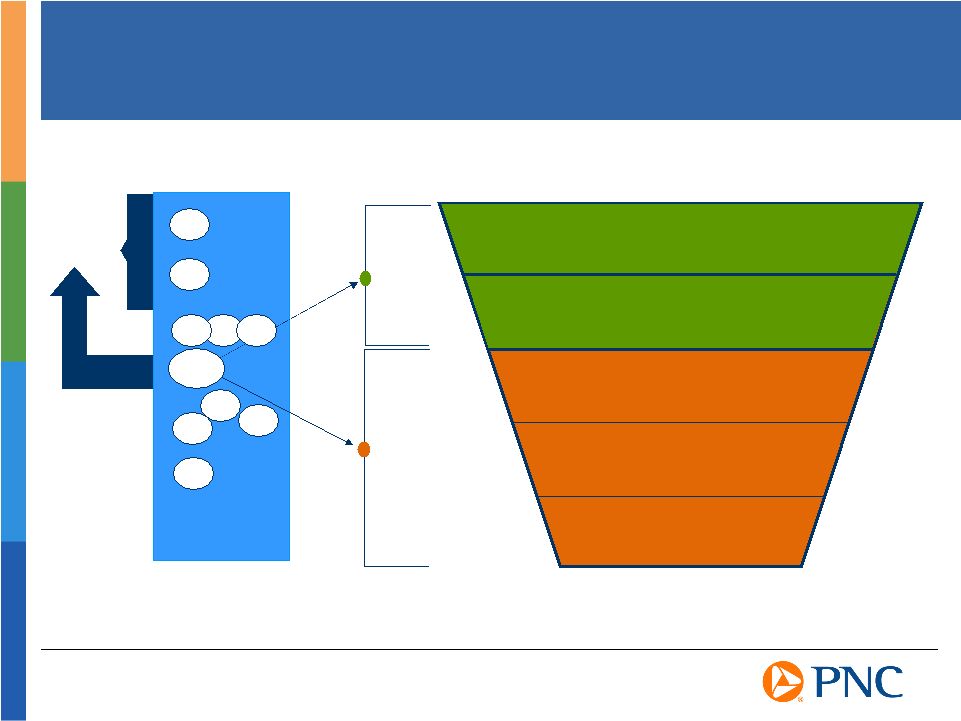
Opportunity to
Enhance Brand Recognition Consideration Awareness Customers Preferred Entrenched Purchase Funnel Areas to Improve Current Strengths Source: 2006 PNC Brand and Advertising Performance Research Bank I Bank B Bank D Bank C Bank H Bank G Bank A Brand Equity Index Best Worst Bank F Differentiated G O A L PNC Bank E |
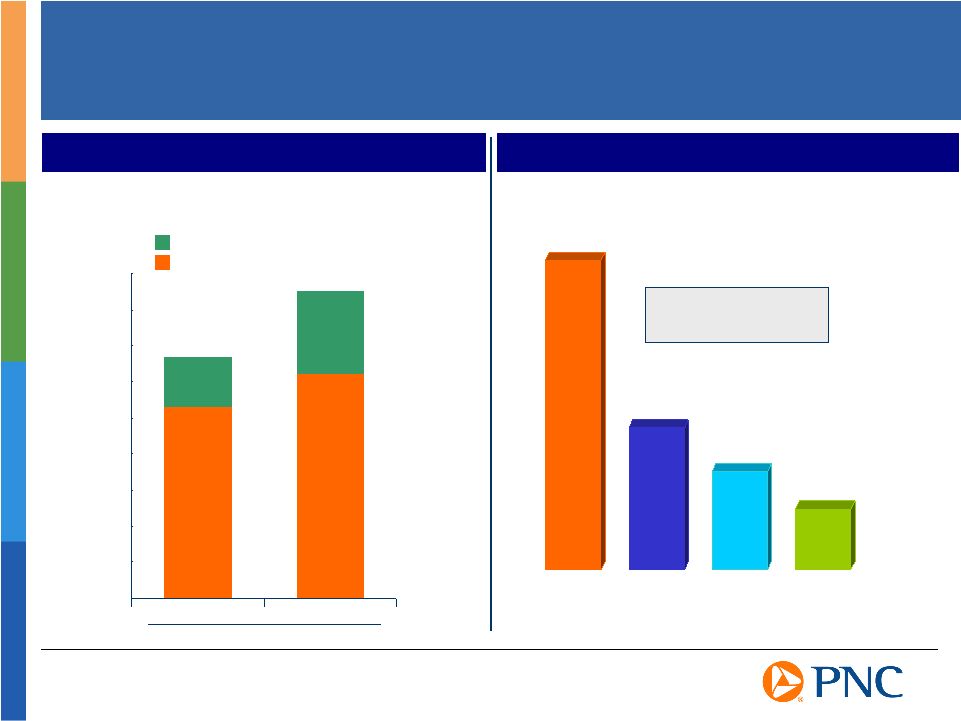
Interest-bearing deposits 24% 12% Noninterest-bearing deposits 28% 3% Total deposits 25% 10% 2Q07 vs. 2Q06 Executing on Our Strategy to Gather Low Cost Deposits Source: SNL DataSource, PNC as reported. Peers reflects average of the super-regional banks identified in the Appendix other than PNC 24% 38% 21% 17% Consumer Corporate Banking, Treasury Management and Other Midland Small Business PNC Has Been Focused on Growing Noninterest-Bearing Deposits
Average Balances PNC Peers Contribution to Average Noninterest-Bearing Deposits As of 6/30/07 Through Multiple Channels |

USB 2.23 % WFC 2.44 PNC 2.72 CMA 2.73 RF 2.83 FITB 2.93 KEY 2.96 STI 3.06 BBT 3.12 WB 3.12 NCC 3.23 CMA 21 % WFC 21 PNC 18 KEY 17 RF 16 FITB 15 USB 15 STI 14 NCC 14 BBT 12 WB 10 Differentiated Deposit Strategy Average Noninterest-Bearing Deposits to Average Earning Assets For the three months ended June 30, 2007 Source: SNL DataSource, PNC as reported 2Q07 Interest Cost of Total Average Deposits 2Q07 Providing a Funding Advantage
With a Low Cost of Deposits |

A Leader in
Cross-sell Penetration of Middle Market Customers in Footprint Relationship Strategy Drives Fee Growth Growth is for 1H07 vs. 1H06, not including Mercantile Reflects growth in users, not including Mercantile Small Business Small Business debit card revenue ($ millions)
$6.8 +17% Small Business online banking users 49% +11% Consumer Consumer debit card revenue ($ millions)
$54.8 +12% Consumer online banking users 55% +9% Consumer online bill-pay users 29% +66% Growth¹
1H07 2 2 2 (1) (2) Leveraging the Payments Business PNC has highest percentage of lead bank relationships in our footprint 63%* PNC Footprint Penetration* Treasury management 74% 1 st Business checking accounts 69% 1 st Capital markets 26% 1 st Equipment leasing 17% 1 st 2006 Rank Based on third party survey of companies with annualized revenues of $30-$500 million * |
Emerging
Product Growth Focus Emerging Product Revenue 3-Year CAGR* Redeploying Capital to High Return, High Growth Products - PFPC Driving Fee Revenue Growth 21% 29% 79% 71% Core Product Fee Revenue Emerging Product Fee Revenue 2004 2007 Managed Accounts Alternative Investments Offshore Subaccounting 44% 20% 14% 9% Combined 3-Year CAGR 19% * CAGR reflects compound annual growth for 1H07 vs 1H04 For the Six Months Ended June 30 $millions $0 $50 $100 $150 $200 $250 $300 $350 $400 $450 |
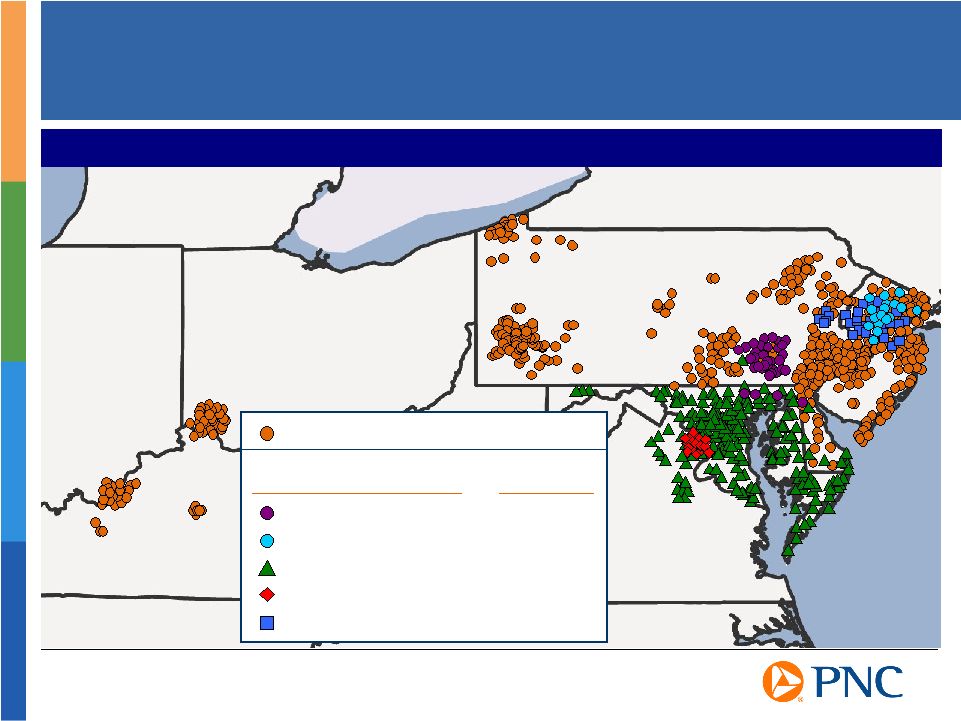
Investing in
Fast Growing and Affluent Mid-Atlantic Region 76% of PNC Pro Forma Branches Located Between the Hudson and Potomac Rivers Acquisitions Completion Date Original PNC Branches Sterling Financial Corp. Pending Yardville National Bancorp Pending Mercantile Bankshares Corp. 3/2/07 Riggs National Corp. 5/13/05 United National Bancorp 1/1/04 New York New York Delaware Delaware Virginia Virginia New Jersey New Jersey Pennsylvania Pennsylvania Maryland Maryland Kentucky Kentucky Indiana Indiana Ohio Ohio |
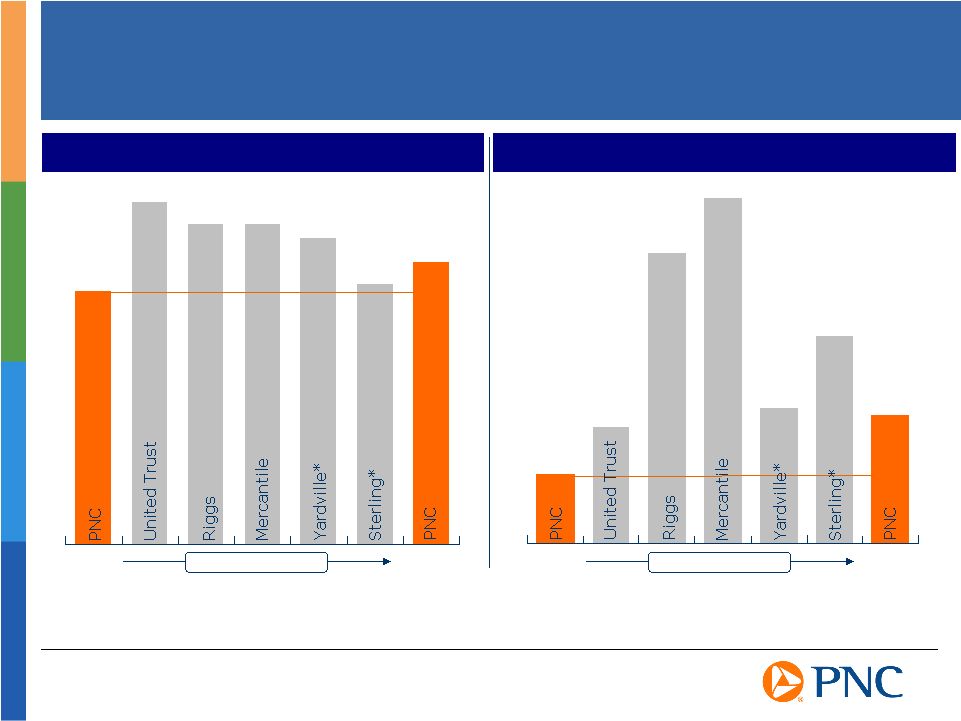
Projected 5-Year Population Growth Median Household Income $60,949 $56,250 $69,270 $54,620 $73,965 $69,363 $66,273 PNC Demographics Continue to Improve 3.7% 6.0% 2.0% 3.4% 8.4% 10.0% 3.9% 2003 Proforma Acquisitions 2003 Proforma Acquisitions Amounts based on data at time of acquisition announcement. United Trust data reflects
demographics of footprint counties weighted by households. Mercantile, Yardville
and Sterling data reflect demographics of footprint counties of that company, or by MSA in the case of Riggs, weighted by deposits. PNC 2003 and PNC Proforma amounts reflect demographics, weighted
by deposits, of PNCs 68 county footprint and 105 county footprint, respectively,
including the impact of PNCs ongoing branch optimization process. PNC and Mercantile headquarter offices excluded for purposes of deposit weighting. Source: SNL DataSource.
*Pending. |
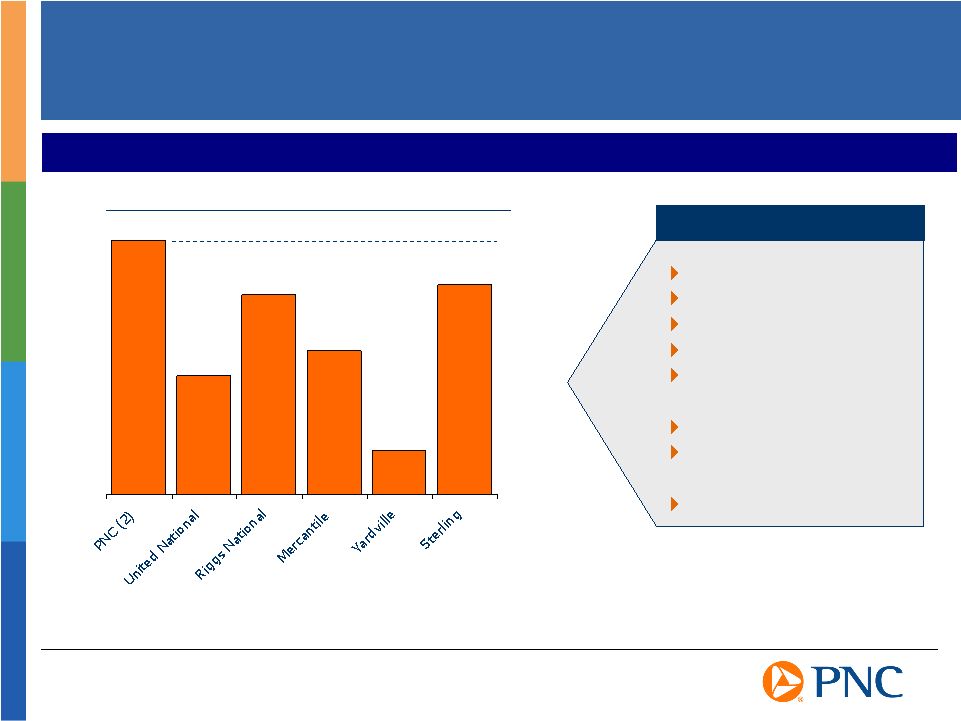
(1) United,
Riggs, and Mercantile based on the most recent reporting quarter prior to closing. Yardville and Sterling based on most recent reporting quarter, and in the case of Sterling, excludes its Equipment Finance, LLC unit.
Source: SNL DataSource Bringing the Power of PNC to New Clients Expanding Distribution of Fee-based Products 51% 24% 40% 29% 9% 42% Noninterest income to total revenue¹
Wealth Management Brokerage Credit Card On-line banking Treasury Management Small Business M&A Advisory Services Capital Markets Opportunities (2) For the six months ended June 30, 2007, not including PFPC and BlackRock. Reconciled to
noninterest income to total revenue on a GAAP basis of 59% in the Appendix. |
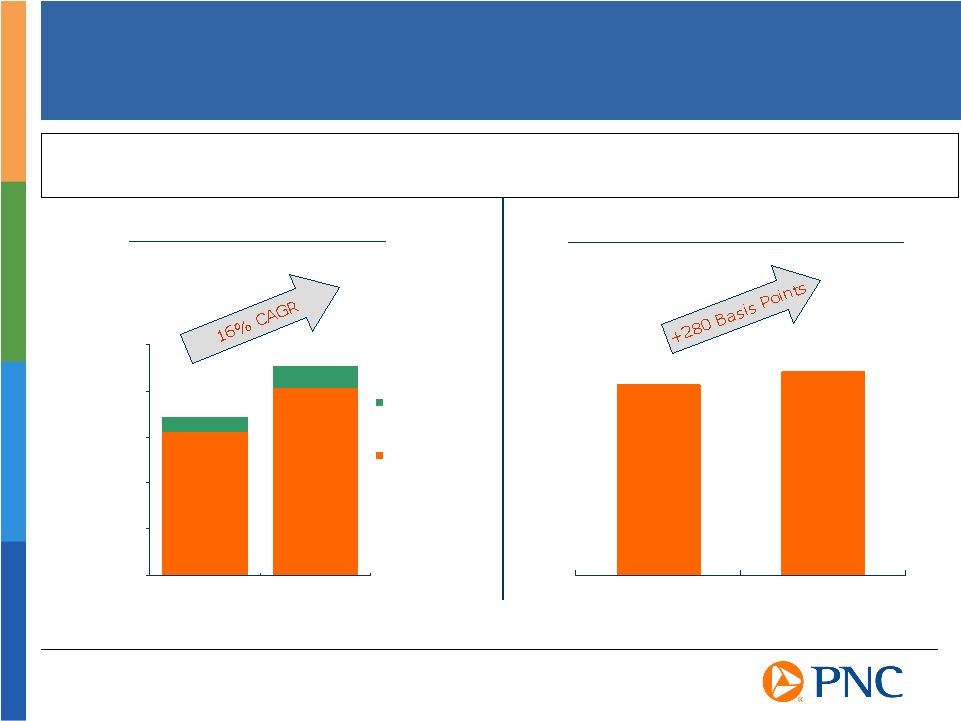
40.5%
43.3% Executing on Product Depth and Sales Capabilities in Expanded Markets Growing Noninterest Income and Deepening Relationships in the Greater Washington Area (GWA) Region Post Riggs Acquisition*
(2) For the three months ended March 31, 2006 compared to the six
months ended June 30, 2007 GWA noninterest income to total revenue PNC - GWA Retail Relationships 1 (1) Riggs transaction completed May 2005 PNC GWA Region 2 *Does not include Mercantile 25,000 50,000 75,000 100,000 125,000 June 30, 2005 June 30, 2007 GWA business checking relationships GWA consumer checking relationships |

A history of
execution A diversified business mix with clear strategies for growth A strong risk management process A disciplined capital deployment strategy PNC is differentiated by
|
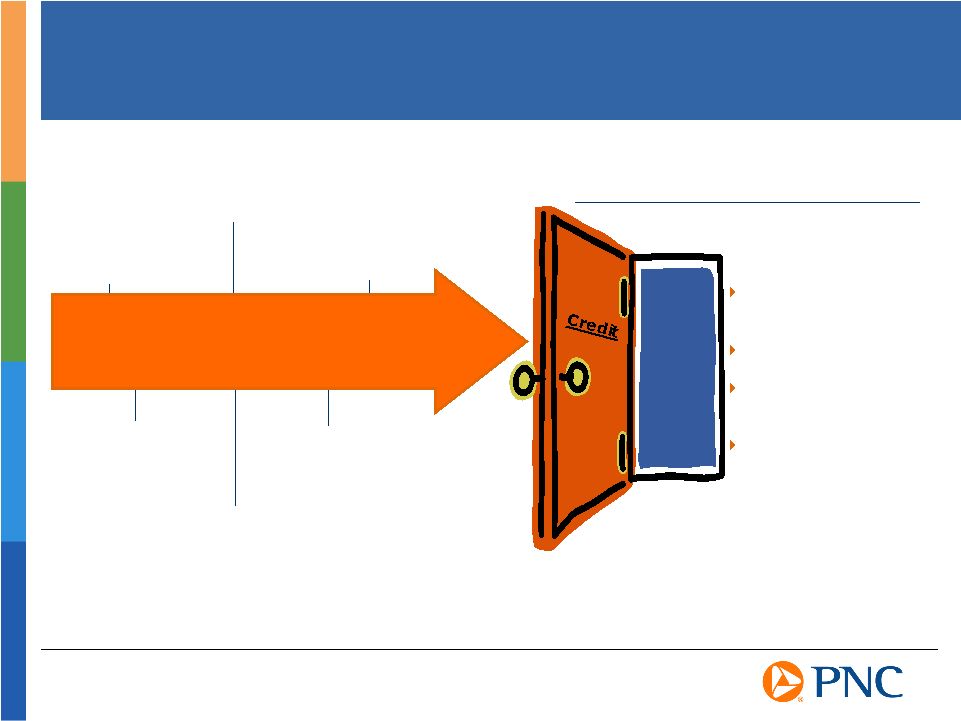
New Credit
Risk Rating System Improved Credit Training PNCs Credit Culture Evolution Adherence to Target Zone of Losses Organizational Independence Early Workout Intervention Credit Culture Evolution (2000 Present) Focus on Getting Paid Per Unit of Risk Help Talk Listen Teamwork Focus on the Front Door Proactive Process Driven by Returns Not overly concentrated in any area More granularity Limited exposure to leveraged lending Strong origination and distribution capabilities |

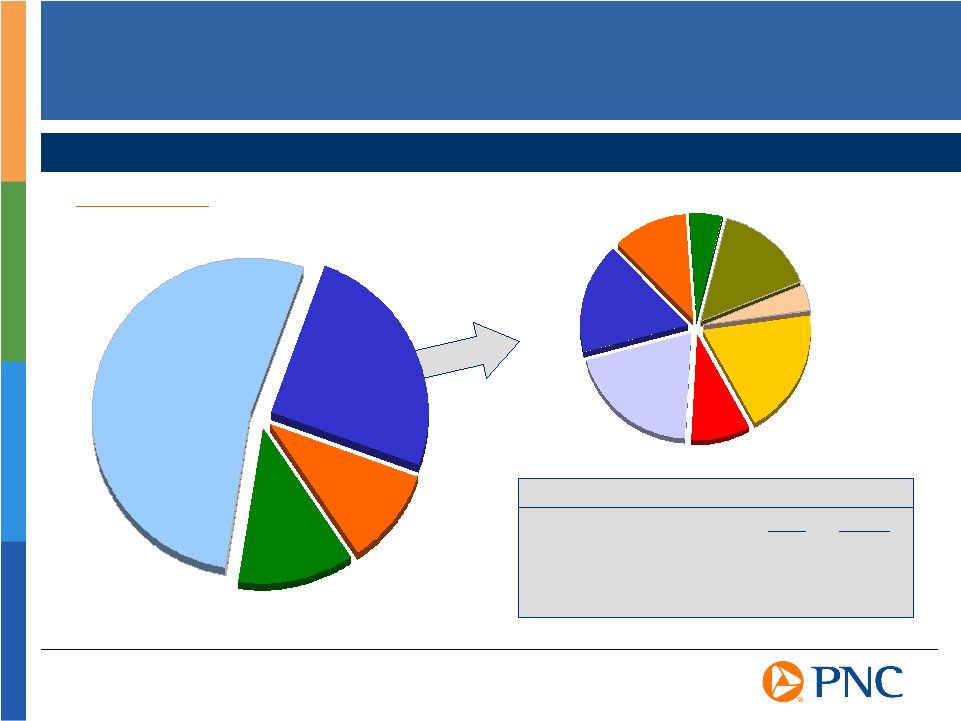
High Quality
Consumer Loan Portfolio Auto 7% Residential Mortgage 34% Composition of Consumer Loan and Residential Mortgage Portfolio As of June 30, 2007 Home Equity Portfolio Credit Statistics First lien positions 42% In-footprint exposure 92% Weighted average: Loan to value 70% FICO scores 727 Net charge-offs 0.18% 90 days past due 0.26% June 30, 2007 (1) Not including Mercantile Other 7% Home Equity 52% 1 |
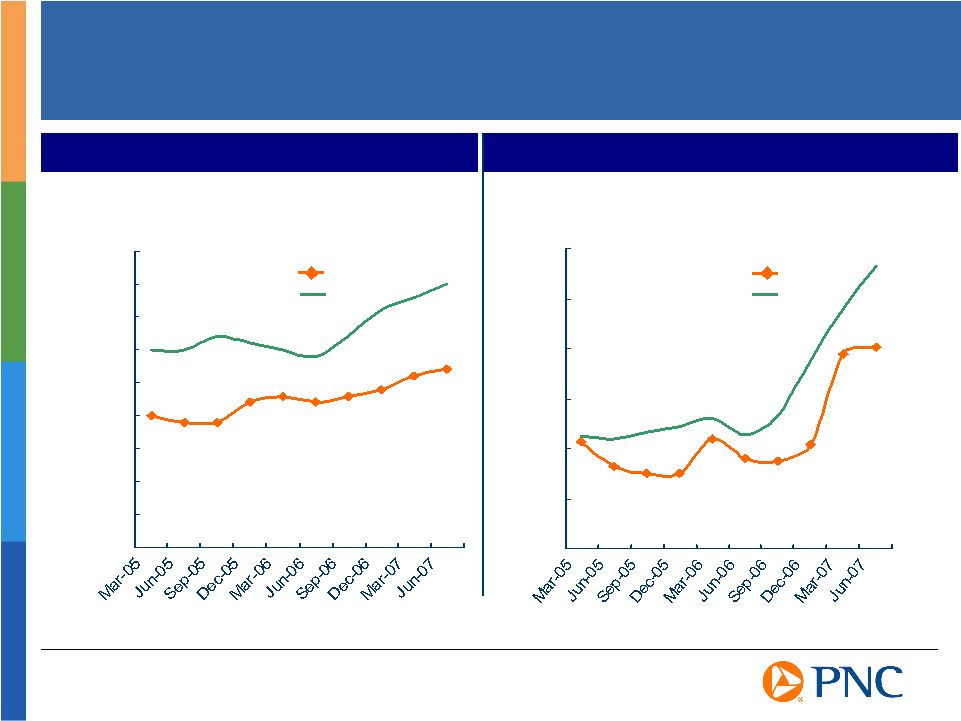
0.00%
0.05% 0.10% 0.15% 0.20% 0.25% 0.30% 0.00% 0.05% 0.10% 0.15% 0.20% 0.25% 0.30% 0.35% 0.40% 0.45% Home Equity Credit Trends % of outstandings Delinquency Ratio 90+ Days Net Charge-Offs PNC¹
RMA Source: The Risk Management Association (RMA) Consumer Loan Studies, Home
Equity % of average outstandings PNC¹
RMA (1) Not including Mercantile |
Well-balanced Commercial Portfolio Composition of Commercial Portfolio As of June 30, 2007 CRE Portfolio Statistics PNC Peers CRE/total assets (1) 10% 18% CRE/tier 1 capital (1) 146% 244% Office 20% Multi-Family 9% Raw Land 4% Condo, Single Family, Residential Land 19% Hotel 5% Industrial 11% Other 15% Retail 17% (1) As of March 31, 2007 Peers reflects average of the super-regional banks identified in the Appendix other than
PNC Commercial Other 53% Asset- Based 12% Commercial Real Estate 25% Equipment Leasing 10% |
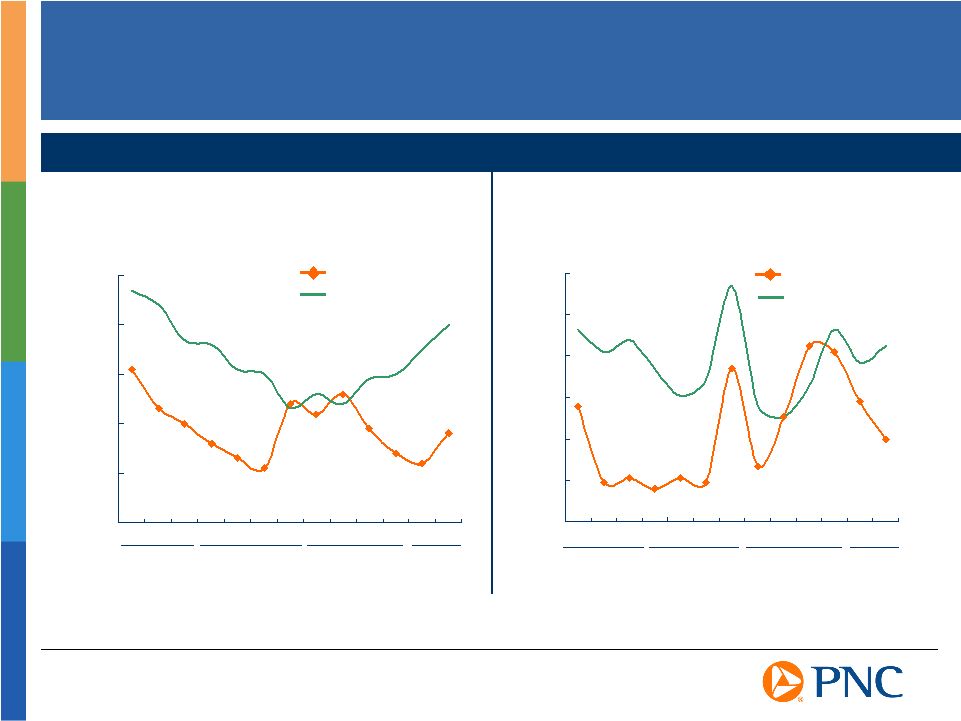
0.2% 0.3% 0.4% 0.5% 0.6% 0.7% 2Q 3Q 4Q 1Q 2Q 3Q 4Q 1Q 2Q 3Q 4Q 1Q 2Q 0.05% 0.13% 0.20% 0.28% 0.35% 0.43% 0.50% 2Q 3Q 4Q 1Q 2Q 3Q 4Q 1Q 2Q 3Q 4Q 1Q 2Q 2007 Disciplined Approach Leads to Excellent Asset Quality Asset Quality Compared to Peers Net Charge-offs to Average Loans PNC Peer Group Source: SNL DataSource, PNC as reported PNC 2Q05 net charge-off ratio excludes $53 million loan recovery. The ratio was (0.32%)
including the recovery. Peer group reflects average of super-regional banks
identified in the Appendix excluding PNC Nonperforming Assets to Loans, Loans Held for Sale and Foreclosed Assets PNC Peer Group 2004 2005 2006 2007 2004 2005 2006 * * |

Interest Rate
Risk Well-Positioned for this Environment Net interest margin expected to remain stable for the second half of 2007 Duration of equity of approximately 3.2 years for second quarter 2007 Less net interest income dependent due to high fee revenue contribution Low cost deposit franchise provides funding advantage |

A history of
execution A diversified business mix with clear strategies for growth A strong risk management process A disciplined capital deployment strategy PNC is differentiated by
|
Capital Flexibility Disciplined Capital Deployment Earnings Growth Exiting under- performing assets Maintaining a moderate risk profile Sources Investing in and growing our businesses - Enhancing the brand - Improving the customer experience - High return, high growth products - Technology and innovation Making Disciplined Acquisitions - Strategy driven - Value-added financial objectives - Appropriate risk evaluation Returning capital to shareholders - Repurchased $395 million of common stock in first half 2007 - Increased dividend 15% in 2Q07 Uses |

Summary
A history of execution Clear strategies for growth Sound risk management processes Disciplined capital deployment philosophy Well Positioned to Create Value |

We
make statements in this presentation, and we may from time to time make other statements, regarding our outlook or expectations for earnings, revenues, expenses and/or other matters regarding or affecting PNC that are forward-looking
statements within the meaning of the Private Securities Litigation Reform Act. Forward-looking statements are typically identified by words such as believe, expect, anticipate, intend, outlook, estimate, forecast, project and other similar words and expressions. Forward-looking statements are subject to numerous assumptions, risks and
uncertainties, which change over time. Forward-looking statements speak only as of the date they are made. We do not assume any duty and do not undertake to update our forward-looking statements. Because forward-looking statements are subject to assumptions and uncertainties, actual results or future events could differ, possibly materially, from those that we
anticipated in our forward-looking statements, and future results could
differ materially from our historical performance. Our forward-looking
statements are subject to the following principal risks and uncertainties. We provide greater detail regarding some of these factors in our Form 10-K for the year ended December 31, 2006, including in the Risk Factors and Risk
Management sections of that report, and in our first quarter 2007 Form 10-Q and other SEC reports. Our forward-looking statements may also be subject to other
risks and uncertainties, including those that we may discuss elsewhere in this presentation or in our filings with the SEC, accessible on the SECs website at www.sec.gov and on or through our corporate website at www.pnc.com under About PNC Investor Relations Financial Information. Our business and operating results are affected by business and economic conditions
generally or specifically in the principal markets in which we do business.
We are affected by changes in our customers and counterparties financial performance, as well as changes in customer preferences and behavior, including as a result of changing business and economic conditions. The value of our assets and liabilities, as well as our overall financial performance,
is also affected by changes in interest rates or in valuations in the debt and equity markets. Actions by the Federal Reserve and other government agencies,
including those that impact money supply and market interest rates, can affect our activities and financial results. Our operating results are affected by our liability to provide shares of BlackRock
common stock to help fund BlackRock long-term incentive plan (LTIP) programs, as our LTIP liability is adjusted quarterly
(marked-to-market) based on changes in BlackRocks common stock price and the number of remaining committed shares, and we recognize gain or loss on such shares at such times as shares
are transferred for payouts under the LTIP programs. Competition can have an impact on customer acquisition, growth and retention, as well
as on our credit spreads and product pricing, which can affect market share, deposits and revenues. Our ability to implement our business initiatives and strategies could affect our financial performance over the next several years. Legal and regulatory developments could have an impact on our ability to operate our
businesses or our financial condition or results of operations or our competitive position or reputation. Reputational impacts, in turn, could affect
matters such as business generation and retention, our ability to attract and retain management, liquidity and funding. These legal and regulatory developments
could include: (a) the unfavorable resolution of legal proceedings or regulatory and other governmental inquiries; (b) increased litigation risk from
recent regulatory and other governmental developments; (c) the results of the regulatory examination process, our failure to satisfy the requirements of agreements with governmental agencies, and regulators future use of supervisory and enforcement tools; (d) legislative and regulatory reforms, including changes to laws and regulations involving tax, pension, education lending, and the protection of confidential customer information; and (e) changes in accounting policies and principles. Our business and operating results are affected by our ability to identify and
effectively manage risks inherent in our businesses, including, where appropriate, through the effective use of third-party insurance and capital management
techniques. Our ability to anticipate and respond to technological changes can have an impact on
our ability to respond to customer needs and to meet competitive demands. Cautionary Statement Regarding Forward-Looking Information |

The adequacy of our intellectual property protection, and the extent of any costs
associated with obtaining rights in intellectual property claimed by others, can impact our business and operating results. Our business and operating results can also be affected by widespread natural
disasters, terrorist activities or international hostilities, either as a result of the impact on the economy and financial and capital markets generally or on us or on our customers,
suppliers or other counterparties specifically. Also, risks and uncertainties that could affect the results anticipated in
forward-looking statements or from historical performance relating to our equity interest in BlackRock, Inc. are discussed in more detail in BlackRocks 2006 Form 10-K, including in
the Risk Factors section, and in BlackRocks other filings with the SEC, accessible on the SECs website and on or through BlackRocks website at www.blackrock.com. We grow our business from time to time by acquiring other financial services companies, including the pending Sterling Financial Corporation (Sterling) and Yardville National Bancorp (Yardville) acquisitions. Acquisitions in general present us with
risks other than those presented by the nature of the business acquired. In particular, acquisitions may be substantially more expensive to complete (including as a result of costs incurred in connection with
the integration of the acquired company) and the anticipated benefits (including anticipated cost savings and strategic gains) may be significantly harder or take longer to achieve than expected. In some cases, acquisitions involve our entry into new businesses or new geographic or other markets, and these situations also present risks resulting from our
inexperience in these new areas. As a regulated financial institution, our pursuit of attractive acquisition opportunities could be negatively impacted due to regulatory delays or other regulatory
issues. Regulatory and/or legal issues related to the pre-acquisition operations of an acquired business may cause reputational harm to PNC following the acquisition and integration of the acquired business into ours and may result in additional future costs arising as a result of those issues. Post-closing acquisition risk continues to apply to Mercantile
Bankshares Corporation as we complete the integration. Any annualized,
proforma, estimated, third party or consensus numbers in this presentation are used for illustrative or comparative purposes only and may not reflect actual results. Any consensus earnings estimates are calculated based on the earnings projections made by analysts who cover that company. The analysts opinions, estimates or forecasts (and therefore the consensus earnings estimates) are theirs alone, are not those of PNC or
its management, and may not reflect PNCs, Yardvilles, Sterlings or other companys actual or anticipated results. Cautionary Statement Regarding Forward-Looking Information (continued)
|

The PNC
Financial Services Group, Inc. and Sterling Financial Corporation will be filing a proxy statement/prospectus and other relevant documents concerning the merger with the United States Securities and Exchange Commission (the "SEC"). WE URGE INVESTORS TO READ THE PROXY
STATEMENT/PROSPECTUS AND ANY OTHER DOCUMENTS TO BE FILED WITH THE SEC IN CONNECTION
WITH THE MERGER OR INCORPORATED BY REFERENCE IN THE PROXY STATEMENT/PROSPECTUS BECAUSE THEY WILL CONTAIN IMPORTANT INFORMATION. Investors will be able to obtain these documents free of charge at the SEC's web site
(www.sec.gov). In addition, documents filed with the SEC by The PNC Financial Services
Group, Inc. will be available free of charge from Shareholder Relations at (800)
843-2206. Documents filed with the SEC by Sterling Financial Corporation will
be available free of charge from Sterling Financial Corporation by contacting Shareholder Relations at (877) 248-6420. The directors, executive officers, and certain other members of management and employees of
Sterling Financial Corporation are participants in the solicitation of proxies in favor
of the merger from the shareholders of Sterling Financial Corporation.
Information about the directors and executive officers of Sterling Financial
Corporation is included in the proxy statement for its May 8, 2007 annual meeting of shareholders, which was filed with the SEC on April 2, 2007. Additional information regarding
the interests of such participants will be included in the proxy statement/prospectus
and the other relevant documents filed with the SEC when they become available.
Additional Information About The PNC/Sterling Financial Corporation Transaction |

The PNC
Financial Services Group, Inc. (PNC) and Yardville National Bancorp (Yardville) have filed with the United States Securities and Exchange Commission (the SEC) a Registration Statement
on Form S-4 that includes a preliminary version of a proxy statement of Yardville
that also constitutes a preliminary prospectus of PNC. The S-4 has not yet
become effective. The parties will file other relevant documents concerning the
proposed transaction with the SEC. Following the S-4 being declared effective
by the SEC, Yardville intends to mail the final proxy statement to its
shareholders. Such final documents, however, are not currently available.
WE URGE INVESTORS TO READ THE FINAL PROXY STATEMENT/PROSPECTUS AND ANY OTHER DOCUMENTS
TO BE FILED WITH THE SEC IN CONNECTION WITH THE MERGER OR INCORPORATED BY REFERENCE IN
THE PROXY STATEMENT/PROSPECTUS, IF AND WHEN THEY BECOME AVAILABLE, BECAUSE THEY WILL
CONTAIN IMPORTANT INFORMATION. Investors may obtain these documents, if and when they
become available, free of charge at the SEC's web site (www.sec.gov). In addition,
documents filed with the SEC by PNC will be available free of charge from Shareholder
Relations at (800) 843-2206. Documents filed with the SEC by Yardville will be available free of charge from Yardville by contacting Howard N. Hall, Assistant Treasurer's Office,
2465 Kuser Road, Hamilton, NJ 08690 or by calling (609) 631-6223. The directors, executive officers, and certain other members of management and employees of
Yardville are participants in the solicitation of proxies in favor of the merger from
the shareholders of Yardville. Information about the directors and executive officers
of Yardville is set forth in its Annual Report on Form 10-K filed on March 30, 2007
for the year ended December 31, 2006, as amended by the Form 10-K/A filed on May
10, 2007. Additional information regarding the interests of such participants will be included in the proxy statement/prospectus and the other relevant documents filed with the SEC if and when
they become available. Additional Information About The PNC/Yardville National Bancorp Transaction |

Non-GAAP
to GAAP Reconcilement Appendix Earnings Summary THREE MONTHS ENDED Pretax Net Diluted Pretax Net Diluted Pretax Net Diluted In millions, except per share data Adjustments Income EPS Impact Adjustments Income EPS Impact Adjustments Income EPS Impact Net income, as reported $423 $1.22 $459 $1.46 $381 $1.28 Adjustments: BlackRock LTIP (a) $1 $(52) (33) (.11) Integration costs (b) 16 11 .03 13 8 .03 $13 5 .02 Net income, as adjusted $434 $1.25 $434 $1.38 $386 $1.30 SIX MONTHS ENDED Pretax Net Diluted Pretax Net Diluted In millions, except per share data Adjustments Income EPS Impact Adjustments Income EPS Impact Net income, as reported $882 $2.67 $735 $2.47 Adjustments: BlackRock LTIP (a) $(51) (33) (.11) Integration costs (b) 29 19 .07 $19 8 .03 Net income, as adjusted $868 $2.63 $743 $2.50 (a) Includes the impact of the gain recognized in connection with PNC's transfer of BlackRock shares to satisfy a portion of our 2002 LTIP shares obligation and the net mark-to- market adjustment on our remaining BlackRock LTIP shares obligation, as applicable. (b) Amounts for 2007 include both Mercantile acquisition and BlackRock/MLIM transaction integration costs. BlackRock/MLIM transaction integration costs recognized by PNC in 2007 were included in noninterest income as a negative component of the "Asset management" line item, which includes the impact of our equity earnings from our investment in BlackRock. The second quarter of 2006 BlackRock/MLIM transaction integration costs were included in
noninterest expense. June 30, 2007 March 31, 2007 June 30, 2006 June 30, 2007 June 30, 2006 |

Non-GAAP
to GAAP Reconcilement Appendix Income Statement Summary For the Six Months Ended June 30 SIX MONTHS ENDED In millions As Reported Adjustments As Adjusted (a) As Reported Adjustments As Adjusted (b) Net interest income $1,361 $1,361 $1,112 $(7) $1,105 Taxable-equivalent adjustment 14 14 13 13 Net interest income, taxable-equivalent basis 1,375 1,375 1,125 (7) 1,118 Net interest income: % Change As Adjusted % Change As Reported Loans 526 526 472 (7) 465 13% 11% Deposits 849 849 653 653 30% 30% Noninterest Income 1,966 (48) 1,918 2,415 (666) 1,749 10% (19%) Total revenue, taxable equivalent basis 3,341 (48) 3,293 3,540 (673) 2,867 15% (6%) Loan net interest income as a % of total revenue, TE 16.0% 16.2% Deposit net interest income as a % of total revenue, TE 25.8% 22.8% Noninterest income as a % of total revenue, TE 58.2% 61.0% Provision for credit losses 62 62 66 66 Noninterest income 1,966 $(48) 1,918 2,415 (666) 1,749 Noninterest expense 1,984 (26) 1,958 2,307 (561) 1,746 12% Income before minority interest and income taxes 1,281 (22) 1,259 1,154 (112) 1,042 Minority interest in income of BlackRock 41 (41) Income taxes 399 (8) 391 378 (79) 299 Net income $882 ($14) $868 $735 $8 $743 17% SIX MONTHS ENDED As Reported Adjustments As Adjusted (a) As Reported Adjustments As Adjusted (b) % Change As Adjusted % Change As Reported Noninterest expense 1,984 (26) 1,958 2,307 (561) 1,746 12% (14%) Noninterest expense, excluding Mercantile expense of $156 million 1,828 (26) 1,802 2,307 (561) 1,746 3% June 30, 2007 June 30, 2006 June 30, 2007 June 30, 2006 (a) Amounts adjusted to exclude the impact of the following pretax items: (1) the net mark-to-market adjustment charge totaling $1 million for the second quarter and a net effect of $51 million (consisting of the gain recognized in connection with our first quarter shares transfer net of the mark-to-market adjustment charge for both quarters) for the first six months of 2007 on our BlackRockLTIP shares obligation, and (2) Mercantile acquisition and BlackRock/MLIM transaction integration costs totaling
$16 million for the second quarter and $29 million for the first six months of
2007. (b) Amounts adjusted as if we had recorded our investment in BlackRock on the equity method and to exclude PNC's portion of BlackRock/MLIM transaction integration costs of $13 million and $19 million before taxes for the second quarter and first six months of 2006, respectively.
|

Non-GAAP
to GAAP Reconcilement Appendix Business Segment Earnings and Operating Leverage OPERATING LEVERAGE SIX MONTHS ENDED Dollars in millions As Reported As Adjusted (b) As Reported As Adjusted (c) As Reported As Adjusted Net interest income $1,361 $1,361 $1,112 $1,105 Noninterest income Asset management 355 358 890 257 Other 1,611 1,560 1,525 1,492 Total revenue $3,327 $3,279 $3,527 $2,854 (6%) 15% Noninterest expense $1,984 $1,958 $2,307 $1,746 (14%) 12% Operating leverage 8% 3% (c) See note (b) on previous slide. June 30, 2007 June 30, 2006 Change (b) See note (a) on previous slide. Six Months Ending June 30 Earnings (Loss) Dollars in millions 2007 % of Segments Retail Banking $428 50% Corporate & Institutional Banking 254 30% BlackRock (a) 110 13% PFPC 63 7% Total business segment earnings 855 Other (a) 27 Total consolidated net income $882 (a) For our segment reporting presentation in management's discussion and analysis, our share of pretax BlackRock/MLIM transaction integration costs totaling $3 million for the six months ended June 30, 2007 have been reclassified from BlackRock to "Other." "Other" for the first six months of 2007 also includes $26 million of pretax Mercantile acquisition integration costs. |

Non-GAAP
to GAAP Reconcilement Appendix Average Balance Sheet and Noninterest Income Six Months Ending June 30, 2007 Dollars in millions Retail Banking Corporate & Institutional Banking Other Banking and Other BlackRock PFPC Total Net interest income (expense) $984 $371 $15 $1,370 ($9) $1,361 Noninterest income 830 374 205 1,409 $140 417 1,966 Total Revenue $1,814 $745 $220 $2,779 $140 $408 $3,327 Noninterest income as a % of total revenue 46% 50% 93% 51% 100% 102% 59% Average Balance Sheet for the three months ended: June 30, 2007 June 30, 2006 $ millions PNC Excluding Mercantile Mercantile (a) PNC As Reported PNC % Change Excluding Mercantile % Change Including Mercantile Average loans, net of unearned income Commercial $20,919 $3,733 $24,652 $20,348 3% 21% Commercial real estate 3,456 6,057 9,513 3,071 13% 210% Consumer 16,257 1,629 17,886 16,049 1% 11% Residential mortgages 7,437 1,090 8,527 7,353 1% 16% Other, including total unearned income (b) 2,969 8 2,977 3,115 (5%) (4%) Total average loans, net of unearned income $51,038 $12,517 $63,555 $49,936 2% 27% Average deposits Interest-bearing $51,111 $9,293 $60,404 $48,710 5% 24% Noninterest-bearing 14,707 3,117 17,824 13,926 6% 28% Total average deposits $65,818 $12,410 $78,228 $62,636 5% 25% (a) Mercantile activity is from the closing on March 2, 2007 through March 31, 2007. (b) Includes lease financing. |

The PNC
Financial Services Group, Inc. PNC BB&T Corporation BBT Comerica CMA Fifth Third Bancorp FITB KeyCorp KEY National City Corporation NCC Regions Financial RF SunTrust Banks, Inc. STI U.S. Bancorp USB Wachovia Corporation WB Wells Fargo & Company WFC Ticker Peer Group of Super-Regional Banks Appendix |