SLIDE PRESENTATION AND RELATED MATERAL FOR LEHMAN BROTHERS
Published on May 16, 2007

The PNC
Financial Services Group, Inc. Lehman Brothers Tenth Annual Financial Services Conference May 16, 2007 Exhibit 99.1 |

This presentation contains forward-looking statements regarding our outlook or expectations relating to PNCs future business, operations, financial condition, financial performance and asset quality. Forward-looking statements are necessarily subject to numerous assumptions, risks and uncertainties, which change over time. The forward-looking statements in this presentation are qualified by the factors affecting forward-looking statements identified in the more detailed Cautionary Statement included in the Appendix, which is in the version of the presentation materials posted on our corporate website at www.pnc.com/investorevents. We provide greater detail regarding those factors in our 2006 Form 10-K, including in the Risk Factors and Risk Management sections, and in our first quarter 2007 Form 10-Q and other SEC reports (accessible on the SECs website at www.sec.gov and on or through our corporate website). Future events or circumstances may change our outlook or expectations and may also affect the nature of the assumptions, risks and uncertainties to which our forward-looking statements are subject. The forward-looking statements in this presentation speak only as of the date of this presentation. We do not assume any duty and do not undertake to update those statements. In this presentation, we will sometimes refer to adjusted results to help illustrate (1) the impact of BlackRock deconsolidation near the end of third quarter 2006 and the application of the equity method of accounting for our equity investment in BlackRock and (2) the impact of certain specified items, including 2006 BlackRock/MLIM transaction gain, 2006 cost of securities and mortgage portfolio repositionings, 2006 and 2007 BlackRock/MLIM and Mercantile Bankshares acquisition integration costs, and 2006 and 2007 gains/losses related to our BlackRock LTIP shares obligation. We have provided these adjusted amounts and reconciliations so that investors, analysts, regulators and others will be better able to evaluate the impact of these items on our results for the periods presented, in addition to providing a basis of comparability for the impact of the BlackRock deconsolidation given the magnitude of the impact of deconsolidation on various components of our income statement and balance sheet. We believe that information as adjusted for the impact of the specified items may be useful due to the extent to which these items are not indicative of our ongoing operations as the result of our management activities on those operations. While we have not provided other adjustments for the periods discussed, this is not intended to imply that there could not have been other similar types of adjustments, but any such adjustments would not have been similar in magnitude to those shown. In certain discussions, we also provide revenue information on a taxable-equivalent basis by increasing the interest income earned on tax-exempt assets to make it fully equivalent to interest income earned on taxable investments. We believe this adjustment may be useful when comparing yields and margins for all earning assets. This presentation may also include a discussion of other non-GAAP financial measures, which, to the extent not so qualified therein or in the Appendix, is qualified by GAAP reconciliation information available on our corporate website at www.pnc.com under About PNC - Investor Relations. Cautionary Statement Regarding Forward-Looking Information and Adjusted Information |
PNC
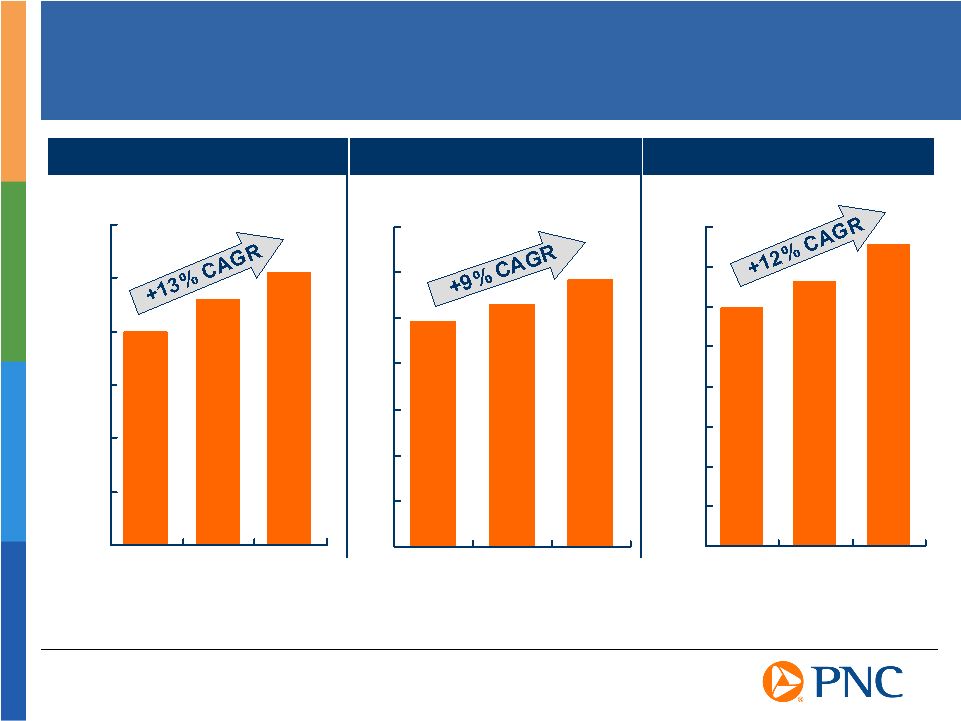
A Diversified Financial Services Company Delivering Solid Growth $0 $1 $2 $3 $4 $5 $6 $7 2004 2005 2006 $0 $20 $40 $60 $80 $100 $120 2004 2005 2006 $0.0 $0.2 $0.4 $0.6 $0.8 $1.0 $1.2 $1.4 $1.6 2004 2005 2006 Revenue* (taxable-equivalent)
Year End Assets Earnings $ billions $ billions $ billions Adjusted. Reported revenue was $5.6 billion, $6.4 billion, and $8.6 billion for 2004, 2005,
and 2006, respectively. Reported net income was $2.6 billion for 2006. Adjusted numbers
and taxable-equivalent revenue are reconciled to GAAP in the Appendix. * * |

Assets $123 billion Total revenue $1.6 billion Net income $459 million Noninterest income to total revenue 61% Net interest margin 2.95% Nonperforming loans to total loans .28% Tangible Common Equity 5.8% 1Q07 Financial Highlights Strong Execution Drives Outstanding First Quarter Results Reported earnings of $1.46 per diluted share Created positive operating leverage with 1Q06 on an adjusted basis* Balance sheet well positioned for this environment Maintained exceptional asset quality Increased 2Q07 dividend 15% Mercantile acquisition closed and integration well underway *Adjusted numbers are reconciled to GAAP in the Appendix. |
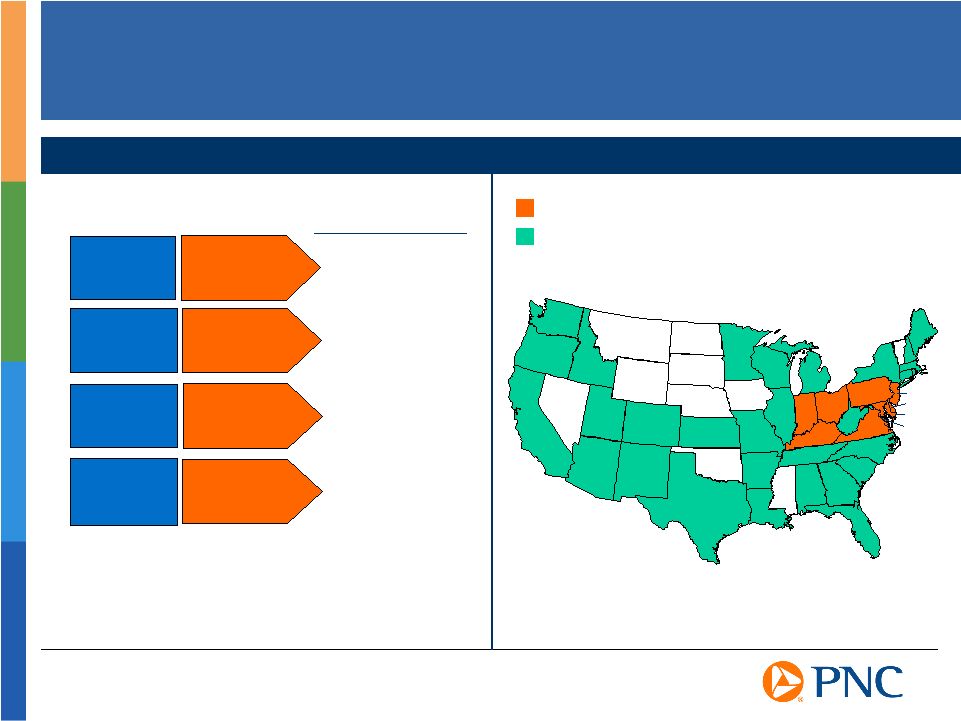
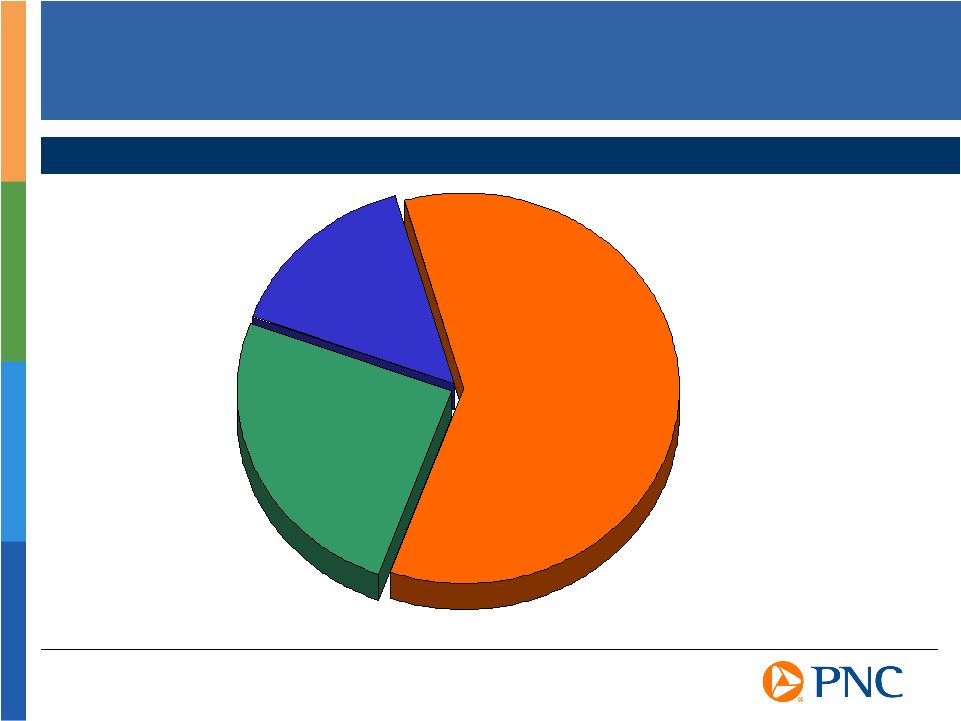
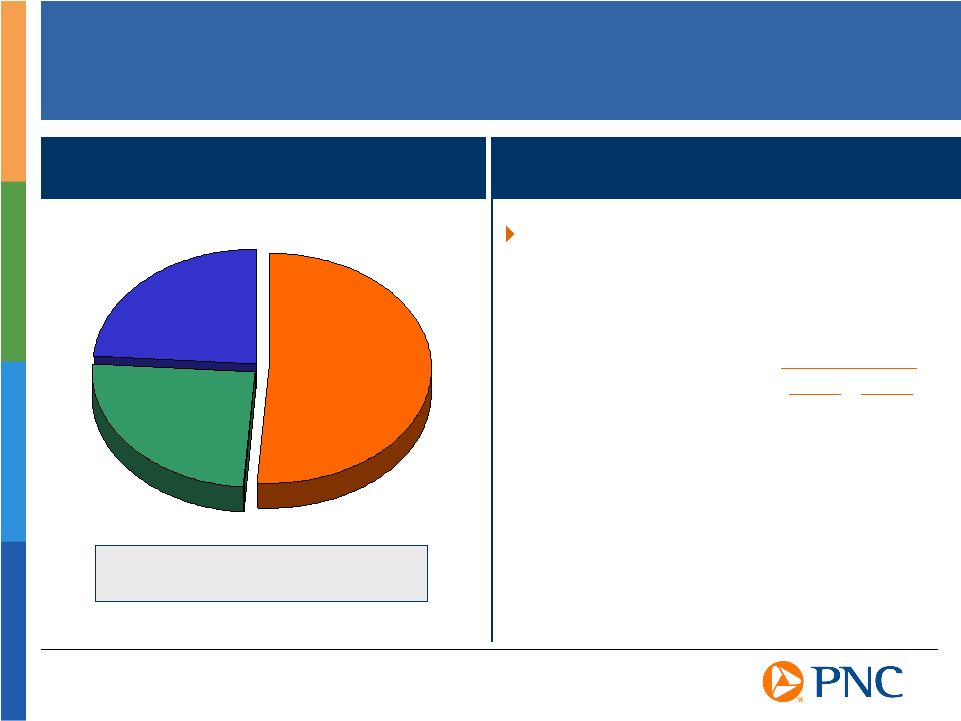
Business
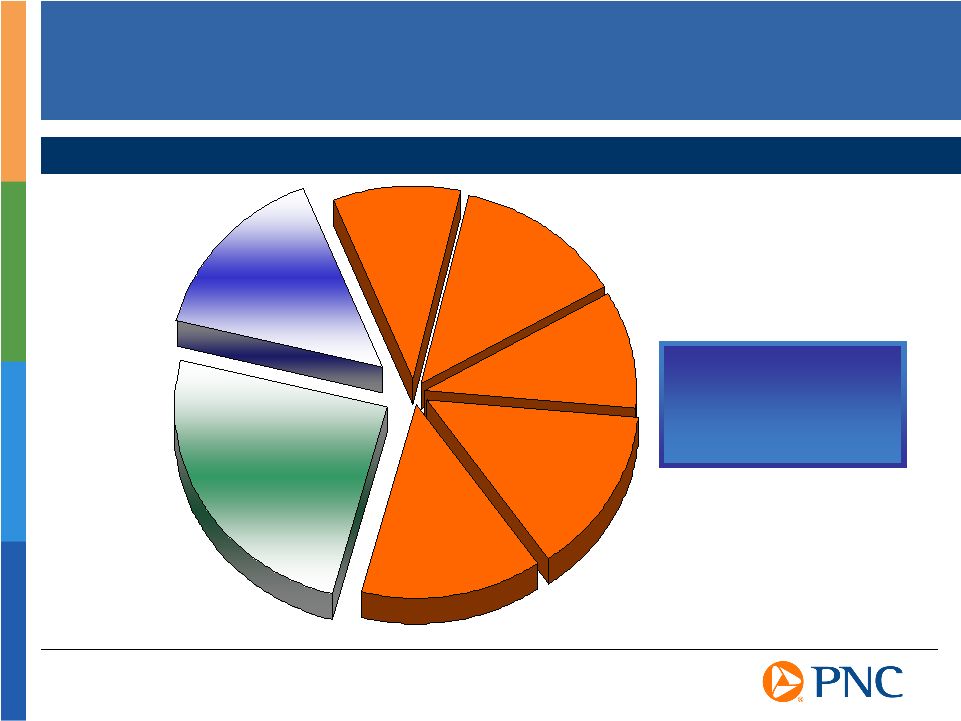
Segments At A Glance A Diversified Business Mix PNC Bank Branches PNC Employees / Offices Outside of Retail Footprint IN OH PA KY NJ DE VA DC MD Winning in the Payments Space A Premier Middle-market Franchise World Class Asset Manager A Leading Global Servicing Platform Retail Banking Corporate & Institutional Banking BlackRock PFPC Segment Focus 1Q07 Business Earnings Contribution* 48% 32% 13% 7% *Total business segment earnings are reconciled to total GAAP consolidated earnings in the Appendix. |
A More Valuable
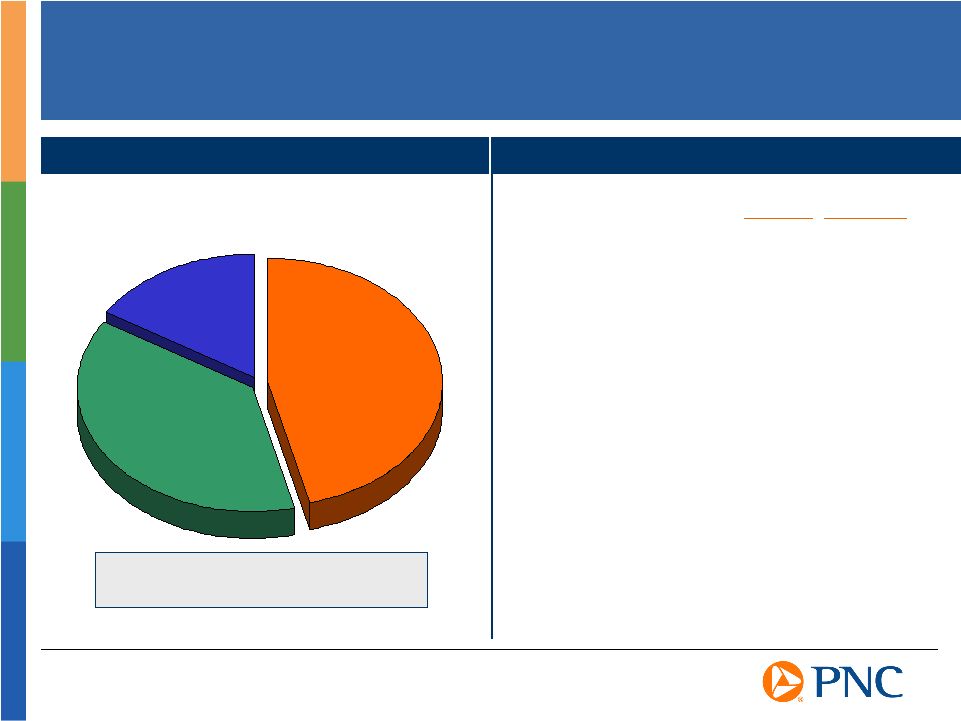
Revenue Mix Noninterest Income 61% Deposit Net Interest Income* 25% Loan Net Interest Income* 14% *Deposit net interest income and loan net interest income are reconciled to reported net interest
income in the Appendix. Contribution to Total Revenue For the Three Months Ended March 31, 2007 |

Expanding fee
based businesses Gathering low-cost deposits Using credit selectively Creating positive operating leverage Maintaining moderate risk profile Strategies to Create Quality Growth |
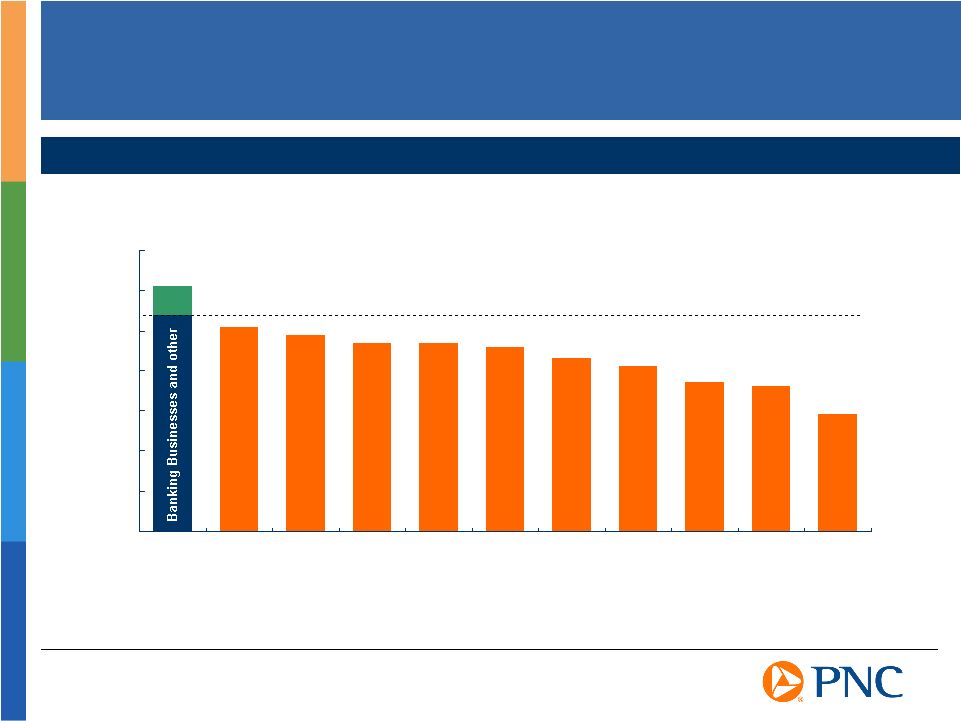
0% 10% 20% 30% 40% 50% 60% 70% PNC USB KEY WFC FITB WB STI BBT RF NCC CMA Fee-Based Businesses Differentiate PNC Source: SNL DataSource, PNC as reported For the three months ended March 31, 2007 PFPC & BLK Noninterest Income to Total Revenue |
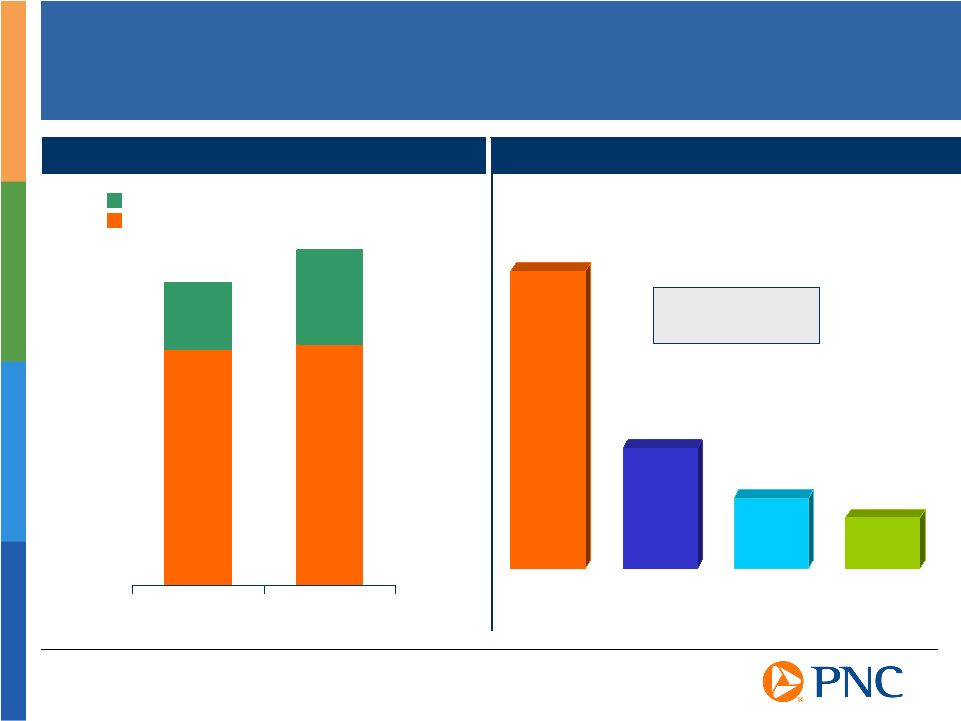
Diverse Revenue
Streams *Deposit net interest income and loan net interest income are reconciled to
reported net interest income in the Appendix. Deposit Net Interest Income* Loan Net Interest Income* 10% 25% 14% Asset Management 10% Consumer Services, Brokerage and Deposit Charges 13% Fund Servicing 14% Corporate Services 14% Equity Management, Trading and Other Contribution to Total Revenue For the Three Months Ended March 31, 2007 Noninterest Income increased 13% 1Q07 vs 1Q06 |
Retail
Banking Revenue Contribution* Retail Banking Leveraging the Payments Business to Drive Fee Revenue Growth For the three months ended March 31, 2007 Growth is for 1Q07 vs. 1Q06, not including Mercantile Reflects growth in users, not including Mercantile Small Business Small Business debit card revenue ($ millions)
$3.1 +20% Small Business online banking users 48% +12% Consumer Consumer debit card revenue ($ millions)
$26.1 +10% Consumer online banking users 54% +9% Consumer online bill-pay users 25% +78% Growth (1) 1Q07 (2) (2) (2) (1) (2) Leveraging the Payments Business Noninterest Income 46% Business segment revenue contributions are reconciled to total GAAP consolidated revenue in the Appendix. * Loan Net Interest Income 16% Deposit Net Interest Income 38% Noninterest Income increased 12% 1Q07 vs 1Q06 |
We are One of
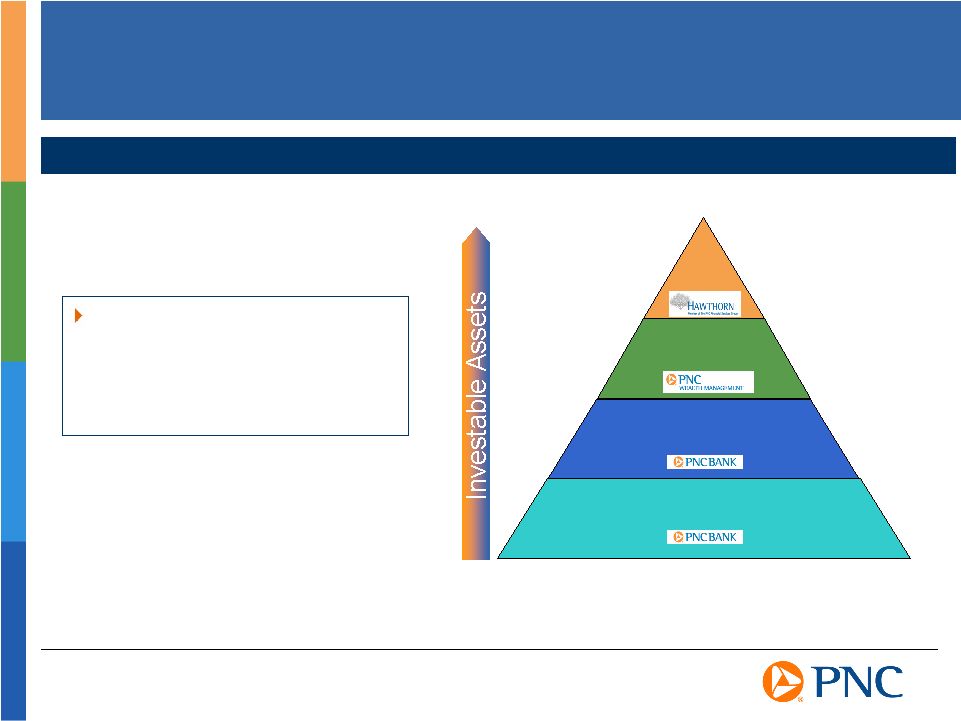
the Largest U.S. Wealth Management Firms Mass Affluent Wealthy Low High Ultra- Affluent Serving the Full Spectrum of Wealth Clients Mass Market PNC is one of the top ten largest U.S. bank wealth management firms with approximately $76 billion of assets under management Based on data from Barrons |
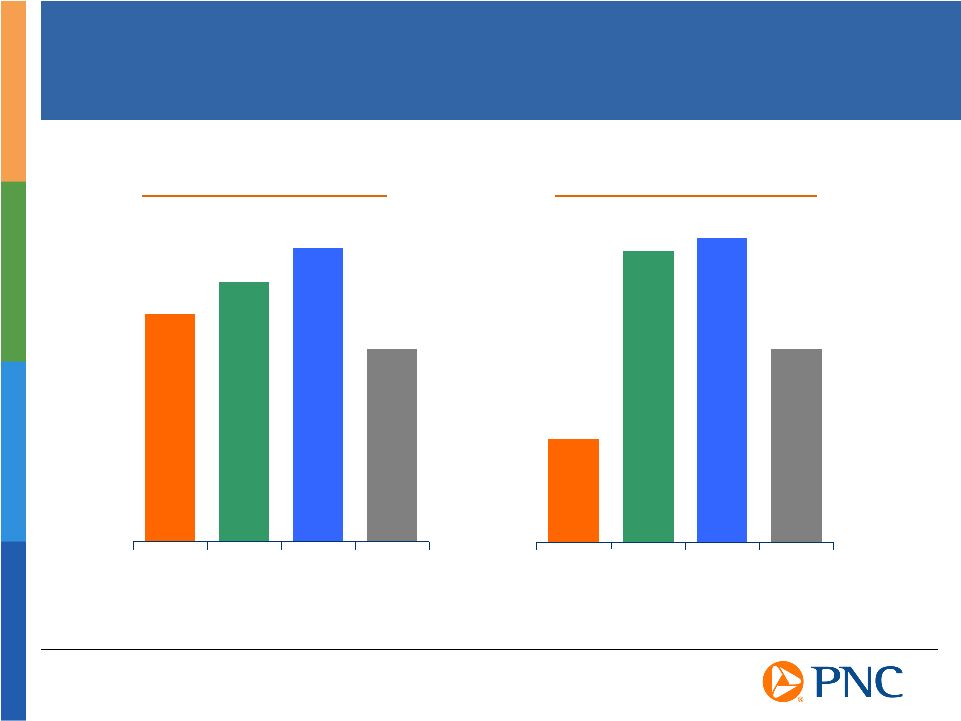
Expanding Franchise into Fast Growing, Wealthy Markets PNC reflects 103 county footprint including the Mercantile 38 county footprint and the Washington,
DC MSA. Source: SNL DataSource Median Household Median Household Income Income $60,694 $69,363 $51,546 PNC MRBK U.S. Washington, DC $78,402 Projected 5-Year Projected 5-Year Growth Population Growth Population 3.6% 10.0% 6.7% 10.5% PNC MRBK U.S. Washington, DC |
C&I
Banking Relationship Strategy Driving Fee Income Growth PNC has highest percentage of lead bank relationships in our footprint 63%* A Leader in Cross-sell Penetration of Middle Market Customers in Footprint PNC Footprint Penetration* Treasury management 74% 1 st Business checking accounts 69% 1 st Capital markets 26% 1 st Equipment leasing 17% 1 st 2006 Rank Based on third party survey of companies with annualized revenues of $30-$500 million. * C&I Banking Revenue Contribution* Business segment revenue contributions are reconciled to total GAAP consolidated revenue in the Appendix. * Noninterest Income 24% Loan Net Interest Income 51% Noninterest Income increased 13% 1Q07 vs 1Q06 Deposit Net Interest Income 25% For the three months ended March 31, 2007 |
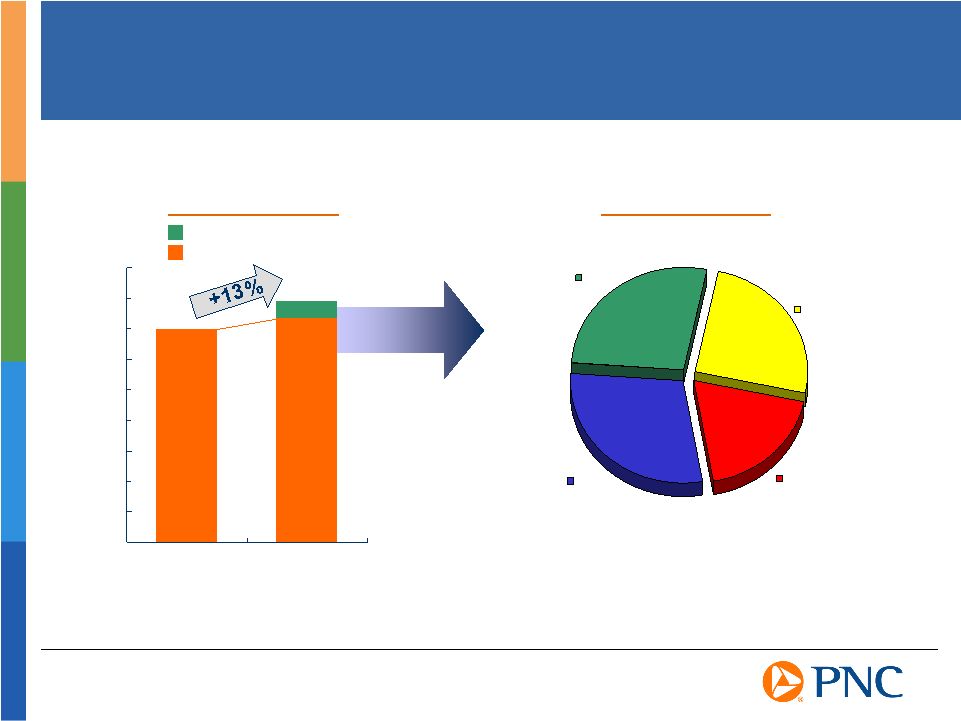
Emerging
Product Growth Focus Driving Fee Revenue Growth PFPC Benefiting from Investments in High Growth Products 22% 29% 78% 71% Core Product Fee Revenue Emerging Product Fee Revenue 1Q04 1Q07 Managed Accounts Alternative Investments Offshore Subaccounting 32% 13% 8% 5% Combined 3-Year CAGR 13% * CAGR reflects compound annual growth for 1Q07 vs 1Q04 Emerging Product Revenue Emerging Product Revenue 3-Year CAGR* 3-Year CAGR* |

Expanding
fee based businesses Gathering low-cost deposits Using credit selectively Creating positive operating leverage Maintaining moderate risk profile Strategies to Create Quality Growth |

Interest-bearing deposits 15% 15% Noninterest-bearing deposits 13% 4% Total deposits 14% 12% CMA 23 % WFC 22 PNC 19 KEY 17 RF 16 FITB 15 USB 15 NCC 14 STI 14 BBT 12 WB 10 Executing on Our Strategy to Gather Low Cost Deposits PNC Has Been Focused on Growing Noninterest-Bearing Deposits
Providing a Funding Advantage Average Noninterest-Bearing Deposits to Average Earning Assets Source: SNL DataSource, PNC as reported 1Q07 Average Balances PNC Peers 1Q07 vs. 1Q06 Source: SNL DataSource, PNC as reported Peers reflects average of eleven super-regional banks identified in Appendix, excluding PNC |
29% 27% 25% 19% Multiple Sources Driving Noninterest-Bearing Deposit Growth Consumer Corporate Banking, Treasury Management and Other Midland $0 $2 $4 $6 $8 $10 $12 $14 $16 $18 1Q06 1Q07 PNC Excluding Mercantile Mercantile impact Average Noninterest-Bearing Deposits Contribution to Average Noninterest-Bearing Deposits As of 3/31/07 $ billions +6% Small Business |
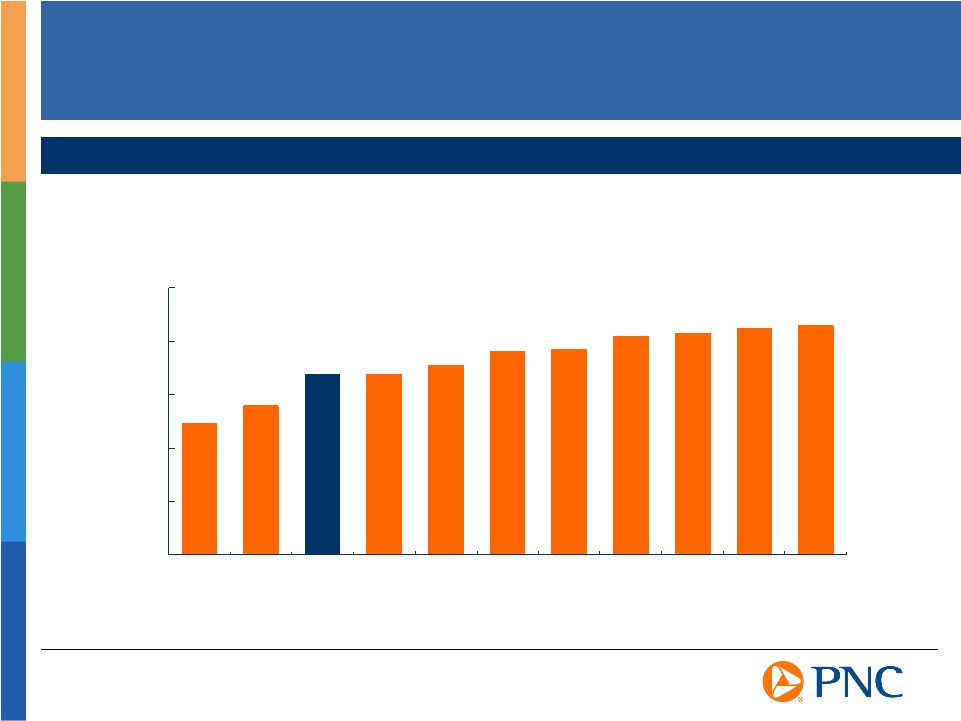
1.00% 1.50% 2.00% 2.50% 3.00% 3.50% USB WFC PNC CMA RF KEY FITB WB STI NCC BBT PNCs Deposit Strategy Results in a Lower Cost Deposit Base Interest Cost of Total Average Deposits Source: SNL DataSource, PNC as reported March 31, 2007 |

Expanding
fee based businesses Gathering low-cost deposits Using credit selectively Creating positive operating leverage Maintaining moderate risk profile Strategies to Create Quality Growth |
$13.8 $13.9 $4.6 $5.2 1Q06 1Q07 Selected Average Loans Outstanding Excluding Mercantile Selectively Growing More Valuable Risk-Adjusted Loans $ billions Total loans increased 1%* Home Equity Loans Small Business Loans $8.4 $8.9 $4.3 $4.5 1Q06 1Q07 Asset Based Lending Loans Corporate Loans Retail Banking Retail Banking C&I Banking C&I Banking *Not including Mercantile |
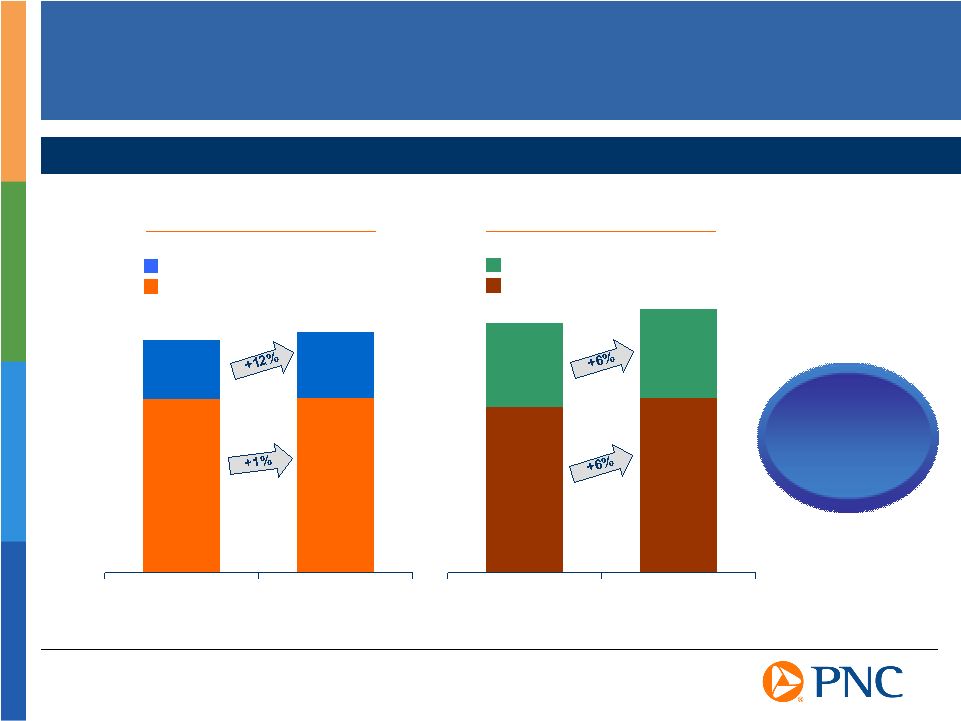
PNC 11% 13% (9)% 8% 13% 20% 1% 13% Growing Higher Quality Revenue Streams Noninterest Income $831 Million 60% 1Q06 Revenue Contribution As Adjusted * Deposit NII $326 Million 23% Loan NII $234 Million 17% Noninterest Income $941 Million 60% Deposit NII $392 Million 25% Loan NII $237 Million 15% Growth 1Q07 vs 1Q06 As Adjusted ** PNC, Excluding Mercantile Total Revenue Growth * Adjusted amounts are reconciled to GAAP in the Appendix **Unadjusted growth 1Q07 vs 1Q06: total revenue (7%), noninterest income (16%), deposit net interest income 20%, loan net interest income 0% 1Q07 Revenue Contribution As Adjusted * |

Expanding
fee based businesses Gathering low-cost deposits Using credit selectively Creating positive operating leverage Maintaining moderate risk profile Strategies to Create Quality Growth |
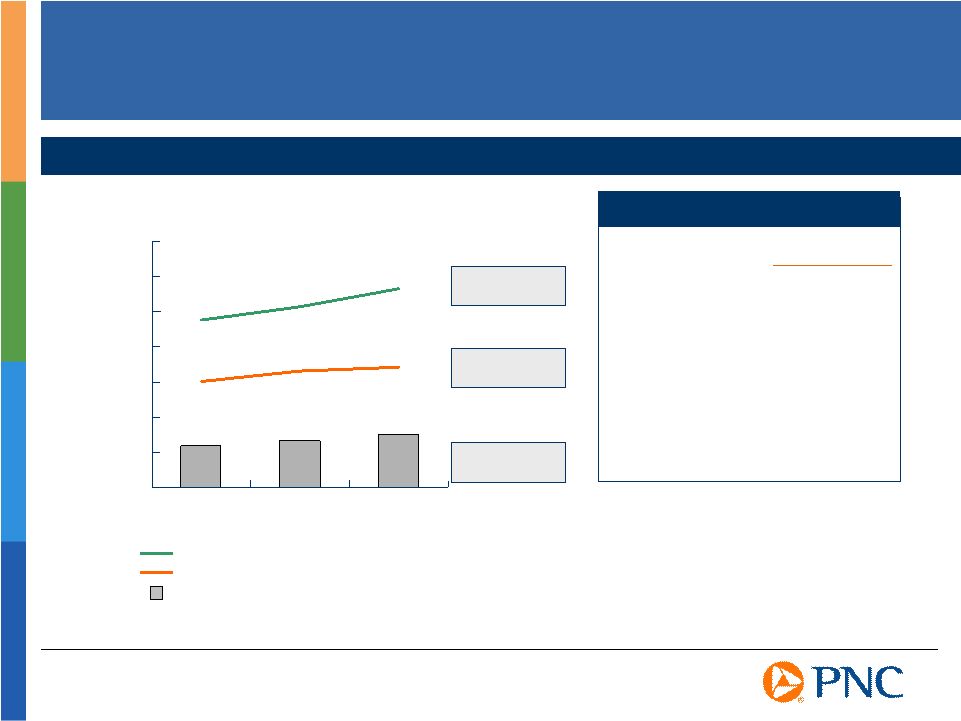
$0.0 $1.0 $2.0 $3.0 $4.0 $5.0 $6.0 $7.0 2004 2005 2006 Revenue 9% Creating Positive Operating Leverage Growing Revenues Faster Than Expenses $ billions Compound Annual Growth Rate (2004 2006) Adjusted Revenue (Taxable-equivalent) - $5.6 billion, $6.4 billion, $8.6 billion as reported for 2004, 2005, 2006,
respectively Adjusted Noninterest Expense - $3.7 billion, $4.3 billion, $4.4 billion as reported for 2004, 2005, 2006,
respectively Adjusted Net Income - $1.2 billion, $1.3 billion, $2.6 billion as reported for 2004, 2005, 2006,
respectively Net Income 12% $1.2 $1.3 $1.5 Expense 7% Revenue
+13% Expense
+8% Net Income +22% Trend Continues 1Q07 vs 1Q06* PNC As Adjusted * As reported: revenue (7%), expense (19%), net income 30%. Adjusted numbers and
taxable-equivalent revenue are reconciled to GAAP in the Appendix.
|

Expanding
fee based businesses Gathering low-cost deposits Using credit selectively Creating positive operating leverage Maintaining moderate risk profile Strategies to Create Quality Growth |

Nonperforming loans to loans 0.28% 0.44% Nonperforming assets to total assets 0.17% 0.39% Net Charge-offs to average loans for the 1Q07 period 0.27% 0.36% Allowance for loan and lease losses to loans 1.10% 1.11% Allowance for loan and lease losses to nonperforming loans 388% 266% Dont target sub-prime borrowers Dont originate Alt-A and option ARM residential mortgages Over 92% of consumer credit issued within footprint Limited portfolio of highly leveraged transactions Modest exposure to non-owner occupied commercial real estate Disciplined Approach Leads to Strong Credit Risk Profile Strong Asset Quality Not a significant player in higher-risk asset classes Source: SNL DataSource; PNC as reported on consolidated basis. Peer group represents average of super-regional banks identified in the Appendix. Peer group excludes PNC. March 31, 2007 PNC Consolidated Peer Group |

Well
Positioned Based on Lehman Research Loans to deposits Fee income to revenue Demand deposits as % of total deposits One-year Gap rank Linked quarter change in deposits to average earning assets MBS & mortgage loans as % of average earning assets EPS impact of gradual +100bps parallel shift Source: Large-/Mid-Cap Banks 2006 10-K Review, Lehman Brothers, Global Equity
Research, March 13, 2007 [Data as of 4Q06] Peer group reflects PNCs eleven
super-regional bank peer group as identified in Appendix Peer Group Total
Ranking Lehman Brothers Criteria 1 PNC 2 CMA 3 RF 4 KEY 5 USB 6 NCC 7 FITB 8 STI 9 WFC 10 WB 11 BBT |
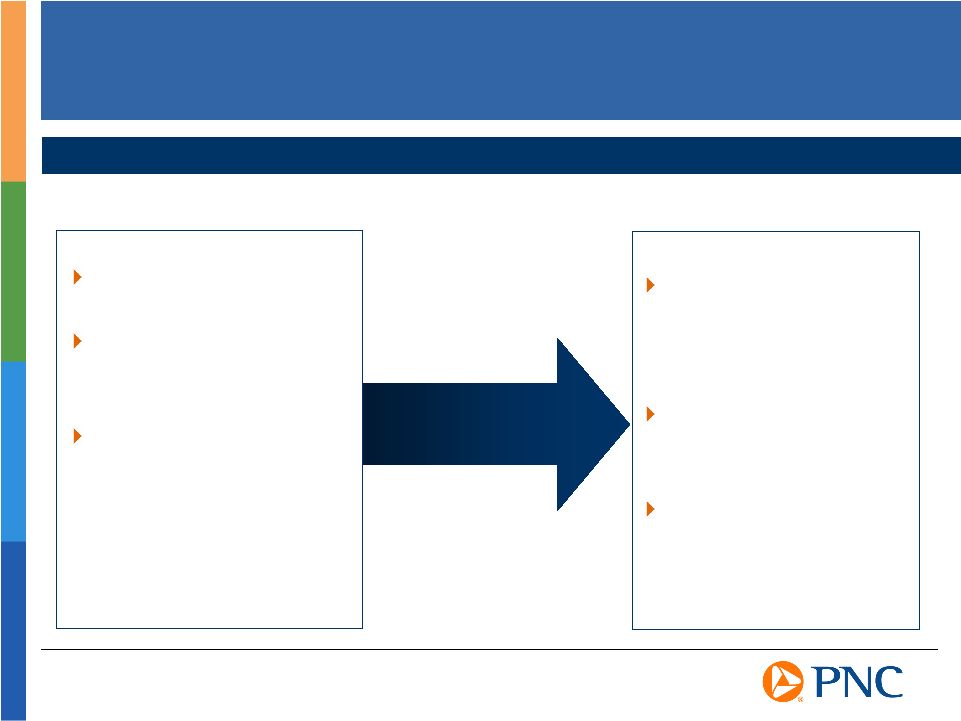
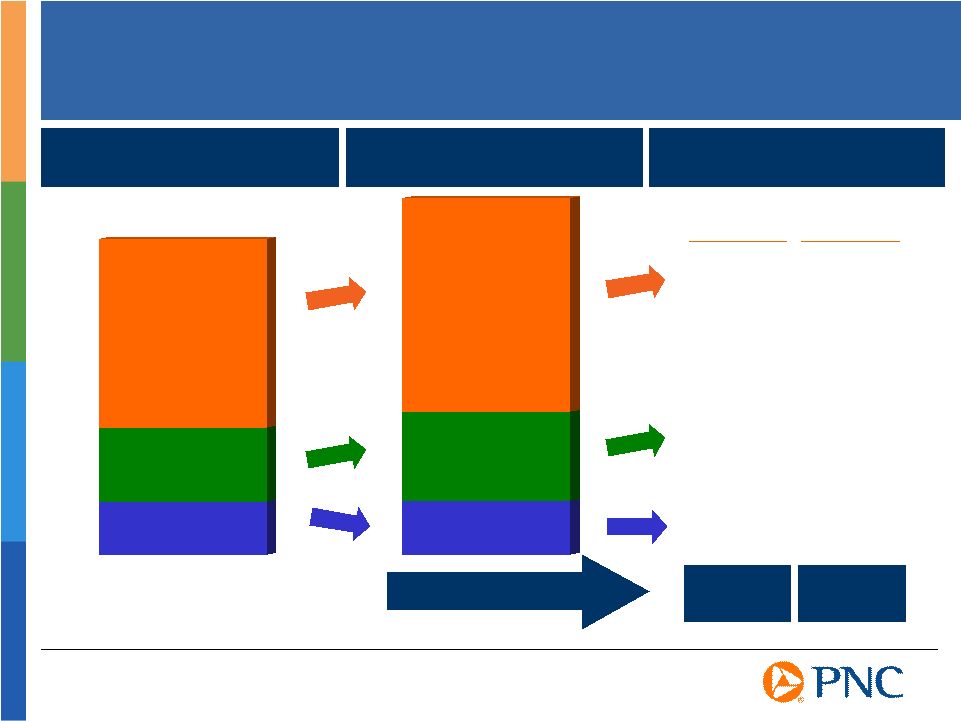
Investing in
and growing our business Making disciplined acquisitions Returning capital to shareholders Creating Capital Flexibility A Disciplined and Comprehensive Approach to Capital Management Growing earnings Exiting under- performing assets Maintaining a moderate risk profile Capital Flexibility Sources Uses |

Summary
A diversified financial services company Delivering consistent, solid growth Building a demonstrated ability to execute Well Positioned to Create Value |

We make statements in this presentation, and we may from time to time make other statements, regarding our outlook or expectations for earnings, revenues, expenses and/or other matters regarding or affecting PNC that are forward-looking statements within the meaning of the Private Securities Litigation Reform Act. Forward-looking statements are typically identified by words such as believe, expect, anticipate, intend, outlook, estimate, forecast, project and other similar words and expressions. Forward-looking statements are subject to numerous assumptions, risks and uncertainties,which change over time. Forward-looking statements speak only as of the date they are made. We do not assume any duty and do not undertake to update our forward-looking statements. Because forward-looking statements are subject to assumptions and uncertainties, actual results or future events could differ, possibly materially, from those that we anticipated in our forward-looking statements, and future results could differ materially from our historical performance. Our forward-looking statements are subject to the following principal risks and uncertainties. We provide greater detail regarding some of these factors in our Form 10-K for the year ended December 31, 2006, including in the Risk Factors and Risk Management sections of that report, and in our first quarter 2007 Form 10-Q and other SEC reports. Our forward-looking statements may also be subject to other risks and uncertainties, including those that we may discuss elsewhere in this presentation or in our filings with the SEC, accessible on the SECs website at www.sec.gov and on or through our corporate website at www.pnc.com under About PNC Investor Relations Financial Information. Our business and operating results are affected by business and economic conditions generally or specifically in the principal markets in which we do business. We are affected by changes in our customers and counterparties financial performance, as well as changes in customer preferences and behavior, including as a result of changing business and economic conditions. The value of our assets and liabilities, as well as our overall financial performance, are also affected by changes in interest rates or in valuations in the debt and equity markets. Actions by the Federal Reserve and other government agencies, including those that impact money supply and market interest rates, can affect our activities and financial results. Our operating results are affected by our liability to provide shares of BlackRock common stock to help fund BlackRock long-term incentive plan (LTIP) programs, as our LTIP liability is adjusted quarterly (marked-to-market) based on changes in BlackRocks common stock price and the number of remaining committed shares, and we recognize gain or loss on such shares at such times as shares are transferred for payouts under the LTIP programs. Competition can have an impact on customer acquisition, growth and retention, as well as on our credit spreads and product pricing, which can affect market share, deposits and revenues. Our ability to implement our business initiatives and strategies, including the final phases of our One PNC initiative, could affect our financial performance over the next several years. Our ability to grow successfully through acquisitions is impacted by a number of risks and uncertainties related both to the acquisition transactions themselves and to the integration of the acquired businesses into PNC after closing. These uncertainties continue to be present with respect to the integration of Mercantile Bankshares Corporation. Cautionary Statement Regarding Forward-Looking Information |

Legal and regulatory developments could have an impact on our ability to operate our businesses or our financial condition or results of operations or our competitive position or reputation. Reputational impacts, in turn, could affect matters such as business generation and retention, our ability to attract and retain management, liquidity and funding. These legal and regulatory developments could include: (a) the unfavorable resolution of legal proceedings or regulatory and other governmental inquiries; (b) increased litigation risk from recent regulatory and other governmental developments; (c) the results of the regulatory examination process, our failure to satisfy the requirements of agreements with governmental agencies, and regulators future use of supervisory and enforcement tools; (d) legislative and regulatory reforms, including changes to laws and regulations involving tax, pension, and the protection of confidential customer information; and (e) changes in accounting policies and principles. Our business and operating results are affected by our ability to identify and effectively manage risks inherent in our businesses, including, where appropriate, through the effective use of third-party insurance and capital management techniques. Our ability to anticipate and respond to technological changes can have an impact on our ability to respond to customer needs and to meet competitive demands. The adequacy of our intellectual property protection, and the extent of any costs associated with obtaining rights in intellectual property claimed by others, can impact our business and operating results. Our business and operating results can also be affected bywidespread natural disasters, terrorist activities or international hostilities, either as a result of the impact on the economy and financial and capital markets generally or on us or on our customers, suppliers or other counterparties specifically. Also, risks and uncertainties that could affect the results anticipated in forward-looking statements or from historical performance relating to our equity interest in BlackRock, Inc. are discussed in more detail in BlackRocks 2006 Form 10-K, including in the Risk Factors section, and in BlackRocks other filings with the SEC, accessible on the SECs website and on or through BlackRocks website at www.blackrock.com. We grow our business from time to time by acquiring other financial services companies. Acquisitions in general present uswith risks other than those presented by the nature of the business acquired. In particular, acquisitions may be substantially more expensive to complete (including as a result of costs incurred in connection with the integration of the acquired company) and the anticipated benefits (including anticipated cost savings and strategic gains) may be significantly harder or take longer to achieve than expected. In some cases, acquisitions involve our entry into new businesses or new geographic or other markets, and these situations also present risks resulting from our inexperience in these new areas. As a regulated financial institution, our pursuit of attractive acquisition opportunities could be negatively impacted due to regulatory delays or other regulatory issues. Regulatory and/or legal issues related to the pre-acquisition operations of an acquired business may cause reputational harm to PNC following the acquisition and integration of the acquired business into ours and may result in additional future costs and expenses arising as a result of those issues. Post-closing acquisition risk continues to apply to Mercantile as we complete the integration. Any annualized, proforma, estimated, third party or consensus numbers in this presentation are used for illustrative or comparative purposes only and may not reflect actual results. Any consensus earnings estimates are calculated based on the earnings projections made by analysts who cover that company. The analysts opinions, estimates or forecasts (and therefore the consensus earnings estimates) are theirs alone, are not those of PNC or its management, and may not reflect PNCs, Mercantiles or other companys actual or anticipated results. Cautionary Statement Regarding Forward-Looking Information (continued)
|

Non-GAAP
to GAAP Reconcilement Appendix Income Statement Summary First Quarter 2007 PNC As Reported Taxable Taxable As Adjusted, TE Three months ended March 31, 2007 GAAP Equivalent Equivalent Adjusted, Basis, Excluding ($ millions) Basis Adjustment Basis Adjustments TE Basis Mercantile Mercantile Net interest income $623 $6 $629 $0 $629 ($46) $583 Noninterest income 991 0 991 (50) 941 (19) 922 Total revenue 1,614 6 1,620 (50) 1,570 (65) 1,505 Noninterest income to total revenue 61% 60% Net interest income to total revenue 39% 40% Noninterest expense 944 0 944 (11) 933 (40) 893 Pretax income before provision 670 6 676 (39) 637 (25) 612 Provision 8 0 8 0 8 0 8 Income before minority interest and income taxes 662 6 668 (39) 629 (25) 604 Minority interest in income of BlackRock 0 0 0 0 0 0 0 Income Taxes 203 6 209 (14) 195 (9) 186 Net income $459 $0 $459 ($25) $434 ($16) $418 Adjustments: Noninterest income Noninterest expense Pretax Net effect related to BlackRock LTIP shares obligation ($52) $0 ($52) Acquisition integration costs 2 (11) 13 Pretax ($50) ($11) (39) Income taxes (14) Net income ($25) |

Non-GAAP
to GAAP Reconcilement Appendix Income Statement Summary First Quarter 2006 PNC As Reported Taxable Taxable PNC As Adjusted, TE Three months ended March 31, 2006 GAAP Equivalent Equivalent Adjusted, Basis, Excluding ($ millions) Basis Adjustment Basis Adjustments TE Basis Mercantile Mercantile Net interest income $556 $7 $563 ($3) $560 $0 $560 Noninterest income 1,185 0 1,185 (354) 831 0 831 Total revenue 1,741 7 1,748 (357) 1,391 0 1,391 Noninterest income to total revenue 68% 60% Net interest income to total revenue 32% 40% Noninterest expense 1,162 0 1,162 (297) 865 0 865 Pretax income before provision 579 7 586 (60) 526 0 526 Provision 22 0 22 0 22 0 22 Income before minority interest and income taxes 557 7 564 (60) 504 0 504 Minority interest in income of BlackRock 22 0 22 (22) 0 0 0 Income taxes 181 7 188 (41) 147 0 147 Net income $354 $0 $354 $3 $357 $0 $357 Adjustments: Net interest income Noninterest income Noninterest expense Minority Interest Pretax BlackRock Equity Method ($3) ($354) ($291) $0 ($66) Acquisition integration costs 0 0 (6) 0 6 Minority Interest adjustment 0 0 0 (22) 22 Pretax ($3) ($354) ($297) ($22) (38) Income taxes (41) Net income $3 |

Non-GAAP
to GAAP Reconcilement Appendix Income Statement Summary First Quarter 06 vs First Quarter 07 ($ millions) 1Q06 As Adjusted, TE Basis 1Q07 As Adjusted, TE Basis Growth Q106 vs Q107 1Q07 As Adjusted, TE Basis Excluding Mercantile Growth Q106 vs Q107 1Q06 Unadjusted 1Q07 Unadjusted Growth Q106 vs Q107 Noninterest Income $831 $941 13% $922 11% 1,185 991 (16%) Net Interest Income: Loans 234 237 1% 213 (9%) 230 231 0% Deposits 326 392 20% 370 13% 326 392 20% Net Interest Income 560 629 583 556 623 12% Total Revenue $1,391 $1,570 13% $1,505 8% $1,741 $1,614 (7%) Noninterest income as a % of total revenue 60% 60% 68% 61% Loans as a % of total revenue 17% 15% 13% 14% Deposits as a % of total revenue 23% 25% 19% 25% Noninterest Expense 865 933 8% 893 3% 1,162 944 (19%) Net income $357 $434 22% $418 17% Provision for credit losses 22 8 8 Effective tax rate 32.5% 30.7% 30.7% After tax impact of provision for credit losses 15 6 6 Net income 357 434 22% 418 17% Earnings before provision $372 $440 18% $424 14% 1Q07 vs 1Q06 Operating Leverage 1Q06 1Q07 Growth Q106 vs Q107 Change in Revenue Change in Expense Operating Leverage Provision for credit losses $22 $8 Effective tax rate 32.5% 30.7% As Reported (7%) (19%) 12% After tax impact of provision for credit losses 15 6 As Adjusted, Reported Net income 354 459 TE Basis 13% 8% 5% Earnings before provision $369 $465 26% |

Non-GAAP
to GAAP Reconcilement Appendix Income Statement Summary 2004 to 2006 BlackRock For the year ended December 31, 2006 PNC Deconsolidation and BlackRock PNC In millions As Reported Adjustments (a) Other Adjustments Equity Method As Adjusted Net interest income $2,245 $(10) $2,235 Provision for credit losses 124 124 Noninterest income 6,327 $(1,812) (1,087) $144 3,572 Noninterest expense 4,443 (91) (765) 3,587 Income before minority interest and income taxes 4,005 (1,721) (332) 144 2,096 Minority interest in income of BlackRock 47 18 (65) Income taxes 1,363 (658) (130) 7 582 Net income $2,595 $(1,081) $(137) $137 $1,514 For the year ended December 31, 2005 BlackRock PNC Deconsolidation and BlackRock PNC In millions As Reported Other Adjustments Equity Method As Adjusted Net interest income $2,154 $(12) $2,142 Provision for credit losses 21 21 Noninterest income 4,173 (1,214) $163 3,122 Noninterest expense 4,306 (853) 3,453 Income before minority interest and income taxes 2,000 (373) 163 1,790 Minority interest in income of BlackRock 71 (71) Income taxes 604 (150) 11 465 Net income $1,325 $(152) $152 $1,325 (a) Includes the impact of the following items, all on a pretax basis: $2,078 million gain on BlackRock/MLIM transaction, $196 million securities portfolio rebalancing loss, $101 million of integration costs, $48 million mortgage loan portfolio repositioning loss,
and $12 million loss related to BlackRock LTIP shares obligation. |

Non-GAAP
to GAAP Reconcilement Appendix Income Statement Summary 2004 to 2006 (continued) For the year ended December 31, 2004 PFPC Distribution/ BlackRock PNC Out-Of-Pocket Deconsolidation and BlackRock PNC In millions As Reported Revenue and Expense Other Adjustments Equity Method As Adjusted Net interest income $1,969 $(14) $1,955 Provision for credit losses 52 52 Noninterest income 3,572 $(137) (745) $101 2,791 Noninterest expense 3,712 (137) (564) 3,011 Income before minority interest and income taxes 1,777 (195) 101 1,683 Minority interest in income of BlackRock 42 (42) Income taxes 538 (59) 7 486 Net income $1,197 $(94) $94 $1,197 In millions 2004 2005 2006 CAGR Adjusted net interest income $1,955 $2,142 $2,235 Adjusted noninterest income 2,791 2,975 3,402 10% Taxable-equivalent adjustment 20 33 25 Adjusted total revenue 4,766 5,150 5,662 9% Adjusted noninterest expense 3,011 3,306 3,417 7% Adjusted net income $1,197 $1,325 $1,514 12% In millions 2004 2005 2006 CAGR Net interest income, as reported $1,969 $2,154 $2,245 Noninterest income, as reported 3,572 4,173 6,327 33% Taxable-equivalent adjustment 20 33 25 Total revenue, taxable equivalent basis 5,561 6,360 8,597 24% Noninterest expense, as reported 3,712 4,306 4,443 9% Net income, as reported $1,197 $1,325 $2,595 47% |

Non-GAAP
to GAAP Reconcilement Appendix Business Segment Earnings Reconciliation Quarter Ending Earnings (Loss) $ millions 2007 2006 % of Segments Retail Banking $201 $190 48% Corporate and Institutional Banking 132 102 32% BlackRock (a) (b) 52 49 13% PFPC (c) 31 27 7% Total business segment earnings 416 368 Other (a) 43 (14) Total consolidated net income $459 $354 (a) (b) (c) Certain prior period amounts have been reclassified to conform with the current period
presentation. For our segment reporting presentation, our share of pretax BlackRock/MLIM transaction integration costs totaling $2 million and $6 million for the three months ended March 31, 2007 and March 31, 2006 have been reclassified from BlackRock to "Other." "Other" for the first three months of 2007 also includes $11 million of pretax Mercantile acquisition integration costs. For the first quarter of 2007, revenue represents our equity income from BlackRock. For the first quarter of 2006, revenue represents the sum of total operating revenue and nonoperating income. PFPC revenue represents the sum of total operating revenue and nonoperating income (expense) less debt financing costs. |

Non-GAAP
to GAAP Reconcilement Appendix Business Segment Revenue Reconciliation Quarter Ending March 31, 2007 Earnings (Loss) $ millions Retail Banking Corporate & Institutional Banking BlackRock (a) (b) PFPC (c) Other Intercompany Eliminations Consolidated Net interest income $451 $180 $0 ($5) ($3) $0 $623 Noninterest income 387 187 66 205 156 (10) 991 Total Revenue $838 $367 $66 $200 $153 ($10) $1,614 Net interest income as a percent of total revenue 54% 49% 39% Noninterest income as a percent of total revenue 46% 51% 61% Net Interest Income: Loans $136 $89 Deposits 317 92 Other net interest income (2) (1) Total net interest income $451 $180 Quarter Ending March 31, 2006 Earnings (Loss) $ millions Retail Banking Corporate & Institutional Banking BlackRock (a) (b) PFPC (c) Other Intercompany Eliminations Consolidated Net interest income $407 $167 $13 ($9) ($22) $0 $556 Noninterest income 345 165 396 227 70 (18) 1,185 Total Revenue $752 $332 $409 $218 $48 ($18) $1,741 Net Interest Income: Loans $125 $93 Deposits 281 79 Other net interest income 1 1 Total net interest income $407 $172 (a) (b) (c) Certain prior period amounts have been reclassified to conform with the current period
presentation. For our segment reporting presentation, our share of pretax BlackRock/MLIM transaction integration costs totaling $2 million and $6 million for the three months ended March 31, 2007 and March 31, 2006 have been reclassified from BlackRock to "Other." "Other" for the first three months of 2007 also includes $11 million of pretax Mercantile acquisition integration costs. For the first quarter of 2007, revenue represents our equity income from BlackRock. For the first quarter of 2006, revenue represents the sum of total operating revenue and nonoperating income. PFPC revenue represents the sum of servicing revenue and nonoperating income (expense) less debt
financing costs. |

Non-GAAP
to GAAP Reconcilement Appendix Balance Sheet Summary Reconciliation Average Balance Sheet for the three months ended: March 31, 2007 March 31, 2006 $ millions PNC Excluding Mercantile Mercantile (a) PNC As Reported PNC % Change Excluding Mercantile % Change Including Mercantile Average loans, net of unearned income Commercial $20,558 $921 $21,479 $19,556 5% 10% Commercial real estate 3,468 2,010 5,478 3,021 15% 81% Consumer 16,297 568 16,865 16,184 1% 4% Residential mortgages 6,379 794 7,173 7,272 (12%) (1%) Other, including total unearned income (b) 3,056 5 3,061 3,113 (2%) (2%) Total average loans, net of unearned income $49,758 $4,298 $54,056 $49,146 1% 10% Average deposits Interest-bearing $50,607 $3,260 $53,867 $46,984 8% 15% Noninterest-bearing 14,740 1,067 15,807 13,966 6% 13% Total average deposits $65,347 $4,327 $69,674 $60,950 7% 14% (a) Mercantile activity is from the closing on March 2, 2007 through March 31, 2007. (b) Includes lease financing. |

The PNC
Financial Services Group, Inc. PNC BB&T Corporation BBT Comerica CMA Fifth Third Bancorp FITB KeyCorp KEY National City Corporation NCC Regions Financial RF SunTrust Banks, Inc. STI U.S. Bancorp USB Wachovia Corporation WB Wells Fargo & Company WFC Ticker Peer Group of Super-Regional Banks Appendix |