ELECTRONIC PRESENTATION SLIDES FOR EARNINGS RELEASE CONFERENCE CALL
Published on April 18, 2007

The PNC
Financial Services Group, Inc. First Quarter 2007 Earnings Conference Call April 18, 2007 Exhibit 99.2 |

2 This presentation contains forward-looking statements regarding our outlook or
expectations relating to PNCs future business, operations, financial condition, financial performance and asset quality. Forward-looking statements are necessarily subject to numerous assumptions, risks and uncertainties, which change over time. The forward-looking statements in this presentation are qualified by the factors
affecting forward-looking statements identified in the more detailed Cautionary Statement included in the Appendix, which is in the version of the presentation materials posted on our corporate website at www.pnc.com/investorevents. We provide greater detail regarding those factors in our 2006 Form 10-K, including in the Risk Factors and Risk Management sections, and in our other SEC reports
(accessible on the SECs website at www.sec.gov and on or through our
corporate website). Future events or circumstances may change our outlook or
expectations and may also affect the nature of the assumptions, risks and
uncertainties to which our forward-looking statements are subject. The forward-looking statements in this presentation speak only as of the date of this presentation. We do not assume any duty and do not
undertake to update those statements. In this presentation, we will sometimes refer to adjusted results to help illustrate (1) the impact of BlackRock deconsolidation near the end of third quarter 2006 and the application of the equity method of accounting for
our equity investment in BlackRock and (2) the impact of certain specified
items, including BlackRock/MLIM transaction gain, cost of securities and mortgage portfolio repositionings, BlackRock/MLIM and Mercantile Bankshares acquisition integration costs,
PFPC distribution/out-of-pocket revenue and expense, and
gains/losses related to our BlackRock LTIP shares obligation. We have provided these adjusted amounts and reconciliations so that investors, analysts, regulators and others will be better able
to evaluate the impact of these items on our results for the periods
presented, in addition to providing a basis of comparability for the impact of the BlackRock deconsolidation given the magnitude of the impact of deconsolidation on various components of our income
statement and balance sheet. We believe that information as adjusted
for the impact of the specified items may be useful due to the extent to which these items are not indicative of our ongoing operations as the result of our management activities on
those operations. While we have not provided other adjustments for the
periods discussed, this is not intended to imply that there could not have been other similar types of adjustments, but any such adjustments would not have been similar in magnitude
to those shown. This presentation may also include a discussion of
non-GAAP financial measures, which, to the extent not so qualified therein or in the Appendix, is qualified by GAAP reconciliation information available on our corporate website at www.pnc.com under About PNC - Investor Relations. Cautionary Statement Regarding Forward-Looking Information |

3 Reported earnings of $1.46 per diluted share Adjusted earnings of $1.38 per diluted share, a 15% increase over 1Q06 adjusted earnings Banking businesses driving the improvement Mercantile integration on track Enhanced client initiatives producing positive early results Excellent asset quality 2007 First Quarter Highlights *Adjusted earnings are reconciled to GAAP earnings on the following slide. * |

4 Diluted Earnings Per Share Earnings Per Share Summary 5% $1.32 15% $1.20 $1.38 Net income, as adjusted 0.03 0.01 0.03 Acquisition integration costs 0.02 0.06 Loss from the net mark-to-market adjustment on LTIP shares obligation (0.17) Gain related to transfer of BlackRock shares for LTIP Adjustments: 15% $1.27 23% $1.19 $1.46 Net income, as reported 1Q07 1Q06 4Q06 1Q07 vs 1Q06 % Change 1Q07 vs 4Q06 % Change |
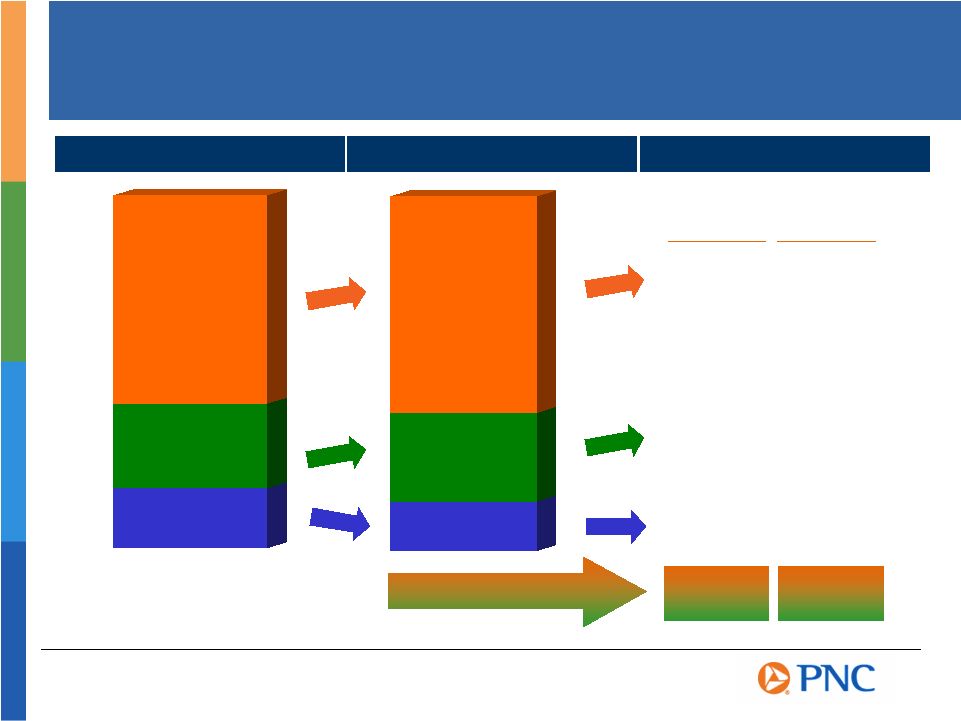
5 14% 13% (9)% 10% 17% 20% 1% 15% Growing Higher Quality Revenue Streams 1Q07 Revenue Mix As Adjusted * Noninterest Income 59% 1Q06 Revenue Mix As Adjusted * Deposit NII 24% Loan NII 17% Noninterest Income 60% Deposit NII 25% Loan NII 15% Growth 1Q07 vs 1Q06 As Adjusted ** PNC, Excluding Mercantile PNC Total Revenue Growth *Adjusted amounts are reconciled to GAAP in the Appendix **Unadjusted growth 1Q07 vs 1Q06: total revenue (2%), noninterest income (9%), deposit net interest income 20%, loan net interest income 0% |
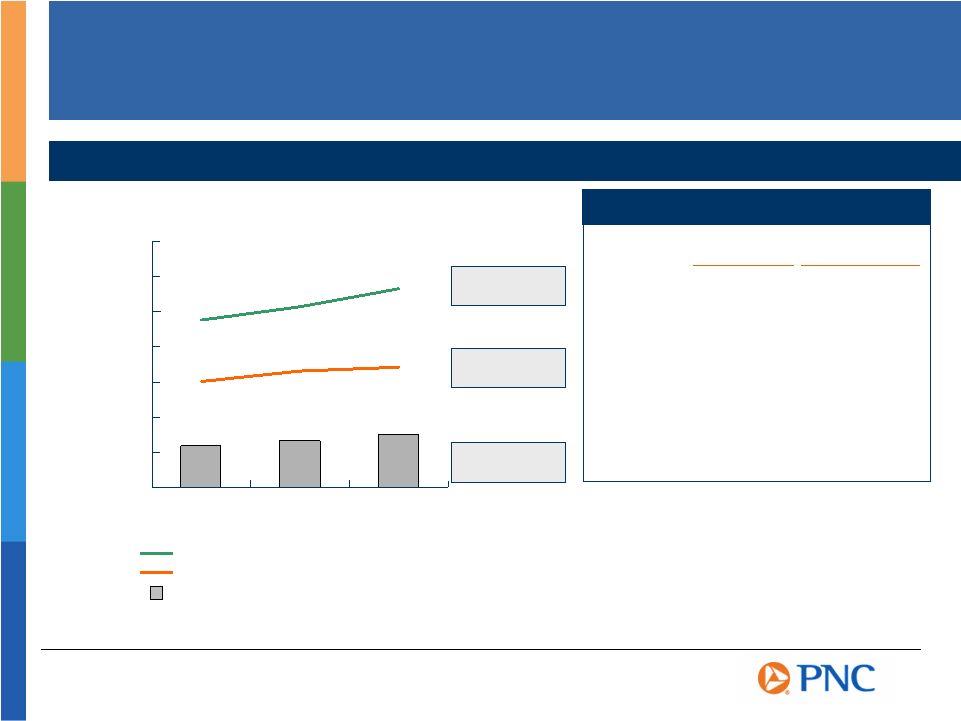
6 $0.0 $1.0 $2.0 $3.0 $4.0 $5.0 $6.0 $7.0 2004 2005 2006 Revenue 9% Creating Positive Operating Leverage Growing Revenues Faster Than Expenses $ billions Compound Annual Growth Rate (2004 2006) Adjusted Revenue (Taxable-equivalent) - $5.6 billion, $6.4 billion, $8.6 billion as reported for 2004, 2005, 2006, respectively Adjusted Noninterest Expense - $3.7 billion, $4.3 billion, $4.4 billion as reported for 2004, 2005, 2006, respectively Adjusted Net Income - $1.2 billion, $1.3 billion, $2.6 billion as reported for 2004, 2005, 2006, respectively Net Income 12% $1.2 $1.3 $1.5 Expense 7% Revenue
+10% +15% Expense +6% +11% Earnings before Provision +14% +18% Net Income +17% +22% PNC As Adjusted, Excluding Mercantile Continuing the Trend - 1Q07 vs 1Q06* PNC As Adjusted *As reported: revenue (2%), expense (11%), earnings before provision 15%, net income 30%.
Adjusted numbers and taxable-equivalent revenue are reconciled to GAAP in the
Appendix. |

7 Maintaining Moderate Risk Profile Credit Risk Profile - Credit decisions driven by risk-adjusted returns - Strong credit quality - Minimal sub-prime exposure Interest Rate Risk - Total return philosophy - Sophisticated risk management skills - Well-positioned balance sheet |

8 We make statements in this presentation, and we may from time to time make other statements, regarding our outlook or expectations for earnings, revenues, expenses and/or other matters regarding or affecting PNC that are forward-looking statements within
the meaning of the Private Securities Litigation Reform Act. Forward-looking statements are typically identified by words such as believe, expect, anticipate, intend, outlook, estimate, forecast, project and other similar words and expressions. Forward-looking statements are subject to numerous assumptions, risks and
uncertainties, which change over time. Forward-looking statements speak only as of the date they are made. We do not assume any duty and do not undertake to update our
forward-looking statements. Because forward-looking statements are subject to assumptions and uncertainties, actual results or future events could differ, possibly materially, from
those that we anticipated in our forward-looking statements, and future results could differ materially from our historical performance. Our forward-looking statements are subject to the following principal risks and
uncertainties. We provide greater detail regarding some of these factors in our Form 10-K for the year ended December 31, 2006, including in the Risk Factors and Risk Management sections
of that report, and in our other SEC reports. Our forward-looking statements may also be subject to other risks and uncertainties, including those that we may discuss
elsewhere in this presentation or in our filings with the SEC, accessible on the SECs website at www.sec.gov and on or through our corporate website at www.pnc.com under About PNC Investor Relations Financial Information. Our business and operating results are affected by business and economic conditions
generally or specifically in the principal markets in which we do business. We are affected by changes in our customers and counterparties financial performance, as well as changes in customer preferences and behavior,
including as a result of changing business and economic conditions.
The value of our assets and liabilities, as well as our overall financial performance,
are also affected by changes in interest rates or in valuations in the debt and equity markets. Actions by the Federal Reserve and other government agencies, including
those that impact money supply and market interest rates, can affect our activities and financial results. Our operating results are affected by our liability to provide shares of BlackRock
common stock to help fund BlackRock long-term incentive plan (LTIP) programs, as our LTIP liability is adjusted quarterly (marked-to-market) based on changes in BlackRocks common stock price and the number of remaining committed shares, and we recognize gain or loss on such shares at such times as shares are transferred for
payouts under the LTIP programs. Competition can have an impact on customer acquisition, growth and retention, as well
as on our credit spreads and product pricing, which can affect market share, deposits and revenues. Our ability to implement our business initiatives and strategies, including the final
phases of our One PNC initiative, could affect our financial performance over the next several years. Our ability to grow successfully through acquisitions is impacted by a number of risks
and uncertainties related both to the acquisition transactions themselves and to the integration of the acquired businesses into PNC after closing. These
uncertainties continue to be present with respect to the integration of Mercantile Bankshares Corporation. Cautionary Statement Regarding Forward-Looking Information |

9 Legal and regulatory developments could have an impact on our ability to operate our
businesses or our financial condition or results of operations or our competitive position or reputation. Reputational impacts, in turn, could affect matters such as business generation and retention, our
ability to attract and retain management, liquidity and funding. These
legal and regulatory developments could include: (a) the unfavorable resolution of legal proceedings or regulatory and other governmental inquiries; (b) increased litigation risk from recent regulatory and other governmental developments; (c) the results of the regulatory examination process, our failure to satisfy the requirements of agreements with governmental agencies, and
regulators future use of supervisory and enforcement tools; (d)
legislative and regulatory reforms, including changes to laws and
regulations involving tax, pension, and the protection of confidential customer information; and (e) changes in accounting policies and principles. Our business and operating results are affected by our ability to identify and
effectively manage risks inherent in our businesses, including, where appropriate, through the effective use of third-party insurance and capital management techniques.
Our ability to anticipate and respond to technological changes can have an impact on
our ability to respond to customer needs and to meet competitive demands. The adequacy of our intellectual property protection, and the extent of any costs
associated with obtaining rights in intellectual property claimed by others, can impact our business and operating results. Our business and operating results can also be affected by widespread natural
disasters, terrorist activities or international hostilities, either as a result of the impact on the economy and financial and capital markets generally or on us or on our customers, suppliers or other counterparties specifically. Also, risks and uncertainties that could affect the results anticipated in
forward-looking statements or from historical performance relating to our equity interest in BlackRock, Inc. are discussed in more detail in BlackRocks 2006 Form 10-K,
including in the Risk Factors section, and in BlackRocks other filings with the SEC, accessible on the SECs website and on or through BlackRocks website at
www.blackrock.com. In addition, we grow our business from time to time by acquiring other financial services companies, such as our recent acquisition of Mercantile Bankshares. Acquisitions in general present us with risks other than those presented by the nature of the business
acquired. In particular, acquisitions may be substantially more expensive to complete (including as a result of costs incurred in connection with the integration of the
acquired company) and the anticipated benefits (including anticipated cost savings and strategic gains) may be significantly harder or take longer to achieve than expected. In
some cases, acquisitions involve our entry into new businesses or new geographic or other markets, and these situations also present risks resulting from our inexperience in
these new areas. As a regulated financial institution, our pursuit of attractive acquisition opportunities could be negatively impacted due to regulatory delays or other regulatory
issues. Regulatory and/or legal issues related to the pre-acquisition operations of an acquired business may cause reputational harm to PNC following the acquisition and
integration of the acquired business into ours and may result in additional future costs and expenses arising as a result of those issues. Any annualized, proforma, estimated, third party or consensus numbers in this
presentation are used for illustrative or comparative purposes only and may not reflect actual results. Any consensus earnings estimates are calculated based on the earnings projections made by analysts who cover that company. The analysts opinions, estimates or forecasts (and therefore the consensus earnings estimates) are theirs alone, are not those of PNC or its management, and may not reflect PNCs, Mercantiles or other companys actual or anticipated results. Cautionary Statement Regarding Forward-Looking Information (continued)
|

10
Non-GAAP to GAAP Reconcilement Appendix Income Statement Summary First Quarter 2007 PNC As Reported Taxable Taxable As Adjusted, TE GAAP Equivalent Equivalent Adjusted, Basis, Excluding ($ millions) Basis Adjustment Basis Adjustments TE Basis Mercantile Mercantile Net interest $623 $6 $629 $0 $629 ($46) $583 Noninterest 1,083 0 1,083 (156) 927 (19) 908 Total revenue 1,706 6 1,712 (156) 1,556 (65) 1,491 Noninterest income to total revenue 63% 60% Net interest income to total revenue 37% 40% Noninterest expense 1,036 0 1,036 (117) 919 (40) 879 Pretax income before provision 670 6 676 (39) 637 (25) 612 Provision 8 0 8 0 8 0 8 Income before minority interest and income taxes 662 6 668 (39) 629 (25) 604 Minority interest in income of BlackRock 0 0 0 0 0 0 0 Income Taxes 203 6 209 (14) 195 (9) 186 Net income $459 $0 $459 ($25) $434 ($16) $418 Adjustments: Noninterest income Noninterest expense Pretax PFPC distribution/out-of-pocket revenue and expense ($106) ($106) $0 Net effect related to BlackRock LTIP shares obligation (52) 0 (52) Acquisition integration costs 2 (11) 13 Pretax ($156) ($117) (39) Income taxes (14) Net income ($25) income income |

11
Non-GAAP to GAAP Reconcilement Appendix Income Statement Summary First Quarter 2006 PNC As Reported Taxable Taxable PNC As Adjusted, TE GAAP Equivalent Equivalent Adjusted, Basis, Excluding ($ millions) Basis Adjustment Basis Adjustments TE Basis Mercantile Mercantile Net interest income $556 $7 $563 ($3) $560 $0 $560 Noninterest income 1,185 0 1,185 (391) 794 0 794 Total revenue 1,741 7 1,748 (394) 1,354 0 1,354 Noninterest income to total revenue 68% 59% Net interest income to total revenue 32% 41% Noninterest expense 1,162 0 1,162 (334) 828 0 828 Pretax income before provision 579 7 586 (60) 526 0 526 Provision 22 0 22 0 22 0 22 Income before minority interest and income taxes 557 7 564 (60) 504 0 504 Minority interest in income of BlackRock 22 0 22 (22) 0 0 0 Income taxes 181 7 188 (41) 147 0 147 Net income $354 $0 $354 $3 $357 $0 $357 Adjustments: Net interest income Noninterest income Noninterest expense Minority Interest Pretax PFPC distribution/out-of-pocket revenue and expense $0 ($37) ($37) $0 $0 BlackRock Equity Method (3) (354) (291) 0 (66) Acquisition integration costs 0 0 (6) 0 6 Minority Interest adjustment 0 0 0 (22) 22 Pretax ($3) ($391) ($334) ($22) (38) Income taxes (41) Net income $3 |

12
Non-GAAP to GAAP Reconcilement Appendix ($ millions) 1Q06 As Adjusted, TE Basis 1Q07 As Adjusted, TE Basis Growth Q106 vs Q107 1Q07 As Adjusted, TE Basis Excluding Mercantile Growth Q106 vs Q107 1Q06 Unadjusted 1Q07 Unadjusted Growth Q106 vs Q107 Noninterest Income $794 $927 17% $908 14% 1,185 1,083 -9% Net Interest Income: Loans 234 237 1% 213 -9% 234 237 1% Deposits 326 392 20% 370 13% 326 392 20% Net Interest Income 560 629 583 560 629 12% Total Revenue $1,354 $1,556 15% $1,491 10% $1,745 $1,712 -2% Noninterest income as a % of total revenue 59% 60% 68% 63% Loans as a % of total revenue 17% 15% 13% 14% Deposits as a % of total revenue 24% 25% 19% 23% Noninterest Expense 828 919 11% 879 6% Net income $357 $434 22% $418 17% Provision for credit losses 22 8 8 Effective tax rate 32.5% 30.7% 30.7% After tax impact of provision for credit losses 15 6 6 Net income 357 434 22% 418 17% Earnings before provision $372 $440 18% $424 14% 1Q06 1Q07 Growth Q106 vs Q107 Provision for credit losses $22 $8 Effective tax rate 32.5% 30.7% After tax impact of provision for credit losses 15 6 Reported Net income 354 459 Earnings before provision $369 $465 26% Income Statement Summary First Quarter 06 vs First Quarter 07 |

13
Non-GAAP to GAAP Reconcilement Appendix Income Statement Summary 2004 to 2006 BlackRock For the year ended December 31, 2006 PNC Deconsolidation and BlackRock PNC In millions As Reported Adjustments (a) Other Adjustments Equity Method As Adjusted Net interest income $2,245 $(10) $2,235 Provision for credit losses 124 124 Noninterest income 6,327 $(1,982) (1,087) $144 3,402 Noninterest expense 4,443 (261) (765) 3,417 Income before minority interest and income taxes 4,005 (1,721) (332) 144 2,096 Minority interest in income of BlackRock 47 18 (65) Income taxes 1,363 (658) (130) 7 582 Net income $2,595 $(1,081) $(137) $137 $1,514 For the year ended December 31, 2005 PFPC Distribution/ BlackRock PNC Out-Of-Pocket Deconsolidation and BlackRock PNC In millions As Reported Revenue and Expense Other Adjustments Equity Method As Adjusted Net interest income $2,154 $(12) $2,142 Provision for credit losses 21 21 Noninterest income 4,173 $(147) (1,214) $163 2,975 Noninterest expense 4,306 (147) (853) 3,306 Income before minority interest and income taxes 2,000 (373) 163 1,790 Minority interest in income of BlackRock 71 (71) Income taxes 604 (150) 11 465 Net income $1,325 $(152) $152 $1,325 (a) Includes the impact of the following items, all on a pretax basis: $2,078 million gain on BlackRock/MLIM transaction, $196 million securities portfolio rebalancing loss, $101 million of integration costs, $48 million mortgage loan portfolio repositioning loss, and $12 million loss related to
BlackRock LTIP shares obligation. Also included are PFPC distribution/out-of-pocket revenue and expense primarily associated with pooled investment fund accounts totaling $170 million. |

14
Non-GAAP to GAAP Reconcilement Appendix Income Statement Summary 2004 to 2006 (continued) For the year ended December 31, 2004 PFPC Distribution/ BlackRock PNC Out-Of-Pocket Deconsolidation and BlackRock PNC In millions As Reported Revenue and Expense Other Adjustments Equity Method As Adjusted Net interest income $1,969 $(14) $1,955 Provision for credit losses 52 52 Noninterest income 3,572 $(137) (745) $101 2,791 Noninterest expense 3,712 (137) (564) 3,011 Income before minority interest and income taxes 1,777 (195) 101 1,683 Minority interest in income of BlackRock 42 (42) Income taxes 538 (59) 7 486 Net income $1,197 $(94) $94 $1,197 In millions 2004 2005 2006 CAGR Adjusted net interest income $1,955 $2,142 $2,235 Adjusted noninterest income 2,791 2,975 3,402 Taxable-equivalent adjustment 20 33 25 Adjusted total revenue 4,766 5,150 5,662 9% Adjusted noninterest expense 3,011 3,306 3,417 7% Adjusted net income $1,197 $1,325 $1,514 12% In millions 2004 2005 2006 CAGR Net interest income, as reported $1,969 $2,154 $2,245 Noninterest income, as reported 3,572 4,173 6,327 Taxable-equivalent adjustment 20 33 25 Total revenue, taxable equivalent basis 5,561 6,360 8,597 24% Noninterest expense, as reported 3,712 4,306 4,443 9% Net income, as reported $1,197 $1,325 $2,595 47% |

15
Non-GAAP to GAAP Reconcilement Appendix Noninterest Income, Noninterest Expense and NIM Summary Net Interest Margin, As Reported 4Q06 PNC net interest margin 2.88% 1Q07 PNC net interest margin 2.95% Change from 4Q06 0.07% Impact of Mercantile 0.04% PNC change, excluding Mercantile 0.03% ($ millions) 1Q07 1Q06 4Q06 Noninterest income and Noninterest expense As Reported Adjustments (a) As Adjusted As Reported Adjustments (b) As Adjusted As Reported Adjustments (c) As Adjusted Q106 vs Q107 Q406 vs Q107 % of Total Adj. Revenue TE Asset Management $165 $2 $167 $461 ($333) $128 $149 $10 $159 30% 5% 11% Fund Servicing 295 (106) 189 221 (37) 184 249 (64) 185 3% 2% 12% Service charges on deposits 77 77 73 73 79 79 5% (3%) 5% Brokerage 66 66 59 59 63 63 12% 5% 4% Consumer services 91 91 89 89 93 93 2% (2%) 6% Corporate services 159 159 135 135 177 177 18% (10%) 10% Equity management gains 32 32 7 7 25 25 357% 28% 2% Net securities losses (3) (3) (4) (4) 0 0 (25%) N/M (0%) Trading 52 52 57 57 33 33 (9%) 58% 3% Net gains (losses) related to BlackRock 52 (52) 0 0 0 (12) 12 0 N/M N/M 0% Other 97 97 87 (21) 66 113 113 47% (14%) 6% Total noninterest income 1,083 ($156) $927 $1,185 ($391) $794 $969 ($42) $927 17% 0% 60% Total Revenue As Adjusted, TE basis $1,556 Noninterest expense $1,036 ($117) $919 $1,162 ($334) $828 $969 ($64) $905 11% 2% Mercantile (40) Adjusted noninterest expense excl. Mercantile $879 $828 $905 6% (3%) Adjustments: (a) (b) (c) Integration costs $2 $10 PFPC distribution/out-of-pocket revenue (106) ($37) (64) BlackRock equity method (354) Gain related to transfer of BlackRock shares for LTIP (82) Loss from the net mark-to-market adjustment on BlackRock LTIP shares obligation 30 12 Total adjustments to noninterest income ($156) ($391) ($42) Integration costs ($11) ($6) PFPC distribution/out-of-pocket expense (106) (37) (64) BlackRock equity method (291) Total adjustments to noninterest expense ($117) ($334) ($64) |