SLIDE PRESENTATION FOR BANC ANALYSTS ASSOC. , NOV. 3, 2006
Published on November 3, 2006

The PNC
Financial Services Group, Inc. Corporate & Institutional Banking BancAnalysts Association of Boston 25 th Annual Conference November 3, 2006 EXHIBIT 99.1 |

This presentation contains forward-looking statements regarding our outlook or
expectations relating to PNCs future business, operations, financial
condition, financial performance and asset quality.
Forward-looking statements are necessarily subject to numerous
assumptions, risks and uncertainties, which change over time. The forward-looking statements in this presentation are qualified by the factors
affecting forward-looking statements identified in the more detailed
Cautionary Statement included in the Appendix and in the version of the presentation materials posted on our corporate website at www.pnc.com under About PNC Investor Relations.
We provide greater detail regarding those factors in our 2005 Form 10-K, including in the Risk Factors
and Risk Management sections, and in our 2006 Form 10-Qs and other SEC
reports (accessible on the SECs website at www.sec.gov and on or
through our corporate website). Future events or circumstances may change our outlook or expectations and may also
affect the nature of the assumptions, risks and uncertainties to which our forward-looking statements are subject. The forward-looking statements in this presentation
speak only as of the date of this presentation. We do not assume any
duty and do not undertake to update those statements. This presentation may also include a discussion of non-GAAP financial measures,
which, to the extent not so qualified therein or in the Appendix, is
qualified by GAAP reconciliation information available on our corporate website at www.pnc.com under About PNC - Investor Relations. Cautionary Statement Regarding Forward-Looking Information |

Key
Takeaways Weve built a unique middle market franchise Which positions us well in an environment where it is difficult to generate appropriate risk-adjusted returns from lending-only relationships Our strategy is differentiated by a broad array of product solutions, execution and cross-sell |
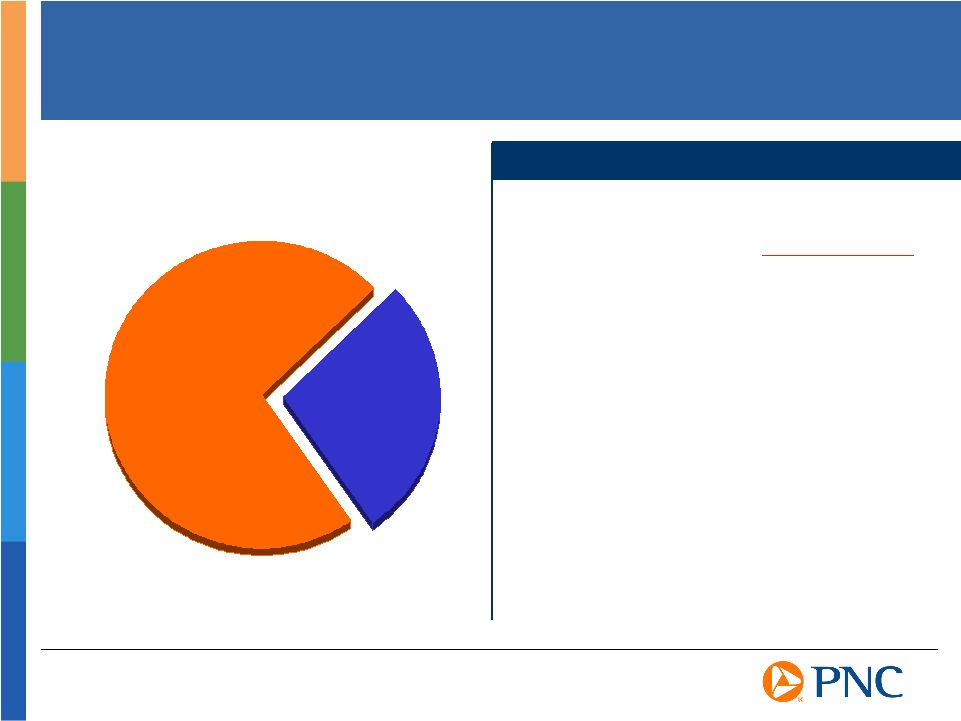
Corporate &
Institutional Banking A Major Contributor to PNCs Earnings Business segment earnings and return on capital reconciled to GAAP net income and
returns in Appendix Contribution to Total PNC Business Contribution to Total PNC Business Segment Earnings of $1.2 Billion Segment Earnings of $1.2 Billion For the Nine Months Ended 9/30/06 For the Nine Months Ended 9/30/06 Corporate & Institutional Banking 27% C&I Banking Financial Highlights Net income $334 million Return on average capital 23% Noninterest income to total revenue 51% NPAs to loans 0.46% As of or for the Nine Months Ended September 30, 2006 |
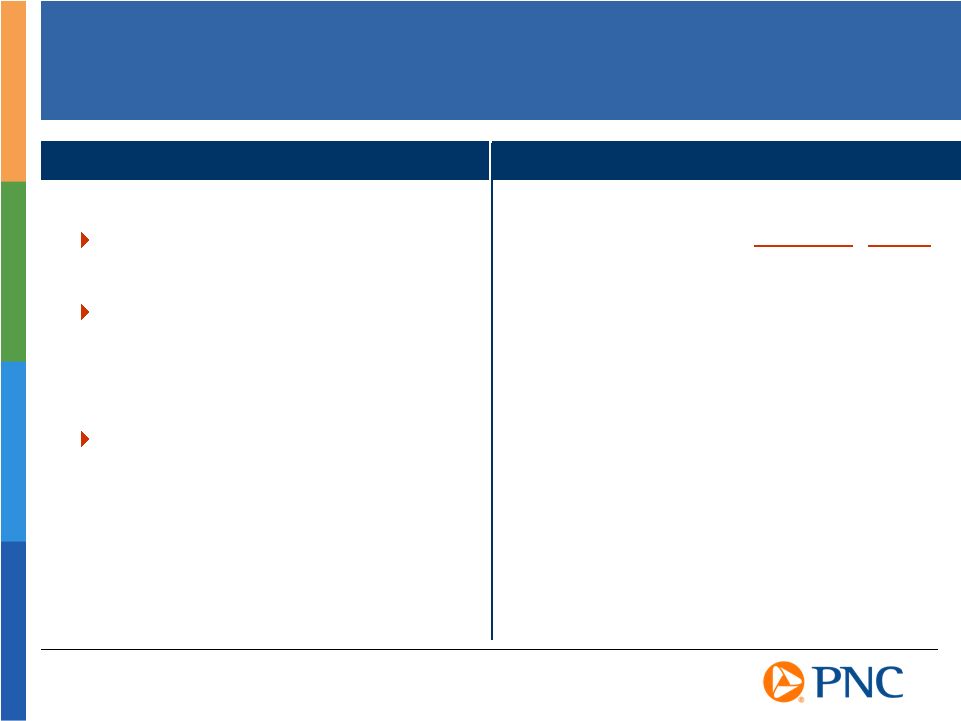
Diverse - No large industry concentration Limited large non-investment grade exposure - Only 3% is non-investment
grade and >$50 million Targeted - Focused on clients that meet risk-adjusted return criteria Disciplined Approach Leads to Strong Credit Risk Profile Strong Asset Quality Lending Profile (As of September 30, 2006)
PNC Consolidated September 30, 2006 Nonperforming loans to loans 0.34% 0.38% Net charge-offs to average loans YTD 0.26% 0.27% Allowance for loan and lease losses to loans 1.16% 1.14% Allowance for loan and lease losses to nonperforming loans 339% 335% Peer Group Source: SNL DataSource; PNC as reported on consolidated basis. Peer group represents average of super-regional banks identified in the Appendix. Peer group excludes PNC. Commercial Loans |

Focused on
National Middle Market Opportunity Middle Market Statistics Approximately 35,000 companies with annual sales of $20 million
to $1 billion (D&B) Vast majority of middle market companies are privately held (One Source) Recent advances in the capital markets have opened up new and more sophisticated sources of capital to middle market companies Middle Market M&A deals reached a 5-year high in 2005 with 1,700 transactions totaling nearly $225 billion in value (Thomson Financial) Private equity groups raised a total of $174 billion in capital in 2005 versus
average of $32 billion per year since 2001 (Thomson Financial) |
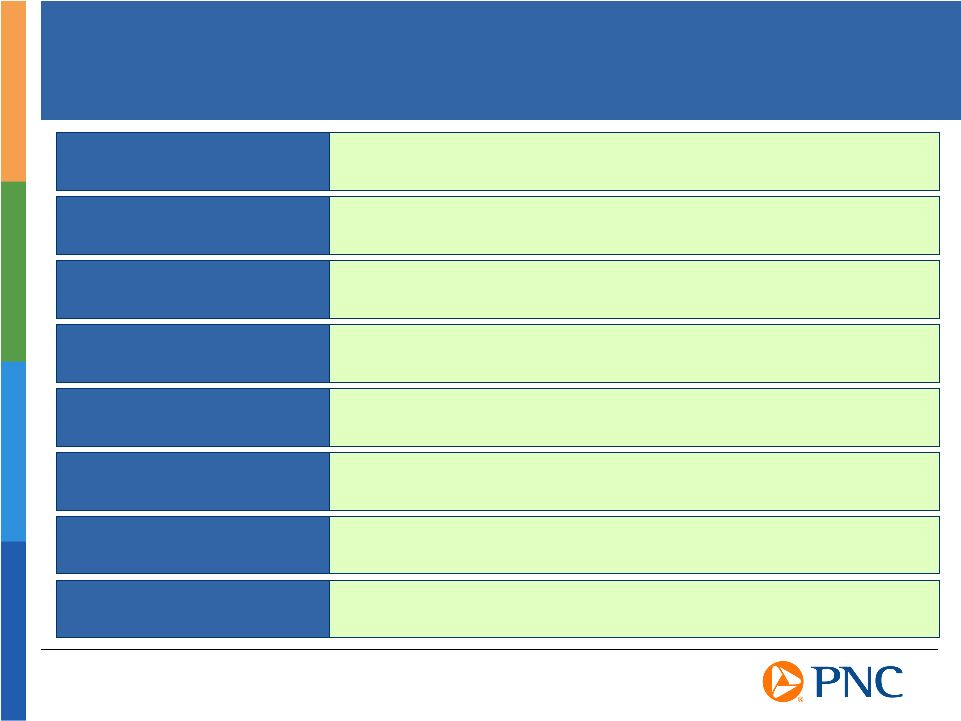
Broad Array of
Solutions for Middle Market Companies Cash Flow Lending / Asset Based Lending / Asset Securitization / Commercial Real Estate Finance / Equipment Finance Financing Treasury Management International Services Capital Markets Mergers and Acquisitions Institutional Investments Wealth Management Additional Capabilities Receivables / Disbursements / Information Reporting / Liquidity Management Trade Services / Trade Finance / Receivables Management for Exporters / Foreign Exchange / Correspondent Bank Network / Global Cash Management Loan Syndications / Derivatives / Foreign Exchange / Public Finance / Private Placements / Public Market Securities Sell Side Advisory / Restructuring and Capital Raising / Management Buyouts /
Fairness Opinions / Acquisitions Advisory Asset Management / Employee Benefits / Charitable Endowments / Delaware Holding Company Wealth Planning / Trust / Personal and Business Banking / Ultra High Net Worth
Workplace Banking / Commercial Insurance / Merchant Services
|

A Leader in
Cross-Sell Penetration of Middle Market Customers in PNCs Footprint (1) PNC has Highest Percentage of Lead Bank Relationships in Our Footprint (63%) Treasury management 74% 1 st Business checking accounts 69% 1 st Capital markets 26% 1 st Short-term investment services 52% 1 st International services 24% 1 st Investment banking services 10% 1 st Equipment leasing 17% 1 st 401(k) profit sharing, savings plans 17% 1 st Loans/lines of credit 57% 2 nd Based on third party survey of companies with annualized revenues of $30-$500
million. Competitors referenced in survey include Bank of America,
Commerce Bank, Citizens Bank, Fifth Third, JP Morgan Chase, M&T Bank, National City and Wachovia. 2006 Rank (1) PNC Penetration |

Key
Takeaways Weve built a unique middle market franchise Which positions us well in an environment where it is difficult to generate appropriate risk-adjusted returns from lending-only relationships Our strategy is differentiated by a broad array of product solutions, execution and cross-sell |
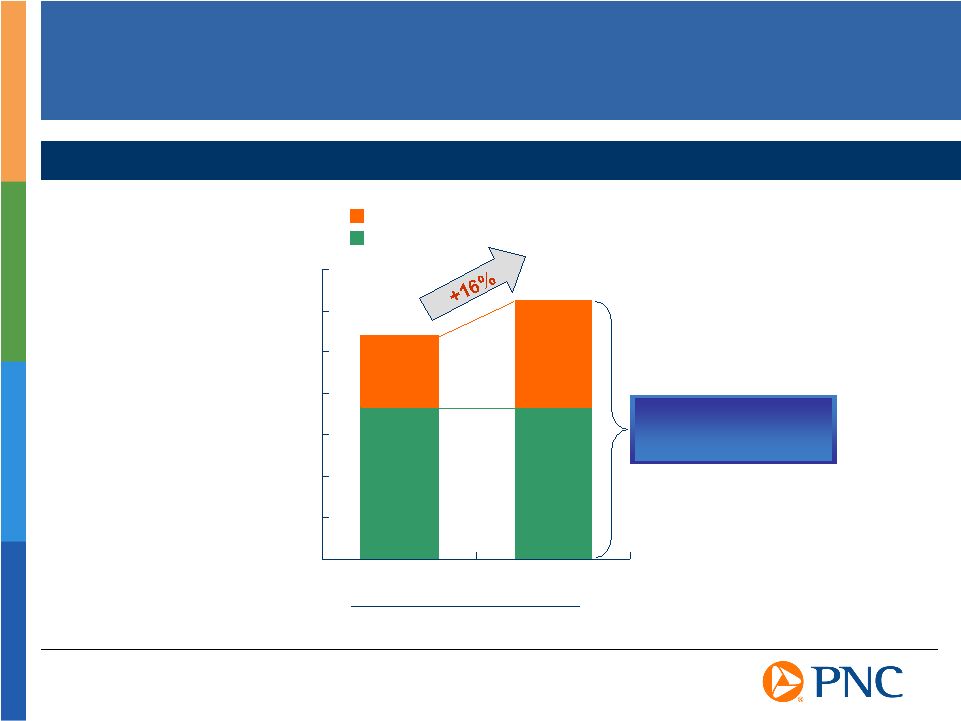
The Market is
Flooded with New Competitors.. Total Syndicated Loan Volume $0 $200 $400 $600 $800 $1,000 $1,200 $1,400 2005 2006 $ billions Nine Months Ended September 30 New Money Issuance Refinancings +0% +49% Non-Investment Grade: 53% |

Others Are
Lending At Below Breakeven Returns.. 1.7% 8 of last 16 yrs. 1.4% Ba 0.69% 7 of last 16 yrs. 0.60% Baa 3.5% 4 of last 16 yrs. 2.7% B Break-even Spread (2) Current Spread Coverage of Historical Losses Current Spread (1) Bond Rating (1) Analysis is based on market spreads. PNCs risk-adjusted loan spread
would most likely exceed the market spreads. (2) Spread needed to cover
historical losses for 5 year loan/bond. Excludes other non-spread fee income. Bond Spreads vs. Historical Loss Results Based on our analysis, spreads typically cover losses in less than half of all years Break-even spreads cover only average losses |
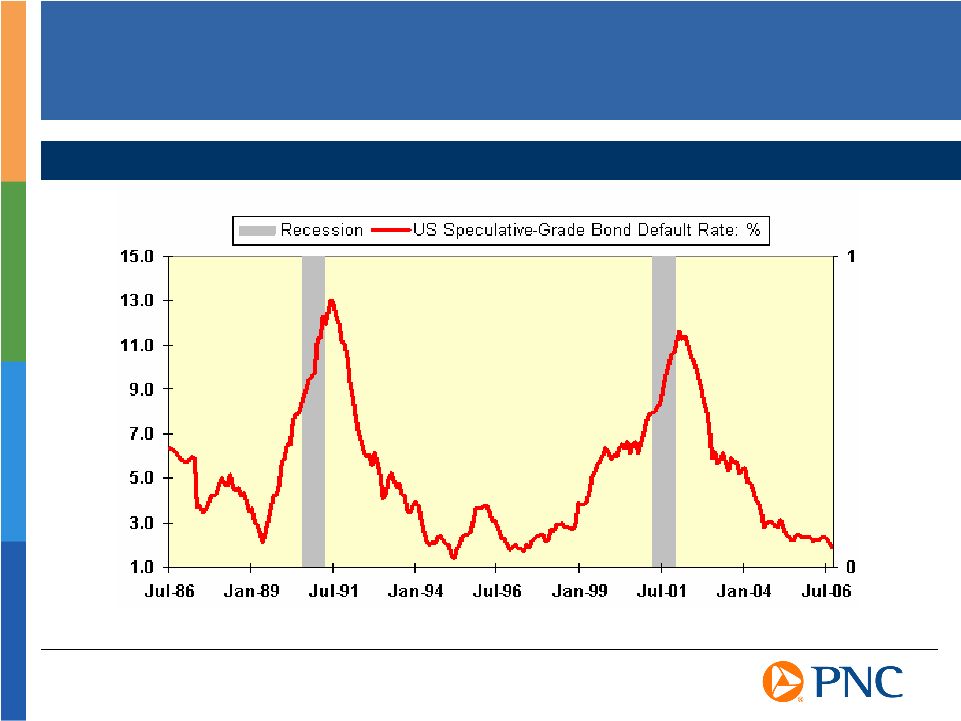
And Default
Rates are at a Low Point U.S. Speculative-Grade Bond Default Rate Source: Moodys Investor Service |

Key
Takeaways Weve built a unique middle market franchise Which positions us well in an environment where it is difficult to generate appropriate risk-adjusted returns from lending-only relationships Our strategy is differentiated by a broad array of product solutions, execution and cross-sell - Building on the success of national Commercial Real Estate, Asset Based Lending, Treasury Management, Capital Markets and M&A advisory capabilities - Deepening client relationships - Investing in new products, segments and technology to achieve competitive advantage |
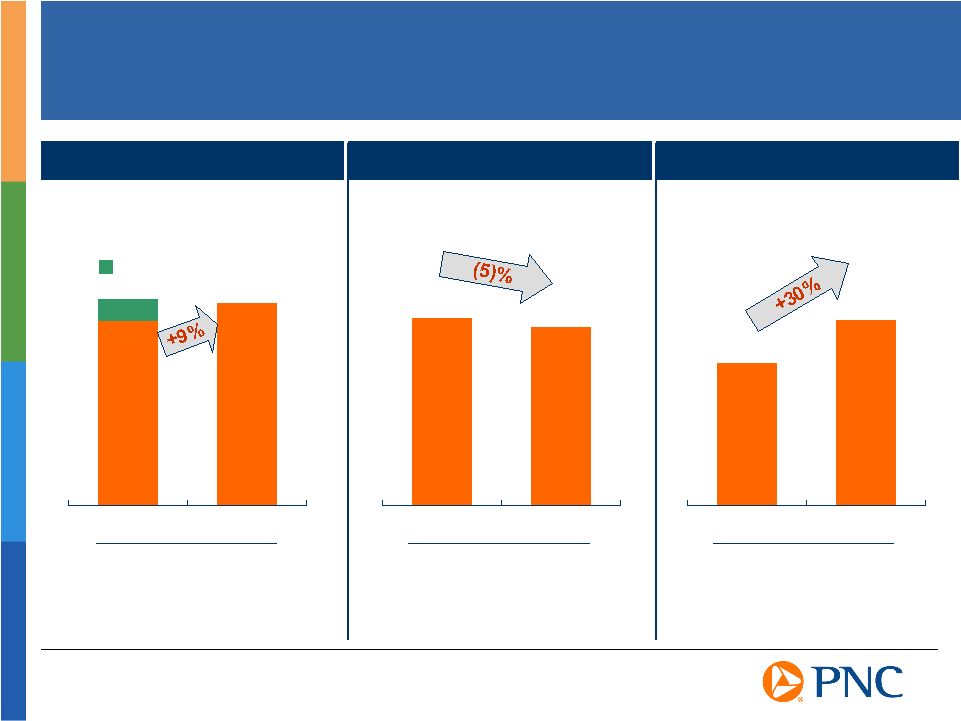
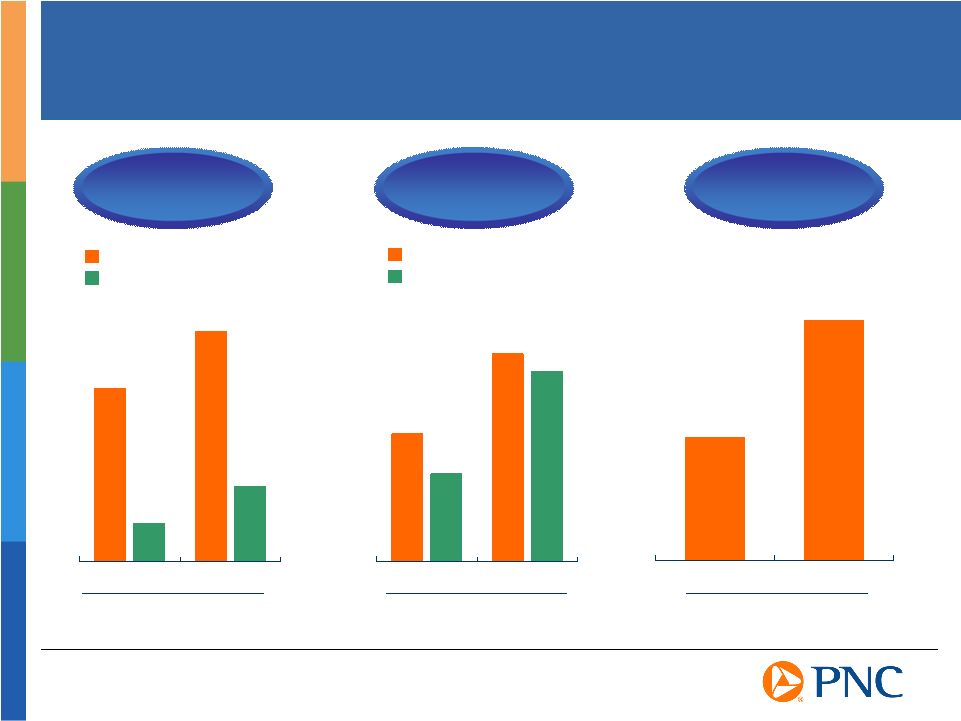
$548
$422 2005 2006 $530 $555 2005 2006 2005 2006 Already Delivering on Our Strategies Generating Loan Growth, but
Commercial & Institutional Banking Total Average Loans Commercial & Institutional Banking Net Interest Income (TE) Commercial & Institutional Banking Noninterest Income Three Months Ended September 30 Nine Months Ended September 30 Nine Months Ended September 30 $ billions $ millions $ millions Selling More Fee-Based Products Spreads Have Narrowed, so
Net interest income on a taxable equivalent basis is reconciled to GAAP in Appendix. Includes lease financing. 2005 includes Market Street which was deconsolidated from our Consolidated Balance Sheet effective October 17, 2005. * * $20.4 $18.3 $20.0 Market Street |
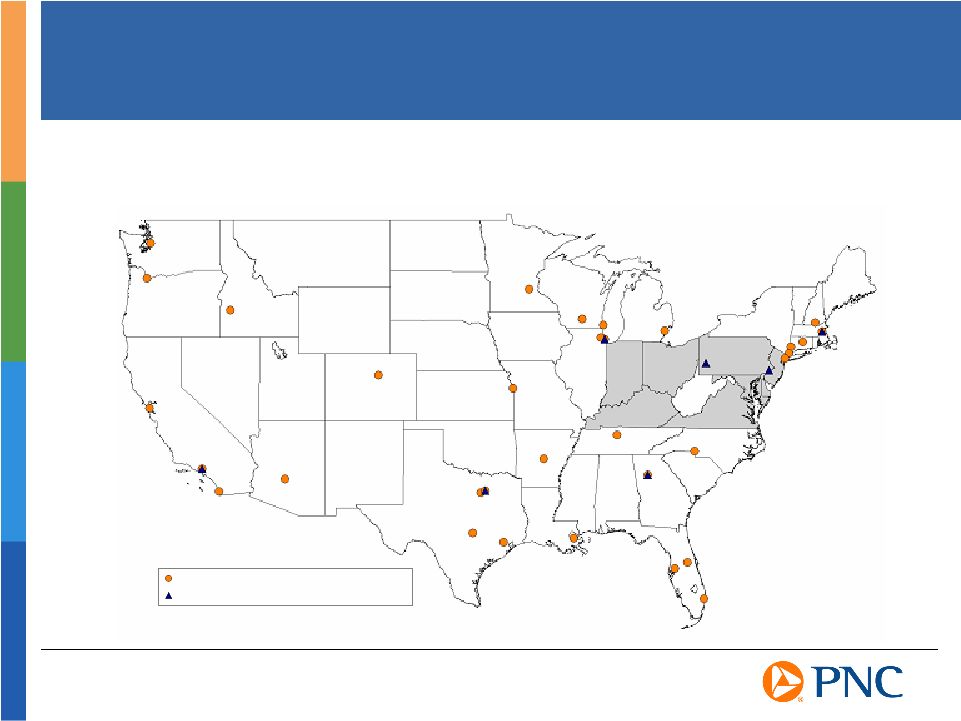
Building on
Our National Distribution Capabilities Offering Commercial Real Estate, Asset Based Lending, Treasury Management and M&A Advisory Services Nationwide Corporate & Institutional Banking Location Lock Box Location |
PNCs
Commercial Real Estate Model Development Pre-development funding Construction finance Tax credit equity Letters of credit Bridge financing Mezzanine financing Equity bridge loans CMBS FHA permanent loan programs Freddie Mac loan programs Commercial loan servicing Offering Real Estate Solutions that Span the Life of a Project Interim Permanent |
$4.6
$6.1 $1.0 $2.0 2004 2006 Capturing Full Spectrum of Commercial Real Estate Opportunities $93 $180 2004 2006 Commercial Mortgage Servicing Portfolio Nine Months Ended September 30 Nine Months Ended September 30 As of September 30 Originations $ billions $ billions Sales Servicing $ billions $1.3 $2.1 $0.9 $2.0 2004 2006 Loan Syndications CMBS Balance Sheet Driven CMBS Conduit |
A Leading
Asset Based Lending Franchise Building on Established National Network 28 offices across the country 14 managers 65 sales representatives 67 portfolio managers 16 underwriters 46 field examiners 84 operations & other personnel Sales and Servicing Capabilities $0.0 $0.5 $1.0 $1.5 2005 2006 $ billions Nine Months Ended September 30 Transaction Volumes New Deals 75 86 $1.1 $1.4 |

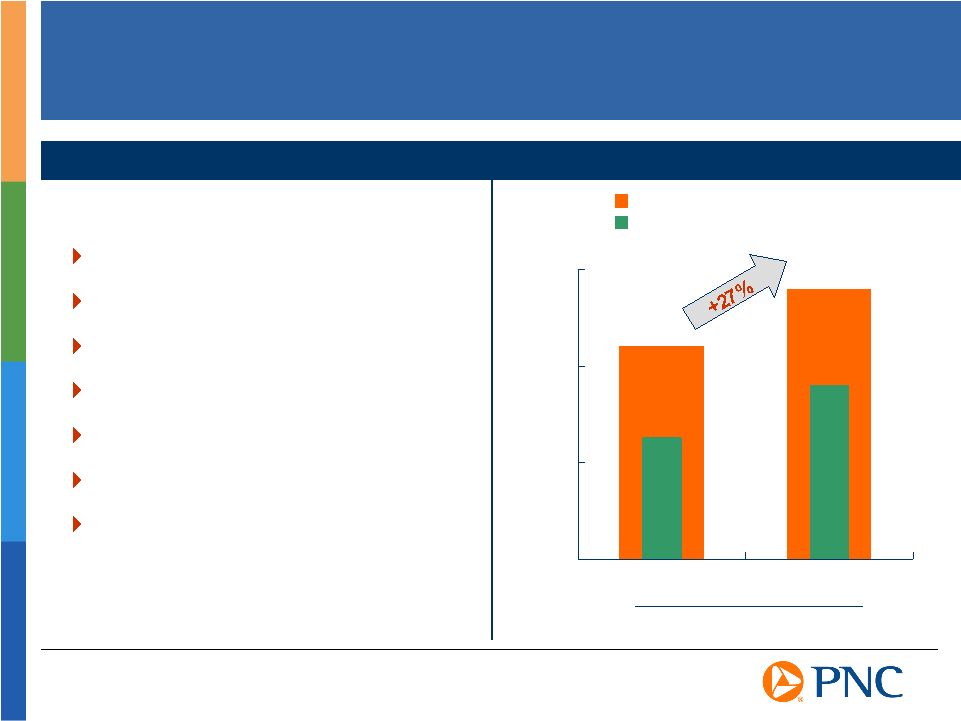
Harris
Williams A Leader in M&A Advisory to the Middle Market Harris Williams YTD 9/30/06 revenue up 58% over YTD 9/30/05* Two new industry-focused teams launched: Technology and Transportation /
Logistics Backlog is stronger than ever with nearly 10% of currently engaged
transactions having a PNC connection PNCs Wealth Management team is receiving introductions to many Harris
Williams clients Opened 2 offices in Philadelphia and Minneapolis Increased staff by over 20% since January 1, 2006 PNC & Harris Williams - Highly Successful First Year Together Growing revenue Expanding geographic presence Generating strong deal flow YTD 9/30/05 reflects Harris Williams standalone revenue * |

Treasury
Management Expanding High Growth Product Revenues Faster than the Industry Wholesale lockbox 8% 5% Purchasing card 46% 14% EDI 59% 9% All products 6% 3% PNC Industry Average Selected Product Revenue Growth 2005 vs 2004 * * Source: Ernst & Young industry survey |

Summary
Weve built a unique middle market franchise Which positions us well in an environment where it is difficult to generate appropriate risk-adjusted returns from lending-only relationships Our strategy is differentiated by a broad array of product solutions, execution and cross-sell |

We make statements in this presentation, and we may from time to time make other statements, regarding our outlook or expectations for earnings, revenues, expenses and/or other matters regarding or affecting PNC that are forward-looking
statements within the meaning of the Private Securities Litigation Reform Act. Forward-looking statements are typically identified by words such as believe, expect, anticipate, intend, outlook, estimate, forecast, project and other similar words and expressions. Forward-looking statements are subject to numerous assumptions, risks and
uncertainties, which change over time. Forward-looking statements speak only as of the date they are made. We do not assume any duty and do not undertake to update
our forward-looking statements. Actual results or future events could differ, possibly materially, from those that we anticipated in our forward-looking
statements, and future results could differ materially from our historical performance. Our forward-looking statements are subject to the following principal risks and
uncertainties. We provide greater detail regarding these factors in our Form 10-K for the year ended December 31, 2005 and in our current year Form 10-Qs, including
in the Risk Factors and Risk Management sections of those reports. Our forward-looking statements may also be subject to other risks and uncertainties,
including those that we may discuss elsewhere in this presentation or in our filings with the SEC, accessible on the SECs website at www.sec.gov and on or through our corporate website at www.pnc.com under About PNC Investor Relations. Our business and operating results are affected by business and economic conditions
generally or specifically in the principal markets in which we do business. We are affected by changes in our customers financial performance, as well as changes in customer preferences and behavior,
including as a result of changing economic conditions. The value of our assets and liabilities as well as our overall financial performance
are affected by changes in interest rates or in valuations in the debt and
equity markets. Actions by the Federal Reserve and other government agencies, including those that impact money supply and market interest rates, can affect our activities and financial results. Competition can have an impact on customer acquisition, growth and retention, as well
as on our credit spreads and product pricing, which can affect market
share, deposits and revenues. Our ability to implement our One PNC initiative, as well as other business initiatives
and strategies we may pursue, could affect our financial performance over
the next several years. Our ability to grow successfully through acquisitions is impacted by a number of risks
and uncertainties related both to the acquisition transactions themselves
and to the integration of the acquired businesses into PNC after closing. These uncertainties are present in transactions such as our pending acquisition of Mercantile Bankshares Corporation. Cautionary Statement Regarding Forward-Looking Information |

Legal and regulatory developments could have an impact on our ability to operate our
businesses or our financial condition or results of operations or our
competitive position or reputation. Reputational impacts, in turn,
could affect matters such as business generation and retention, our ability to attract and retain management, liquidity and funding. These legal and regulatory
developments could include: (a) the unfavorable resolution of legal proceedings or regulatory and other governmental inquiries; (b) increased litigation risk from recent regulatory and other governmental developments; (c) the results of the regulatory examination process, our failure to satisfy the
requirements of agreements with governmental agencies, and regulators future use of supervisory and enforcement tools; (d) legislative and regulatory
reforms, including changes to laws and regulations involving tax, pension,
and the protection of confidential customer information; and (e) changes in accounting policies and principles. Our business and operating results are affected by our ability to identify and
effectively manage risks inherent in our businesses, including, where appropriate, through the effective use of third-party insurance and capital
management techniques. Our ability to anticipate and respond to technological changes can have an impact on
our ability to respond to customer needs and to meet competitive demands.
The adequacy of our intellectual property protection, and the extent of any costs
associated with obtaining rights in intellectual property claimed by others, can also impact our business and operating results. Our business and operating results can be affected by widespread natural disasters, terrorist activities or international hostilities, either as a result of the impact on the economy and financial and capital markets generally or on us or on
our customers, suppliers or other counterparties specifically.
Also, risks and uncertainties that could affect the results anticipated in
forward-looking statements or from historical performance relating to our interest in BlackRock, Inc. are discussed in more detail in BlackRocks 2005 Form 10-K, including in the Risk Factors section, and in BlackRocks other filings with the SEC, accessible on the SECs website and on or through BlackRocks website at www.blackrock.com. In addition, our pending acquisition of Mercantile Bankshares presents us with a number
of risks and uncertainties related both to the acquisition transaction itself and to the integration of the acquired businesses into PNC after closing.
These risks and uncertainties include the following: Completion of the transaction is dependent on, among other things, receipt of
regulatory and Mercantile shareholder approvals, the timing of which cannot
be predicted with precision at this point and which may not be received at all. The impact of the completion of the transaction on PNCs financial statements will be affected by the timing of the transaction. The transaction may be substantially more expensive to complete (including the integration of Mercantiles businesses) and the anticipated benefits, including anticipated cost savings and strategic gains, may be significantly harder or
take longer to achieve than expected or may not be achieved in their
entirety as a result of unexpected factors or events. Cautionary Statement
Regarding Forward-Looking Information (continued)
|

The integration of Mercantiles business and operations into PNC, which will include conversion of Mercantiles different systems and procedures, may take longer than anticipated or be more costly than anticipated or have unanticipated adverse results relating to Mercantiles or PNCs existing businesses. The anticipated benefits to PNC are dependent in part on Mercantiles business performance in the future, and there can be no assurance as to actual future results, which could be impacted by various factors, including the risks and uncertainties generally related to PNCs and Mercantiles performance (with respect to Mercantile, see Mercantiles SEC reports, accessible on the SECs website) or due to factors related to the acquisition of Mercantile and the process of integrating it into PNC. In addition to the pending Mercantile Bankshares transaction, we grow our business from time to time by acquiring other financial services companies. Acquisitions in general present us with risks other than those presented by the nature of the business acquired. In particular, acquisitions may be substantially more expensive to complete (including as a result of costs incurred in connection with
the integration of the acquired company) and the anticipated benefits (including anticipated cost savings and strategic gains) may be significantly harder or
take longer to achieve than expected. In some cases, acquisitions involve our entry into new businesses or new geographic or other markets, and these situations also present risks resulting from our inexperience in these new areas. As a regulated financial institution, our pursuit of attractive acquisition
opportunities could be negatively impacted due to regulatory delays or other regulatory issues. Regulatory and/or legal issues related to the pre-acquisition operations of an acquired business may cause reputational harm to PNC following the acquisition and integration of the acquired business into ours and may
result in additional future costs and expenses arising as a result of those issues. Any annualized, proforma, estimated, third party or consensus numbers in this
presentation are used for illustrative or comparative purposes only and may not reflect actual results. Any consensus earnings estimates are calculated based on
the earnings projections made by analysts who cover that company. The analysts opinions, estimates or forecasts (and therefore the consensus earnings estimates) are theirs alone, are not those of PNC or its management, and may not reflect PNCs, Mercantiles or other companys actual or anticipated results. Cautionary Statement Regarding Forward-Looking Information (continued)
|

The PNC Financial Services Group, Inc. and Mercantile Bankshares Corporation will be filing a proxy statement/prospectus and other relevant documents concerning the PNC/Mercantile merger transaction with the United States Securities and Exchange Commission (the
SEC). SHAREHOLDERS ARE URGED TO READ THE PROXY
STATEMENT/PROSPECTUS AND ANY OTHER DOCUMENTS TO BE FILED WITH THE SEC IN
CONNECTION WITH THE MERGER TRANSACTION OR INCORPORATED BY REFERENCE IN THE
PROXY STATEMENT/PROSPECTUS WHEN THEY BECOME AVAILABLE, BECAUSE THEY WILL
CONTAIN IMPORTANT INFORMATION. Shareholders will be able to obtain
free copies of the proxy statement/prospectus, as well as other filings
containing information about Mercantile Bankshares and PNC, without charge,
at the SECs Internet site (http://www.sec.gov). In addition, documents filed with the SEC by The PNC Financial Services Group, Inc. will be available free of charge from
Shareholder Relations at (800) 843-2206. Documents filed with the
SEC by Mercantile Bankshares will be available free of charge from Mercantile Bankshares Corporation, 2 Hopkins Plaza, P.O. Box 1477, Baltimore, Maryland 21203, Attention: Investor Relations. Mercantile Bankshares and its directors and executive officers and certain other members
of management and employees are expected to be participants in the
solicitation of proxies from Mercantile Bankshares shareholders in respect of the proposed merger transaction. Information regarding the directors and executive officers of Mercantile Bankshares is available in
the proxy statement for its May 9, 2006 annual meeting of shareholders,
which was filed with the SEC on March 29, 2006. Additional information
regarding the interests of such potential participants will be included in
the proxy statement/prospectus relating to the merger transaction and the other relevant documents filed with the SEC when they become available. Additional Information About The PNC/Mercantile Transaction |

Appendix |

Non-GAAP
to GAAP Reconcilement Business segments Retail Banking $581 26% 48% Corporate & Institutional Banking 334 23% 27% BlackRock (a)(b) 209 29% 8% PFPC 93 31% 17% Total business segments 1,217 26% 100% Minority interest in income of BlackRock (64) Other (b)(c)
1,066 Total consolidated $2,219 34% $ millions Return on Average Capital * Percentages for BlackRock and PFPC reflect return on average equity. PNCs ownership interest in BlackRock was approximately 69-70% for the period presented. Effective September 29, 2006,
PNCs ownership interest in BlackRock dropped to approximately 34% BlackRock reported GAAP earnings of $153 million for the period presented. For PNC business segment reporting presentation, pretax integration costs incurred by BlackRock for the MLIM transaction, totaling $91 million for the period presented, have been
reclassified from BlackRock to Other. Other for the period presented also includes the after-tax impact of PNCs gain on the BlackRock / MLIM transaction and PNCs costs associated with its securities portfolio rebalancing and mortgage loan portfolio
repositioning. Appendix Business Earnings and Return on Capital Nine Months Ended September 30, 2006 Earnings Segment Earnings Contribution * (a) (b) (c) |

Non-GAAP
to GAAP Reconcilement Appendix Net Interest Income Business segments Retail Banking $1,172 $4 $1,176 $1,255 $4 $1,259 Corporate & Institutional Banking 549 6 555 523 7 530 BlackRock 31 1 32 20 5 25 PFPC (27) 0 (27) (29) 0 (29) Total business segments 1,725 11 1,736 1,769 16 1,785 Minority interest in income of BlackRock Other (126) 9 (117) (90) 4 (86) Total consolidated $1,599 $20 $1,619 $1,679 $20 $1,699 $ millions Taxable- Equivalent Adjustment 2005 Nine Months Ended September 30 GAAP Net Interest Income 2005 Net Interest Income TE 2005 Taxable- Equivalent Adjustment 2006 GAAP Net Interest Income 2006 Net Interest Income TE 2006 |

BB&T Corporation BBT The Bank of New York Company, Inc. BK Fifth Third Bancorp FITB KeyCorp KEY National City Corporation NCC The PNC Financial Services Group, Inc. PNC Regions Financial RF SunTrust Banks, Inc. STI U.S. Bancorp USB Wachovia Corporation WB Wells Fargo & Company WFC Ticker Peer Group of Super-Regional Banks Appendix |