SLIDE PRESENTATION FOR THE LEHMAN BROTHERS FINANCIAL SERVICE CONFERENCE
Published on May 17, 2006

The PNC
Financial Services Group, Inc. Lehman Brothers 2006 Financial Services Conference May 17, 2006 EXHIBIT 99.1 |

This presentation contains forward-looking statements regarding our outlook or
expectations relating to PNCs future business, operations, financial
condition, financial performance and asset quality.
Forward-looking statements are necessarily subject to numerous
assumptions, risks and uncertainties, which change over time. The forward-looking statements in this presentation are qualified by the factors
affecting forward-looking statements identified in the more detailed
Cautionary Statement included in the Appendix and in the version of the presentation materials posted on our corporate website at www.pnc.com. We provide greater detail regarding those factors
in our 2005 Form 10-K, including in the Risk Factors and Risk Management
sections, and in our first quarter 2006 Form 10-Q and other SEC reports
(accessible on the SECs website at www.sec.gov and on or through our
corporate website). Future events or circumstances may change our outlook or
expectations and may also affect the nature of the assumptions, risks and uncertainties to which our forward-looking statements are subject. The forward-looking statements in this presentation
speak only as of the date of this presentation. We do not assume any
duty and do not undertake to update those statements. This presentation may also include a discussion of non-GAAP financial measures,
which, to the extent not so qualified therein or in the Appendix, is
qualified by GAAP reconciliation information available on our corporate website at www.pnc.com under For Investors. Cautionary Statement Regarding Forward-Looking Information |

Key
Messages A diversified financial services company Maintaining a moderate risk profile that is key to improving consistency Executing strategies focused on continued growth and positive operating leverage PNC is
|
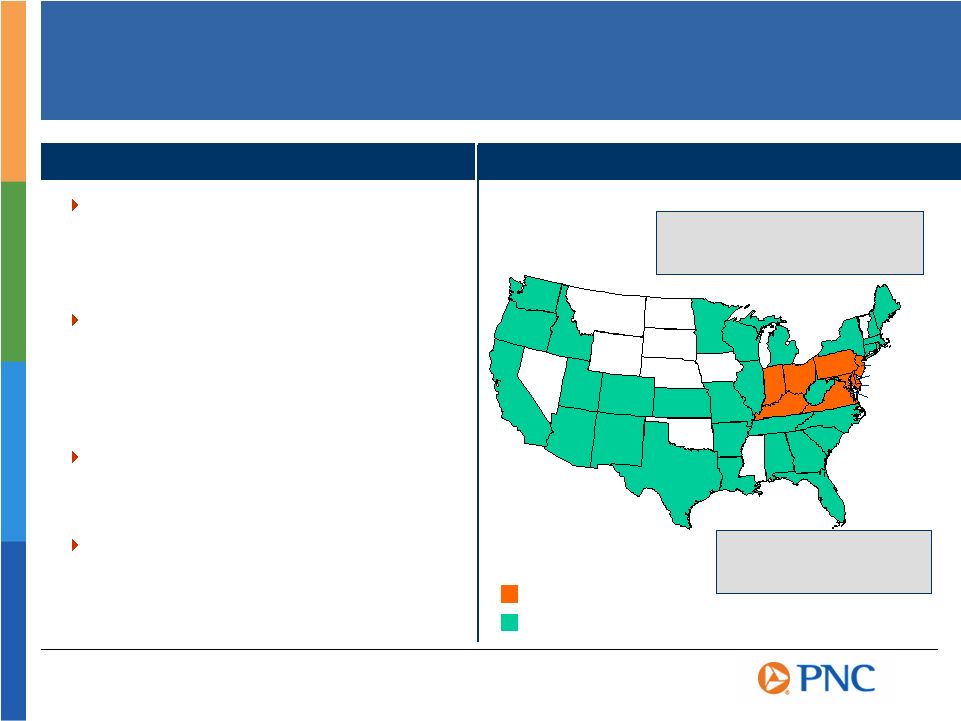
Regional, National and International Businesses International fund processing: PFPC with offices in U.S., Ireland & Luxembourg International investment management: BlackRock with offices in U.S., Scotland, Hong Kong, Tokyo & Australia PNC A Diversified Financial Services Company IN OH PA KY NJ DE Business Leadership Retail Banking - A leading community bank in PNC major markets - Top 10 SBA lender in the U.S. - One of the nations largest wealth management firms Corporate & Institutional Banking - Top 10 Treasury Management business - The nations second largest lead arranger of asset-based loan syndications - Harris Williams - one of the nations largest M&A advisory firms for middle market companies PFPC - Among the largest providers of mutual fund transfer agency and accounting and administration services in the U.S. BlackRock - One of the nations largest publicly traded asset managers PNC Bank Branches PNC Employees / Offices Outside of Retail Footprint VA DC MD |

PNCs High Return Business Mix Business Earnings Contribution Three Months Ended March 31, 2006 Retail Banking Earnings $190 Return on capital 26% Corporate & Institutional Banking Earnings $105 Return on capital 22% BlackRock Earnings $71 Return on average equity 30% PFPC Earnings $27 Return on average equity 28% $ millions Business earnings and return on capital reconciled to GAAP net income and returns in
Appendix |

$0 $200 $400 $600 $800 $1,000 $1,200 $1,400 2003 2004 2005 $0 $50 $100 $150 $200 $250 $300 $350 $400 1Q05 1Q06 Weve Been Delivering Results 2003 net income excludes expenses related to the DOJ agreement of $87 million after tax
and is reconciled to GAAP in Appendix 2005 and 1Q05 net income excludes
one-time tax benefit of $45 million and is reconciled to GAAP in Appendix $ millions Consolidated Net Income Year to Date Highlights Earned $354 million or $1.19 per diluted share in first quarter Experienced solid customer growth and business trends Asset quality remained strong Announced 10% dividend increase BlackRock announced agreement to merge with Merrill Lynchs investment management business Well positioned with anticipated significant capital flexibility (1) (2) (2) (1) (2) |

BlackRock/Merrill Lynch Investment Managers Combination Creates Leading Investment Management Firm Will create a top ten investment manager worldwide - $1 trillion in assets under management - Largest publicly traded asset manager in the U.S. - Largest active fixed income manager in the U.S. - 4 th largest broker-distributed U.S. fund family Will unlock value and create opportunities for PNC - PNC retains our share ownership in larger and more valuable company - Immediately accretive to PNCs earnings - BlackRock contribution to PNC earnings expected to increase - $1.6 billion after-tax gain expected to be recognized, subject to adjustments, at
closing - Significant additional unrecognized gain on BlackRock investment - Will better align our tangible common equity ratio with our regulatory and economic
capital Transaction is a WinWin for PNC and BlackRock
|

Key
Messages A diversified financial services company Maintaining a moderate risk profile that is key to improving consistency Executing strategies focused on continued growth and positive operating leverage PNC is
|

Strong Risk
Culture is Essential to Minimizing Surprises Strengthened personnel and systems Improved diversification Increased loan granularity Enhanced disclosure Remained disciplined Strategic Actions Weve Taken to Enhance our Risk Culture |
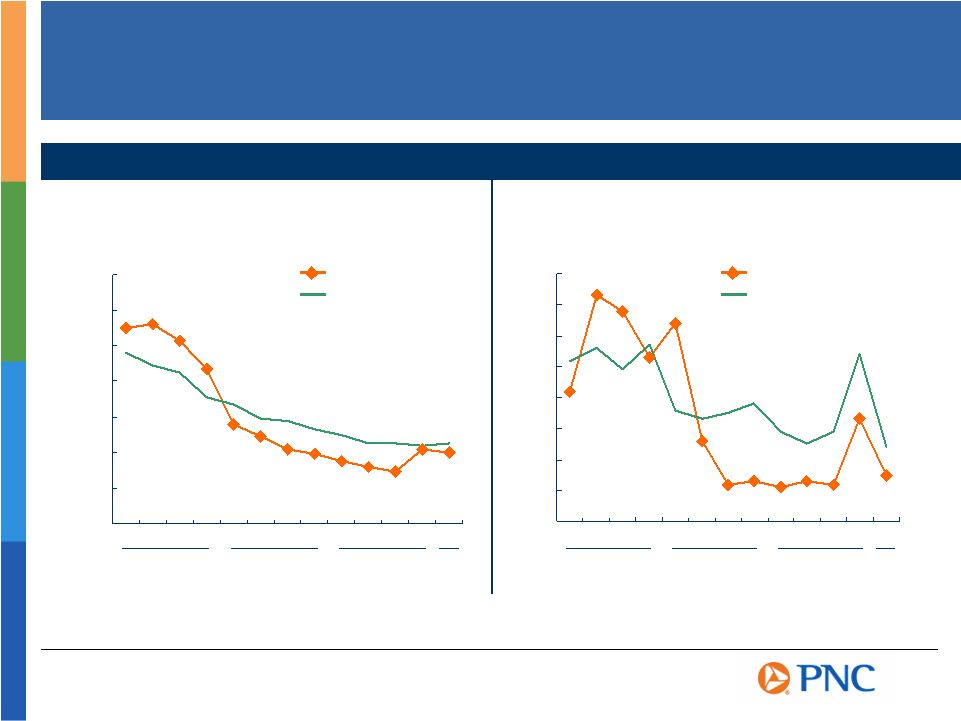
0.0% 0.2% 0.4% 0.6% 0.8% 1.0% 1.2% 1.4% 1Q 2Q 3Q 4Q 1Q 2Q 3Q 4Q 1Q 2Q 3Q 4Q 1Q 0.0% 0.1% 0.2% 0.3% 0.4% 0.5% 0.6% 0.7% 0.8% 1Q 2Q 3Q 4Q 1Q 2Q 3Q 4Q 1Q 2Q 3Q 4Q 1Q Disciplined Approach Leads to Strong Asset Quality Asset Quality Compared to Peers Net Charge-offs to Average Loans PNC Peer Group Source: SNL DataSource PNC 2Q05 net charge-off ratio excludes $53 million loan recovery. The ratio
was (0.32%) including the recovery. Peer group reflects median of
super-regional banks as defined in Appendix excluding PNC Nonperforming
Assets to Loans, Loans Held for Sale and Foreclosed Assets PNC Peer Group 2003 2004 2005 2006 2003 2004 2005 2006 |
High
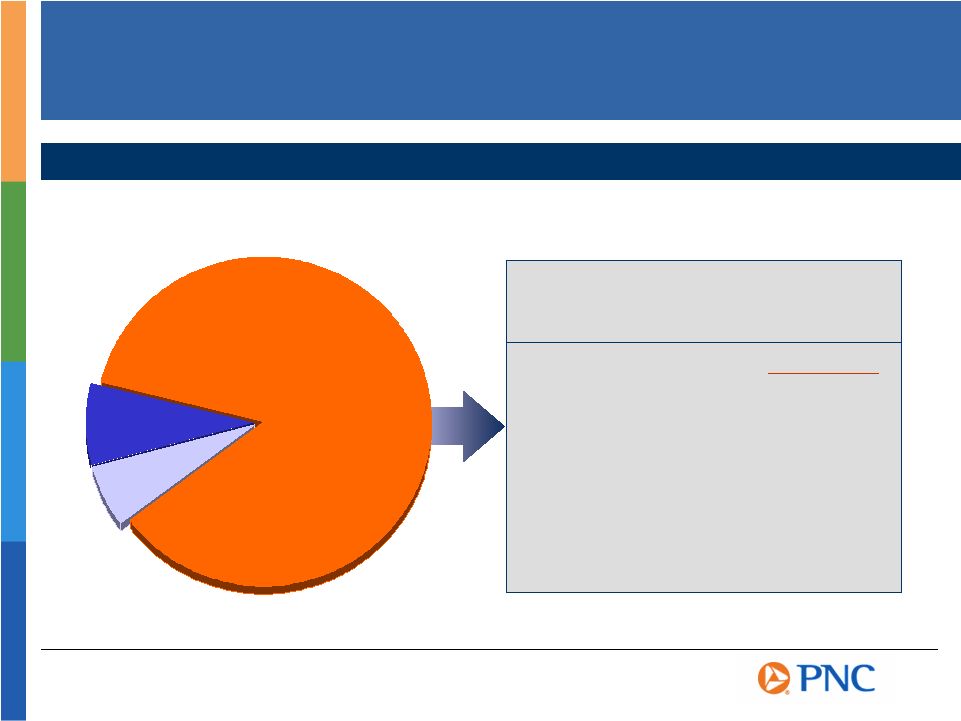
Quality Consumer Loan Portfolio Home Equity Loans Auto Loans Other Consumer Loans Composition of Consumer Loan Portfolio Average Consumer Loans For the Three Months Ended 3/31/06 Home Equity Portfolio Credit Statistics First lien positions 45% Weighted average: Loan to value 68% FICO scores 727 90 days past due 0.22% 3/31/06 3/31/06 |
Our Approach
to Interest Rate Risk: Preserve and Optimize Long-Term Value Neutral Duration of Equity Positions Us Well in This Environment (3) (2) (1) 0 1 2 3 0.0% 1.0% 2.0% 3.0% 4.0% 5.0% 6.0% Duration of Equity Years 3 Month LIBOR 10 Year T Note At Quarter End 2004 2005 3/31/06 |

Key
Messages A diversified financial services company Maintaining a moderate risk profile that is key to improving consistency Executing strategies focused on continued growth and positive operating leverage PNC is
|
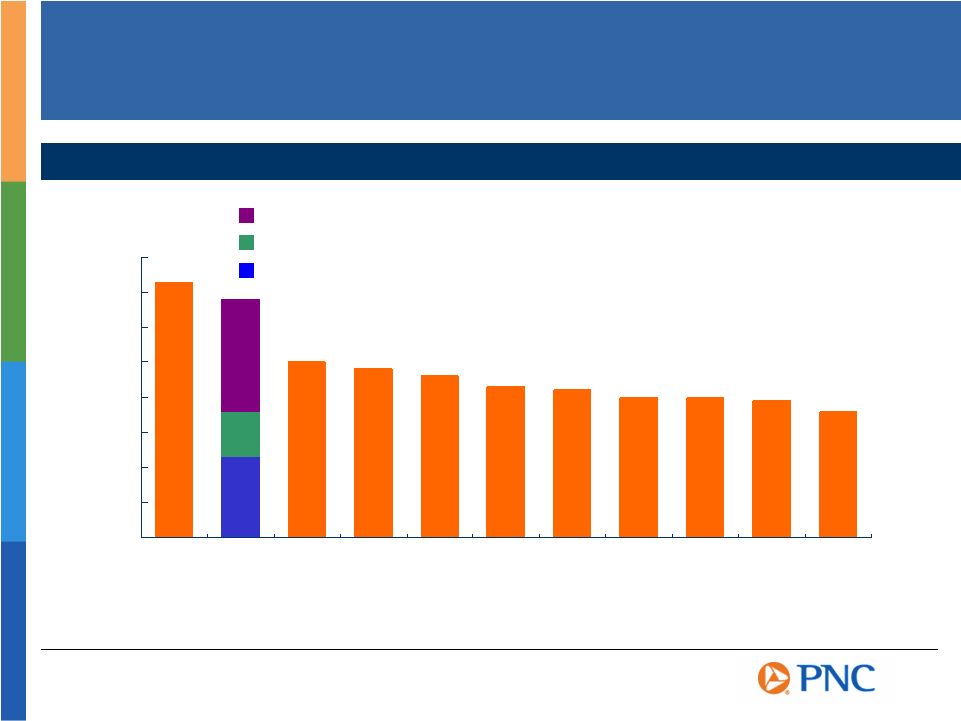
Fee-Based
Businesses Differentiate PNC Noninterest Income to Total Revenue Information for the quarter ended 3/31/06 PNC amounts calculated in the Appendix Source: SNL DataSource 0% 10% 20% 30% 40% 50% 60% 70% 80% BK PNC WB USB FITB WFC STI BBT KEY RF NCC Banking & Other BlackRock PFPC |
$500 $1,000 $1,500 $2,000 $2,500 $3,000 $3,500 $4,000 $4,500 2003 2004 2005 $0 $200 $400 $600 $800 $1,000 $1,200 $1,400 1Q05 1Q06 Fee Based Businesses Delivering Strong Noninterest Income Growth Consolidated Noninterest Income $ millions 13% CAGR 13% CAGR |

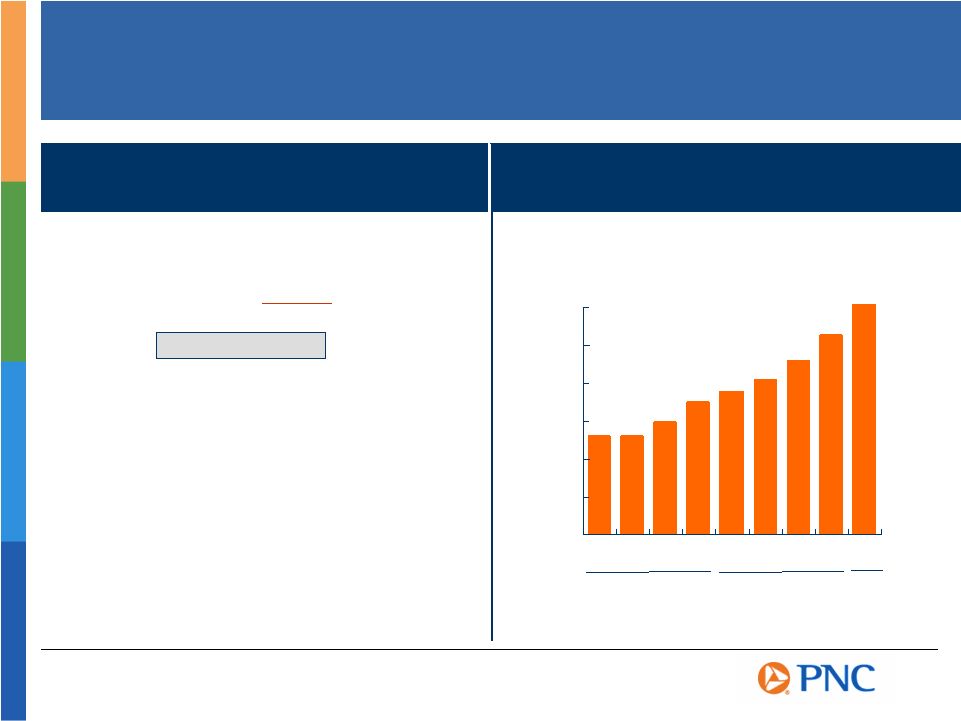
0.0 0.5 1.0 1.5 2.0 2003 2004 2005 3/31/06
Provides Opportunities for Deepening Relationships Average home equity loans ($ billions)
$13.8 +8% Consumer on-line banking users 50% +18% Consumer online bill-pay users 14% +92% Growth* * Growth is for 1Q06 vs. 1Q05 Retail Banking Checking Customer Base millions December 31 Small Business Consumer Increasing and Deepening Checking Relationships 3/31/06 |
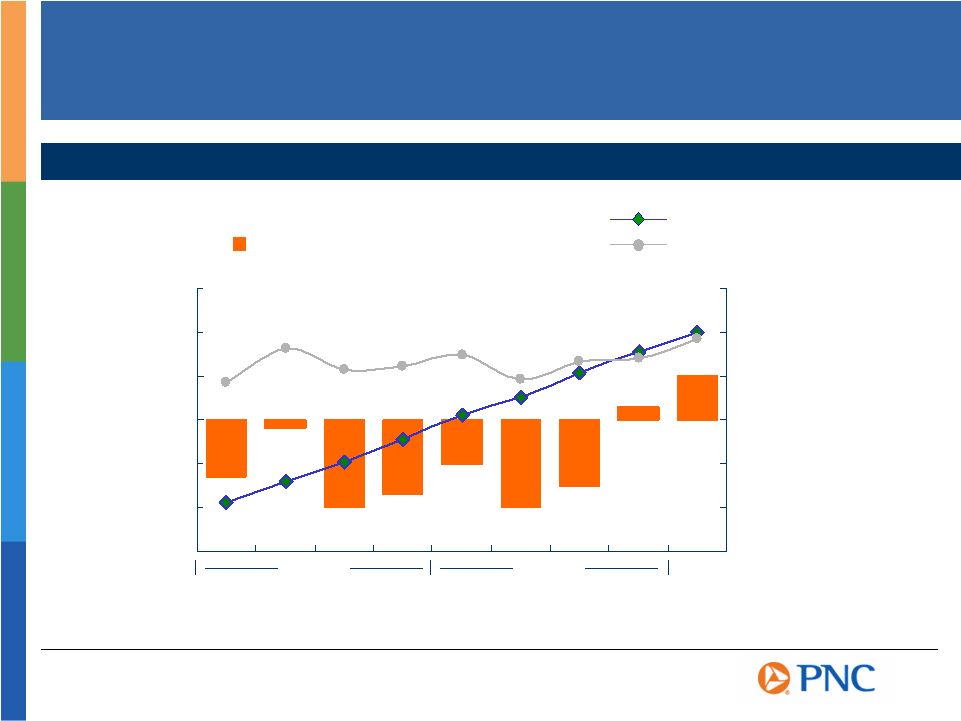
$5 $7 $9 $11 $13 $15 $17 1Q 2Q 3Q 4Q 1Q 2Q 3Q 4Q 1Q 2Q 3Q 4Q 1Q $5 $7 $9 $11 $13 $15 1Q 2Q 3Q 4Q 1Q 2Q 3Q 4Q 1Q 2Q 3Q 4Q 1Q 0.00% 1.00% 2.00% 3.00% 4.00% 5.00% Growing a Valuable Core Deposit Base Relationship Strategy Generating Deposit Growth $ billions Retail Banking Average Certificates of Deposit Retail Banking Average Demand Deposits $ billions Average Federal Funds Rate Average Certificates of Deposit 2003 2004 2005 2003 2004 2005 2006 2006 |

Growing
Deposits Faster Than Our Peers Deposit Increase Compared to Peers Total interest-bearing deposits 15% 9% Total noninterest-bearing deposits 12% 3% Total deposits 14% 7% Average Balances 1Q06 vs. 1Q05 PNC Peers Source: SNL DataSource Peers reflects median of super-regional banks as identified in the Appendix
excluding PNC |
WFC 21 % PNC 18 BK 18 RF 17 KEY 16 USB 16 STI 15 WB 15 FITB 14 NCC 13 BBT 13 0.00% 0.10% 0.20% 0.30% 0.40% 0.50% 0.60% 1Q 2Q 3Q 4Q 1Q 2Q 3Q 4Q 1Q Noninterest-Bearing Deposits Becoming More Valuable PNCs High Percentage of Noninterest-Bearing Funding Average Noninterest-Bearing Deposits to Average Earning Assets Rising Interest Rates Increase Value of PNCs Noninterest-Bearing Deposits 2004 2005 Impact of Noninterest-Bearing Sources on PNCs Net Interest Margin 1Q06 Source: SNL DataSource 2006 |
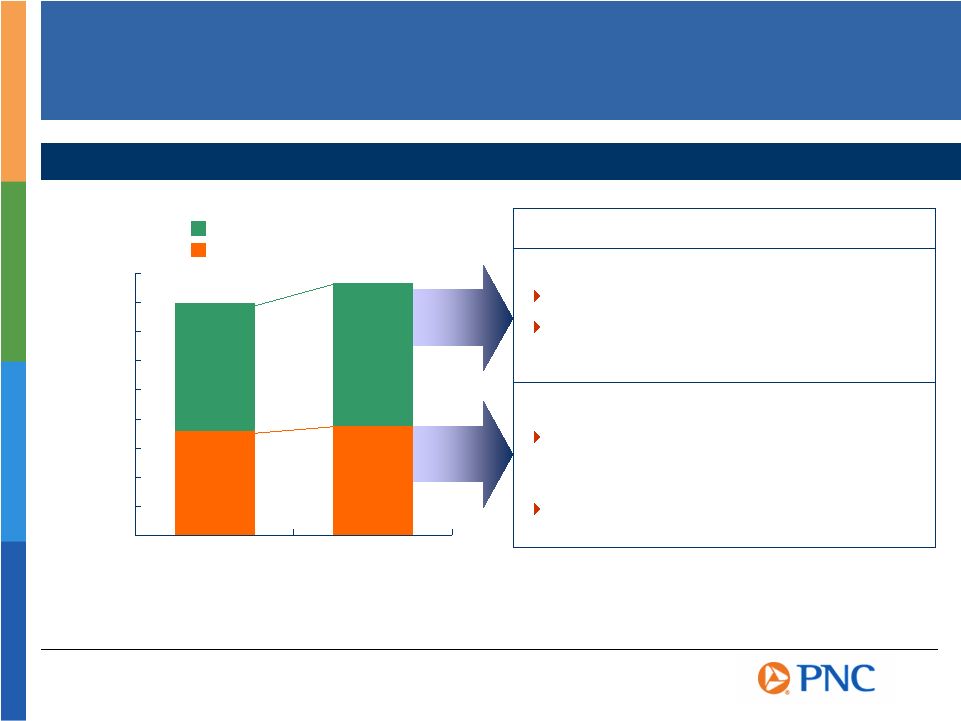
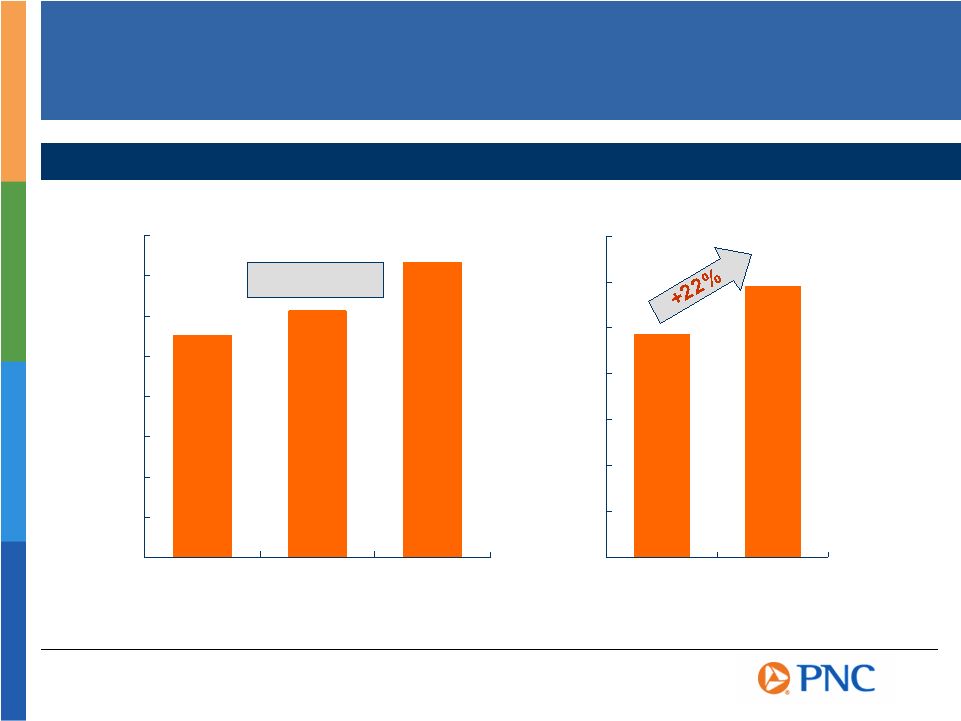
Average
Loans Outstanding Drivers of Growth Retail Banking Focus on home equity loan product Offering enhanced Business Banking product set to small business customers Corporate & Institutional Banking Leveraging national distribution in Commercial Real Estate and Asset Based Lending Delivering superior product set to middle market clients Improving Execution Driving Loan Growth $0 $5 $10 $15 $20 $25 $30 $35 $40 $45 1Q05 1Q06 +12% +5% Retail Banking $ billions Corporate & Institutional Banking |

BK 4.61 % 3.77 % +84bp RF 4.92 4.32 +60bp PNC 4.66 4.10 +56bp USB 5.00 4.48 +52bp WFC 6.06 5.60 +46bp STI 4.69 4.25 +44bp BT 4.39 4.08 +31bp WB 5.24 5.01 +23bp NCC 5.27 5.07 +20bp KEY 4.62 4.47 +15bp FITB 4.52 4.44 +8bp An Opportunity to Increase Securities Yields Yield on Securities Portfolio Source: SNL DataSource and company filings Change Retained Portfolio Flexibility As of March 31, 2006 Effective duration of 3.0 years Weighted-average life of 4.3 years 10% is floating rate 15% matures or re-prices in next twelve months Increasing Yields on Securities Portfolio 1Q06 1Q05 |
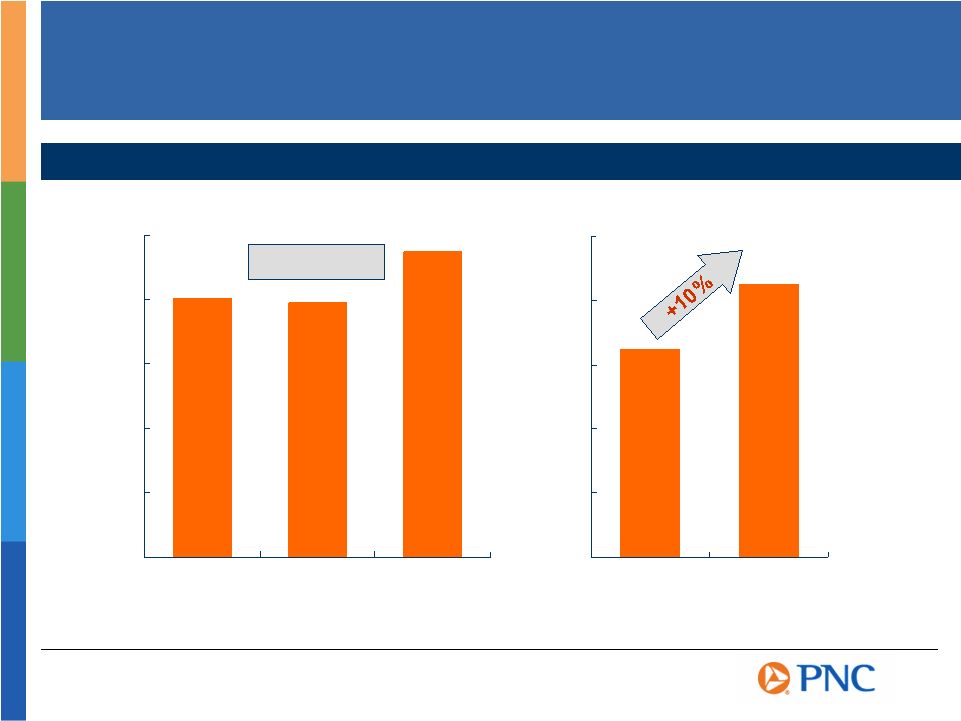
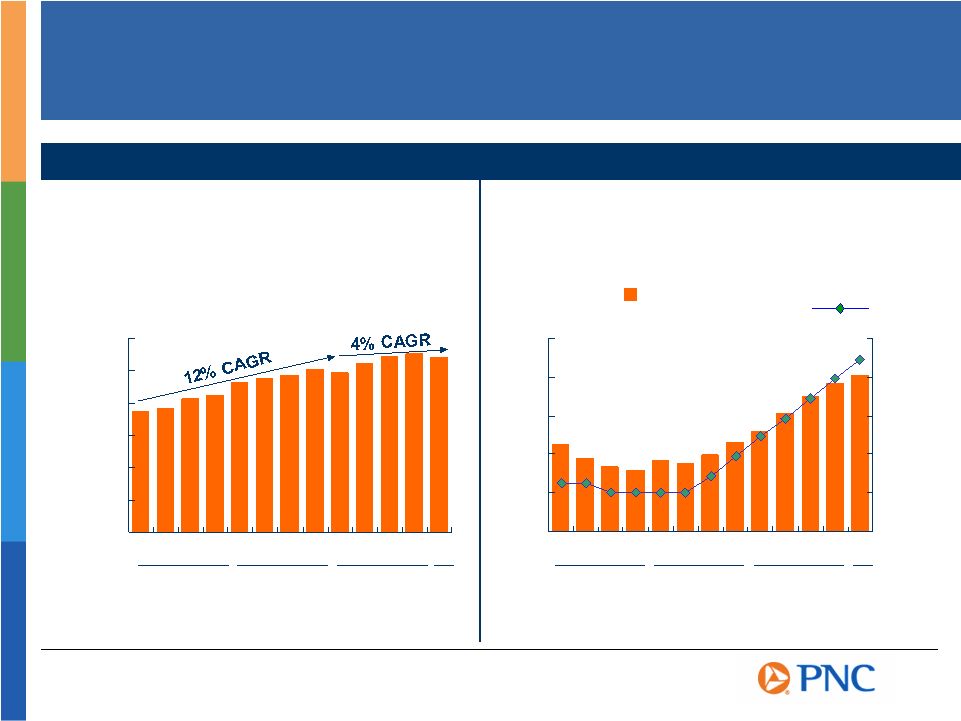
$1,000 $1,250 $1,500 $1,750 $2,000 $2,250 2003 2004 2005 Net Interest Income Improving Consolidated Net Interest Income (Taxable-Equivalent Basis)
Net interest
income on a taxable-equivalent basis is reconciled to GAAP net interest income in the Appendix $ millions $350 $400 $450 $500 $550 $600 1Q05 1Q06 4% CAGR 4% CAGR |
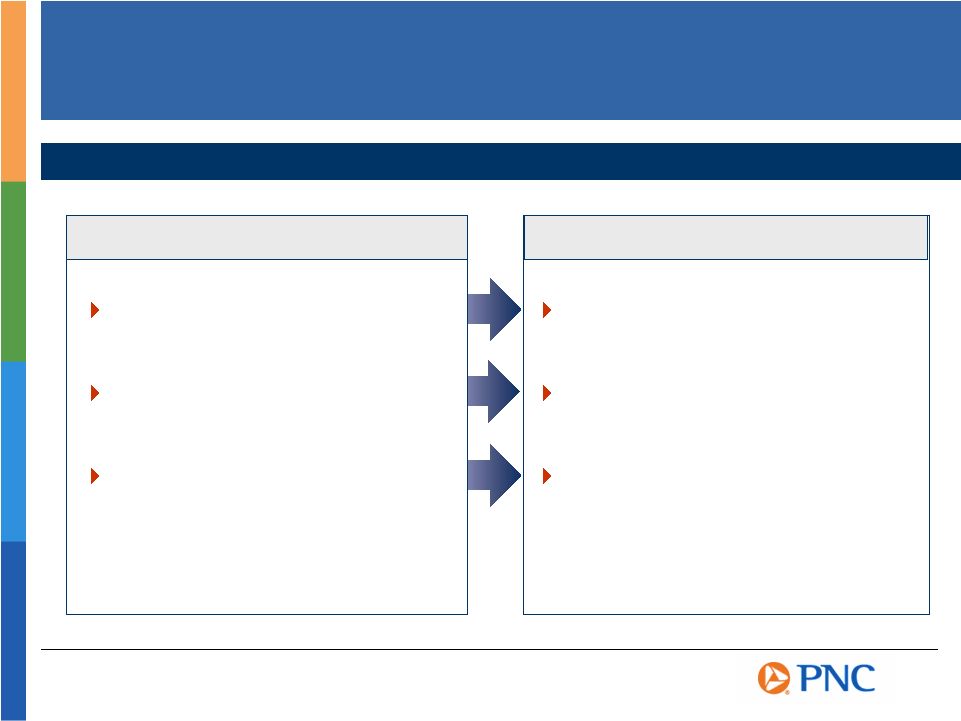
One PNC
Driving Improved Operating Leverage Building a Culture of Continuous Improvement Eliminate 3,000 positions Implement 2,400 ideas Achieve $400 million of total value 2,100 positions eliminated 91% of ideas are complete or in process Delivered $60 million in first quarter of 2006. On track to capture $400 million of value by 2007. Expected Outcomes Update As of 3/31/06 |
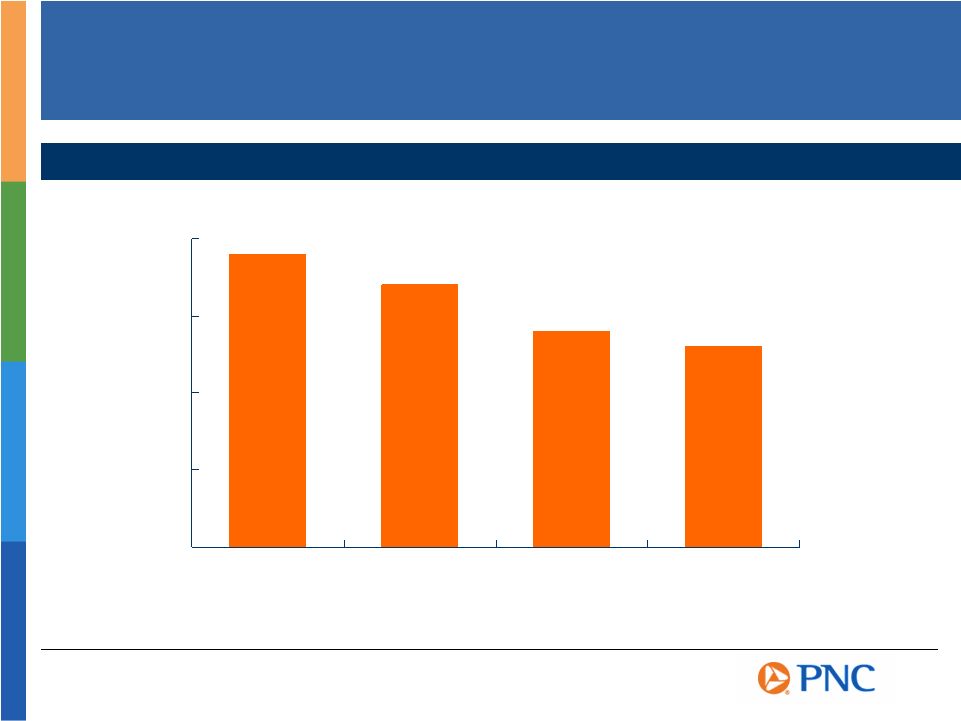
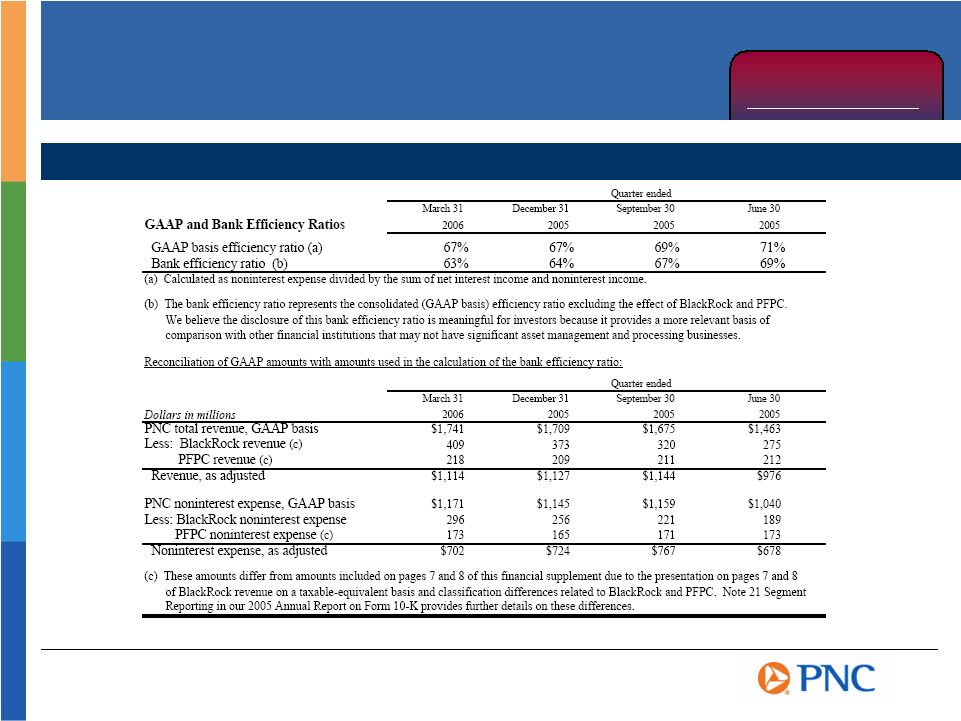
Impact of
Expense Management Becoming More Visible Bank Efficiency Ratio Improving 50% 55% 60% 65% 70% 6/30/05 9/30/05 12/31/05 3/31/06 Bank efficiency ratio represents the consolidated (GAAP basis) efficiency ratio
excluding the effect of BlackRock and PFPC and is reconciled to GAAP in the
Appendix. |

Improving
Capital Flexibility PNC (Pro forma)
7.3% FITB 6.9% KEY 6.7% NCC 6.6% WFC 6.2% BBT 6.1% USB 5.7% BK 5.6% STI 5.6% PNC 5.0% WB 4.9% As of December 31, 2005 Pro forma after giving effect to BlackRock/Merrill Lynch transaction and is reconciled to GAAP in Appendix Tangible Common Equity Ratio Invest in and grow our businesses Disciplined approach to acquisitions Return to shareholders Capital Management Priorities |

Summary
Built a differentiated company Comprehensive risk management culture to increase predictability Proven and executable growth strategies PNC has: |

|

We
make statements in this presentation, and we may from time to time make
other statements, regarding our outlook or expectations for earnings, revenues, expenses and/or other matters regarding or affecting PNC that are forward-looking
statements within the meaning of the Private Securities Litigation Reform Act. Forward-looking statements are typically identified by words such as
believe, expect, anticipate, intend, outlook, estimate, forecast, project and other similar words and expressions. Forward-looking statements are subject to numerous assumptions, risks and
uncertainties, which change over time. Forward-looking statements speak only as of the date they are made. We do not assume any duty and do not undertake to update
our forward-looking statements. Actual results or future events could differ, possibly materially, from those that we anticipated in our forward-looking
statements, and future results could differ materially from our historical performance. Our forward-looking statements are subject to the following principal risks and
uncertainties. We provide greater detail regarding these factors in our Form 10-K for the year ended December 31, 2005, including in the Risk Factors and Risk Management
sections, and in our Form 10-Q for the quarter ended March 31,
2006. Our forward-looking statements may also be subject to other risks
and uncertainties including those that we may discuss elsewhere in this presentation or in our filings with the SEC, accessible on the SECs website at www.sec.gov and on
or through our corporate website at www.pnc.com. Our business and operating results are affected by business and economic conditions
generally or specifically in the principal markets in which we do business. We are affected by changes in our customers financial performance, as well as changes in customer preferences and behavior,
including as a result of changing economic conditions The value of our assets and liabilities as well as our overall financial performance
are affected by changes in interest rates or in valuations in the debt and
equity markets. Actions by the Federal Reserve and other government agencies, including those that impact money supply and market interest rates, can affect our activities and financial results. Competition can have an impact on customer acquisition, growth and retention, as well
as on our credit spreads and product pricing, which can affect market
share, deposits and revenues. Our ability to implement our One PNC initiative, as well as other business initiatives
and strategies we may pursue, could affect our financial performance over
the next several years. Our ability to grow successfully through acquisitions is impacted by a number of risks
and uncertainties related both to the acquisition transactions themselves
and to the integration of the acquired businesses into PNC after closing. These uncertainties are present in transactions such as the pending acquisition by BlackRock of Merrill Lynchs investment management
business. Cautionary Statement Regarding Forward-Looking Information |

Legal and regulatory developments could have an impact on our ability to operate our
businesses or our financial condition or results of operations or our
competitive position or reputation. Reputational impacts, in turn, could affect matters such as business generation and retention, our ability to attract and retain management, liquidity and funding. These developments could
include: (a) the resolution of legal proceedings or regulatory and other governmental inquiries; (b) increased litigation risk from recent
regulatory and other governmental developments; (c) the results of the regulatory examination process, our failure to satisfy the requirements of agreements
with governmental agencies, and regulators future use of supervisory and enforcement tools; (d) legislative and regulatory reforms,
including changes to laws and regulations involving tax, pension, and the protection of confidential customer information; and (e) changes in accounting
policies and principles. Our business and operating results are affected by our ability to identify and
effectively manage risks inherent in our businesses, including, where appropriate, through the effective use of third-party insurance and capital
management techniques. Our ability to anticipate and respond to technological changes can have an impact on
our ability to respond to customer needs and to meet competitive
demands. The adequacy of our intellectual property protection, and the extent of any costs
associated with obtaining rights in intellectual property claimed by others, can impact our business and operating results. Our business and operating results can be affected by widespread natural disasters, terrorist activities or international hostilities, either as a
result of the impact on the economy and financial and capital markets
generally or on us or on our customers, suppliers or other counterparties specifically. Also, risks and uncertainties that could affect the results anticipated in
forward-looking statements or from historical performance relating to our majority-owned subsidiary BlackRock, Inc. are discussed in more detail in BlackRocks Annual
Report on 2005 Form 10-K, including in the Risk Factors section, and in BlackRocks other filings with the SEC, accessible on the SECs website and on
or through BlackRocks website at www.blackrock.com Any annualized,
proforma, estimated, third party or consensus numbers in this presentation are used for illustrative or comparative purposes only and may not reflect actual results. Any consensus earnings estimates are calculated based on
the earnings projections made by analysts who cover that company. The analysts opinions, estimates or forecasts (and therefore the consensus earnings estimates) are
theirs alone, are not those of PNC or its management, and may not reflect PNCs actual or anticipated results. Cautionary Statement Regarding Forward-Looking Information (continued)
|

Appendix |

Non-GAAP
to GAAP Reconcilement Business segments Retail Banking $190 26% Corporate & Institutional Banking 105 22% BlackRock 71 30% PFPC 27 28% Total business segments 393 Minority interest in income of BlackRock (22) Other (17) Total consolidated $354 17% $ millions Earnings Return on Avg Capital * * Percentages for BlackRock and PFPC reflect return on average equity Appendix Business Earnings and Return on Capital Quarter Ended 3/31/06 |

Net income, GAAP basis $1,325 $1,197 $1,001 15% Expenses related to DOJ agreement (1)
87 One-time tax benefit (2)
(45) Net income, adjusted $1,280 $1,197 $1,088 8% Net income, GAAP basis $354 $354 0% One-time tax benefit (2)
(45) Net income, adjusted $354 $309 15% $ millions CAGR 2005 2005 vs. 2003 2004 2003 Non-GAAP to GAAP Reconcilement Appendix 1Q06 1Q05 % Change 1Q06 vs. 1Q05 Consolidated Net Income Net income (GAAP basis) for 2003 included expenses totaling $87 million after taxes in
connection with the agreement with the United States Department of Justice, including related legal and consulting costs, which is excluded from adjusted net income as it is not related to and does not result from business operations for the relevant
period (1) (2) Net income (GAAP basis) for 2005 and 1Q05 included the benefit of the reversal of$45 million in deferred tax liabilities related to the transfer of PNCs ownership of BlackRock from PNC Bank, N.A. to its intermediate bank holding company, which is excluded
from adjusted net income as it is not related to and does not result from business
operations for the relevant period |

Non-GAAP
to GAAP Reconcilement BlackRock (1) $396 23% PFPC (1) 227 13% Banking businesses 510 29% Other 52 3% Total consolidated $1,185 $1,741 68% Noninterest Income $ millions Consolidated Total Revenue Noninterest Income to Consolidated Total Revenue* Quarter Ended 3/31/06 32% Sum of net interest income and noninterest income Noninterest income for BlackRock and PFPC reflects operating revenue * (1) Appendix Noninterest Income to Total Revenue* |

Net interest income, GAAP basis $2,154 $1,969 $1,996 4% Taxable-equivalent adjustment 33 20 10 82% Net interest income, taxable-equivalent basis $2,187 $1,989 $2,006 4% Net interest income, GAAP basis $556 $506 10% Taxable-equivalent adjustment 7 6 17% Net interest income, taxable-equivalent basis $563 $512 10% $ millions CAGR 2005 2005 vs. 2003 2004 2003 Non-GAAP to GAAP Reconcilement Appendix 1Q06 1Q05 % Change 1Q06 vs. 1Q05 Net Interest Income |
Non-GAAP
to GAAP Reconcilement Appendix Source: Page 10 of The PNC Financial Services Group, Inc. first quarter 2006 Earnings
Release Financial Supplement Efficiency Ratios |

Non-GAAP
to GAAP Reconcilement Appendix Tangible Common Equity Ratio Common shareholders equity $8.5 $1.6(a) $10.1 Goodwill & other intangible assets 4.1 ($0.5) 3.6 Tangible common equity $4.4 $6.5 Total assets $92.0 ($1.2) $2.5(b) $93.3 Goodwill & other intangible assets 4.1 (0.5) 3.6 Tangible assets $87.9 $89.7 Tangible common equity ratio 5.0% 7.3% $ billions PNC Consolidated 12/31/05 BlackRock Deconsolidating Adjustments (a) Increase equals the expected after-tax gain to be recorded on this transaction,
subject to adjustments, at closing (b) PNCs Investment equals its expected ownership percentage of BlackRocks pro forma book equity PNC Pro forma 12/31/05 Transaction Adjustments |

BB&T Corporation BBT The Bank of New York Company, Inc. BK Fifth Third Bancorp FITB KeyCorp KEY National City Corporation NCC The PNC Financial Services Group, Inc. PNC Regions Financial RF SunTrust Banks, Inc. STI U.S. Bancorp USB Wachovia Corporation WB Wells Fargo & Company WFC Ticker Peer Group of Super-Regional Banks Appendix |