SLIDE PRESENTATION AND RELATED MATERIAL
Published on November 3, 2005
The PNC Financial Services Group, Inc. BancAnalysts Association of Boston Conference Boston, MA November 3, 2005 The PNC Financial Services Group, Inc. BancAnalysts Association of Boston Conference Boston, MA November 3, 2005 EXHIBIT 99.1 |

Cautionary Statement Regarding Forward-Looking Information Cautionary Statement Regarding Forward-Looking Information This presentation contains forward-looking statements regarding our outlook or
expectations relating to PNCs future business, operations, financial condition, financial performance and asset quality. Forward-looking statements are necessarily subject to numerous assumptions, risks and uncertainties. The forward-looking statements in this presentation are qualified by the factors affecting forward-looking statements identified in the more detailed Cautionary Statement included in the Appendix, as well as those factors previously disclosed in our 2004 annual
report on Form 10-K, our second quarter 2005 report on Form 10-Q, and other SEC reports (accessible on the SECs website at www.sec.gov
and on or through our corporate website at www.pnc.com). Future events or circumstances may change our outlook or expectations and may also
affect the nature of the assumptions, risks and uncertainties to which our forward-looking statements are subject. The forward-looking statements in this presentation speak only as of the date of this presentation. We do not assume any duty and do not
undertake to update those statements. This presentation may also include a discussion of non-GAAP financial measures, which, to the extent not so qualified therein or in the Appendix, is qualified by GAAP
reconciliation information available on our corporate website at www.pnc.com under For Investors. |
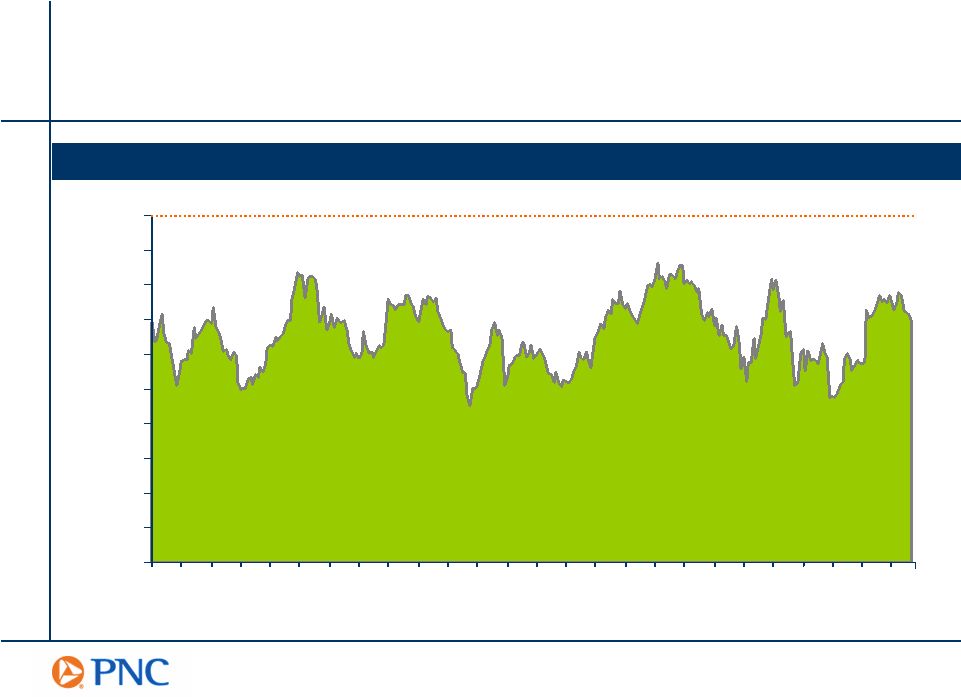
Banks Have Historically Traded at a Discount Banks Have Historically Traded at a Discount 0% 10% 20% 30% 40% 50% 60% 70% 80% 90% 100% S&P 500 P/E S&P 500 P/E P/E of Banks > $10 Billion Market Capitalization P/E of Banks > $10 Billion Market Capitalization 80 80
80 81 81
81 82 82
82 83 83
83 84 84
84 85 85
85 86 86
86 87 87
87 88 88
88 89 89
89 90 90
90 91 91
91 92 92
92 93 93
93 94 94
94 95 95
95 96 96
96 97 97
97 98 98
98 99 99
99 00 00
00 01 01
01 02 02
02 03 03
03 04 04
04 05 05
05 P/E of Large Cap Banks Relative to the S&P 500 Source: Lehman Brothers and FactSet |
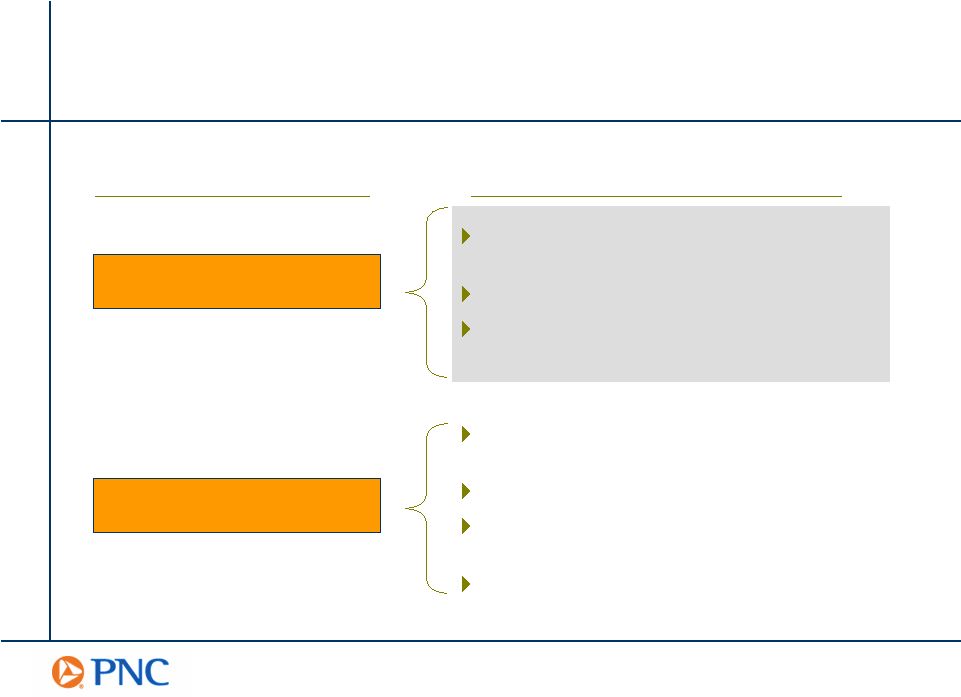
Invest and grow fee-based businesses Improve asset yields Grow valuable core deposit franchise Improve operating leverage The Challenge of Balancing Returns and Growth The Challenge of Balancing Returns and Growth Growth Banking Industry Valuation Issues PNCs Strategy Leverage industry-leading risk management culture Maintain credit risk discipline Optimize long-term value of the balance sheet Predictability |

Strong Risk Culture is Essential to Minimizing Surprises Strong Risk Culture is Essential to Minimizing Surprises Strengthened personnel and systems Improved diversification Increased loan granularity Enhanced disclosure Remained disciplined Strategic Actions Weve Taken to Enhance our Risk Culture |
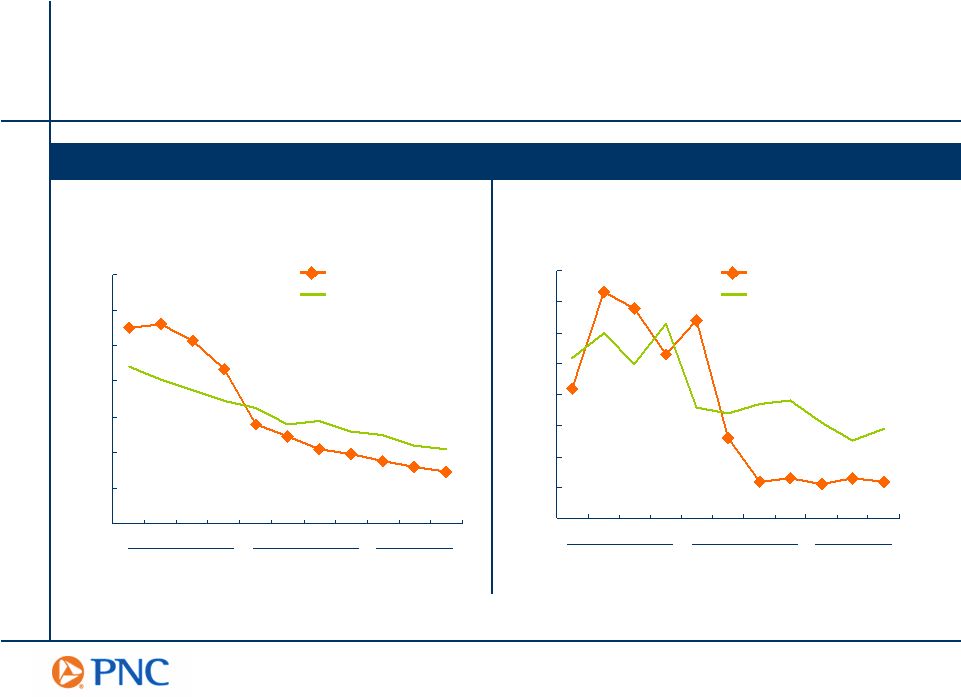
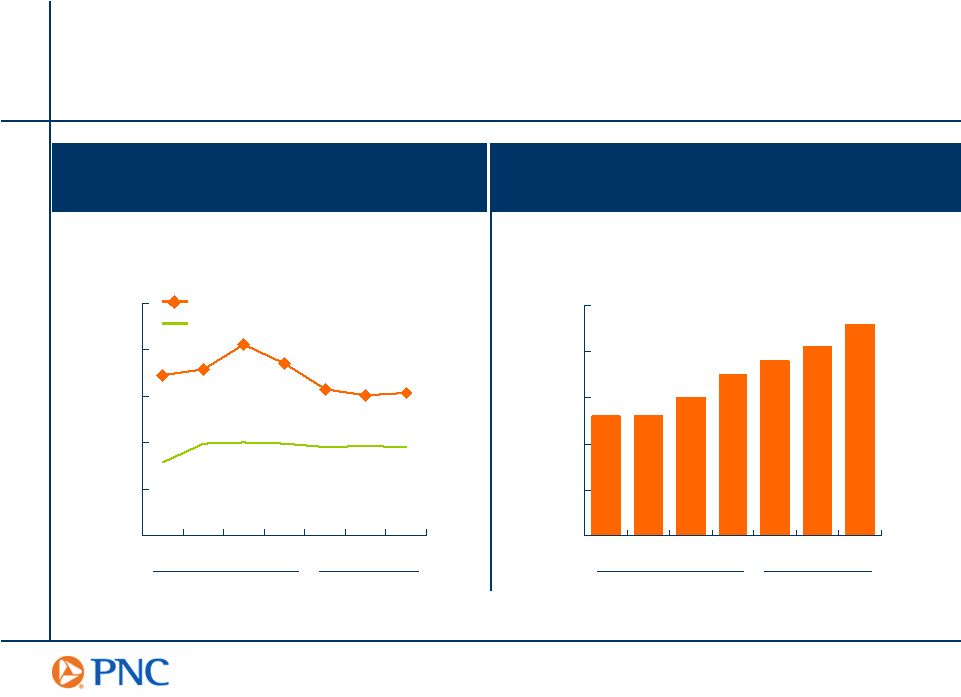
0.0% 0.1% 0.2% 0.3% 0.4% 0.5% 0.6% 0.7% 0.8% 1Q 2Q 3Q 4Q 1Q 2Q 3Q 4Q 1Q 2Q 3Q Disciplined Approach Leads to Strong Asset Quality Disciplined Approach Leads to Strong Asset Quality Asset Quality Compared to Peers Net Charge-offs to Average Loans PNC Peer Group Source: SNL DataSource PNC 2Q05 net charge-off ratio excludes $53 million loan recovery. The ratio
was (0.32%) including the recovery. Peer group reflects median of super-regional banks as defined in Appendix excluding PNC 2003 2004 2005 Nonperforming Assets to Loans, Loans Held for Sale and Foreclosed Assets PNC Peer Group 0.0% 0.2% 0.4% 0.6% 0.8% 1.0% 1.2% 1.4% 1Q 2Q 3Q 4Q 1Q 2Q 3Q 4Q 1Q 2Q 3Q 2003 2004 2005 |
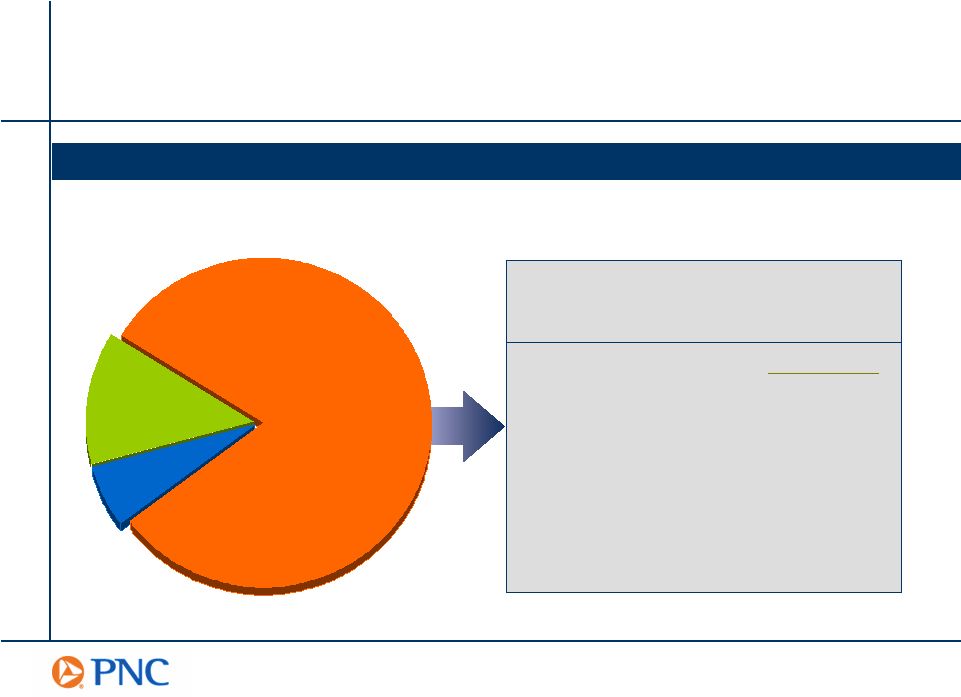
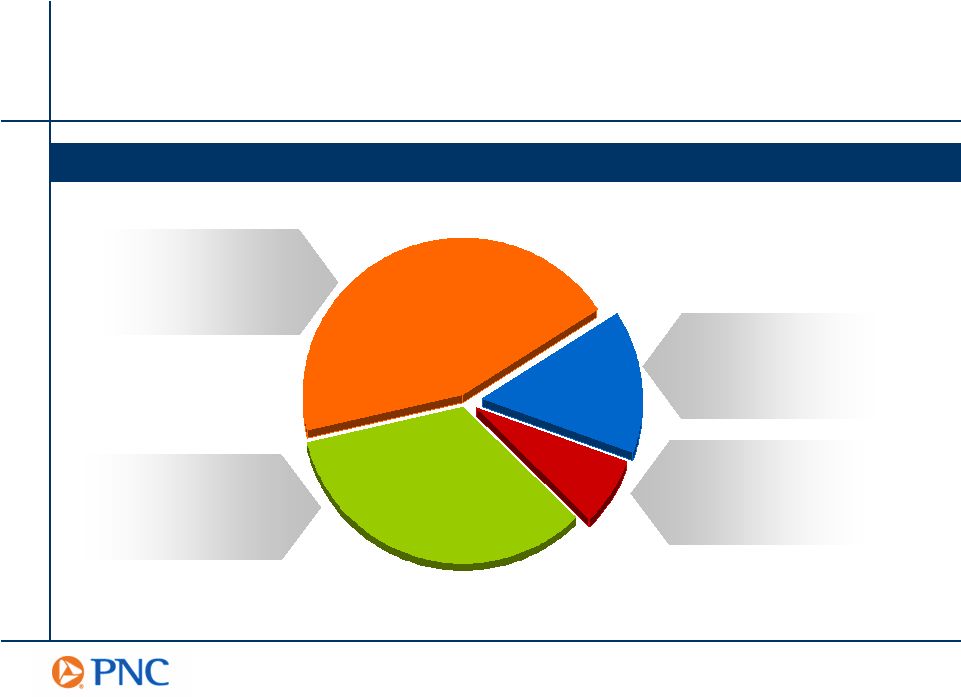
High Quality Consumer Loan Portfolio High Quality Consumer Loan Portfolio Home Equity Loans Auto Loans Other Consumer Loans Composition of Consumer Loan Portfolio Average Consumer Loans For the Three Months Ended 9/30/05 Home Equity Portfolio Credit Statistics First lien positions 47% Weighted average: Loan to value 70% FICO scores 721 90 days past due 0.18% 9/30/05 9/30/05 Information as of the three months ended 9/30/05 |
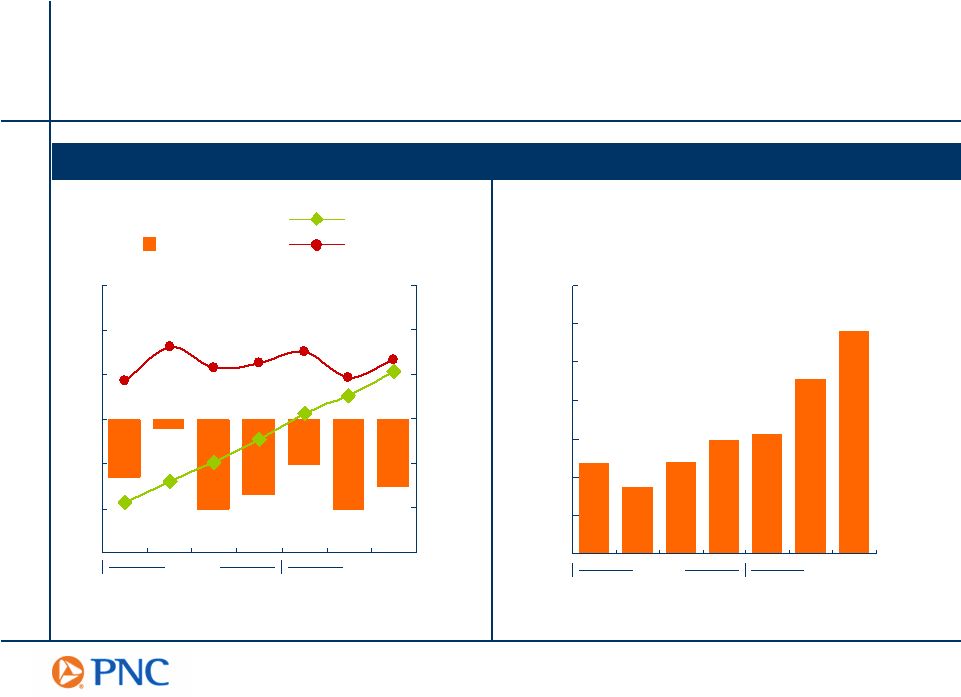
Our Approach to Interest Rate Risk: Preserve and Optimize Long-Term Value Our Approach to Interest Rate Risk: Preserve and Optimize Long-Term Value Negative Duration of Equity Positions Us Well in a Rising Rate Environment $450 $470 $490 $510 $530 $550 $570 $590 Net interest income on a taxable-equivalent basis is reconciled to GAAP net interest income in Appendix $ millions 2004 2005 Consolidated Net Interest Income Taxable-Equivalent Basis (3) (2) (1) 0 1 2 3 0.0% 1.0% 2.0% 3.0% 4.0% 5.0% 6.0% 2004 2005 Duration of Equity Years 3 Month LIBOR 10 Year T Note At Quarter End |
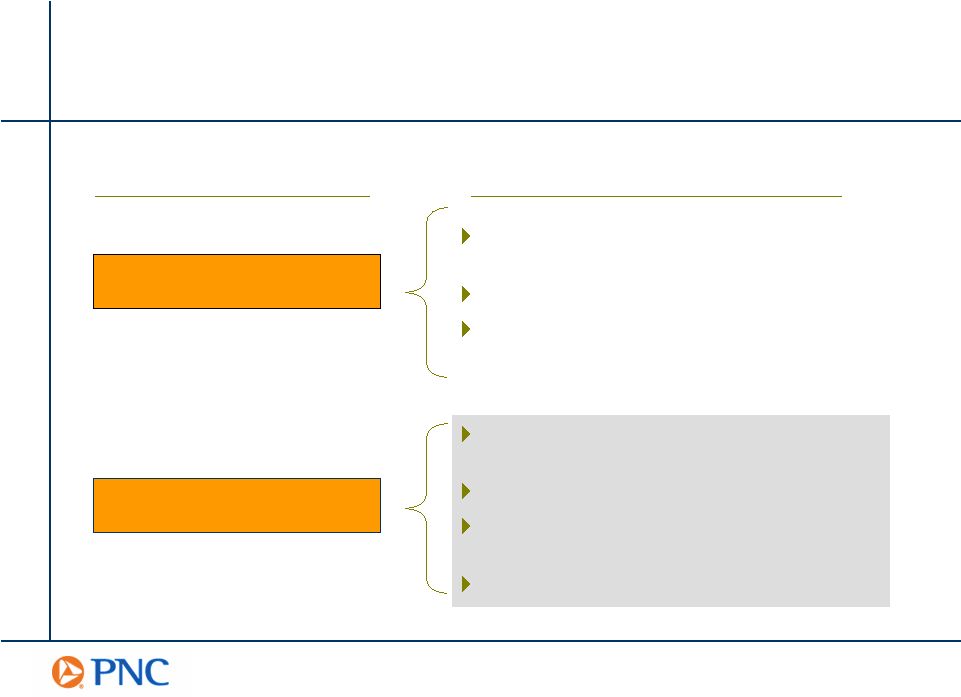
Invest and grow fee-based businesses Improve asset yields Grow valuable core deposit franchise Improve operating leverage The Challenge of Balancing Returns and Growth The Challenge of Balancing Returns and Growth Growth Banking Industry Valuation Issues PNCs Strategy Leverage industry-leading risk management culture Maintain credit risk discipline Optimize long-term value of the balance sheet Predictability |
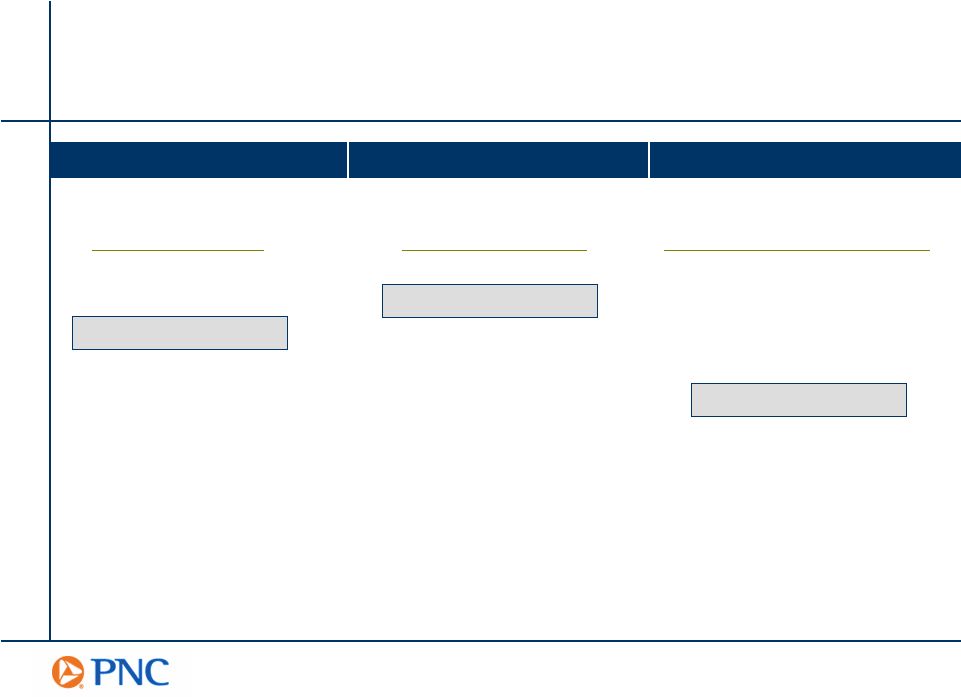
A Differentiated Franchise A Differentiated Franchise A Core Funded Bank
Thats Fee Driven
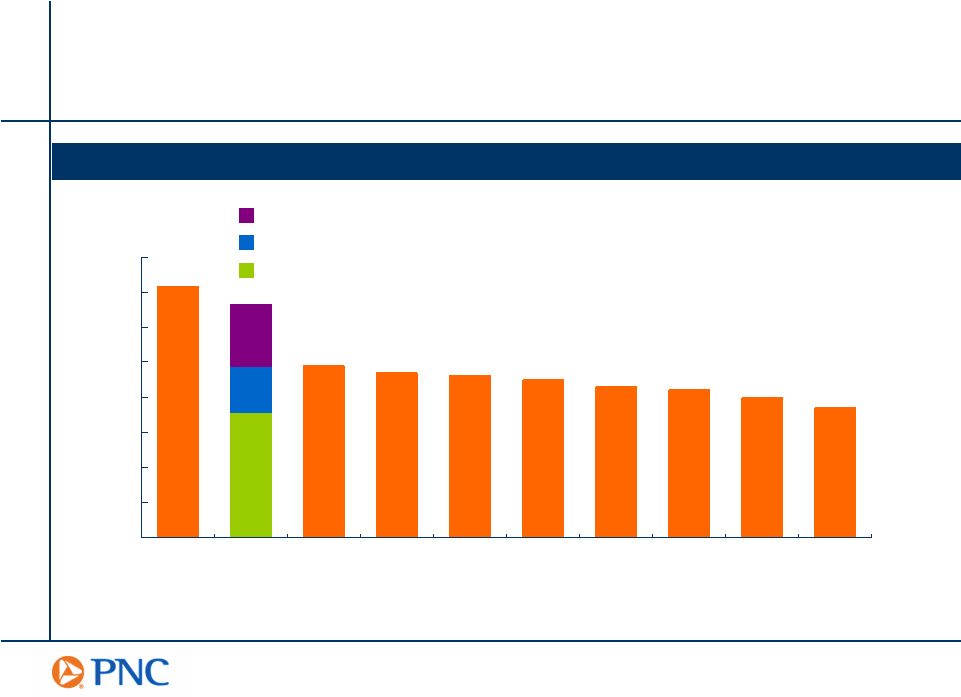
Generating Solid Returns BK 69% WB 75% PNC 84% STI 99% BBT 101% WFC 102% FITB 105% KEY 113% USB 113% NCC 130% BK 72% PNC 67% WB 49% USB 47% FITB 46% WFC 45% KEY 43% STI 42% BBT 40% NCC 37% USB 23.0% WFC 19.9% FITB 16.7% BK 16.3% PNC 16.1% BBT 15.8% KEY 15.0% NCC 14.7% WB 14.1% STI 12.1% Noninterest Income To Total Revenue Loans to Deposits Return on Average Common Shareholders Equity Information as of or for the three months ended 9/30/05 Source: SNL DataSource, PNC as reported |
Fee-Based Businesses Differentiate PNC Fee-Based Businesses Differentiate PNC Noninterest Income to Total Revenue 0% 10% 20% 30% 40% 50% 60% 70% 80% BK PNC WB USB FITB WFC KEY STI BBT NCC Information for the three months ended 9/30/05; PNC amounts calculated in the
Appendix Source: SNL DataSource Banking & Other BlackRock PFPC |
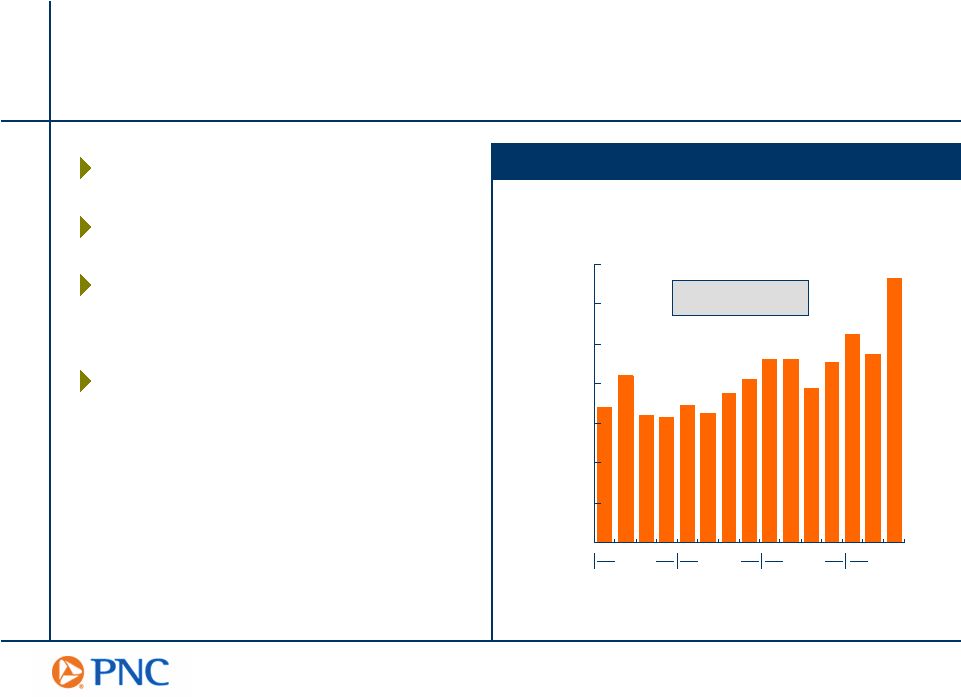
10%
CAGR 10% CAGR Strategies for Growing Fee-Based Businesses Strategies for Growing Fee-Based Businesses Geographic expansion Diversify product set Deepen product penetration Leverage technology Strong Noninterest Income Growth $450 $550 $650 $750 $850 $950 $1,050 $1,150 $ millions Consolidated Noninterest Income 2002 2003 2004 2005 |
0% 5% 10% 15% 20% 25% 30% 35% 40% Opportunities to Improve Asset Yields Opportunities to Improve Asset Yields Composition of Earning Assets for Third Quarter 2005 Source: Company reports Peer average reflects average of super-regional banks as defined in Appendix excluding PNC; BK and FITB also excluded due to unavailability of information Major Asset Classes as Percentage of Total Earning Assets Peer Average PNC Securities 4.29% 4.93% Loans: Commercial 6.11% 6.07% Commercial real estate 6.28% 6.36% Consumer and residential
mortgage 5.56% 6.55% PNC Peer Average Average Yields Securities Commercial Commercial Real Estate Consumer and Residential Mortgage |
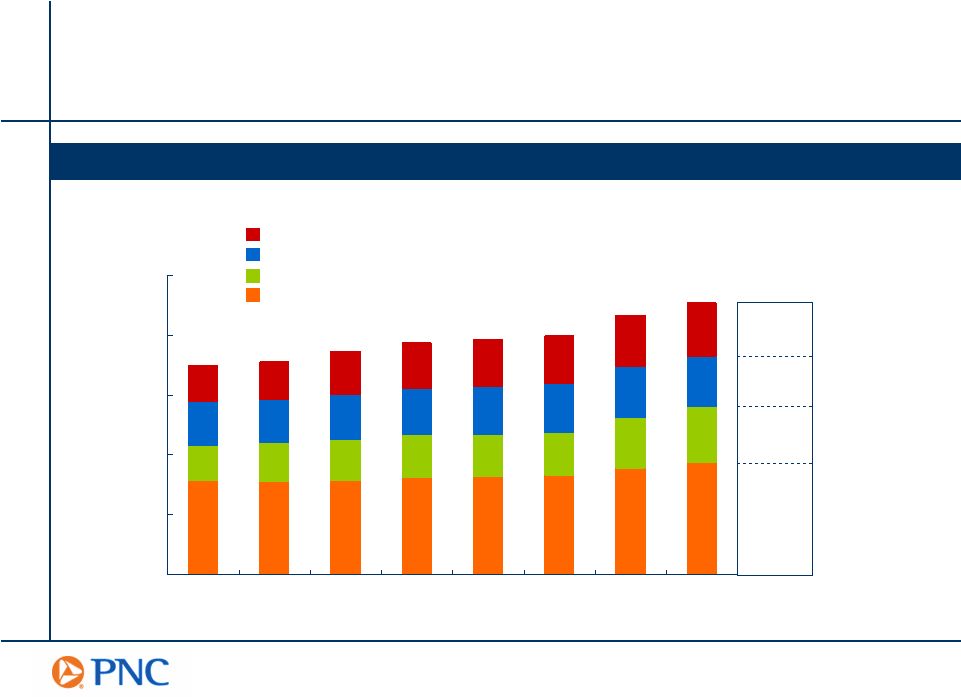
$0 $5 $10 $15 $20 $25 4Q03 1Q04 2Q04 3Q04 4Q04 1Q05 2Q05 3Q05 * Includes lease financing and excludes Market Street Funding Corporation: see Appendix
for GAAP reconciliation PNC Average Institutional and Business Banking Loans
$ billions Commercial Real Estate and Real Estate Related Corporate Banking * CAGR Since 4Q03 Business Banking 9% 30% 10% 26% Asset Based Lending Loan Growth Driven by Higher Risk-Adjusted Products Loan Growth Driven by Higher Risk-Adjusted Products |

An Opportunity to Increase Securities Yields An Opportunity to Increase Securities Yields Yield on Securities Portfolio BK 4.27 % 3.52 % +75bp PNC 4.29 3.67 +62bp STI 4.40 3.82 +58bp USB 4.73 4.28 +45bp WB 5.07 4.75 +32bp WFC 5.79 5.60 +19bp BBT 4.18 4.02 +16bp FITB 4.32 4.18 +14bp NCC 5.10 5.12 -2bp KEY 4.67 4.92 -25bp Source: SNL DataSource and company filings Information as of 9/30/05 3Q05 3Q04 Change Retained Portfolio Flexibility As of September 30, 2005 Effective duration of 2.5 years Weighted-average life of 3.9 years 12% is floating rate 24% matures or re-prices in next twelve months Increasing Yields on Securities Portfolio |

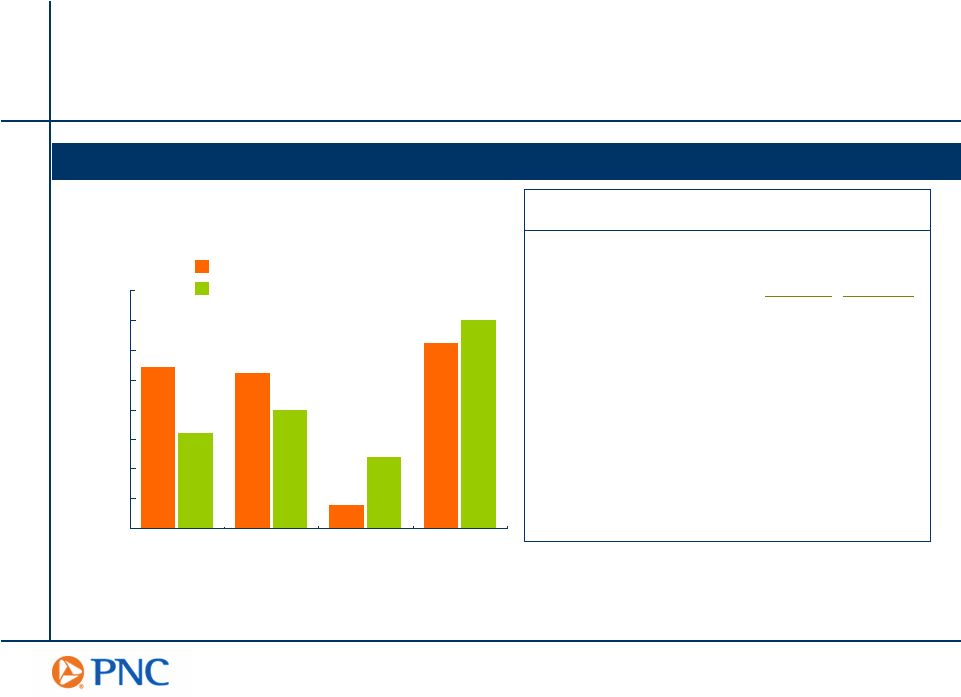
Growing a Valuable Core Deposit Base Growing a Valuable Core Deposit Base Focus on growing consumer and small business checking relationships Expand distribution into faster growing regions Increase client penetration with industry-leading treasury management products Grow Midland Loan Servicing escrow deposits Deposit Increase Compared to Peers Strategies to Drive Growth Total interest-bearing deposits 17% 11% Total noninterest- bearing deposits 10% 10% Total deposits 16% 10% Average Balances YTD 9/30/05 vs YTD 9/30/04 PNC Peer Median Source: SNL DataSource Peer median of super-regional banks as defined in the Appendix excluding PNC Consumer Banking Institutional Banking |
12% 14% 16% 18% 20% 22% 1Q 2Q 3Q 4Q 1Q 2Q 3Q 0.00% 0.10% 0.20% 0.30% 0.40% 0.50% 1Q 2Q 3Q 4Q 1Q 2Q 3Q Noninterest-Bearing Deposits Becoming More Valuable Noninterest-Bearing Deposits Becoming More Valuable PNCs High % of Noninterest-Bearing Funding Noninterest-Bearing Deposits to Average Earning Assets Rising Interest Rates Increase Value of PNCs Noninterest-Bearing Deposits PNC Industry Industry source: SNL DataSource Industry reflects average of 468 publicly-traded banks as identified by SNL
2004 2005 2004 2005 Impact of Noninterest-Bearing Sources on PNCs Net Interest Margin |

One PNC Driving Improved Operating Leverage One PNC Driving Improved Operating Leverage Eliminate 3,000 positions Implement 2,400 ideas Achieve $400 million of total value 1,800 positions eliminated 77% of ideas are complete or in process On track to capture $400 million of value by 2007 Expected Outcomes Update As of 9/30/05 |
PNCs High Return Business Mix PNCs High Return Business Mix Business Earnings Contribution Nine Months Ended September 30, 2005 Consumer Banking Earnings $487 Return on capital 23% Institutional Banking Earnings $372 Return on capital 29% BlackRock Earnings $161 Return on average equity 25% PFPC Earnings $75 Return on average equity 34% $ millions Business earnings and return on capital reconciled to GAAP net income and returns in
Appendix |

Summary Summary Built a differentiated company Comprehensive risk management culture to increase predictability Proven and executable growth strategies PNC has: |
|

Appendix |

Cautionary Statement Regarding Forward-Looking Information Cautionary Statement Regarding Forward-Looking Information We make statements in this presentation, and we may from time to time make other statements, regarding our outlook or expectations
for earnings, revenues, expenses and/or other matters regarding or affecting
PNC that are forward-looking statements within the meaning of the Private Securities Litigation Reform Act.
Forward-looking statements are typically identified by words such
as believe, expect, anticipate, intend, outlook, estimate, forecast, project and other similar words and expressions. Forward-looking statements are subject to numerous assumptions, risks and uncertainties, which change
over time. Forward-looking statements speak only as of the date
they are made. We do not assume any duty and do not undertake to
update our forward- looking statements. Actual results or future events could differ, possibly materially, from those that we anticipated in our forward-looking statements, and future results could differ materially from our historical performance. In addition to factors that we have disclosed in our 2004 annual report on Form 10-K, our second quarter 2005 report on Form 10-Q, and in other reports that we file with the SEC (accessible on the SECs website at www.sec.gov and on or through PNCs corporate website at www.pnc.com), PNCs forward-looking statements are subject to, among others, the following risks and uncertainties, which could cause actual results or future events to differ materially
from those that we anticipated in our forward-looking statements or from our historical performance: changes in political, economic or industry conditions, the interest rate environment,
or the financial and capital markets (including as a result of actions of
the Federal Reserve Board affecting interest rates, the money supply, or
otherwise reflecting changes in monetary policy), which could affect: (a) credit quality and the extent of our credit losses; (b) the extent of funding of
our unfunded loan commitments and letters of credit; (c) our allowances for loan and lease losses and unfunded loan commitments and letters of credit; (d)
demand for our credit or fee-based products and services; (e) our net interest income; (f) the value of assets under management and assets serviced, of
private equity investments, of other debt and equity investments, of
loans held for sale, or of other on-balance sheet or off-balance sheet assets; or (g) the availability and terms of funding necessary to meet our
liquidity needs; the impact on us of legal and regulatory developments, including the following: (a) the resolution of legal proceedings or regulatory and other
governmental inquiries; (b) increased litigation risk from recent
regulatory and other governmental developments; (c) the results of the regulatory examination process, our failure to satisfy the requirements of agreements with
governmental agencies, and regulators future use of supervisory and
enforcement tools; (d) legislative and regulatory reforms, including
changes to tax and pension laws; and (e) changes in accounting policies and principles, with the impact of any such developments possibly affecting our ability to
operate our businesses or our financial condition or results of operations
or our reputation, which in turn could have an impact on such matters as
business generation and retention, our ability to attract and retain management, liquidity and funding; the impact on us of changes in the nature and extent of our competition; the introduction, withdrawal, success and timing of our business initiatives and strategies; |

Cautionary Statement Regarding Forward-Looking Information (continued)
Cautionary Statement Regarding Forward-Looking Information (continued)
customer acceptance of our products and services, and our customers borrowing, repayment, investment and deposit practices; the impact on us of changes in the extent of customer or counterparty delinquencies,
bankruptcies or defaults, which could affect, among other things, credit
and asset quality risk and our provision for credit losses;
the ability to identify and effectively manage risks inherent in our businesses; how we choose to redeploy available capital, including the extent and timing of any
share repurchases and acquisitions or other investments in our businesses;
the impact, extent and timing of technological changes, the adequacy of intellectual
property protection, and costs associated with obtaining rights in intellectual property claimed by others; the timing and pricing of any sales of loans or other financial assets held for sale;
our ability to obtain desirable levels of insurance and to successfully submit claims
under applicable insurance policies; the relative and absolute investment performance of assets under management; and the extent of terrorist activities and international hostilities, increases or
continuations of which may adversely affect the economy and financial and capital markets generally or us specifically. Our future results are likely to be affected significantly by the results of the
implementation of our One PNC initiative, as discussed in this presentation. Generally, the amounts of our anticipated cost savings and revenue enhancements are
based to some extent on estimates and assumptions regarding future business
performance and expenses, and these estimates and assumptions may prove to be inaccurate in some respects. Some or all of the above factors may cause the anticipated expense savings and revenue enhancements from that initiative
not to be achieved in their entirety, not to be accomplished within the
expected time frame, or to result in implementation charges beyond those currently contemplated or some other unanticipated adverse impact. Furthermore, the implementation of cost savings ideas may have unintended impacts on
our ability to attract and retain business and customers, while revenue
enhancement ideas may not be successful in the marketplace or may result in unintended costs. Assumed attrition required to achieve workforce reductions may not come in the right places or at the right times to meet planned goals. In addition, we grow our business from time to time by acquiring other financial services companies. Acquisitions in general present us with a
number of risks and uncertainties related both to the acquisition
transactions themselves and to the integration of the acquired businesses into PNC after closing. In particular, acquisitions may be substantially more expensive to complete (including the integration
of the acquired company) and the anticipated benefits, including
anticipated cost savings and strategic gains, may be significantly harder or take longer to achieve than expected. As a regulated financial institution, our |

Cautionary Statement Regarding Forward-Looking Information (continued)
Cautionary Statement Regarding Forward-Looking Information (continued)
pursuit of attractive acquisition opportunities could be negatively impacted due to regulatory delays or other regulatory issues. Regulatory and/or
legal issues of an acquired business may cause reputational harm to PNC following the acquisition and integration of the acquired business into
ours and may result in additional future costs and expenses arising as a
result of those issues. Recent acquisitions, including our acquisition of Riggs National Corporation, continue to present the integration and other post-closing risks and uncertainties described above. You can find additional information on the foregoing risks and uncertainties and
additional factors that could affect the results anticipated in our forward-looking statements or from our historical performance in the reports that we file with the
SEC. You can access our SEC reports on the SECs website at www.sec.gov and on or through our corporate website at www.pnc.com. Also, risks and uncertainties that could affect the results anticipated in forward-looking statements or from historical performance relating to our majority-owned
subsidiary BlackRock, Inc. are discussed in more detail in BlackRocks
filings with the SEC, accessible on the SEC s website and on or through
BlackRocks website at www.blackrock.com. Any annualized, proforma, estimated, third party or consensus numbers in this
presentation are used for illustrative or comparative purposes only and may not reflect actual results. Any consensus earnings estimates are calculated based on
the earnings projections made by analysts who cover that company. The analysts opinions, estimates or forecasts (and therefore the consensus earnings estimates) are
theirs alone, are not those of PNC or its management, and may not reflect PNCs actual or anticipated results. |

Non-GAAP to GAAP Reconcilement Non-GAAP to GAAP Reconcilement Net interest income, GAAP basis
$494 $481 $491 $503 Taxable-equivalent adjustment 3 4 7 6 Net interest income, taxable-equivalent basis $497 $485 $498 $509 $ millions 1Q04 3Q04 2Q04 4Q04 Net interest income, GAAP basis $506 $534 $559 Taxable-equivalent adjustment 6 7 7 Net interest income, taxable-equivalent basis $512 $541 $566 1Q05 3Q05 2Q05 Appendix Net Interest Income |

Non-GAAP to GAAP Reconcilement Non-GAAP to GAAP Reconcilement BlackRock $301 18.0% PFPC 217 13.0 Banking businesses 488 29.2 Other 107 6.4 Total consolidated $1,113 $1,672 66.6% Noninterest Income $ millions Consolidated Total Revenue Noninterest Income to Consolidated Total Revenue*
Three Months Ended 9/30/05 35.6% Appendix Sum of net interest income and noninterest income * Noninterest Income to Total Revenue* |
Non-GAAP to GAAP Reconcilement Non-GAAP to GAAP Reconcilement Business Banking $2,968 $3,179 $3,629 $3,825 $3,918 $4,052 $4,277 $4,443 26% Institutional Banking Asset based lending 3,658 3,608 3,788 3,838 3,976 4,050 4,303 4,227 9% Commercial real estate and real estate related 2,997 3,250 3,399 3,606 3,567 3,589 4,229 4,719 30% Corporate banking 10,233 9,875 9,669 9,776 10,139 10,417 10,940 11,436 7% Market Street Funding 2,385 2,107 1,812 1,677 1,952 2,111 2,039 2,099 (7%) Corporate banking excluding Market Street Funding 7,848 7,768 7,857 8,099 8,187 8,306 8,901 9,337 10% Total Institutional and Business Banking excluding Market Street Funding 17,471 17,805 18,673 19,368 19,648 19,997 21,710 22,726 16% $ millions 4Q03 2Q04 1Q04 3Q04 Appendix PNC Average Institutional and Business Banking Loans 4Q04 2Q05 1Q05 3Q05 CAGR Since 4Q03 |

Non-GAAP to GAAP Reconcilement Non-GAAP to GAAP Reconcilement Consumer Banking $487 $443 23% Institutional Banking 372 335 29% BlackRock 161 93 25% PFPC 75 50 34% Total business segments 1,095 921 26% Minority interest in (income) of BlackRock (49) (27) Other (76) (4) Total consolidated $970 $890 16% 2005 2004 $ millions For the nine months ended September 30 Earnings Return on Capital * 2005 Percentages for BlackRock and PFPC reflect return on average equity * Appendix Business Earnings and Return on Capital |

Peer Group Peer Group BB&T Corporation BBT The Bank of New York Company, Inc. BK Fifth Third Bancorp FITB KeyCorp KEY National City Corporation NCC The PNC Financial Services Group, Inc. PNC SunTrust Banks, Inc. STI U.S. Bancorp USB Wachovia Corporation WB Wells Fargo & Company WFC Appendix Ticker Super-Regional Banks |