SLIDE PRESENTATION AND RELATED MATERIAL
Published on September 13, 2005
Exhibit 99.1
The PNC Financial Services Group, Inc.
Lehman Brothers
2005 Financial Services Conference
New York, NY September 13, 2005
Cautionary Statement Regarding Forward-Looking Information
This presentation contains forward-looking statements regarding our outlook or expectations relating to PNCs future business, operations, financial condition, financial performance and asset quality. Forward-looking statements are necessarily subject to numerous assumptions, risks and uncertainties.
The forward-looking statements in this presentation are qualified by the factors affecting forward-looking statements identified in the more detailed Cautionary Statement included in the Appendix, as well as those factors previously disclosed in our 2004 annual report on Form 10-K, our second quarter 2005 report on Form 10-Q, and other SEC reports (accessible on the SECs website at www.sec.gov and on or through our corporate website at www.pnc.com).
Future events or circumstances may change our outlook or expectations and may also affect the nature of the assumptions, risks and uncertainties to which our forward-looking statements are subject. The forward-looking statements in this presentation speak only as of the date of this presentation. We do not assume any duty and do not undertake to update those statements.
This presentation may also include a discussion of non-GAAP financial measures, which, to the extent not so qualified therein or in the Appendix, is qualified by GAAP reconciliation information available on our corporate website at www.pnc.com under For Investors.
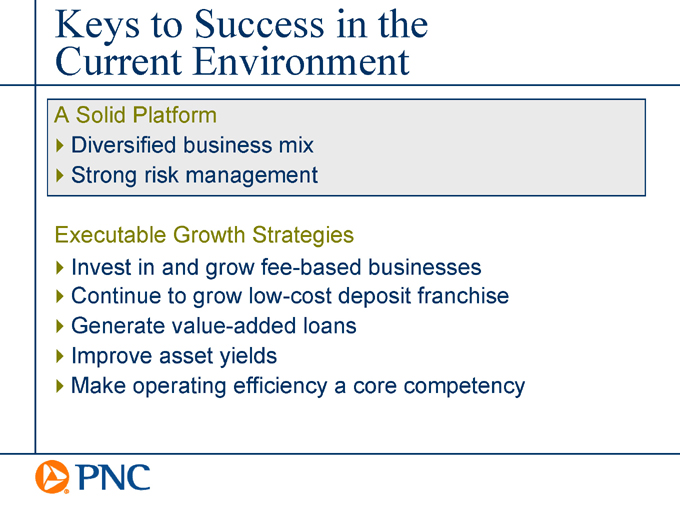
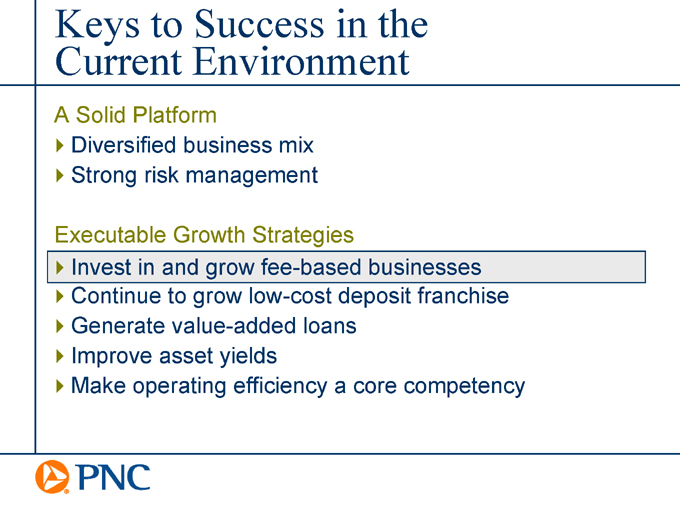
Keys to Success in the Current Environment
A Solid Platform
Diversified business mix Strong risk management
Executable Growth Strategies
Invest in and grow fee-based businesses Continue to grow low-cost deposit franchise Generate value-added loans Improve asset yields Make operating efficiency a core competency
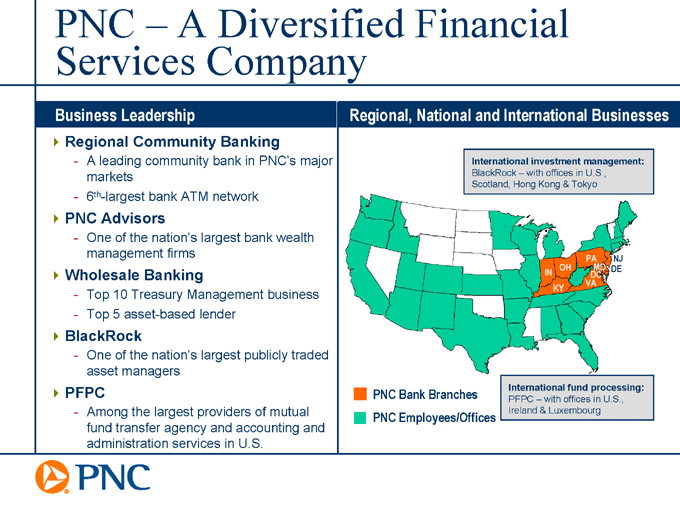
PNC A Diversified Financial Services Company
Business Leadership
Regional Community Banking
A leading community bank in PNCs major markets 6th-largest bank ATM network
PNC Advisors
One of the nations largest bank wealth management firms
Wholesale Banking
Top 10 Treasury Management business Top 5 asset-based lender
BlackRock
One of the nations largest publicly traded asset managers
PFPC
Among the largest providers of mutual fund transfer agency and accounting and administration services in U.S.
Regional, National and International Businesses
International investment management:
BlackRock with offices in U.S., Scotland, Hong Kong & Tokyo
PA NJ
MD DE IN OH
VA DC KY
PNC Bank Branches
PNC Employees/Offices
International fund processing:
PFPC with offices in U.S., Ireland & Luxembourg
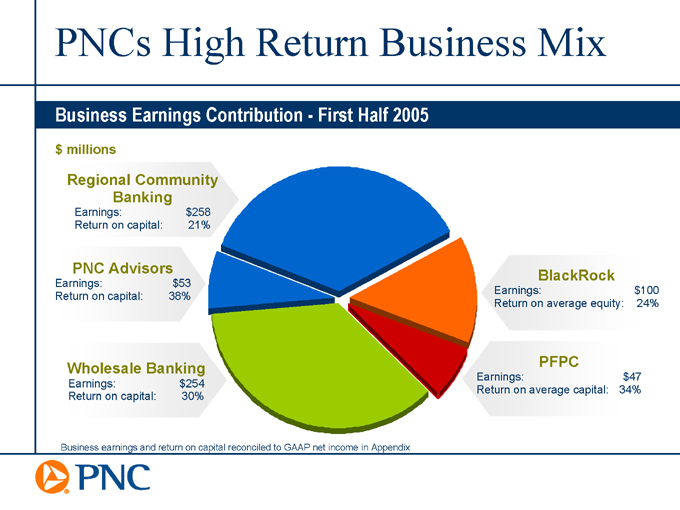
PNCs High Return Business Mix
Business Earnings ContributionFirst Half 2005 $millions
Regional Community Banking
Earnings: $258
Return on capital: 21%
PNC Advisors
Earnings: $53
Return on capital: 38%
Wholesale Banking
Earnings: $254
Return on capital: 30%
BlackRock
Earnings: $100
Return on average equity: 24%
PFPC
Earnings: $47
Return on average capital: 34%
Business earnings and return on capital reconciled to GAAP net income in Appendix
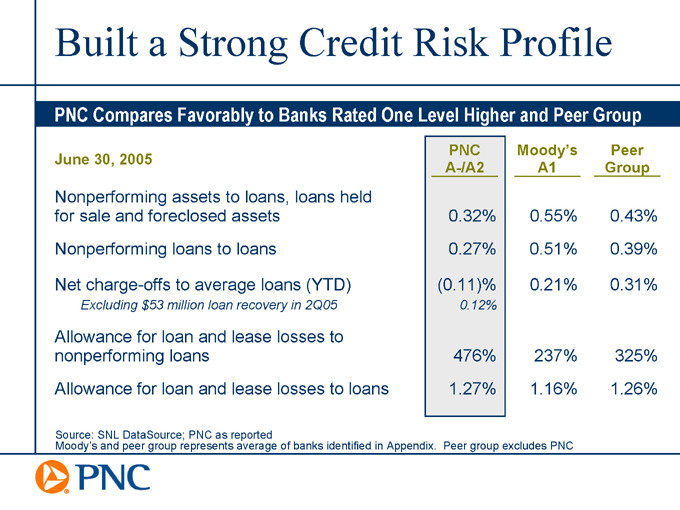
Built a Strong Credit Risk Profile
PNC Compares Favorably to Banks Rated One Level Higher and Peer Group
June 30, 2005 PNC A-/A2 Moodys A1 Peer Group
Nonperforming assets to loans, loans held
for sale and foreclosed assets 0.32% 0.55% 0.43%
Nonperforming loans to loans 0.27% 0.51% 0.39%
Net charge-offs to average loans (YTD) (0.11)% 0.21% 0.31%
Excluding $53 million loan recovery in 2Q05 0.12%
Allowance for loan and lease losses to nonperforming loans 476% 237% 325%
Allowance for loan and lease losses to loans 1.27% 1.16% 1.26%
Source: SNL DataSource; PNC as reported
Moodys and peer group represents average of banks identified in Appendix. Peer group excludes PNC
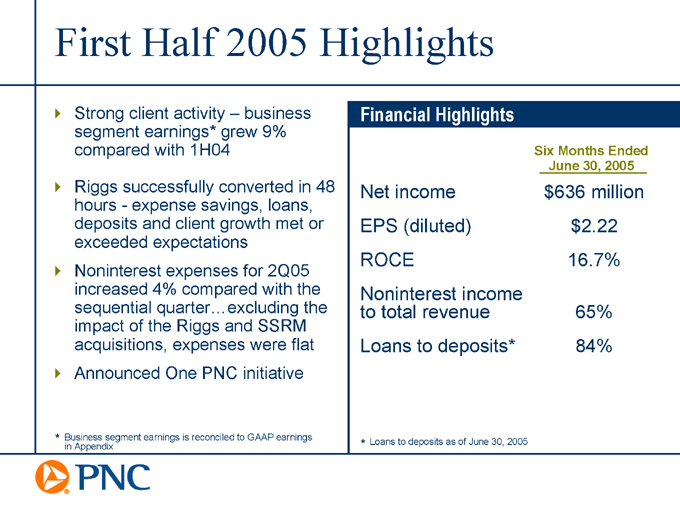
First Half 2005 Highlights
Strong client activity business segment earnings* grew 9% compared with 1H04
Riggs successfully converted in 48 hoursexpense savings, loans, deposits and client growth met or exceeded expectations Noninterest expenses for 2Q05 increased 4% compared with the sequential quarter excluding the impact of the Riggs and SSRM acquisitions, expenses were flat Announced One PNC initiative
* Business segment earnings is reconciled to GAAP earnings in Appendix
Financial Highlights
Six Months Ended
June 30, 2005
Net income $636 million
EPS (diluted) $2.22
ROCE 16.7%
Noninterest income
to total revenue 65%
Loans to deposits* 84%
* Loans to deposits as of June 30, 2005
Keys to Success in the Current Environment
A Solid Platform
Diversified business mix Strong risk management
Executable Growth Strategies
Invest in and grow fee-based businesses Continue to grow low-cost deposit franchise Generate value-added loans Improve asset yields Make operating efficiency a core competency
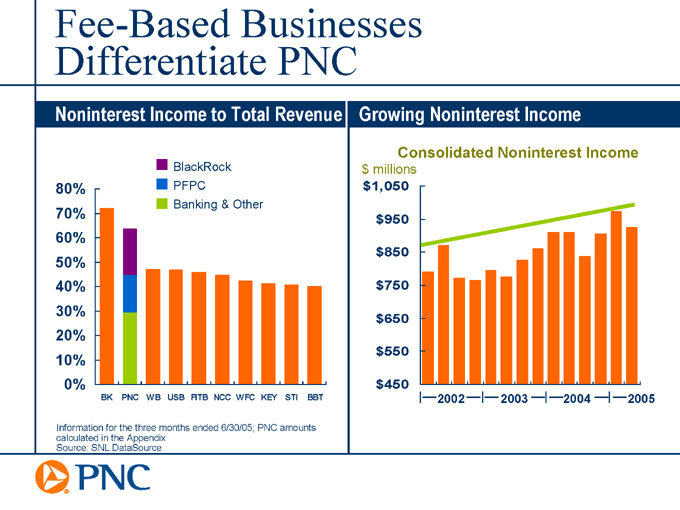
Fee-Based Businesses Differentiate PNC
Noninterest Income to Total Revenue
BlackRock
PFPC
Banking & Other
80%
70%
60%
50%
40%
30%
20%
10%
0%
BK PNC WB USB FITB NCC WFC KEY STI BBT
Information for the three months ended 6/30/05; PNC amounts calculated in the Appendix Source: SNL DataSource
Growing Noninterest Income
Consolidated Noninterest Income $ millions
$1,050
$950
$850
$750
$650
$550
$450
2002 2003 2004 2005
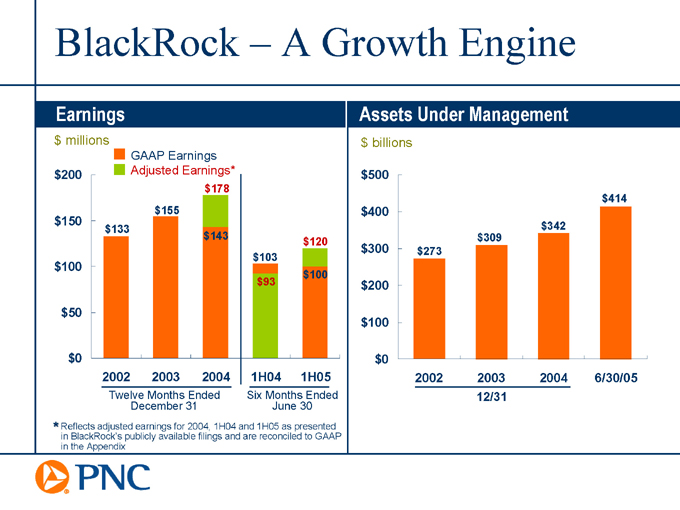
BlackRock A Growth Engine
Earnings $ millions
GAAP Earnings Adjusted Earnings*
$200
$150
$100
$50
$0
$178 $155 $133 $143 $120 $103 $100 $93
2002 2003 2004 1H04 1H05
Twelve Months Ended December 31
Six Months Ended June 30
* Reflects adjusted earnings for 2004, 1H04 and 1H05 as presented in BlackRocks publicly available filings and are reconciled to GAAP in the Appendix
Assets Under Management $ billions $500 $400 $300 $200 $100 $0 $414
$342 $309 $273
2002 2003 2004
6/30/05
12/31
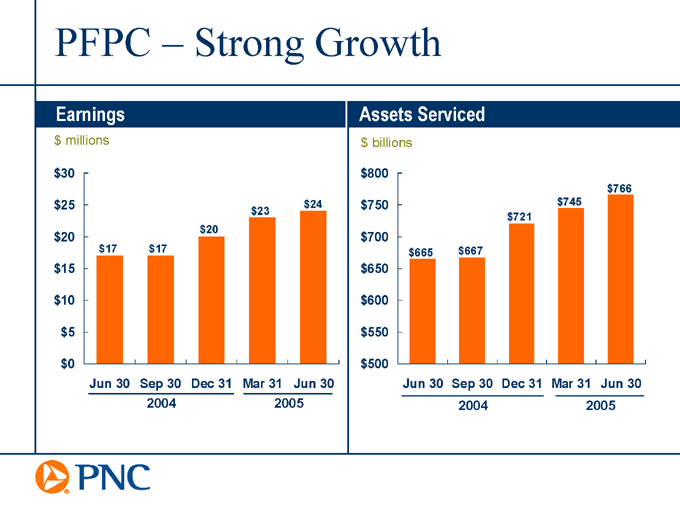
PFPC Strong Growth
Earnings $ millions
$30
$25
$20
$15
$10
$5
$0
$24 $23 $20
$17 $17
Jun 30 Sep 30 Dec 31
Mar 31 Jun 30
2004
2005
Assets Serviced $ billions
$800
$750
$700
$650
$600
$550
$500
$766 $745 $721
$665 $667
Jun 30 Sep 30 Dec 31 Mar 31 Jun 30
2004 2005
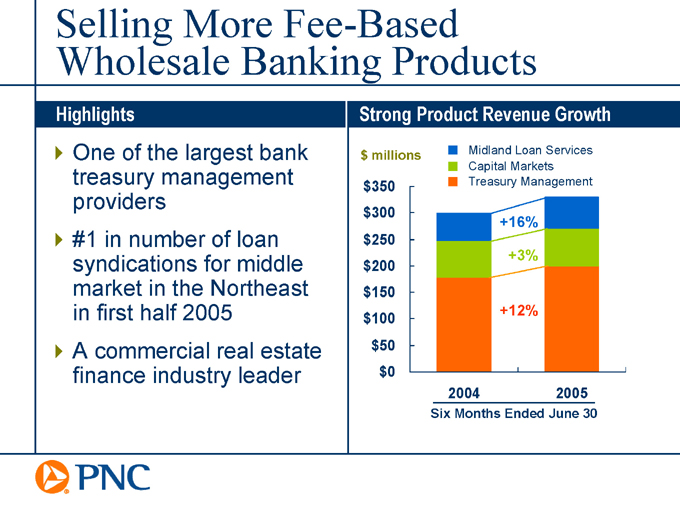
Selling More Fee-Based Wholesale Banking Products
Highlights
One of the largest bank treasury management providers #1 in number of loan syndications for middle market in the Northeast in first half 2005 A commercial real estate finance industry leader
Strong Product Revenue Growth
$ millions
$350
$300
$250
$200
$150
$100
$50
$0
Midland Loan Services Capital Markets Treasury Management
+16%
+3%
+12%
2004 2005
Six Months Ended June 30
Keys to Success in the Current Environment
A Solid Platform
Diversified business mix Strong risk management
Executable Growth Strategies
Invest in and grow fee-based businesses Continue to grow low-cost deposit franchise Generate value-added loans Improve asset yields Make operating efficiency a core competency
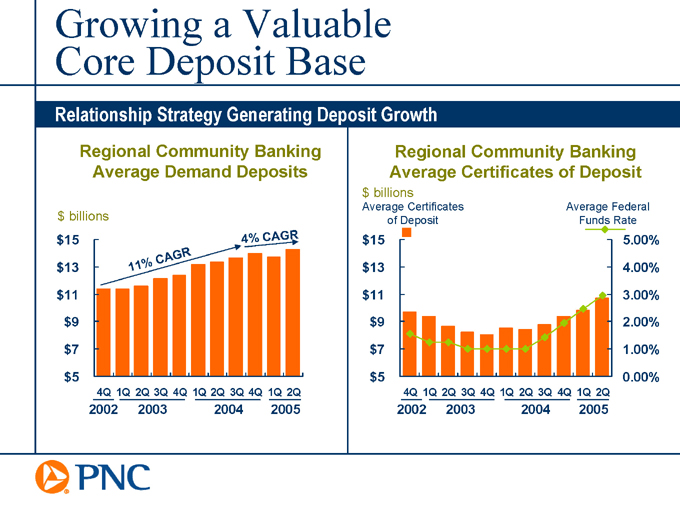
Growing a Valuable Core Deposit Base
Relationship Strategy Generating Deposit Growth
Regional Community Banking Average Demand Deposits
$ billions
$15
$13
$11
$9
$7
$5
11% CAGR
4% CAGR
4Q 1Q 2Q 3Q 4Q 1Q 2Q 3Q 4Q 1Q 2Q
2002 2003 2004 2005
Regional Community Banking Average Certificates of Deposit $ billions
Average Certificates of Deposit
$15
$13
$11
$9
$7
$5
Average Federal Funds Rate
5.00%
4.00%
3.00%
2.00%
1.00%
0.00%
4Q 1Q 2Q 3Q 4Q 1Q 2Q 3Q 4Q 1Q 2Q
2002 2003 2004 2005
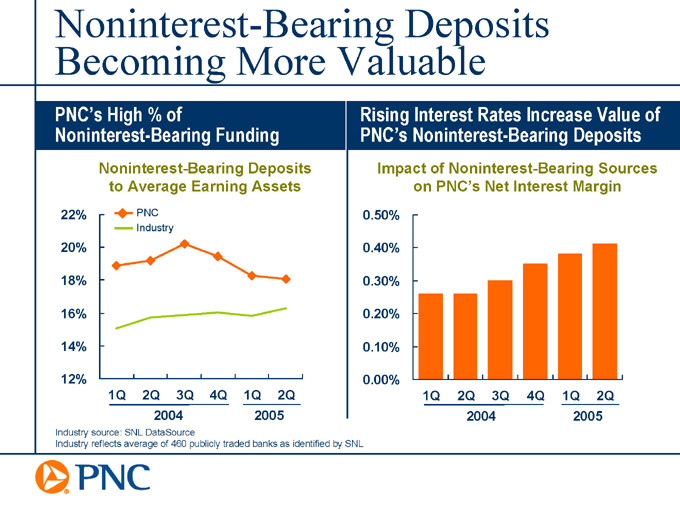
Noninterest-Bearing Deposits Becoming More Valuable
PNCs High % of
Noninterest-Bearing Funding
Noninterest-Bearing Deposits to Average Earning Assets
22%
20%
18%
16%
14%
12%
PNC Industry
1Q 2Q 3Q 4Q 1Q 2Q
2004 2005
Industry source: SNL DataSource
Industry reflects average of 460 publicly traded banks as identified by SNL
Rising Interest Rates Increase Value of PNCs Noninterest-Bearing Deposits
Impact of Noninterest-Bearing Sources on PNCs Net Interest Margin
0.50%
0.40%
0.30%
0.20%
0.10%
0.00%
1Q 2Q 3Q 4Q 1Q 2Q
2004 2005
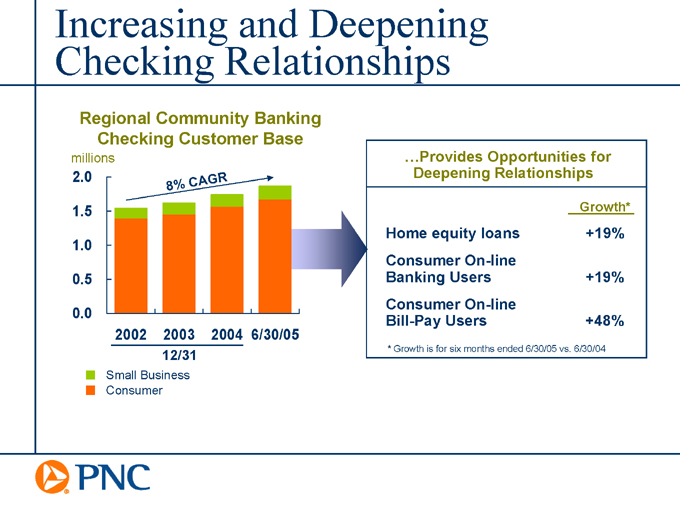
Increasing and Deepening Checking Relationships
Regional Community Banking Checking Customer Base
millions
2.0
1.5
1.0
0.5
0.0
8% CAGR
2002 2003 2004 6/30/05
12/31
Small Business Consumer
Provides Opportunities for Deepening Relationships
Growth*
Home equity loans +19%
Consumer On-line Banking Users +19%
Consumer On-line Bill-Pay Users +48%
* Growth is for six months ended 6/30/05 vs. 6/30/04
Keys to Success in the Current Environment
A Solid Platform
Diversified business mix Strong risk management
Executable Growth Strategies
Invest in and grow fee-based businesses Continue to grow low-cost deposit franchise Generate value-added loans Improve asset yields Make operating efficiency a core competency
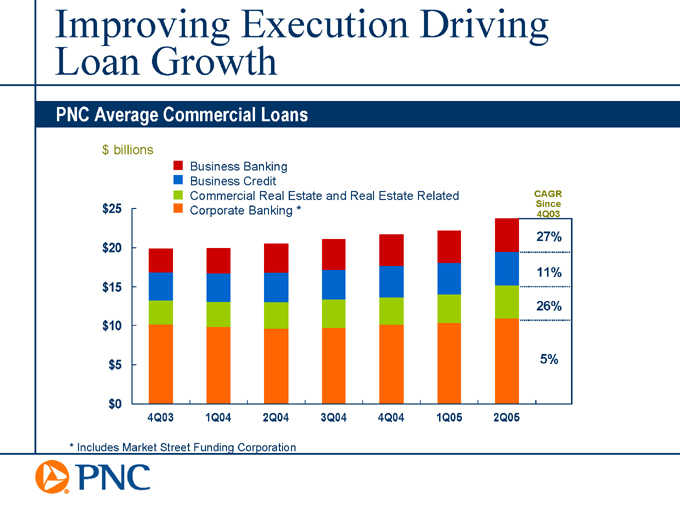
Improving Execution Driving Loan Growth
PNC Average Commercial Loans $ billions
$25
$20
$15
$10
$5
$0
Business Banking Business Credit
Commercial Real Estate and Real Estate Related Corporate Banking *
CAGR
Since
4Q03
27%
11%
26%
5%
4Q03 1Q04 2Q04 3Q04 4Q04 1Q05 2Q05
* Includes Market Street Funding Corporation
Keys to Success in the Current Environment
A Solid Platform
Diversified business mix Strong risk management
Executable Growth Strategies
Invest in and grow fee-based businesses Continue to grow low-cost deposit franchise Generate value-added loans Improve asset yields Make operating efficiency a core competency
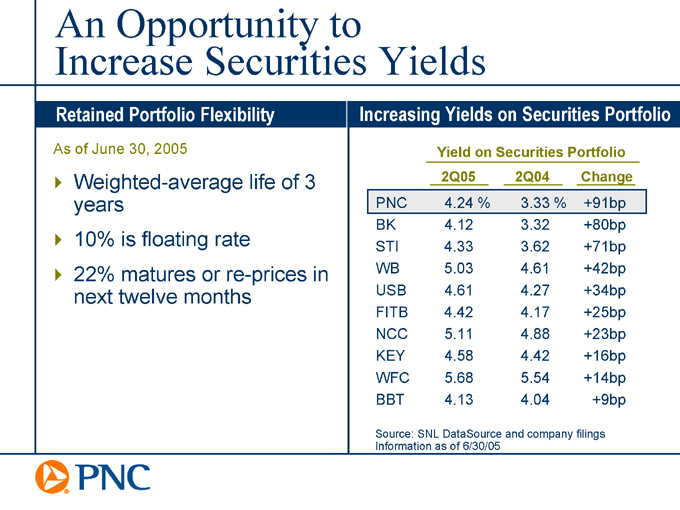
An Opportunity to Increase Securities Yields
Retained Portfolio Flexibility
As of June 30, 2005
Weighted-average life of 3 years 10% is floating rate 22% matures or re-prices in next twelve months
Increasing Yields on Securities Portfolio
Yield on Securities Portfolio
2Q05 2Q04 Change
PNC 4.24 % 3.33 % +91bp
BK 4.12 3.32 +80bp
STI 4.33 3.62 +71bp
WB 5.03 4.61 +42bp
USB 4.61 4.27 +34bp
FITB 4.42 4.17 +25bp
NCC 5.11 4.88 +23bp
KEY 4.58 4.42 +16bp
WFC 5.68 5.54 +14bp
BBT 4.13 4.04 +9bp
Source: SNL DataSource and company filings Information as of 6/30/05
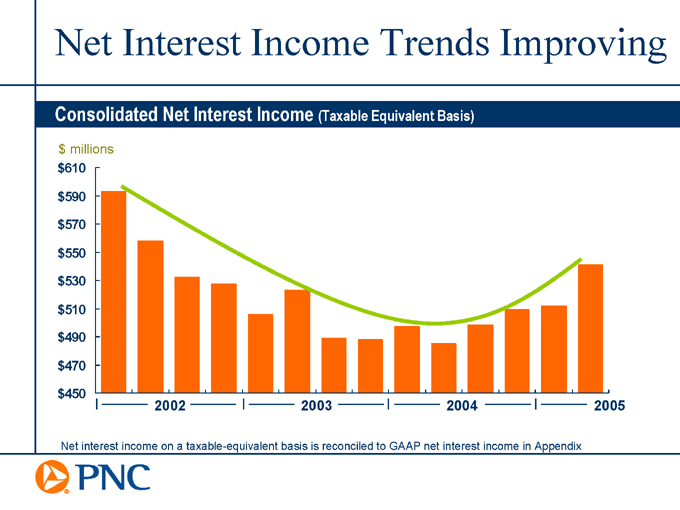
Net Interest Income Trends Improving
Consolidated Net Interest Income (Taxable Equivalent Basis)
$ millions
$610
$590
$570
$550
$530
$510
$490
$470
$450
2002 2003 2004 2005
Net interest income on a taxable-equivalent basis is reconciled to GAAP net interest income in Appendix
Keys to Success in the Current Environment
A Solid Platform
Diversified business mix Strong risk management
Executable Growth Strategies
Invest in and grow fee-based businesses
Continue to grow low-cost deposit franchise
Generate value-added loans
Improve asset yields
Make operating efficiency a core competency
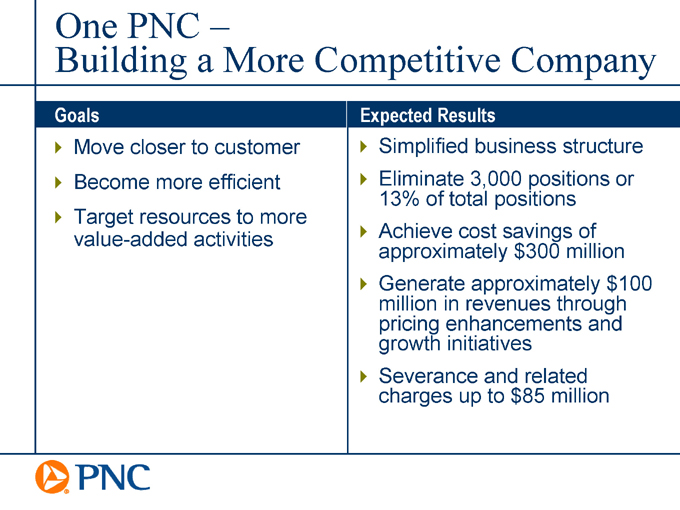
One PNC
Building a More Competitive Company
Goals
Move closer to customer Become more efficient Target resources to more value-added activities
Expected Results
Simplified business structure Eliminate 3,000 positions or 13% of total positions Achieve cost savings of approximately $300 million Generate approximately $100 million in revenues through pricing enhancements and growth initiatives Severance and related charges up to $85 million
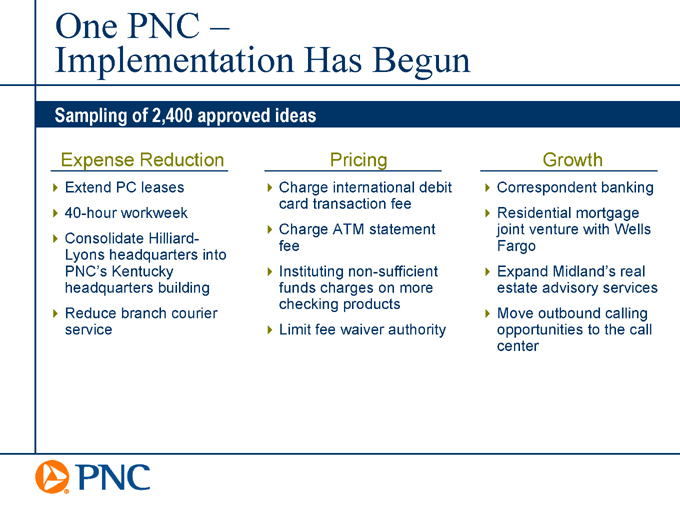
One PNC
Implementation Has Begun
Sampling of 2,400 approved ideas
Expense Reduction
Extend PC leases 40-hour workweek Consolidate Hilliard-Lyons headquarters into PNCs Kentucky headquarters building Reduce branch courier service
Pricing
Charge international debit card transaction fee Charge ATM statement fee Instituting non-sufficient funds charges on more checking products Limit fee waiver authority
Growth
Correspondent banking Residential mortgage joint venture with Wells Fargo Expand Midlands real estate advisory services Move outbound calling opportunities to the call center
Summary
Already accomplished a great deal in 2005
Positioned to generate positive operating leverage
Expect overall revenue growth trends to continue One PNC initiative to drive efficiency improvements

Appendix
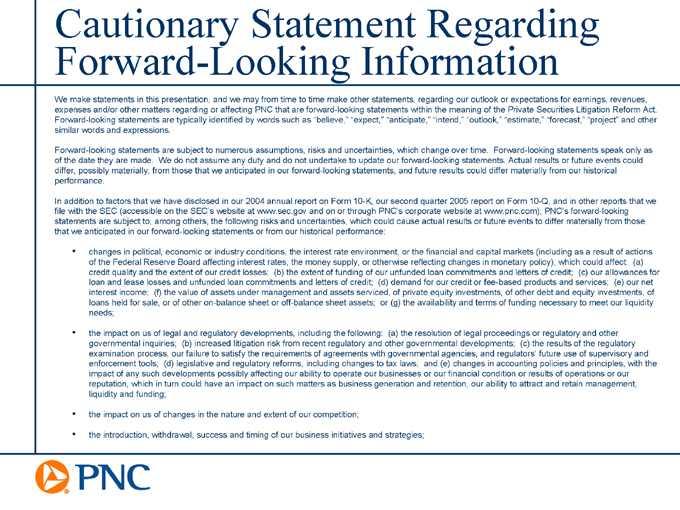
Cautionary Statement Regarding Forward-Looking Information
We make statements in this presentation, and we may from time to time make other statements, regarding our outlook or expectations for earnings, revenues, expenses and/or other matters regarding or affecting PNC that are forward-looking statements within the meaning of the Private Securities Litigation Reform Act. Forward-looking statements are typically identified by words such as believe, expect, anticipate, intend, outlook, estimate, forecast, project and other similar words and expressions.
Forward-looking statements are subject to numerous assumptions, risks and uncertainties, which change over time. Forward-looking statements speak only as of the date they are made. We do not assume any duty and do not undertake to update our forward-looking statements. Actual results or future events could differ, possibly materially, from those that we anticipated in our forward-looking statements, and future results could differ materially from our historical performance.
In addition to factors that we have disclosed in our 2004 annual report on Form 10-K, our second quarter 2005 report on Form 10-Q, and in other reports that we file with the SEC (accessible on the SECs website at www.sec.gov and on or through PNCs corporate website at www.pnc.com), PNCs forward-looking statements are subject to, among others, the following risks and uncertainties, which could cause actual results or future events to differ materially from those that we anticipated in our forward-looking statements or from our historical performance: changes in political, economic or industry conditions, the interest rate environment, or the financial and capital markets (including as a result of actions of the Federal Reserve Board affecting interest rates, the money supply, or otherwise reflecting changes in monetary policy), which could affect: (a) credit quality and the extent of our credit losses; (b) the extent of funding of our unfunded loan commitments and letters of credit; (c) our allowances for loan and lease losses and unfunded loan commitments and letters of credit; (d) demand for our credit or fee-based products and services; (e) our net interest income; (f) the value of assets under management and assets serviced, of private equity investments, of other debt and equity investments, of loans held for sale, or of other on-balance sheet or off-balance sheet assets; or (g) the availability and terms of funding necessary to meet our liquidity needs;
the impact on us of legal and regulatory developments, including the following: (a) the resolution of legal proceedings or regulatory and other governmental inquiries; (b) increased litigation risk from recent regulatory and other governmental developments; (c) the results of the regulatory examination process, our failure to satisfy the requirements of agreements with governmental agencies, and regulators future use of supervisory and enforcement tools; (d) legislative and regulatory reforms, including changes to tax laws; and (e) changes in accounting policies and principles, with the impact of any such developments possibly affecting our ability to operate our businesses or our financial condition or results of operations or our reputation, which in turn could have an impact on such matters as business generation and retention, our ability to attract and retain management, liquidity and funding;
the impact on us of changes in the nature and extent of our competition;
the introduction, withdrawal, success and timing of our business initiatives and strategies;
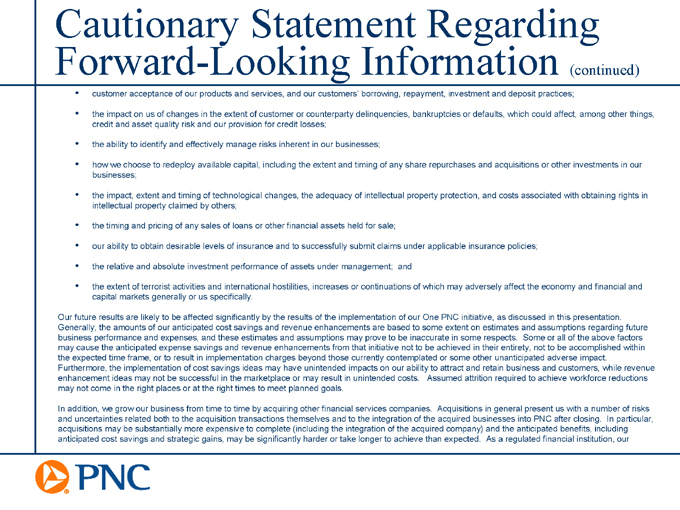
Cautionary Statement Regarding Forward-Looking Information (continued) customer acceptance of our products and services, and our customers borrowing, repayment, investment and deposit practices;
the impact on us of changes in the extent of customer or counterparty delinquencies, bankruptcies or defaults, which could affect, among other things, credit and asset quality risk and our provision for credit losses;
the ability to identify and effectively manage risks inherent in our businesses;
how we choose to redeploy available capital, including the extent and timing of any share repurchases and acquisitions or other investments in our businesses;
the impact, extent and timing of technological changes, the adequacy of intellectual property protection, and costs associated with obtaining rights in intellectual property claimed by others;
the timing and pricing of any sales of loans or other financial assets held for sale; our ability to obtain desirable levels of insurance and to successfully submit claims under applicable insurance policies; the relative and absolute investment performance of assets under management; and
the extent of terrorist activities and international hostilities, increases or continuations of which may adversely affect the economy and financial and capital markets generally or us specifically.
Our future results are likely to be affected significantly by the results of the implementation of our One PNC initiative, as discussed in this presentation. Generally, the amounts of our anticipated cost savings and revenue enhancements are based to some extent on estimates and assumptions regarding future business performance and expenses, and these estimates and assumptions may prove to be inaccurate in some respects. Some or all of the above factors may cause the anticipated expense savings and revenue enhancements from that initiative not to be achieved in their entirety, not to be accomplished within the expected time frame, or to result in implementation charges beyond those currently contemplated or some other unanticipated adverse impact.
Furthermore, the implementation of cost savings ideas may have unintended impacts on our ability to attract and retain business and customers, while revenue enhancement ideas may not be successful in the marketplace or may result in unintended costs. Assumed attrition required to achieve workforce reductions may not come in the right places or at the right times to meet planned goals.
In addition, we grow our business from time to time by acquiring other financial services companies. Acquisitions in general present us with a number of risks and uncertainties related both to the acquisition transactions themselves and to the integration of the acquired businesses into PNC after closing. In particular, acquisitions may be substantially more expensive to complete (including the integration of the acquired company) and the anticipated benefits, including anticipated cost savings and strategic gains, may be significantly harder or take longer to achieve than expected. As a regulated financial institution, our
Cautionary Statement Regarding Forward-Looking Information (continued) pursuit of attractive acquisition opportunities could be negatively impacted due to regulatory delays or other regulatory issues. Regulatory and/or legal issues of an acquired business may cause reputational harm to PNC following the acquisition and integration of the acquired business into ours and may result in additional future costs and expenses arising as a result of those issues. Recent acquisitions, including our acquisition of Riggs National Corporation, continue to present the integration and other post-closing risks and uncertainties described above.
You can find additional information on the foregoing risks and uncertainties and additional factors that could affect the results anticipated in our forward-looking statements or from our historical performance in the reports that we file with the SEC. You can access our SEC reports on the SECs website at www.sec.gov and on or through our corporate website at www.pnc.com.
Also, risks and uncertainties that could affect the results anticipated in forward-looking statements or from historical performance relating to our majority-owned subsidiary BlackRock, Inc. are discussed in more detail in BlackRocks filings with the SEC, accessible on the SECs website and on or through BlackRocks website at www.blackrock.com.
Any annualized, proforma, estimated, third party or consensus numbers in this presentation are used for illustrative or comparative purposes only and may not reflect actual results. Any consensus earnings estimates are calculated based on the earnings projections made by analysts who cover that company. The analysts opinions, estimates or forecasts (and therefore the consensus earnings estimates) are theirs alone, are not those of PNC or its management, and may not reflect PNCs actual or anticipated results.
Non-GAAP to GAAP Reconcilement
Appendix
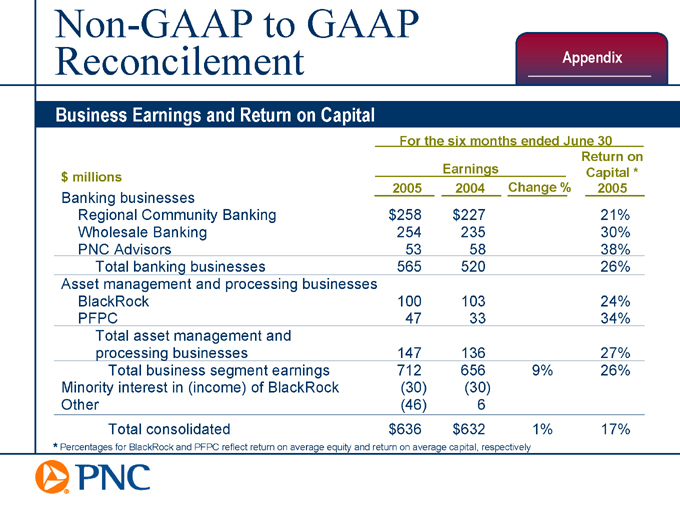
Business Earnings and Return on Capital
For the six months ended June 30
$ millions 2005 Earnings 2004 Change % Return on Capital * 2005
Banking businesses
Regional Community Banking $258 $227 21%
Wholesale Banking 254 235 30%
PNC Advisors 53 58 38%
Total banking businesses 565 520 26%
Asset management and processing businesses
BlackRock 100 103 24%
PFPC 47 33 34%
Total asset management and processing businesses 147 136 27%
Total business segment earnings 712 656 9% 26%
Minority interest in (income) of BlackRock (30) (30)
Other (46) 6
Total consolidated $636 $632 1% 17%
* Percentages for BlackRock and PFPC reflect return on average equity and return on average capital, respectively
Non-GAAP to GAAP Reconcilement
Appendix
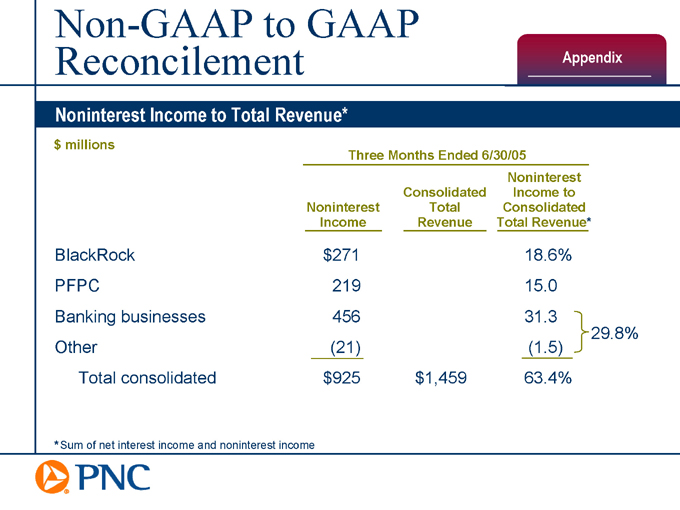
Noninterest Income to Total Revenue*
$ millions
Three Months Ended 6/30/05
Noninterest Income Consolidated Total Revenue Noninterest Income to Consolidated Total Revenue*
BlackRock $271 18.6%
PFPC 219 15.0
Banking businesses 456 31.3
29.8%
Other (21) (1.5)
Total consolidated $925 $1,459 63.4%
*Sum of net interest income and noninterest income
Non-GAAP to GAAP Reconcilement
Appendix
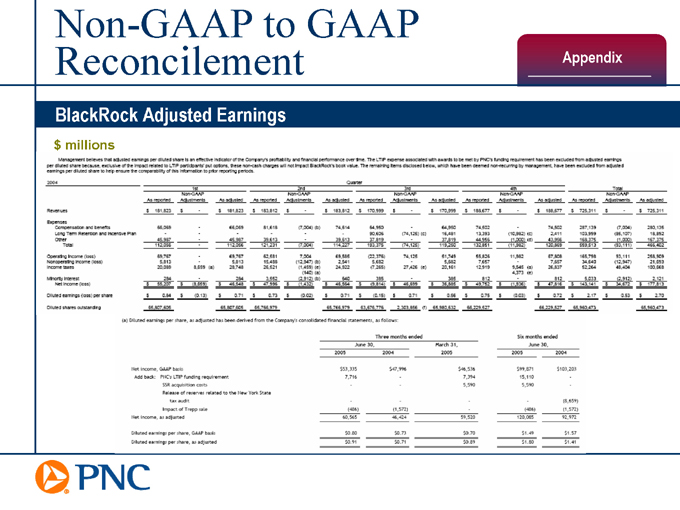
BlackRock Adjusted Earnings $ millions
Non-GAAP to GAAP Reconcilement
Appendix
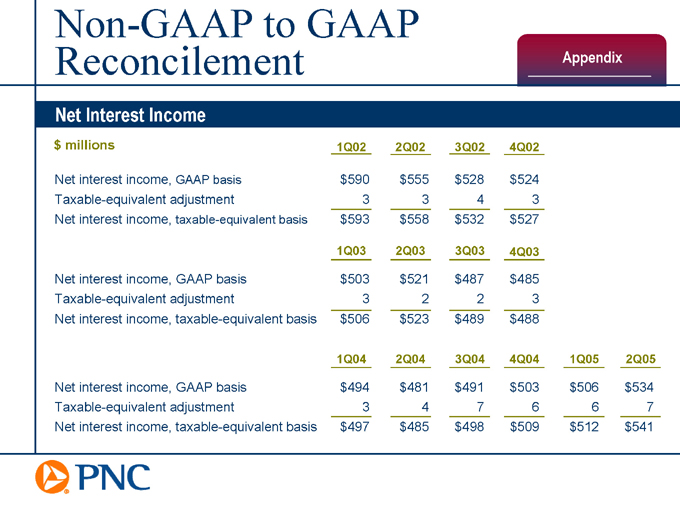
Net Interest Income
$ millions 1Q02 2Q02 3Q02 4Q02
Net interest income, GAAP basis $590 $555 $528 $524
Taxable-equivalent adjustment 3 3 4 3
Net interest income, taxable-equivalent basis $593 $558 $532 $527
1Q03 2Q03 3Q03 4Q03
Net interest income, GAAP basis $503 $521 $487 $485
Taxable-equivalent adjustment 3 2 2 3
Net interest income, taxable-equivalent basis $506 $523 $489 $488
1Q04 2Q05 2Q04 3Q04 4Q04 1Q05
Net interest income, GAAP basis $494 $481 $491 $503 $506 $534
Taxable-equivalent adjustment 3 4 7 6 6 7
Net interest income, taxable-equivalent basis $497 $485 $498 $509 $512 $541
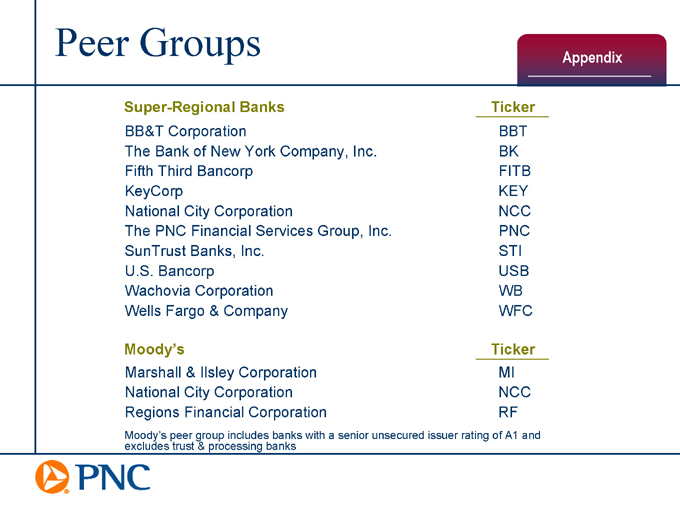
Peer Groups
Appendix
Super-Regional Banks Ticker
BB&T Corporation BBT
The Bank of New York Company, Inc. BK
Fifth Third Bancorp FITB
KeyCorp KEY
National City Corporation NCC
The PNC Financial Services Group, Inc. PNC
SunTrust Banks, Inc. STI
U.S. Bancorp USB
Wachovia Corporation WB
Wells Fargo & Company WFC
Moodys Ticker
Marshall & Ilsley Corporation MI
National City Corporation NCC
Regions Financial Corporation RF
Moodys peer group includes banks with a senior unsecured issuer rating of A1 and excludes trust & processing banks