POWERPOINT SLIDES
Published on August 8, 2005
EXHIBIT 99.1
The PNC Financial Services Group, Inc.
Keefe, Bruyette & Woods Large Cap Bank Conference
Kohler, WI
August 8, 2005

Cautionary Statement Regarding Forward-Looking Information
This presentation contains forward-looking statements regarding our outlook or expectations relating to PNCs future business, operations, financial condition, financial performance and asset quality. Forward-looking statements are necessarily subject to numerous assumptions, risks and uncertainties.
The forward-looking statements in this presentation are qualified by the factors affecting forward-looking statements identified in the more detailed Cautionary Statement included in the Appendix, as well as those factors previously disclosed in our 2004 annual report on Form 10-K, our first and second quarter 2005 reports on Form 10-Q, and other SEC reports (accessible on the SECs website at www.sec.gov and on or through our corporate website at www.pnc.com).
Future events or circumstances may change our outlook or expectations and may also affect the nature of the assumptions, risks and uncertainties to which our forward-looking statements are subject. The forward-looking statements in this presentation speak only as of the date of this presentation. We do not assume any duty and do not undertake to update those statements.
This presentation may also include a discussion of non-GAAP financial measures, which, to the extent not so qualified therein or in the Appendix, is qualified by GAAP reconciliation information available on our corporate website at www.pnc.com under For Investors.
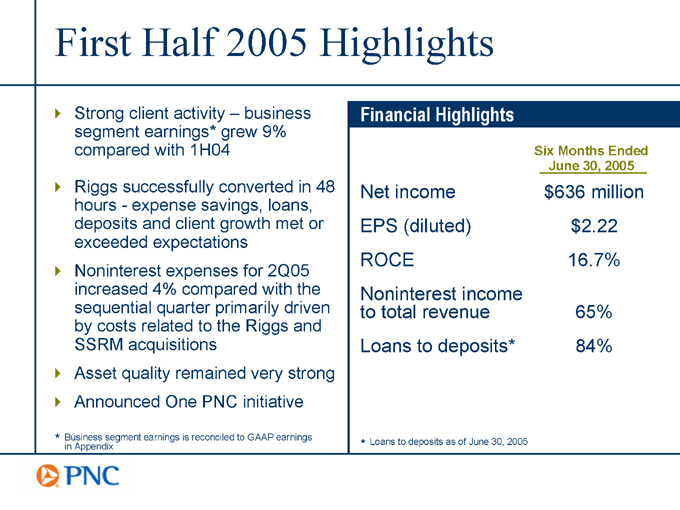
First Half 2005 Highlights
Strong client activity business segment earnings* grew 9% compared with 1H04
Riggs successfully converted in 48 hoursexpense savings, loans, deposits and client growth met or exceeded expectations Noninterest expenses for 2Q05 increased 4% compared with the sequential quarter primarily driven by costs related to the Riggs and SSRM acquisitions Asset quality remained very strong Announced One PNC initiative
* Business segment earnings is reconciled to GAAP earnings in Appendix
Financial Highlights
Six Months Ended
June 30, 2005
Net income $636 million
EPS (diluted) $2.22
ROCE 16.7%
Noninterest income to total revenue 65%
Loans to deposits* 84%
* Loans to deposits as of June 30, 2005
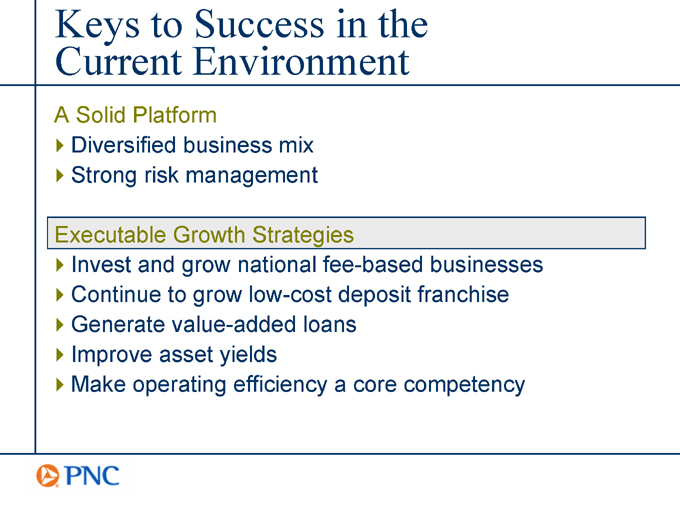
Keys to Success in the Current Environment
A Solid Platform
Diversified business mix
Strong risk management
Executable Growth Strategies
Invest and grow national fee-based businesses
Continue to grow low-cost deposit franchise
Generate value-added loans
Improve asset yields
Make operating efficiency a core competency
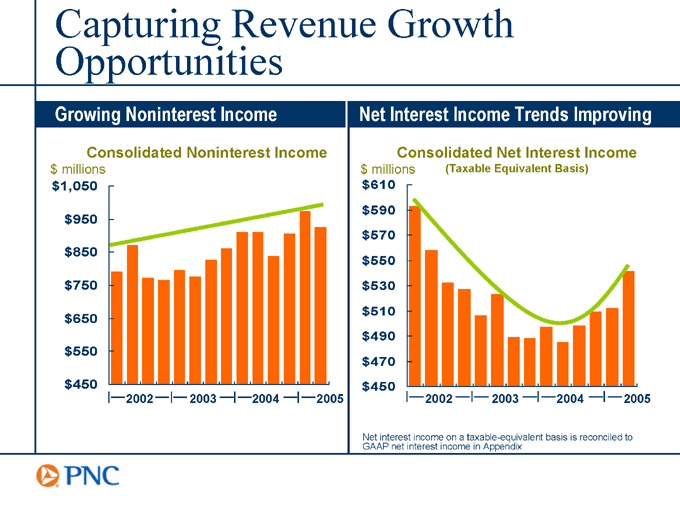
Capturing Revenue Growth Opportunities
Growing Noninterest Income
Consolidated Noninterest Income $ millions
$1,050 $950 $850 $750 $650 $550 $450
2002
2003
2004
2005
Net Interest Income Trends Improving
Consolidated Net Interest Income $ millions $610 $590 $570 $550 $530 $510 $490 $470 $450
(Taxable Equivalent Basis)
2002
2003
2004
2005
Net interest income on a taxable-equivalent basis is reconciled to GAAP net interest income in Appendix
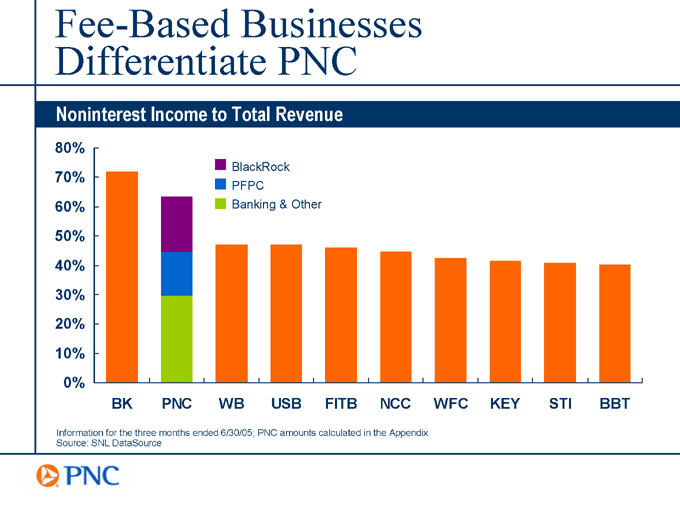
Fee-Based Businesses Differentiate PNC
Noninterest Income to Total Revenue
80% 70% 60% 50% 40% 30% 20% 10% 0%
BK PNC WB USB FITB NCC WFC KEY STI BBT
BlackRock PFPC Banking & Other
Information for the three months ended 6/30/05; PNC amounts calculated in the Appendix Source: SNL DataSource
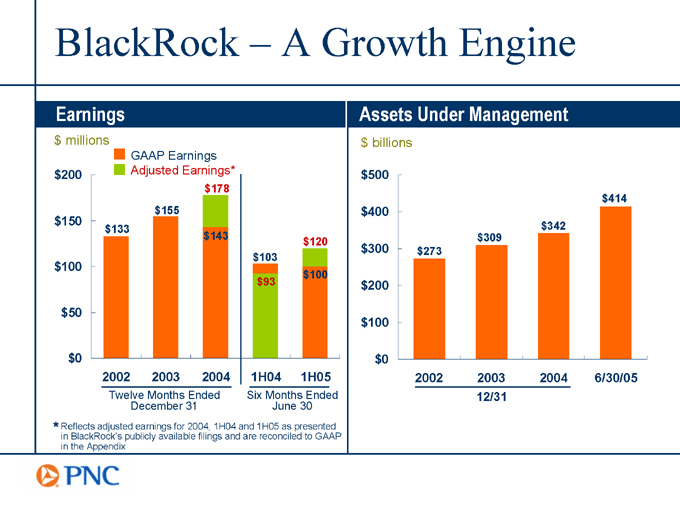
BlackRock A Growth Engine
Earnings $ millions
GAAP Earnings Adjusted Earnings* $200 $150 $100 $50 $0
2002 2003 2004 $133 $155 $178 $143
Twelve Months Ended December 31 $103 $93 $120 $100
1H04
1H05
Six Months Ended June 30
* Reflects adjusted earnings for 2004, 1H04 and 1H05 as presented in BlackRocks publicly available filings and are reconciled to GAAP in the Appendix
Assets Under Management $ billions $500 $400 $300 $200 $100 $0 $273 $309 $342 $414
2002 2003 2004
12/31
6/30/05
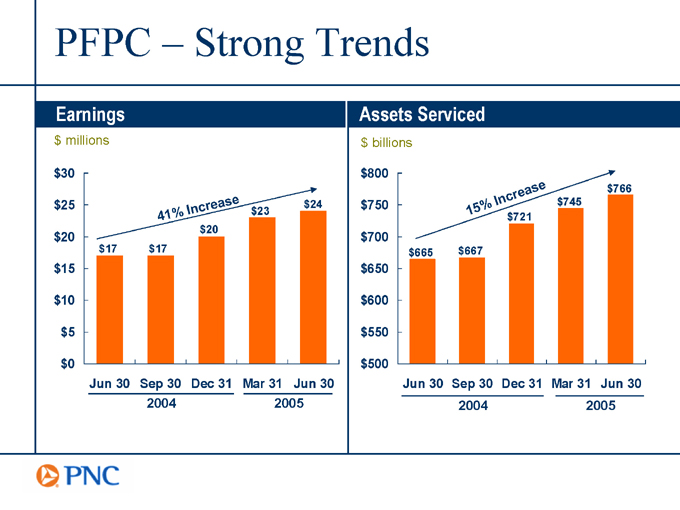
PFPC Strong Trends
Earnings $ millions $30 $25 $20 $15 $10 $5 $0
Jun 30 Sep 30 Dec 31
2004
Mar 31 Jun 30
2005
41
% Increase $17 $17 $20 $23 $24
Assets Serviced $ billions $800 $750 $700 $650 $600 $550 $500
Jun 30 Sep 30 Dec 31
2004
Mar 31 Jun 30
2005 $665 $667 $721 $745 $766
15 % Increase
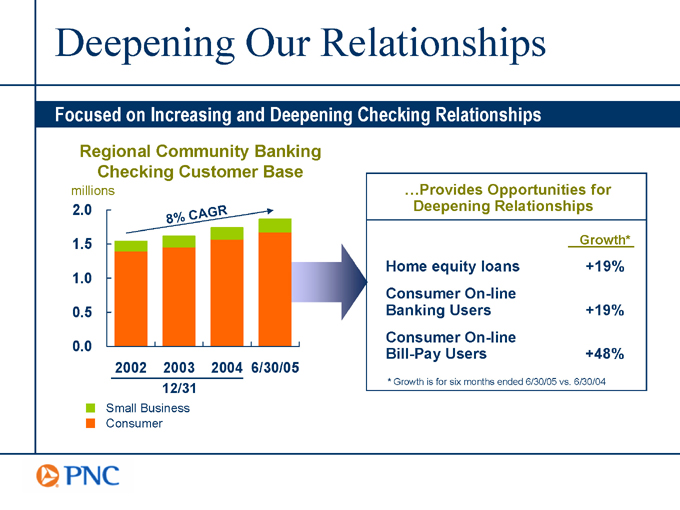
Deepening Our Relationships
Focused on Increasing and Deepening Checking Relationships
Regional Community Banking Checking Customer Base millions
2.0 1.5 1.0 0.5 0.0
2002 2003 2004
12/31
6/30/05
8
%
CA
GR
Small Business Consumer
Provides Opportunities for Deepening Relationships
Growth*
Home equity loans +19%
Consumer On-line Banking Users +19%
Consumer On-line Bill-Pay Users +48%
* Growth is for six months ended 6/30/05 vs. 6/30/04
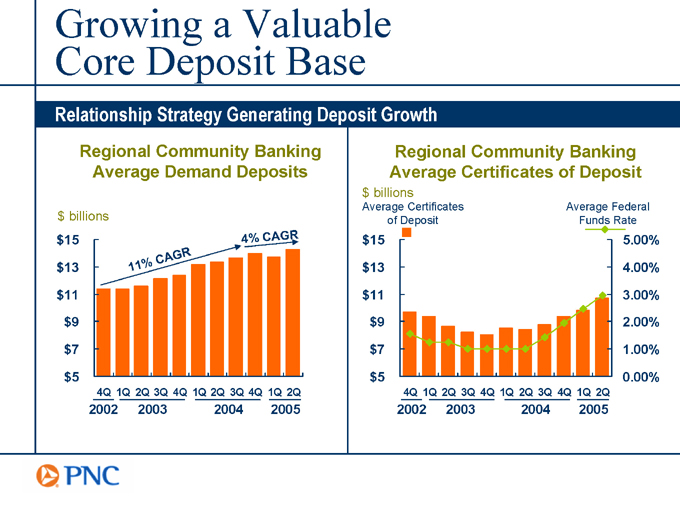
Growing a Valuable Core Deposit Base
Relationship Strategy Generating Deposit Growth
Regional Community Banking Average Demand Deposits $ billions $15
$13
$11 $9
$7
$5
4Q
2002
1Q 2Q 3Q 4Q
2003
1Q 2Q 3Q 4Q
2004
1Q 2Q
2005
Regional Community Banking Average Certificates of Deposit $ billions
Average Certificates of Deposit $15
$13
$11 $9
$7
$5
Average Federal Funds Rate
5.00%
4.00%
3.00% 2.00%
1.00%
0.00%
4Q
2002
1Q 2Q 3Q 4Q
2003
1Q 2Q 3Q 4Q
2004
1Q 2Q
2005
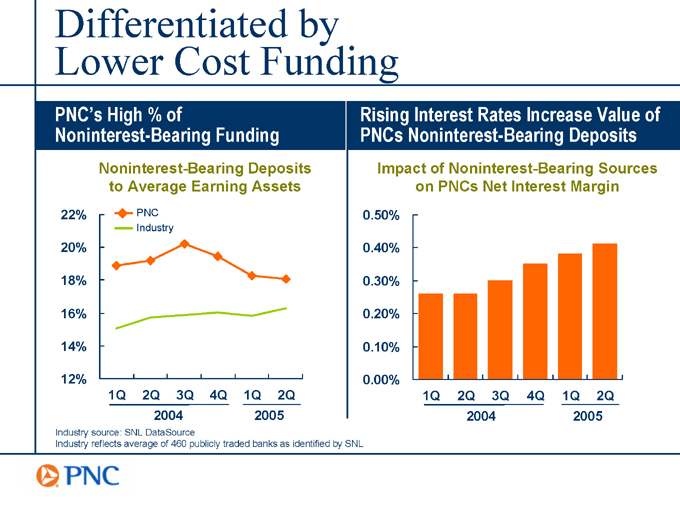
Differentiated by Lower Cost Funding
PNCs High % of
Noninterest-Bearing Funding
Noninterest-Bearing Deposits to Average Earning Assets
22% 20% 18% 16% 14% 12%
PNC Industry
1Q 2Q 3Q 4Q
2004
1Q 2Q
2005
Industry source: SNL DataSource
Industry reflects average of 460 publicly traded banks as identified by SNL
Rising Interest Rates Increase Value of PNCs Noninterest-Bearing Deposits
Impact of Noninterest-Bearing Sources on PNCs Net Interest Margin
0.50% 0.40% 0.30% 0.20% 0.10% 0.00%
1Q 2Q 3Q 4Q
2004
1Q 2Q
2005
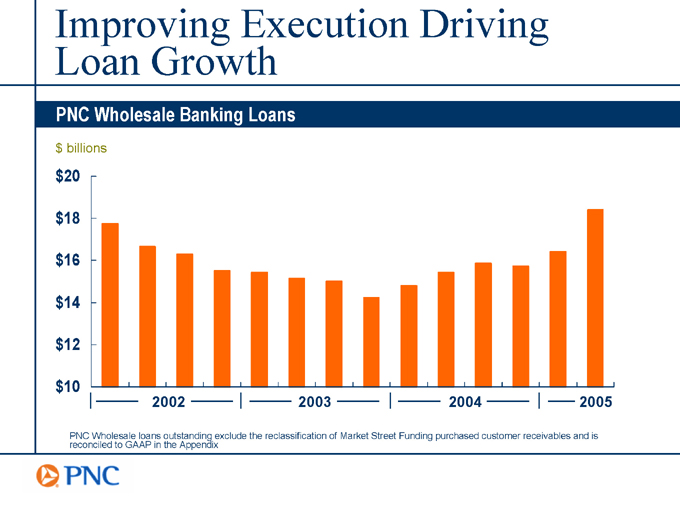
Improving Execution Driving Loan Growth
PNC Wholesale Banking Loans $ billions $20 $18 $16 $14 $12 $10
2002
2003
2004
2005
PNC Wholesale loans outstanding exclude the reclassification of Market Street Funding purchased customer receivables and is reconciled to GAAP in the Appendix
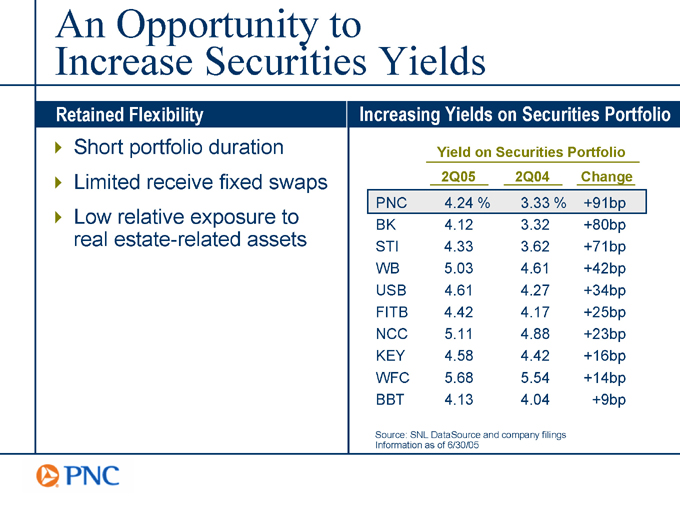
An Opportunity to Increase Securities Yields
Retained Flexibility
Short portfolio duration Limited receive fixed swaps Low relative exposure to real estate-related assets
Increasing Yields on Securities Portfolio
Yield on Securities Portfolio
2Q05 2Q04 Change
PNC 4.24 % 3.33 % +91bp
BK 4.12 3.32 +80bp
STI 4.33 3.62 +71bp
WB 5.03 4.61 +42bp
USB 4.61 4.27 +34bp
FITB 4.42 4.17 +25bp
NCC 5.11 4.88 +23bp
KEY 4.58 4.42 +16bp
WFC 5.68 5.54 +14bp
BBT 4.13 4.04 +9bp
Source: SNL DataSource and company filings Information as of 6/30/05
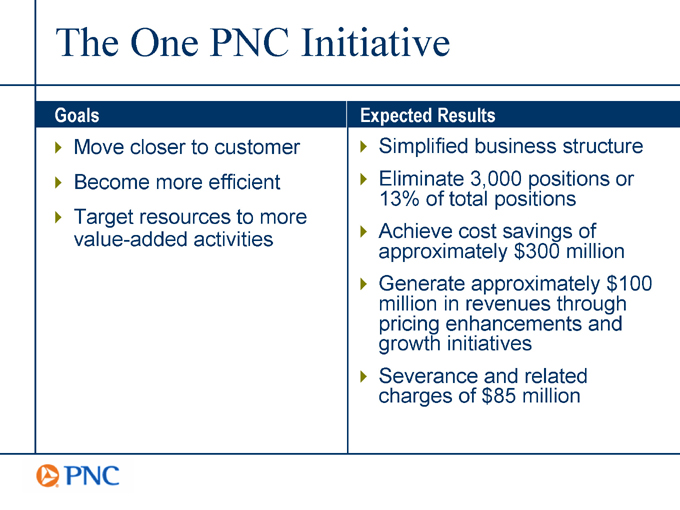
The One PNC Initiative
Goals
Move closer to customer Become more efficient Target resources to more value-added activities
Expected Results
Simplified business structure
Eliminate 3,000 positions or 13% of total positions
Achieve cost savings of approximately $300 million
Generate approximately $100 million in revenues through pricing enhancements and growth initiatives
Severance and related charges of $85 million
Summary
Already accomplished a great deal in 2005
A solid platformbuilt a diversified revenue stream and fortress balance sheet
Our businesses have executable plans to drive growth


Appendix
Cautionary Statement Regarding Forward-Looking Information
We make statements in this presentation, and we may from time to time make other statements, regarding our outlook or expectations for earnings, revenues, expenses and/or other matters regarding or affecting PNC that are forward-looking statements within the meaning of the Private Securities Litigation Reform Act. Forward-looking statements are typically identified by words such as believe, expect, anticipate, intend, outlook, estimate, forecast, project and other similar words and expressions.
Forward-looking statements are subject to numerous assumptions, risks and uncertainties, which change over time. Forward-looking statements speak only as of the date they are made. We do not assume any duty and do not undertake to update our forward-looking statements. Actual results or future events could differ, possibly materially, from those that we anticipated in our forward-looking statements, and future results could differ materially from our historical performance.
In addition to factors that we have disclosed in our 2004 annual report on Form 10-K, our first and second quarter 2005 reports on Form 10-Q, and in other reports that we file with the SEC (accessible on the SECs website at www.sec.gov and on or through PNCs corporate website at www.pnc.com), PNCs forward-looking statements are subject to, among others, the following risks and uncertainties, which could cause actual results or future events to differ materially from those that we anticipated in our forward-looking statements or from our historical performance:
changes in political, economic or industry conditions, the interest rate environment, or the financial and capital markets (including as a result of actions of the Federal Reserve Board affecting interest rates, the money supply, or otherwise reflecting changes in monetary policy), which could affect: (a) credit quality and the extent of our credit losses; (b) the extent of funding of our unfunded loan commitments and letters of credit; (c) our allowances for loan and lease losses and unfunded loan commitments and letters of credit; (d) demand for our credit or fee-based products and services; (e) our net interest income; (f) the value of assets under management and assets serviced, of private equity investments, of other debt and equity investments, of loans held for sale, or of other on-balance sheet or off-balance sheet assets; or (g) the availability and terms of funding necessary to meet our liquidity needs;
the impact on us of legal and regulatory developments, including the following: (a) the resolution of legal proceedings or regulatory and other governmental inquiries; (b) increased litigation risk from recent regulatory and other governmental developments; (c) the results of the regulatory examination process, our failure to satisfy the requirements of agreements with governmental agencies, and regulators future use of supervisory and enforcement tools; (d) legislative and regulatory reforms, including changes to tax laws; and (e) changes in accounting policies and principles, with the impact of any such developments possibly affecting our ability to operate our businesses or our financial condition or results of operations or our reputation, which in turn could have an impact on such matters as business generation and retention, our ability to attract and retain management, liquidity and funding;
the impact on us of changes in the nature and extent of our competition;
the introduction, withdrawal, success and timing of our business initiatives and strategies;
Cautionary Statement Regarding Forward-Looking Information (continued)
customer acceptance of our products and services, and our customers borrowing, repayment, investment and deposit practices;
the impact on us of changes in the extent of customer or counterparty delinquencies, bankruptcies or defaults, which could affect, among other things, credit and asset quality risk and our provision for credit losses;
the ability to identify and effectively manage risks inherent in our businesses;
how we choose to redeploy available capital, including the extent and timing of any share repurchases and acquisitions or other investments in our businesses;
the impact, extent and timing of technological changes, the adequacy of intellectual property protection, and costs associated with obtaining rights in intellectual property claimed by others;
the timing and pricing of any sales of loans or other financial assets held for sale; our ability to obtain desirable levels of insurance and to successfully submit claims under applicable insurance policies; the relative and absolute investment performance of assets under management; and
the extent of terrorist activities and international hostilities, increases or continuations of which may adversely affect the economy and financial and capital markets generally or us specifically.
Our future results are likely to be affected significantly by the results of the implementation of our One PNC initiative, as discussed in this presentation. Generally, the amounts of our anticipated cost savings and revenue enhancements are based to some extent on estimates and assumptions regarding future business performance and expenses, and these estimates and assumptions may prove to be inaccurate in some respects. Some or all of the above factors may cause the anticipated expense savings and revenue enhancements from that initiative not to be achieved in their entirety, not to be accomplished within the expected time frame, or to result in implementation charges beyond those currently contemplated or some other unanticipated adverse impact.
Furthermore, the implementation of cost savings ideas may have unintended impacts on our ability to attract and retain business and customers, while revenue enhancement ideas may not be successful in the marketplace or may result in unintended costs. Assumed attrition required to achieve workforce reductions may not come in the right places or at the right times to meet planned goals.
In addition, we grow our business from time to time by acquiring other financial services companies. Acquisitions in general present us with a number of risks and uncertainties related both to the acquisition transactions themselves and to the integration of the acquired businesses into PNC after closing. In particular, acquisitions may be substantially more expensive to complete (including the integration of the acquired company) and the anticipated benefits, including anticipated cost savings and strategic gains, may be significantly harder or take longer to achieve than expected. As a regulated financial institution, our
Cautionary Statement Regarding Forward-Looking Information (continued)
pursuit of attractive acquisition opportunities could be negatively impacted due to regulatory delays or other regulatory issues. Regulatory and/or legal issues of an acquired business may cause reputational harm to PNC following the acquisition and integration of the acquired business into ours and may result in additional future costs and expenses arising as a result of those issues. Recent acquisitions, including our acquisition of Riggs National Corporation, continue to present the integration and other post-closing risks and uncertainties described above.
You can find additional information on the foregoing risks and uncertainties and additional factors that could affect the results anticipated in our forward-looking statements or from our historical performance in the reports that we file with the SEC. You can access our SEC reports on the SECs website at www.sec.gov and on or through our corporate website at www.pnc.com.
Also, risks and uncertainties that could affect the results anticipated in forward-looking statements or from historical performance relating to our majority-owned subsidiary BlackRock, Inc. are discussed in more detail in BlackRocks filings with the SEC, accessible on the SECs website and on or through BlackRocks website at www.blackrock.com.
Any annualized, proforma, estimated, third party or consensus numbers in this presentation are used for illustrative or comparative purposes only and may not reflect actual results. Any consensus earnings estimates are calculated based on the earnings projections made by analysts who cover that company. The analysts opinions, estimates or forecasts (and therefore the consensus earnings estimates) are theirs alone, are not those of PNC or its management, and may not reflect PNCs actual or anticipated results.
Non-GAAP to GAAP Reconcilement
Appendix
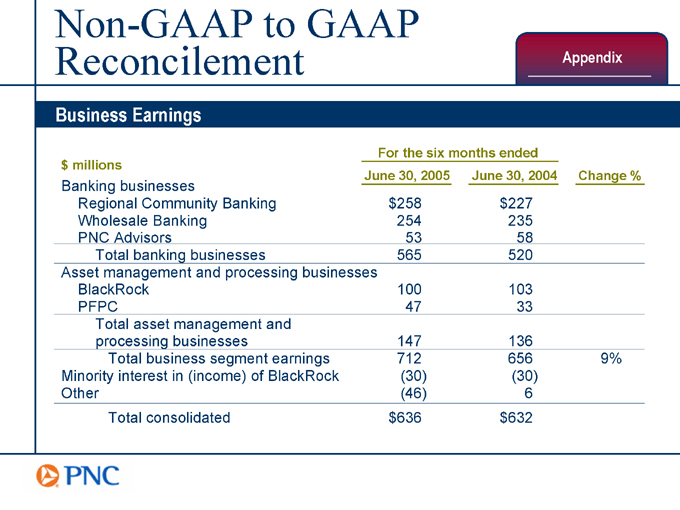
Business Earnings
For the six months ended
$ millions
June 30, 2005 June 30, 2004 Change %
Banking businesses
Regional Community Banking $258 $227
Wholesale Banking 254 235
PNC Advisors 53 58
Total banking businesses 565 520
Asset management and processing businesses
BlackRock 100 103
PFPC 47 33
Total asset management and
processing businesses 147 136
Total business segment earnings 712 656 9%
Minority interest in (income) of BlackRock (30) (30)
Other (46) 6
Total consolidated $636 $632
Non-GAAP to GAAP Reconcilement
Appendix
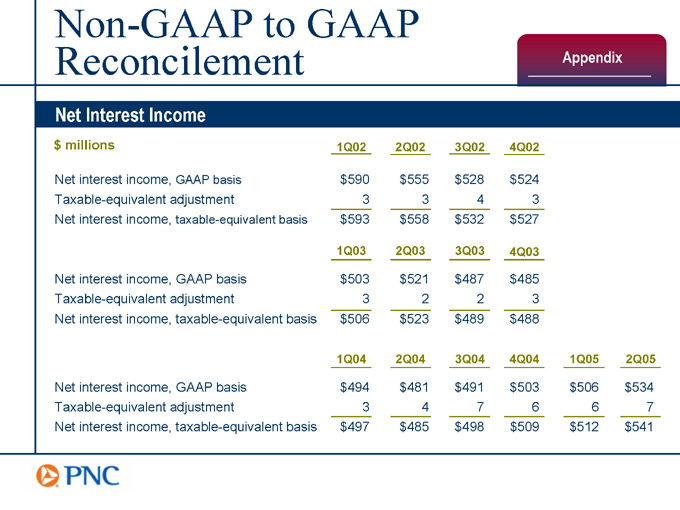
Net Interest Income
$ millions 1Q02 2Q02 3Q02 4Q02
Net interest income, GAAP basis $590 $555 $528 $524
Taxable-equivalent adjustment 3 3 4 3
Net interest income, taxable-equivalent basis $593 $558 $532 $527
1Q03 2Q03 3Q03 4Q03
Net interest income, GAAP basis $503 $521 $487 $485
Taxable-equivalent adjustment 3 2 2 3
Net interest income, taxable-equivalent basis $506 $523 $489 $488
1Q04 2Q04 3Q04 4Q04 1Q05 2Q05
Net interest income, GAAP basis $494 $481 $491 $503 $506 $534
Taxable-equivalent adjustment 3 4 7 6 6 7
Net interest income, taxable-equivalent basis $497 $485 $498 $509 $512 $541
Non-GAAP to GAAP Reconcilement
Appendix
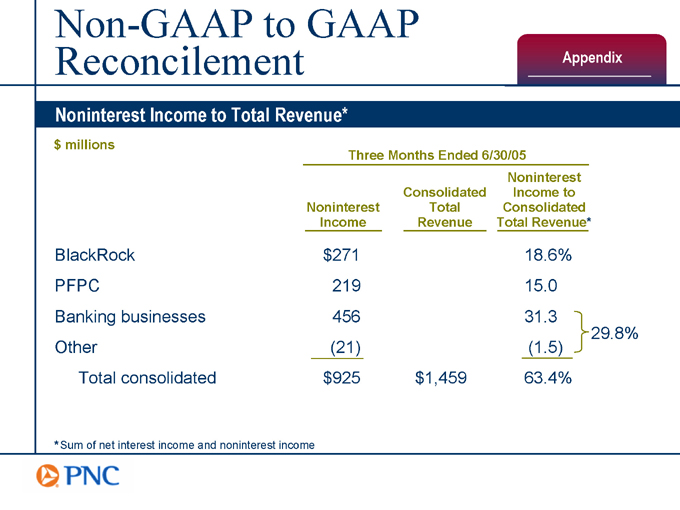
Noninterest Income to Total Revenue*
$ millions
Three Months Ended 6/30/05
Noninterest Income Consolidated Total Revenue Noninterest Income to Consolidated Total Revenue*
BlackRock $271 18.6%
PFPC 219 15.0
Banking businesses 456 31.3
29.8%
Other (21) (1.5)
Total consolidated $925 $1,459 63.4%
*Sum of net interest income and noninterest income
Non-GAAP to GAAP Reconcilement
Appendix
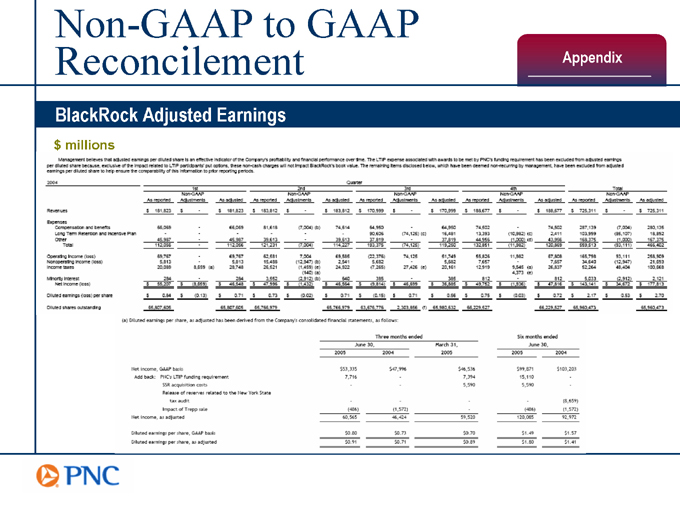
BlackRock Adjusted Earnings $ millions
Management believes that adjusted earnings per diluted share is an effective indicator of the companys profitability and financial performance over time. The LTIP expense associated with awards to be met by PNCs funding requirement has been excluded from adjusted earnings per diluted share because, exclusive of the impact related to LTIP participants put options, these non-cash charges will not Impact BlackRocks book value. The remaining items disclosed below, which have been deemed non-recurring by management, have been excluded from adjusted earnings per diluted share to help ensure the comparibility of this information to prior reporting periods.
2004 Quarter
1st 2nd 3rd 4th Total
As reported Non-GAAP Adjustments As adjusted
Revenues $181,823 $ $181,823 $183,812 $ $183,812 $170,999 $ $170,999 $188,677 $725,311 $ $725,311
Expenses
Compensation and benefits 66,069 66,069 81,618 (7,004)(b) 74,614 64,950 74,502 74,502 287,139 (7,004) 280,135
Long Term Retention and Incentive Plan 90,605 (74,125)(c) 16,481 13,393 (10,982)(c) 2,411 103,999 (85,107) 18,892
Other 45,987 45,987 39,613 39,613 37,819 44,956 (1,000)(d) 43,956 168,375 (1,000) 167,375
Total 112,056 112,056 121,231 (7,004) 114,227 193,375 (74,125) 119,250 132,851, 11,982 120,869 559,513 (93,111) 466,402
Operating Income (loss) 69,767 69,767 62,581 7,004 69,585 (22,376) 74,125 51,749 55,826 11,982 67,808 165,798 93,111 258,909
Nonoperating Income (loss) 5,813 5,813 15,488 (12,947)(b) 2,541 5,682 5,682 7,657 34,640 (12,947) 21,693
Income taxes 20,089 8,659(a) 28,748 26,521 (1,459)(e) 24,922 (7,265) 27,426(e) 20,161 12,919 9,545(a) 26,837 52,264 48,404 100,668 140(a) 4,373(e)
Minority Interest 284 284 3,552 (2,912)(b) 640 385 385 812 812 5,033 (2,912) 2121
Net Income (loss) $55,207 $(8,659) $46,548 $47,995 $(1,432) $46,564 $(9,814) $46,564 $(9,814) $46,699 $36,885 $49,752 $(1,936) $47,816 $143,141 $34,672 $177,813
Diluted earnings (loss) per share $0.84 $(0.13) $0.71 $0.73 $(0.02) $0.71 $(0.15) $0.56 $0.75 $(0.03) $0.72 $2.17 $0.53 $2.70
Diluted shares outstanding 65,807,605 65,807,605 65,766,979 65,766,979 63,676,775 2,303,856(f) 65,980,632 66,229,527 66,229,527 65,960,473 65,960,473
(a)Diluted earnings per share, as adjusted has been derived from the Companys consolidated financial statements, as follows:
Three months ended Six months ended
June 30, March 31, June 30,
2005 2004 2005 2005 2004
Net income, GAAP basis $53,335 $47,996 $46,536 $99,871 $103,203
Add back: PNCs LTIP funding requirement 7,716 7,394 15,110
SSR acquisition costs 5,590 5,590
Release of reserves related to the New York State tax audit (8,659)
Impact of Trepp sale (486) (1,571) (486) (1,572)
Net income, as adjusted 60,565 46,424 59,520 120,065 92,972
Diluted earnings per share, GAAP basis $0.80 $0.73 $0.70 $1.49 $1.57
Diluted earnings per share, as adjusted $0.91 $0.71 $0.89 $1.80 $1.41
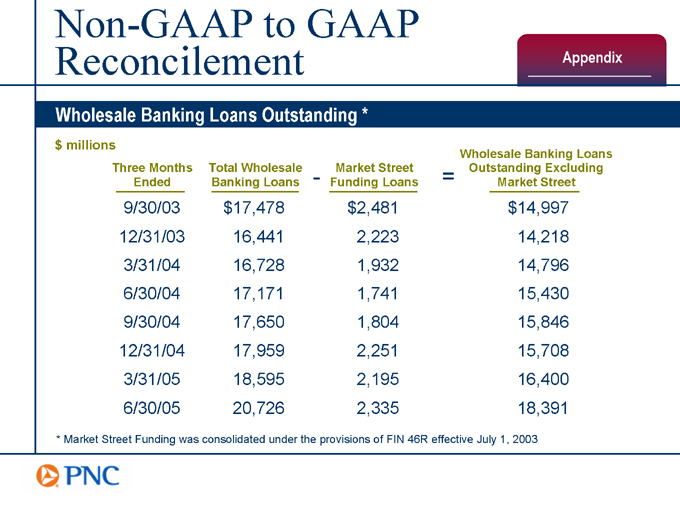
Non-GAAP to GAAP Reconcilement
Appendix
Wholesale Banking Loans Outstanding * $ millions
Three Months Ended Total Wholesale Banking Loans - - Market Street Funding Loans = Wholesale Banking Loans Outstanding Excluding Market Street
9/30/03 $17,478 $2,481 $14,997
12/31/03 16,441 2,223 14,218
3/31/04 16,728 1,932 14,796
6/30/04 17,171 1,741 15,430
9/30/04 17,650 1,804 15,846
12/31/04 17,959 2,251 15,708
3/31/05 18,595 2,195 16,400
6/30/05 20,726 2,335 18,391
* Market Street Funding was consolidated under the provisions of FIN 46R effective July 1, 2003
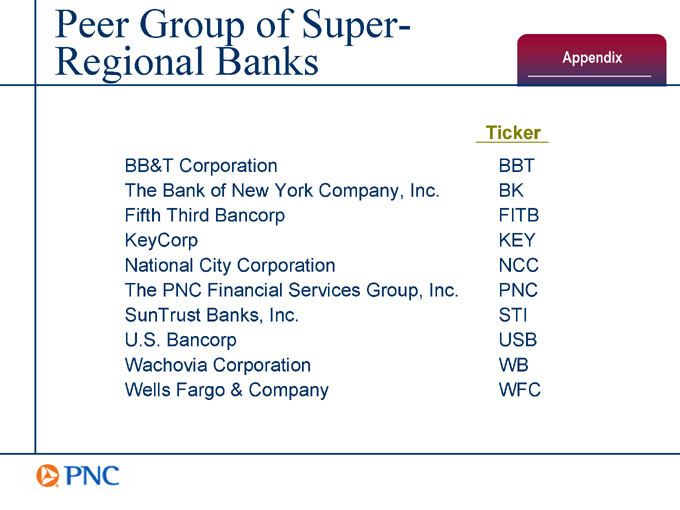
Peer Group of Super-Regional Banks
Appendix
Ticker
BB&T Corporation BBT
The Bank of New York Company, Inc. BK
Fifth Third Bancorp FITB
KeyCorp KEY
National City Corporation NCC
The PNC Financial Services Group, Inc. PNC
SunTrust Banks, Inc. STI
U.S. Bancorp USB
Wachovia Corporation WB
Wells Fargo & Company WFC