10-Q: Quarterly report pursuant to Section 13 or 15(d)
Published on August 5, 2005
SECURITIES AND EXCHANGE COMMISSION
Washington, D.C. 20549
FORM 10-Q
| x | QUARTERLY REPORT PURSUANT TO SECTION 13 OR 15(d) OF THE SECURITIES EXCHANGE ACT OF 1934 |
For the quarterly period ended June 30, 2005
or
| ¨ | TRANSITION REPORT PURSUANT TO SECTION 13 OR 15(d) OF THE SECURITIES EXCHANGE ACT OF 1934 |
For the transition period from to
Commission file number 001-09718

The PNC Financial Services Group, Inc.
(Exact name of registrant as specified in its charter)
| Pennsylvania | 25-1435979 | |
| (State or other jurisdiction of incorporation or organization) |
(I.R.S. Employer Identification No.) |
One PNC Plaza, 249 Fifth Avenue, Pittsburgh, Pennsylvania 15222-2707
(Address of principal executive offices)
(Zip Code)
(412) 762-2000
(Registrants telephone number, including area code)
(Former name, former address and former fiscal year, if changed since last report)
Indicate by check mark whether the registrant: (1) has filed all reports required to be filed by Section 13 or 15(d) of the Securities Exchange Act of 1934 during the preceding 12 months (or for such shorter period that the registrant was required to file such reports), and (2) has been subject to such filing requirements for the past 90 days.
Yes x No ¨
Indicate by check mark whether the registrant is an accelerated filer (as defined in Rule 12b-2 of the Exchange Act).
Yes x No ¨
As of July 29, 2005, there were 290,758,058 shares of the registrants common stock ($5 par value) outstanding.
The PNC Financial Services Group, Inc.
Cross-Reference Index to 2005 Second Quarter Form 10-Q
|
Pages |
||
| PART I FINANCIAL INFORMATION |
||
| Item 1. Financial Statements (Unaudited). |
38-58 | |
| 38 | ||
| 39 | ||
| 40 | ||
| Notes To Consolidated Financial Statements |
||
| 41 | ||
| 45 | ||
| 45 | ||
| 46 | ||
| 47 | ||
| 48 | ||
| 49 | ||
| 49 | ||
| Note 9 Certain Employee Benefit And Stock-Based Compensation Plans |
50 | |
| 51 | ||
| 52 | ||
| 53 | ||
| 54 | ||
| 55 | ||
| 57 | ||
| 58 | ||
| Statistical Information |
||
| Average Consolidated Balance Sheet And Net Interest Analysis |
59-60 | |
| Item 2. Managements Discussion and Analysis of Financial Condition and Results of Operations. |
1-37, 59-60 | |
| 1-2 | ||
| Financial Review |
||
| 3 | ||
| 7 | ||
| 10 | ||
| 14 | ||
| 15 | ||
| 23 | ||
| 23 | ||
| 23 | ||
| 23 | ||
| 24 | ||
| 34 | ||
| 34 | ||
| 36 | ||
| Item 3. Quantitative and Qualitative Disclosures About Market Risk. |
24-33 | |
| Item 4. Controls and Procedures. |
34 | |
| PART II OTHER INFORMATION |
||
| 61 | ||
| Item 2. Unregistered Sales of Equity Securities and Use of Proceeds. |
62 | |
| 62 | ||
| 62 | ||
| 63 | ||
CONSOLIDATED FINANCIAL HIGHLIGHTS
THE PNC FINANCIAL SERVICES GROUP, INC.
| Dollars in millions, except per |
Three months ended June 30 |
Six months ended June 30 |
||||||||||||||
|
2005 |
2004 |
2005 |
2004 |
|||||||||||||
| FINANCIAL PERFORMANCE |
||||||||||||||||
| Revenue |
||||||||||||||||
| Net interest income (taxable-equivalent basis) (a) |
$ | 541 | $ | 485 | $ | 1,053 | $ | 982 | ||||||||
| Noninterest income |
925 | 910 | 1,898 | 1,821 | ||||||||||||
| Total revenue |
$ | 1,466 | $ | 1,395 | $ | 2,951 | $ | 2,803 | ||||||||
| Net income |
$ | 282 | $ | 304 | $ | 636 | $ | 632 | ||||||||
| Per common share |
||||||||||||||||
| Diluted earnings |
$ | .98 | $ | 1.07 | $ | 2.22 | $ | 2.22 | ||||||||
| Cash dividends declared |
$ | .50 | $ | .50 | $ | 1.00 | $ | 1.00 | ||||||||
| SELECTED RATIOS |
||||||||||||||||
| Return on |
||||||||||||||||
| Average common shareholders equity |
14.34 | % | 17.41 | % | 16.68 | % | 18.13 | % | ||||||||
| Average assets |
1.29 | 1.66 | 1.50 | 1.73 | ||||||||||||
| Net interest margin |
3.00 | 3.18 | 3.01 | 3.24 | ||||||||||||
| Noninterest income to total revenue |
63 | 65 | 65 | 65 | ||||||||||||
| Efficiency |
71 | 65 | 69 | 65 | ||||||||||||
See page 34 for a glossary of certain terms used in this Report.
Certain prior period amounts included in these Consolidated Financial Highlights have been reclassified to conform with the current period presentation.
| (a) | The interest income earned on certain earning assets is completely or partially exempt from federal income tax. As such, these tax-exempt instruments typically yield lower returns than a taxable investment. To provide more meaningful comparisons of yields and margins for all earning assets, we have increased the interest income earned on tax-exempt assets to make it fully equivalent to interest income on other taxable investments. The following is a reconciliation of net interest income as reported in the Consolidated Income Statement to net interest income on a taxable-equivalent basis (in millions): |
|
Three months ended June 30 |
Six months ended June 30 |
|||||||||||
|
2005 |
2004 |
2005 |
2004 |
|||||||||
| Net interest income, GAAP basis |
$ | 534 | $ | 481 | $ | 1,040 | $ | 975 | ||||
| Taxable-equivalent adjustment |
7 | 4 | 13 | 7 | ||||||||
| Net interest income, taxable-equivalent basis |
$ | 541 | $ | 485 | $ | 1,053 | $ | 982 | ||||
1
| Unaudited |
June 30 2005 |
December 31 2004 |
June 30 2004 |
|||||||||
| BALANCE SHEET DATA (dollars in millions, except per share data) |
||||||||||||
| Assets |
$ | 90,794 | $ | 79,723 | $ | 73,119 | ||||||
| Loans, net of unearned income |
49,317 | 43,495 | 40,835 | |||||||||
| Allowance for loan and lease losses |
628 | 607 | 593 | |||||||||
| Securities |
20,437 | 16,761 | 14,954 | |||||||||
| Loans held for sale |
2,275 | 1,670 | 1,457 | |||||||||
| Deposits |
58,673 | 53,269 | 49,994 | |||||||||
| Borrowed funds |
18,206 | 11,964 | 10,937 | |||||||||
| Allowance for unfunded loan commitments and letters of credit |
84 | 75 | 84 | |||||||||
| Shareholders equity |
8,243 | 7,473 | 7,064 | |||||||||
| Common shareholders equity |
8,235 | 7,465 | 7,056 | |||||||||
| Book value per common share |
28.35 | 26.41 | 25.01 | |||||||||
| Common shares outstanding (millions) |
290 | 283 | 282 | |||||||||
| Loans to deposits |
84 | % | 82 | % | 82 | % | ||||||
| ASSETS UNDER MANAGEMENT (billions) |
$ | 456 | $ | 383 | $ | 350 | ||||||
| FUND ASSETS SERVICED (billions) |
||||||||||||
| Accounting/administration net assets |
$ | 766 | $ | 721 | $ | 665 | ||||||
| Custody assets |
462 | 451 | 416 | |||||||||
| CAPITAL RATIOS |
||||||||||||
| Tier 1 Risk-based |
8.3 | % | 9.0 | % | 9.1 | % | ||||||
| Total Risk-based |
11.9 | 13.0 | 12.9 | |||||||||
| Leverage |
7.2 | 7.6 | 7.7 | |||||||||
| Tangible common |
5.0 | 5.7 | 5.6 | |||||||||
| Common shareholders equity to assets |
9.07 | 9.36 | 9.65 | |||||||||
| ASSET QUALITY RATIOS |
||||||||||||
| Nonperforming assets to loans, loans held for sale and foreclosed assets |
.32 | % | .39 | % | .49 | % | ||||||
| Nonperforming loans to loans |
.27 | .33 | .41 | |||||||||
| Net charge-offs (recoveries) to average loans (for the three months ended) (a) |
(.32 | ) | .13 | .26 | ||||||||
| Allowance for loan and lease losses to loans |
1.27 | 1.40 | 1.45 | |||||||||
| Allowance for loan and lease losses to nonperforming loans |
476 | 424 | 351 | |||||||||
| (a) | This ratio reflects the impact of a $53 million loan recovery during the second quarter of 2005. Excluding the impact of this recovery, the ratio of net charge-offs to average loans for the second quarter of 2005 would have been .13%. |
2
FINANCIAL REVIEW
THE PNC FINANCIAL SERVICES GROUP, INC.
This Financial Review should be read together with our unaudited Consolidated Financial Statements and unaudited Statistical Information included elsewhere in this Report and Items 6, 7, 8 and 9A of our 2004 Annual Report on Form 10-K (2004 Form 10-K). We have reclassified certain prior period amounts to conform with the current year presentation. For information regarding certain business and regulatory risks, see the Risk Factors and Risk Management sections in this Financial Review and Items 1 and 7 of our 2004 Form 10-K. Also, see the Cautionary Statement Regarding Forward-Looking Information and Critical Accounting Policies And Judgments sections in this Financial Review for certain other factors that could cause actual results or future events to differ materially from those anticipated in the forward-looking statements included in this Report or from historical performance. See Note 14 Business Segments in the Notes To Consolidated Financial Statements included in Part I, Item 1 of this Report for a reconciliation of total business segment earnings to total PNC consolidated earnings as reported on a generally accepted accounting principles (GAAP) basis.
THE PNC FINANCIAL SERVICES GROUP, INC.
PNC is one of the largest diversified financial services companies in the United States, operating businesses engaged in regional community banking, wholesale banking, wealth management, asset management and global fund processing services. We operate directly and through numerous subsidiaries, providing many of our products and services nationally and others in our primary geographic markets in Pennsylvania, New Jersey, Delaware, Ohio, Kentucky and the Washington, D.C. area. We also provide certain asset management and global fund processing services internationally.
KEY STRATEGIC GOALS
Our strategy to enhance shareholder value centers on achieving growth in our lines of business underpinned by prudent management of risk, capital and expenses. In each of our business segments, the primary drivers of growth are the acquisition, expansion and retention of customer relationships. We strive to achieve such growth in our customer base by providing convenient banking options, leading technological systems and a broad range of asset management products and services. We also intend to grow through appropriate and targeted acquisitions and, in certain businesses, by expanding into new geographical markets.
In recent years, we have managed our interest rate risk to achieve a moderate risk profile with limited exposure to earnings volatility resulting from interest rate fluctuations. Our actions have created a balance sheet characterized by strong asset quality and significant flexibility to take advantage, where appropriate, of changing interest rates and to adjust to changing market conditions. We anticipate that interest rates will continue to rise in 2005 and that the overall impact of a rise in long-term interest rates will be beneficial to us.
On May 13, 2005, we successfully completed our acquisition of Riggs National Corporation (Riggs), a Washington, D.C. based banking company. The transaction gives us a substantial presence on which to build a market leading franchise in the affluent Washington metropolitan area. In connection with the acquisition, Riggs shareholders received an aggregate of approximately $297 million in cash and 6.6 million shares of PNC common stock. Our Consolidated Balance Sheet at June 30, 2005 includes $2.8 billion of loans, net of unearned income, and $3.5 billion of deposits, including $0.8 billion of brokered certificates of deposit, related to Riggs. We include additional information on Riggs, as well as the first quarter 2005 acquisition of SSRM Holdings, Inc. (SSRM) by our majority-owned subsidiary, BlackRock, Inc. (BlackRock), in Note 2 Acquisitions in the Notes To Consolidated Financial Statements in Part I, Item 1 of this Report.
THE ONE PNC INITIATIVE
The One PNC initiative, which began in January 2005, is an ongoing, company-wide review of business practices with goals of moving closer to the customer, improving our overall efficiency and targeting resources to more value-added activities. As a result of this intensive process, we plan to reorganize our banking businesses to reduce bureaucracy and to better serve our customer base. The initiative will result in a simplified and a more centrally managed organization. Our banking businesses will be divided into two units, consumer and institutional. Consumer banking will comprise consumer and small business banking as well as wealth management. The institutional unit will include our middle market and corporate businesses as well as business credit, capital markets, real estate finance and leasing.
PNC plans to achieve approximately $300 million in cost savings on an annual run-rate basis compared with the fourth quarter of 2004 through a combination of workforce reduction and other efficiency initiatives. Approximately 3,000 positions will be eliminated, with approximately half of those to be achieved through attrition and elimination of open positions. We estimate that these changes will result in employee severance and other implementation costs of approximately $85 million, the majority of which will be recorded beginning in the third quarter of 2005 and continuing through 2006.
In addition, PNC intends to achieve at least $100 million in revenue growth through the implementation of various pricing and business growth enhancements driven by the One PNC initiative.
Implementation of ideas generated through the One PNC initiative has begun and will continue through the second quarter of 2007, with a majority of the implementation of plans to be started in 2005. We expect to start realizing a net financial benefit from the program beginning in 2006.
3
KEY FACTORS AFFECTING FINANCIAL PERFORMANCE
Our financial performance is substantially affected by several external factors outside of our control, including:
| | General economic conditions, |
| | Loan demand, |
| | Interest rates, and the shape of the interest rate yield curve, |
| | The performance of the capital markets, and |
| | Customer demand for other products and services. |
In addition to changes in general economic conditions, including the direction, timing and magnitude of movement in interest rates and the performance of the capital markets, our success for the remainder of 2005 will depend, among other things, upon:
| | Further success in the acquisition, growth and retention of customers, |
| | Successful commencement of implementation of the One PNC initiative, |
| | Growth in market share across businesses, |
| | Disciplined expense control and improved efficiency, |
| | Maintaining strong overall asset quality, and |
| | Prudent risk and capital management. |
SUMMARY FINANCIAL RESULTS
Consolidated net income for the first six months of 2005 was $636 million, or $2.22 per diluted share, compared with $632 million, or $2.22 per diluted share, for the first six months of 2004. Return on average common shareholders equity was 16.68% for the first half of 2005 compared with 18.13% for the first half of 2004. Return on average assets was 1.50% for the first six months of 2005 compared with 1.73% for the first six months of 2004.
Consolidated net income for the second quarter of 2005 was $282 million, or $.98 per diluted share, compared with net income of $304 million, or $1.07 per diluted share, for the second quarter of 2004. Return on average common shareholders equity was 14.34% for the second quarter of 2005 and 17.41% for the second quarter of 2004. Return on average assets was 1.29% for the second quarter of 2005 compared with 1.66% for the second quarter of 2004.
Earnings for the second quarter and first half of 2005 included integration costs and dilution from operations of $18 million after-tax, or $.08 per diluted share, related to the acquisition of Riggs.
As previously reported, in January 2005 our ownership in BlackRock was transferred from PNC Bank, National Association (PNC Bank, N.A.) to PNC Bancorp, Inc., our intermediate bank holding company. The transfer was effected primarily to give BlackRock more operating flexibility, particularly in connection with its acquisition of SSRM. As a result of the transfer, certain deferred tax liabilities recorded by PNC were reversed in the first quarter of 2005 in accordance with Statement of Financial Accounting Standards No. (SFAS) 109, Accounting for Income Taxes. The reversal of deferred tax liabilities benefited our earnings by $45 million, or approximately $.16 per diluted share, in the first quarter of 2005.
Our second quarter 2005 performance included the following accomplishments:
| | The acquisition of Riggs was completed on Friday, May 13, 2005. A successful conversion of all Riggs customers to PNCs systems was completed over the following weekend. Loan and deposit balances in PNCs new Washington, D.C. region met our expectations, and early trends on new customer acquisitions are encouraging. |
| | Taxable-equivalent net interest income increased 12% compared with the second quarter of 2004 as a result of increased earning assets and higher yields on assets. |
| | Average total loans increased $7.1 billion, or 18%, compared with the second quarter of 2004, driven by targeted sales efforts to capitalize on increased market demand. Four percent of the growth was attributable to the Riggs acquisition. |
| | Average total deposits increased $7.6 billion, or 16%, compared with the prior year second quarter, driven by higher certificates of deposit, money market and demand deposit balances, and higher Eurodollar borrowings. The Riggs acquisition accounted for 4% of the growth, including the impact of brokered certificates of deposit. Average interest-bearing deposits increased 17%, while average demand and other noninterest-bearing deposits increased 11%, compared with the second quarter of 2004. |
| | Noninterest income increased 2% compared with a year ago driven by a 33% increase in asset management fees and higher fund servicing revenue. These factors were mostly offset by net securities losses compared with gains in the second quarter of 2004, lower gains on institutional loans held for sale, lower trading revenue and lower equity management gains. |
| | Noninterest expense rose $126 million, or 14%, in the second quarter of 2005 compared with the prior year second quarter. However, apart from the $38 million impact of Riggs and an increase of $66 million in operating expenses at BlackRock in 2005 and $8 million of costs incurred in the second quarter of 2004 related to the sale of our vehicle leasing business, noninterest expense rose only 3% in the comparison. Noninterest expense increased 4% compared with the first quarter of 2005 driven by the Riggs acquisition. Apart from the impact of the Riggs and SSRM acquisitions, expenses were flat compared with the first quarter of 2005 due to disciplined expense control. |
| | Asset quality remained very strong. The ratio of nonperforming loans to total loans fell to .27% at June 30, 2005 from .41% at June 20, 2004 and the ratio of nonperforming assets to total assets fell to .18% from .29% in the same comparison. |
4
BALANCE SHEET HIGHLIGHTS
Total average assets were $85.5 billion for the first six months of 2005 compared with $73.4 billion for the first six months of 2004. This increase was primarily attributable to a $9.5 billion increase in interest-earning assets. An increase of $6.1 billion in average loans was the primary factor for the increase in average interest-earning assets. In addition, average total securities increased $1.9 billion in the first half of 2005 compared with the prior year first half.
Average total loans were $45.6 billion for the first half of 2005 and $39.5 billion in the first half of 2004. This increase was driven by continued improvements in market loan demand and targeted sales efforts across our banking businesses, as well as the Riggs acquisition. The increase in average total loans reflected growth in consumer loans of approximately $2.6 billion, commercial loans of approximately $2.5 billion and residential mortgages of approximately $1.7 billion, partially offset by a $.7 billion decline in lease financing loans. During the second quarter of 2004, we sold our vehicle leasing portfolio as more fully described in our 2004 Form 10-K.
Loans represented 65% of average interest-earning assets for both the first half of 2005 and the first half of 2004.
Average securities totaled $17.9 billion for the first six months of 2005 and $16.0 billion for the first six months of 2004. Of this increase, $1.4 billion was attributable to increases in mortgage-backed, asset-backed and other debt securities. Securities comprised 26% of average interest-earning assets for both the first six months of 2005 and the first six months of 2004.
Funding cost is affected by the volume and type of funding sources that we have as well as the rates that we pay on those sources. Average total deposits were $55.0 billion for the first six months of 2005, an increase of $6.8 billion over the first six months of 2004. The increase in average total deposits was driven primarily by the impact of higher certificates of deposit, money market account and noninterest-bearing deposit balances, and by higher Eurodollar deposits. Average total deposits represented 64% of total sources of funds for the first six months of 2005 and 66% for the first six months of 2004. Average transaction deposits were $37.8 billion for the first half of 2005 compared with $35.2 billion for the first half of 2004.
Average borrowed funds were $15.7 billion for the first six months of 2005 and $12.9 billion for the first six months of 2004. The following contributed to this increase:
| | Our issuance of $1 billion of Federal Home Loan Bank advances in June 2005, $500 million of senior bank notes in September 2004, $500 million of subordinated bank notes in December 2004 and $700 million of senior notes and $350 million of senior bank notes in March 2005, |
| | The assumption of approximately $345 million of subordinated debt with the Riggs acquisition, |
| | BlackRocks issuance of $250 million of convertible debentures in February 2005, and |
| | An increase in short-term borrowings to fund asset growth. |
These increases were partially offset by senior bank note maturities in May 2005 and in the first quarter of 2004 and senior and subordinated debt maturities in April 2005 and during the last half of 2004.
Shareholders equity totaled $8.2 billion at June 30, 2005, compared with $7.5 billion at December 31, 2004. See the Consolidated Balance Sheet Review section of this Financial Review for additional information.
BUSINESS SEGMENT HIGHLIGHTS
Total business segment earnings for the first six months of 2005 were $712 million compared with $656 million for the first six months of 2004. Total business segment earnings were $383 million for the second quarter of 2005 and $330 million for the second quarter of 2004. A summary of results for both the first half and second quarter of 2005 compared with the prior year periods follows. Further analysis of business segment results for the six-month periods is found on pages 15 through 22.
Regional Community Banking
Regional Community Banking earnings for the first half of 2005 totaled $258 million compared with $227 million for the first half of 2004. Continued organic customer growth and the Riggs acquisition have driven a growing balance sheet and a 4% revenue increase. These positive results combined with slightly lower expenses and a lower provision for credit losses drove the 14% increase in earnings over last year.
Earnings from Regional Community Banking totaled $137 million for the second quarter of 2005 compared with $125 million for the second quarter of 2004. The 10% increase in earnings compared with the prior year quarter was driven by continued customer and balance sheet growth and a sustained focus on expense management. Checking relationships as of June 30, 2005 grew 9% compared with June 30, 2004, while total average loans grew 15% and average demand deposits grew 7% for the second quarter of 2005 compared with the second quarter of 2004.
Wholesale Banking
Earnings from Wholesale Banking were $254 million for the first six months of 2005 and $235 million for the first six months of 2004. In addition to the impact of higher taxable-equivalent net interest income driven by loan growth, the increased earnings compared with a year ago reflected the benefit of a higher negative provision for credit losses resulting from a $53 million loan recovery recorded during the second quarter of 2005. Those factors were partially offset by lower net gains from institutional loans held for sale.
Wholesale Banking earned $144 million for the second quarter of 2005 compared with $113 million for the second quarter of 2004. The higher earnings compared with the prior year quarter reflected the benefit of a negative provision for credit losses of $48 million in the second quarter of 2005, primarily as a result of the $53 million loan recovery referred to above, compared with an $8 million provision in the second quarter of 2004. The provision benefit and higher taxable-equivalent net interest income in the 2005 quarter were partially offset by lower net gains on institutional loans held for sale in 2005.
5
PNC Advisors
Earnings from PNC Advisors totaled $53 million for the first six months of 2005 and $58 million for the first six months of 2004. Earnings for the first half of 2004 included a $7 million after-tax gain recognized from the sale of certain investment consulting activities of the Hawthorn unit. Excluding the impact of this gain, the increase in earnings in the first half of 2005 primarily reflected disciplined expense control and higher asset management fees that more than offset a decline in client-related trading revenue.
PNC Advisors earned $25 million in the second quarter of 2005 and $27 million in the second quarter of 2004. The lower earnings compared with the prior year quarter reflected higher expenses associated with various one-time items partially offset by higher investment management revenue and taxable-equivalent net interest income.
BlackRock
BlackRock earnings totaled $100 million for the first half of 2005 compared with $103 million for the first half of 2004. Lower earnings for the first six months of 2005 compared with the prior year period reflected $30 million of pretax LTIP expenses in the first half of 2005 and nonrecurring pretax expenses of $9 million associated with the SSRM acquisition recognized in the first quarter of 2005. In addition, results for the first half of 2004 included a $9 million net income benefit recognized during the first quarter of that year associated with the resolution of an audit performed by New York State on state income tax returns filed from 1998 through 2001.
BlackRock reported earnings of $53 million for the second quarter of 2005 compared with $48 million for the second quarter of 2004. The higher earnings in the 2005 quarter were primarily due to higher investment advisory and administration fees driven by a growing base of assets under management that more than offset the increase in expense due to higher staffing levels following the SSRM acquisition, higher incentive compensation, including $16 million of pretax LTIP expenses, and higher general and administrative expense reported in the 2005 quarter. BlackRocks assets under management grew to $414 billion at June 30, 2005 compared with $342 billion at December 31, 2004, due to the SSRM acquisition and new business.
PNC owns approximately 70% of BlackRock and we consolidate BlackRock into our financial statements. Accordingly, approximately 30% of BlackRocks earnings are recognized as minority interest expense in the Consolidated Income Statement. BlackRock financial information included in the Financial Review section of this Report is presented on a stand-alone basis. The market value of our BlackRock shares was approximately $3.6 billion at June 30, 2005 while the book value at that date was $.6 billion.
PFPC
PFPC earnings totaled $47 million for the first half of 2005 and $33 million for the first half of 2004. Earnings from PFPC totaled $24 million for the second quarter of 2005 and $17 million for the second quarter of 2004. Higher earnings for both 2005 periods were attributable to disciplined expense control, improved operating leverage, and strong performance from key PFPC business units, as well as reduced intercompany debt financing costs. PFPCs accounting/administration net fund assets increased 15% and custody fund assets increased 11% as of June 30, 2005 compared with the balances at June 30, 2004. The increases were driven by new business and asset inflows from existing customers, as well as comparatively favorable market conditions.
Other
For the first six months of 2005, Other reported a net loss of $46 million compared with earnings of $6 million for the first six months of 2004. The decrease from the first half of 2004 reflected the impact of Riggs acquisition integration costs totaling $19 million after-tax in 2005 and $35 million of net securities losses in 2005 compared with $29 million of net securities gains in the prior year first half. In addition, Other for the first half of 2004 included the impact of the $22 million after-tax gain on the sale of our modified coinsurance contracts. These factors were partially offset by the benefit of the $45 million deferred tax liability reversal related to our investment in BlackRock in the first quarter of 2005, as described further above under Summary Financial Results.
Other for the second quarter of 2005 reflected a net loss of $85 million compared with a net loss of $12 million in the second quarter of 2004. Second quarter 2005 results include the impact of the nonrecurring Riggs costs referred to above. In addition, the higher net loss compared with the second quarter of 2004 reflected $26 million in net securities losses in the 2005 quarter compared with $14 million of net securities gains a year ago, as well as lower equity management gains and lower trading revenue in the 2005 quarter.
6
CONSOLIDATED INCOME STATEMENT REVIEW
NET INTEREST INCOME AND NET INTEREST MARGIN
Changes in net interest income and margin result from the interaction of the volume and composition of interest-earning assets and related yields, interest-bearing liabilities and related rates paid, and noninterest-bearing sources.
See Statistical Information-Average Consolidated Balance Sheet And Net Interest Analysis included on pages 59 and 60 of this Report for additional information.
Taxable-equivalent net interest income totaled $1.053 billion for the first half of 2005 and $982 million for the first half of 2004. Taxable-equivalent net interest income totaled $541 million for the second quarter of 2005 compared with $485 million for the second quarter of 2004. The increase in taxable-equivalent net interest income in both comparisons reflected the impact of higher average interest-earning assets in 2005. Our Consolidated Financial Highlights section included in this Financial Review provides a reconciliation of net interest income as reported under GAAP to net interest income presented on a taxable-equivalent basis.
The net interest margin for the first six months of 2005 was 3.01% compared with 3.24% for the first six months of 2004. The following factors contributed to the decline in net interest margin:
| | An increase in the average rate paid on deposits of 78 basis points for the first half of 2005 compared with the first half of 2004. The average rate paid on money market accounts, the largest single component of interest-bearing deposits, increased 115 basis points, reflecting the increase in short-term interest rates that began in mid-2004. |
| | An increase in the average rate paid on borrowed funds of 115 basis points for the first six months of 2005 compared with the first six months of 2004. |
| | In the comparison, the yield on interest-earning assets increased only 52 basis points. |
| | Higher balances of trading assets, which negatively affected the overall yield on interest-earning assets. |
The net interest margin for the second quarter of 2005 was 3.00% compared with 3.18% for the second quarter of 2004. The following factors contributed to the decline in net interest margin:
| | An increase in the average rate paid on deposits of 90 basis points for the second quarter of 2005 compared with the second quarter of 2004. The average rate paid on money market accounts, the largest single component of interest-bearing deposits, increased 130 basis points, reflecting the increase in short-term interest rates that began in mid-2004. |
| | An increase in the average rate paid on borrowed funds of 127 basis points for the second quarter of 2005 compared with the year ago quarter. |
| | In the comparison, the yield on interest-earning assets increased only 69 basis points. |
| | Higher balances of trading assets. |
In both the first half and second quarter comparisons, the factors outlined above more than offset the effect of higher average yields on securities and loans and the increased benefit of noninterest-bearing sources of funds in 2005.
PROVISION FOR CREDIT LOSSES
The provision for credit losses decreased $39 million, to a negative provision of $19 million, for the first half of 2005 compared with the first half of 2004. For the second quarter of 2005, the provision for credit losses declined $35 million compared with the prior year quarter. The decline in the provision for credit losses in both comparisons was primarily due to a $53 million loan recovery in the second quarter of 2005 resulting from a litigation settlement, in addition to continued improvement in asset quality. The improved credit quality reflected both a decline in nonperforming loans and a reduction in problems related to performing credits. The favorable impact of these factors on the provision was partially offset by the impact of total average loan growth in both the first six months and second quarter of 2005 compared with the respective prior year periods.
We expect loan growth to continue to impact the provision during the remainder of 2005. See Allowance for Loan And Lease Losses And Unfunded Loan Commitments And Letters Of Credit in the Credit Risk Management portion of the Risk Management section of this Financial Review for additional information regarding factors impacting the provision for credit losses.
NONINTEREST INCOME
Summary
Noninterest income was $1.898 billion for the first six months of 2005 compared with $1.821 billion for the first six months of 2004. For the second quarter of 2005, noninterest income totaled $925 million compared with $910 million for the second quarter of 2004. Noninterest income in both comparisons with 2004 benefited from higher asset management fees primarily due to BlackRocks acquisition of SSRM in early 2005, along with higher fund servicing fees, consumer services fees and service charges on deposits. These improvements were partially offset by lower corporate services revenue, lower other noninterest income, and net securities losses in the 2005 periods compared with net securities gains in the corresponding 2004 periods. In addition, noninterest income for the second quarter of 2005 was negatively impacted by a decline in equity management gains compared with the second quarter of 2004.
Noninterest income for the first half of 2004 included the following pretax gains:
| | A first quarter $34 million gain related to the sale of our modified coinsurance contracts, |
| | A second quarter $13 million gain recognized in connection with BlackRocks sale of its interest in Trepp LLC, and |
| | A first quarter $10 million gain related to the sale of certain investment consulting activities of the Hawthorn unit of PNC Advisors. |
Our 2004 Form 10-K more fully describes these three transactions.
Additional analysis
Combined asset management and fund servicing fees amounted to $1.087 billion for the first half of 2005 compared
7
with $909 million for the first half of 2004. For the second quarter of 2005, combined asset management and fund servicing fees were $553 million compared with $452 million in the prior year second quarter. The increases in both comparisons reflected the impact of the first quarter 2005 SSRM acquisition and other growth in assets managed and serviced.
Assets under management at June 30, 2005 totaled $456 billion compared with $350 billion at June 30, 2004. The acquisition of SSRM added $50 billion of assets under management during the first quarter of 2005. PFPC provided fund accounting/administration services for $766 billion of net fund investment assets and provided custody services for $462 billion of fund investment assets at June 30, 2005, compared with $665 billion and $416 billion, respectively, at June 30, 2004. These increases were driven by new business and asset inflows from existing customers, as well as comparatively favorable market conditions.
Service charges on deposits increased $4 million for both the first six months and second quarter of 2005 compared with the corresponding prior year periods. Although growth in service charges has been limited due to our offering of free checking in both the consumer and small business channels, free checking has positively impacted customer demand and demand deposit growth as well as other consumer related fees.
Brokerage fees declined slightly in the first half of 2005 compared with the year ago first half primarily due to weaker retail trading and were essentially flat for the second quarter of 2005 compared with the second quarter of 2004.
Consumer services fees increased $10 million, to $140 million, in the first six months of 2005 compared with the first six months of 2004. For the second quarter of 2005, consumer services fees increased $7 million compared with the prior year second quarter. Higher fees in both comparisons reflected additional fees from debit card transactions primarily due to higher volumes, partially offset by the impact of the sale of certain out-of-footprint ATMs. In addition, the increase during the second quarter of 2005 reflected the impact of Riggs.
Corporate services revenue declined $29 million for the first half of 2005 compared with the prior year first half and decreased $11 million for the second quarter of 2005 compared with the second quarter of 2004. These declines reflected lower net gains in excess of valuation adjustments related to our liquidation of institutional loans held for sale, which declined $41 million in the first half comparison and $15 million in the second quarter comparison. Our liquidation of institutional loans held for sale is essentially complete. These decreases were partially offset by the impact of higher fees in both 2005 comparisons related to commercial mortgage servicing activities and, in the six-month comparison, by higher capital markets revenues.
Equity management (private equity) net gains on portfolio investments totaled $44 million for the first six months of 2005 and $42 million for the first six months of 2004. Such gains totaled $12 million for the second quarter of 2005 compared with $35 million for the second quarter of 2004.
Net securities losses amounted to $35 million for the first half of 2005 compared with net securities gains of $29 million in the first half of 2004. For the second quarter of 2005, net securities losses totaled $26 million, compared with net securities gains of $14 million in the prior year quarter. Our discussion under the Consolidated Balance Sheet Review section of this Report of actions taken during the second quarter of 2005 regarding our securities portfolio provides additional information on the 2005 net securities losses.
Other noninterest income decreased $22 million, to $200 million, in the first six months of 2005 compared with the first six months of 2004. Other noninterest income for the first half of 2005 included a $10 million settlement received in connection with a PFPC contractual matter during the first quarter of 2005 and an $8 million increase in trading revenue compared with the prior year first half. These factors were more than offset by the impact of the gains related to the three 2004 sale transactions described under the Summary section above.
Other noninterest income declined $24 million in the second quarter of 2005 compared with the second quarter of 2004. The $13 million pretax gain related to the Trepp LLC sale in 2004 referred to above impacted the second quarter comparison. Other noninterest income typically fluctuates from period to period depending on the nature and magnitude of transactions completed.
PRODUCT REVENUE
Wholesale Banking offers treasury management and capital markets-related products and services, commercial loan servicing and equipment leasing products that are marketed by several businesses across PNC.
Treasury management revenue, which includes fees as well as revenue from customer deposit balances, totaled $200 million for the first six months of 2005 and $179 million for the first six months of 2004. For the second quarter of 2005, revenue totaled $103 million compared with $91 million in the second quarter of 2004. The increased revenue in both 2005 periods reflected the longer term nature of treasury management deposits along with the rising interest rate environment, strong deposit growth, continued expansion and client utilization of commercial card services and a steady increase in business-to-business processing volumes.
Consolidated revenue from capital markets was $71 million for the first half of 2005, an increase of $2 million compared with the first half of 2004. Increases in loan syndication fees and client-related trading revenue drove the increase in capital markets revenue for the first half of 2005 compared with the prior year first half. Consolidated revenue from capital markets totaled $29 million for the second quarter of 2005 and $37 million for the prior year second quarter. This decline was driven by lower trading results.
Midland Loan Services offers servicing and technology solutions for the commercial real estate finance industry. Midlands revenue, which includes fees as well as revenue from servicing deposit balances, totaled $59 million for the first six months of 2005 and $51 million for the first six months of 2004. Midlands revenue totaled $29 million for the second quarter of 2005 compared with $26 million for the second quarter of 2004. The revenue growth was driven primarily by growth in the commercial mortgage servicing portfolio and related services.
8
Consolidated revenue from equipment leasing products was $36 million for the first half of 2005 and $42 million for the first half of 2004. The decline was due to the interest cost of funding the potential tax exposure on the cross-border leasing portfolio. See Cross-Border Leases and Related Tax and Accounting Matters in the Consolidated Balance Sheet Review section of this Financial Review for further information. For the second quarter of 2005, consolidated revenue from equipment leasing products was $18 million compared with $21 million in the prior year quarter.
As a component of our advisory services to clients, we provide a select set of insurance products to fulfill specific customer financial needs. Primary insurance offerings include:
| | Annuities, |
| | Credit life, |
| | Health, |
| | Disability, and |
| | Commercial lines coverage. |
Client segments served by these insurance solutions include those in PNC Advisors, Regional Community Banking and Wholesale Banking. Insurance products are sold by PNC-licensed insurance agents and through licensed third-party arrangements. We recognized revenue from these products of $31 million in the first six months of 2005 and $33 million in the first six months of 2004. Revenue for the second quarter of 2005 totaled $17 million compared with $18 million for the second quarter of 2004.
Additionally, through our subsidiary companies, PNC Insurance Corp. and Alpine Indemnity Limited, we act as a reinsurer for consumer credit insurance provided to customers of our subsidiaries. We also write, assume and cede insurance for property, workers compensation, commercial general liability and automobile liability of PNC and its affiliates.
In the normal course of business PNC Insurance Corp. and Alpine Indemnity Limited maintain insurance reserves for reported claims and for claims incurred but not reported based on actuarial assessments.
NONINTEREST EXPENSE
Year-to-date June 30, 2005 and 2004
Total noninterest expense was $2.035 billion for the first six months of 2005, an increase of $230 million compared with the first six months of 2004. The efficiency ratio was 69% for the first half of 2005 compared with 65% for the first half of 2004.
Noninterest expense for the first six months of 2005 included the following:
| | An increase of $137 million in BlackRock operating expenses that reflected the impact of costs associated with the first quarter 2005 SSRM acquisition and charges related to the BlackRock LTIP awards. See the discussion under the heading 2002 BlackRock Long-Term Retention and Incentive Plan in this Financial Review for additional information on the latter expenses; and |
| | Costs totaling approximately $40 million resulting from our second quarter acquisition of Riggs, including approximately $15 million of integration costs. The impact of these costs was reflected in several noninterest expense line items in the Consolidated Income Statement. |
Noninterest expense for the first six months of 2004 included the following:
| | Conversion-related and other nonrecurring costs totaling approximately $11 million related to our acquisition of United National Bancorp, Inc. (United National); |
| | Expenses totaling $8 million in connection with the sale of our vehicle leasing business; and |
| | A $6 million impairment charge on an intangible asset related to the orderly liquidation of a particular fund managed by BlackRock. |
Apart from the impact of the items described above, noninterest expense increased $78 million, or 4%, in the first half of 2005 compared with the same period in 2004. The higher expenses were driven by increased sales incentives and the increased impact of expensing stock options. See Note 1 Accounting Policies in our Notes To Consolidated Financial Statements under Item 1 of this Report for additional information on our accounting for employee and director stock options.
Average full-time equivalent employees totaled approximately 24,100 in the first six months of 2005 and 23,700 for the first six months of 2004. This increase was primarily attributable to increases related to our Riggs acquisition and BlackRocks acquisition of SSRM, partially offset by a decline in other Regional Community Banking businesses.
Second quarter 2005 and 2004
Total noninterest expense was $1.036 billion for the second quarter of 2005 and $910 million for the second quarter of 2004. The efficiency ratio was 71% for the second quarter of 2005 compared with 65% for the prior year quarter.
Noninterest expense for the second quarter of 2005 included the Riggs-related expenses totaling $38 million described above, $17 million of LTIP charges and $50 million of increases in BlackRock operating expenses, while expenses for the second quarter of 2004 included $8 million in connection with the sale of our vehicle leasing business in that period. Apart from the impact of these items, noninterest expense for the second quarter of 2005 increased $29 million, or 3%, over the prior year second quarter.
We expect noninterest expense for the remainder of 2005 to include implementation costs related to the One PNC initiative.
EFFECTIVE TAX RATE
Our effective tax rate for the first half of 2005 was 29.4% compared with 33.1% for the first half of 2004. The decrease in the effective rate for the first six months of 2005 was primarily attributable to the impact of the reversal of deferred tax liabilities in connection with the transfer of our ownership in BlackRock to our intermediate bank holding company. This transaction reduced our first quarter 2005 tax provision by $45 million, or $.16 per diluted share. See Note 2 Acquisitions included in the Notes To Consolidated Financial Statements in Item 1 of this Report for additional information. The effective tax rate for the first six months of 2004 was favorably impacted by the $9 million tax benefit recorded in the first quarter of 2004 as a result of resolving a BlackRock New York State audit.
For the second quarter of 2005, our effective tax rate was 35.3% compared with 33.4% for the second quarter of 2004. The second quarter 2005 effective tax rate reflects a $6 million increase in deferred state income taxes, net of the federal income tax benefit, related to the Riggs acquisition.
9
CONSOLIDATED BALANCE SHEET REVIEW
BALANCE SHEET DATA
| In millions |
June 30 2005 |
December 31 2004 |
||||
| Assets |
||||||
| Loans, net of unearned income |
$ | 49,317 | $ | 43,495 | ||
| Securities available for sale and held to maturity |
20,437 | 16,761 | ||||
| Loans held for sale |
2,275 | 1,670 | ||||
| Other |
18,765 | 17,797 | ||||
| Total assets |
$ | 90,794 | $ | 79,723 | ||
| Liabilities |
||||||
| Funding sources |
$ | 76,879 | $ | 65,233 | ||
| Other |
5,165 | 6,513 | ||||
| Total liabilities |
82,044 | 71,746 | ||||
| Minority and noncontrolling interests in consolidated entities |
507 | 504 | ||||
| Total shareholders equity |
8,243 | 7,473 | ||||
| Total liabilities, minority and noncontrolling interests, and shareholders equity |
$ | 90,794 | $ | 79,723 | ||
Our Consolidated Balance Sheet is presented in Part I, Item 1 on page 39 of this Report.
Higher total assets at June 30, 2005 compared with the balance at December 31, 2004 were driven by the impact of the Riggs acquisition, loan growth resulting from continued improvements in market loan demand and higher securities balances that reflected short-term investing opportunities.
An analysis of changes in certain balance sheet categories follows.
LOANS, NET OF UNEARNED INCOME
Loans increased $5.8 billion, to $49.3 billion at June 30, 2005, compared with the balance at December 31, 2004. The impact of our Riggs acquisition added $2.8 billion of loans as of June 30, 2005. Improvements in market loan demand, in addition to targeted sales efforts across our banking businesses, drove the increase in total loans.
Details Of Loans
| In millions |
June 30 2005 |
December 31 2004 |
||||||
| Commercial |
||||||||
| Retail/wholesale |
$ | 5,295 | $ | 4,961 | ||||
| Manufacturing |
4,498 | 3,944 | ||||||
| Other service providers |
2,198 | 1,787 | ||||||
| Real estate related |
2,520 | 2,104 | ||||||
| Financial services |
1,374 | 1,145 | ||||||
| Health care |
671 | 560 | ||||||
| Other |
3,447 | 2,937 | ||||||
| Total commercial |
20,003 | 17,438 | ||||||
| Commercial real estate |
||||||||
| Real estate projects |
2,030 | 1,460 | ||||||
| Mortgage |
806 | 520 | ||||||
| Total commercial real estate |
2,836 | 1,980 | ||||||
| Equipment lease financing |
3,668 | 3,907 | ||||||
| Total commercial lending |
26,507 | 23,325 | ||||||
| Consumer |
||||||||
| Home equity |
13,531 | 12,734 | ||||||
| Automobile |
874 | 836 | ||||||
| Other |
2,165 | 2,036 | ||||||
| Total consumer |
16,570 | 15,606 | ||||||
| Residential mortgage |
6,508 | 4,772 | ||||||
| Vehicle lease financing |
124 | 189 | ||||||
| Other |
455 | 505 | ||||||
| Unearned income |
(847 | ) | (902 | ) | ||||
| Total, net of unearned income |
$ | 49,317 | $ | 43,495 | ||||
| Supplement Loan Information |
||||||||
| Loans excluding conduit |
$ | 47,125 | $ | 41,243 | ||||
| Market Street Funding Corporation conduit |
2,192 | 2,252 | ||||||
| Total loans |
$ | 49,317 | $ | 43,495 | ||||
As the table above indicates, the loans that we hold continued to be diversified among numerous industries and types of businesses. The loans that we hold are also diversified across the geographic areas where we do business.
Commercial Lending Exposure (a)(b)
|
June 30 2005 |
December 31 2004 |
|||||
| Investment grade or equivalent |
||||||
| $50 million or greater |
17 | % | 16 | % | ||
| $25 million to < $50 million |
16 | % | 16 | % | ||
| <$25 million |
16 | % | 15 | % | ||
| Non-investment grade |
||||||
| $50 million or greater |
2 | % | 2 | % | ||
| $25 million to < $50 million |
12 | % | 11 | % | ||
| <$25 million |
37 | % | 40 | % | ||
| Total |
100 | % | 100 | % | ||
| (a) | These statistics exclude the loans of Market Street Funding Corporation. The facilities extended by Market Street represent pools of granular obligations, structured to avoid excessive concentration of credit risk such that they attract an investment grade rating. |
| (b) | Exposure represents the sum of all loans, leases, commitments and letters of credit. |
Commercial loans are the largest category of credits and are the most sensitive to changes in assumptions and judgments underlying the determination of the allowance for loan and lease losses. We have allocated approximately $523 million, or 83%, of the total allowance for loan and lease losses at June 30, 2005 to the commercial loan category. This allocation also considers other relevant factors such as:
| | Actual versus estimated losses, |
| | Regional and national economic conditions, |
| | Business segment and portfolio concentrations, |
10
| | Industry competition and consolidation, |
| | The impact of government regulations, and |
| | Risk of potential estimation or judgmental errors, including the accuracy of risk ratings. |
Net Unfunded Credit Commitments
| In millions |
June 30 2005 |
December 31 2004 |
||||
| Commercial |
$ | 22,887 | $ | 20,969 | ||
| Consumer |
8,900 | 7,655 | ||||
| Commercial real estate |
2,206 | 1,199 | ||||
| Other |
384 | 483 | ||||
| Total |
$ | 34,377 | $ | 30,306 | ||
Commitments to extend credit represent arrangements to lend funds or provide liquidity subject to specified contractual conditions. Commercial commitments are reported net of participations, assignments and syndications, primarily to financial institutions, totaling $6.5 billion at June 30, 2005 and $6.7 billion at December 31, 2004.
The increase in consumer net unfunded commitments at June 30, 2005 compared with the balance at December 31, 2004 was primarily due to net unfunded commitments related to growth in home equity loans.
Unfunded credit commitments related to Market Street Funding Corporation totaled $906 million at June 30, 2005 and $962 million at December 31, 2004 and are included in the preceding table primarily within the Commercial and Consumer categories. See the Off-Balance Sheet Arrangements And Consolidated VIEs section of this Financial Review and Note 7 Variable Interest Entities in the Notes To Consolidated Financial Statements in Part I, Item 1 of this Report for further information regarding Market Street.
In addition to credit commitments, our net outstanding standby letters of credit totaled $3.7 billion at both June 30, 2005 and December 31, 2004. Standby letters of credit commit us to make payments on behalf of our customers if specified future events occur.
Cross-Border Leases and Related Tax and Accounting Matters
The equipment lease portfolio totaled $3.7 billion at June 30, 2005 and included approximately $1.7 billion of cross-border leases. Cross-border leases are primarily leveraged leases of equipment located in foreign countries, primarily in western Europe and Australia. We no longer enter into cross-border lease transactions.
Aggregate residual value at risk on the total commercial lease portfolio at June 30, 2005 was $1.1 billion. We have taken steps to mitigate $.6 billion of this residual risk, including residual value insurance coverage with third parties, third party guarantees, and other actions. Approximately $.5 billion of this risk was unmitigated at June 30, 2005.
The American Jobs Creation Act of 2004 (AJCA) limits the tax deductions that may be taken in a given year related to certain lease transactions, including the types of cross-border lease transactions that we have previously entered into. However, AJCA impacts only cross-border lease transactions entered into after March 12, 2004. All of our cross-border lease transactions were entered into prior to this date and are therefore not affected by AJCA. While only transactions entered into after March 12, 2004 are specifically impacted, AJCA is clear that no inference should be drawn as to the proper tax treatment of transactions entered into on or before this date. Thus, the tax treatment of existing transactions is still subject to challenge by the IRS.
Upon completing examination of our 1998-2000 consolidated federal income tax returns, on June 20, 2005 the IRS provided us with an examination report which proposes increases in our tax liability, principally arising from adjustments to several of our cross-border lease transactions.
The proposed adjustments would reverse the tax treatment of these transactions as we reported them on our filed tax returns. We believe the method we used to report these transactions is supported by appropriate tax law and have filed a protest of the IRS examination findings with the IRS appeals office. While we cannot predict with certainty the result of filing the protest, any resolution would most likely involve a change in the timing of tax deductions which, in turn, depending on the exact resolution, could significantly impact the economics of these transactions. The IRS is also beginning an audit of our 2001-2003 consolidated federal income tax returns. We expect them to again make adjustments to the cross-border lease transactions referred to above as well as to new cross-border lease transactions entered in those years. We believe our reserves for these exposures were adequate at June 30, 2005.
Further, the Financial Accounting Standards Board (FASB) has issued a proposed staff position to consider whether any change in the timing of tax benefits associated with these types of transactions should result in a recalculation under SFAS 13, Accounting for Leases, and whether a lessor should re-evaluate the classification of a leveraged lease when a recalculation of the lease is performed. If the FASB ultimately adopts the guidance as proposed, a cumulative adjustment in the period of change which could be material and future adjustments to earnings could be required. However, under the leverage leasing accounting rules, any reductions in earnings would be recovered in future years over the remaining lives of the leases.
In addition to the transactions referred to above, three lease-to-service contract transactions that we were party to were structured as partnerships for tax purposes. These partnerships are under audit by the IRS. However, we do not believe that our exposure from these transactions is material to our consolidated results of operations or financial position.
11
SECURITIES
Details Of Securities
| In millions |
Amortized Cost |
Fair Value |
||||
| June 30, 2005 (a) |
||||||
| SECURITIES AVAILABLE FOR SALE |
||||||
| Debt securities |
||||||
| U.S. Treasury and government agencies |
$ | 4,363 | $ | 4,353 | ||
| Mortgage-backed |
12,921 | 12,851 | ||||
| Commercial mortgage-backed |
1,325 | 1,330 | ||||
| Asset-backed |
1,468 | 1,465 | ||||
| State and municipal |
169 | 170 | ||||
| Other debt |
99 | 99 | ||||
| Corporate stocks and other |
169 | 169 | ||||
| Total securities available for sale |
$ | 20,514 | $ | 20,437 | ||
| December 31, 2004 |
||||||
| SECURITIES AVAILABLE FOR SALE |
||||||
| Debt securities |
||||||
| U.S. Treasury and government agencies |
$ | 4,735 | $ | 4,722 | ||
| Mortgage-backed |
8,506 | 8,433 | ||||
| Commercial mortgage-backed |
1,380 | 1,370 | ||||
| Asset-backed |
1,910 | 1,901 | ||||
| State and municipal |
175 | 176 | ||||
| Other debt |
33 | 33 | ||||
| Corporate stocks and other |
123 | 125 | ||||
| Total securities available for sale |
$ | 16,862 | $ | 16,760 | ||
| SECURITIES HELD TO MATURITY |
||||||
| Debt securities |
||||||
| Asset-backed |
$ | 1 | $ | 1 | ||
| Total securities held to maturity |
$ | 1 | $ | 1 | ||
| (a) | Securities held to maturity at June 30, 2005 were less than $1 million. |
Securities represented 23% of total assets at June 30, 2005 and 21% of total assets at December 31, 2004. The increase in total securities compared with December 31, 2004 was primarily due to the acquisition of Riggs and normal portfolio activity.
At June 30, 2005, the securities available for sale balance included a net unrealized loss of $77 million, which represented the difference between fair value and amortized cost. The comparable amount at December 31, 2004 was a net unrealized loss of $102 million. The decrease in the net unrealized loss at June 30, 2005 reflected the sales of securities during the second quarter of 2005 as discussed below and the change in portfolio mix, partially offset by the impact of increases in interest rates during the first six months of 2005.
We evaluate our portfolio of securities available for sale in light of changing market conditions and other factors and, where appropriate, take steps intended to improve our overall positioning.
During April 2005, the front-end of the yield curve rallied sharply. In our view, this market movement was not adequately reflective of a potential further rise in short-term interest rates given recent inflation trends and the expected Federal Open Market Committee tightening action on May 3, 2005.
As a result, in late April 2005, we performed a balance sheet review and decided to adjust our securities and other earning assets positions to address the following objectives:
| | Further reduce exposure to an anticipated rise in short-term interest rates, and |
| | Improve future net interest income levels without adding to duration risk. |
To achieve these objectives, in late April and early May 2005, we sold $2.1 billion of securities available for sale and terminated $1.0 billion of resale agreements that were most sensitive to extension risk due to rising short-term interest rates. We also purchased $2.1 billion of securities with higher yields and lower extension risk. These transactions resulted in realized net securities and other losses of approximately $31 million, which are included in our results of operations for the second quarter and first six months of 2005.
The fair value of securities available for sale decreases when interest rates increase and vice versa. Further increases in interest rates after June 30, 2005, if sustained, will adversely impact the fair value of securities available for sale going forward compared with the balance at June 30, 2005. Net unrealized gains and losses in the securities available for sale portfolio are included in shareholders equity as accumulated other comprehensive income or loss, net of tax.
The expected weighted-average life of securities available for sale was 3 years at June 30, 2005 and 2 years and 8 months at December 31, 2004.
We estimate that the effective duration of securities available for sale is 2.1 years for an immediate 50 basis points parallel increase in interest rates and 1.7 years for an immediate 50 basis points parallel decrease in interest rates.
LOANS HELD FOR SALE
Education loans held for sale totaled $1.5 billion at June 30, 2005 and $1.1 billion at December 31, 2004 and represented the majority of our loans held for sale at each date. We classify substantially all of our education loans as loans held for sale. Generally, we sell education loans when the loans are placed into repayment status. Gains on sales of education loans are reflected in the Other noninterest income line item in our Consolidated Income Statement and in the results for the Regional Community Banking business segment.
Our liquidation of institutional loans held for sale resulted in net gains in excess of valuation adjustments of $2 million in the second quarter of 2005 and $4 million for the first six months of 2005. The corresponding amounts for 2004 were $17 million and $45 million. These gains are reflected in the Corporate Services line item in our Consolidated Income Statement and in the results of the Wholesale Banking business segment. As the liquidation of institutional loans held for sale is essentially complete, any additional gains or losses in the future will be minimal.
OTHER ASSETS
The increase of $1.0 billion in Assets-Other in the preceding Balance Sheet Data table includes the impact of an increase in goodwill and other intangible assets. Goodwill and other intangible assets recognized in connection with the Riggs acquisition totaled $498 million. Goodwill and other intangible assets recorded in connection with the SSRM acquisition totaled $316 million. See Note 6 Goodwill And Other Intangible Assets in the Notes To Consolidated Financial Statements for further information.
12
CAPITAL AND FUNDING SOURCES
Details Of Funding Sources
| In millions |
June 30 2005 |
December 31 2004 |
||||
| Deposits |
||||||
| Money market |
$ | 23,031 | $ | 21,250 | ||
| Demand |
16,419 | 15,996 | ||||
| Retail certificates of deposit |
11,714 | 9,969 | ||||
| Savings |
2,719 | 2,851 | ||||
| Other time |
2,707 | 833 | ||||
| Time deposits in foreign offices |
2,083 | 2,370 | ||||
| Total deposits |
58,673 | 53,269 | ||||
| Borrowed funds |
||||||
| Federal funds purchased |
2,701 | 219 | ||||
| Repurchase agreements |
2,042 | 1,376 | ||||
| Bank notes and senior debt |
2,920 | 2,383 | ||||
| Subordinated debt |
4,105 | 4,050 | ||||
| Commercial paper |
3,998 | 2,251 | ||||
| Other borrowed funds |
2,440 | 1,685 | ||||
| Total borrowed funds |
18,206 | 11,964 | ||||
| Total |
$ | 76,879 | $ | 65,233 | ||
Various seasonal and other factors impact our period-end deposit balances whereas average balances (discussed under Balance Sheet Highlights above) are more indicative of underlying business trends. The increase in deposits as of June 30, 2005 reflected the impact of the Riggs acquisition, which added $3.5 billion, including $.8 billion of brokered certificates of deposit, as well as sales and retention efforts related to core deposits.
Higher borrowed funds at June 30, 2005 were driven in part by the following:
| | The issuance of $1 billion of Federal Home Loan Bank advances in June 2005, |
| | Our issuance of $700 million of senior debt and $350 million of senior bank notes in March 2005, |
| | BlackRocks $250 million convertible debenture issuance in February 2005 in connection with its SSRM acquisition, |
| | The assumption of approximately $345 million of subordinated debt with the acquisition of Riggs, and |
| | Higher short-term borrowings to fund asset growth. |
These factors were partially offset by maturities of $750 million of senior bank notes and $350 million of subordinated debt during the second quarter of 2005.
Capital
We manage our capital position by making adjustments to our balance sheet size and composition, issuing debt and equity instruments, making treasury stock transactions, maintaining dividend policies and retaining earnings.
The increase of $.8 billion in total shareholders equity at June 30, 2005 compared with December 31, 2004 reflected the impact of earnings and the issuance of shares from treasury in connection with the Riggs acquisition.
Common shares outstanding at June 30, 2005 were 290.5 million, an increase of 7.9 million over December 31, 2004. We issued approximately 6.6 million shares of common stock during the second quarter of 2005 in connection with the Riggs acquisition.
We did not purchase any common shares during the second quarter of 2005 under our current common stock repurchase program. During the first half of 2005, we purchased .5 million common shares at a total cost of $26 million under both our prior and current common stock repurchase programs. Our current program will remain in effect until fully utilized or until modified, superseded or terminated. The extent and timing of additional share repurchases under this program will depend on a number of factors including, among others, market and general economic conditions, economic and regulatory capital considerations, alternative uses of capital, and the potential impact on our credit rating. The impact on our capital of the Riggs and SSRM acquisitions has restricted and will continue to restrict share purchases over the next several quarters.
Risk-Based Capital
| Dollars in millions |
June 30 2005 |
December 31 2004 |
||||||
| Capital components |
||||||||
| Shareholders equity |
||||||||
| Common |
$ | 8,235 | $ | 7,465 | ||||
| Preferred |
8 | 8 | ||||||
| Trust preferred capital securities (a) |
1,417 | 1,194 | ||||||
| Minority interest |
288 | 226 | ||||||
| Goodwill and other intangibles |
(3,893 | ) | (3,112 | ) | ||||
| Net unrealized securities losses |
50 | 66 | ||||||
| Net unrealized gains on cash flow hedge derivatives |
(5 | ) | (6 | ) | ||||
| Equity investments in nonfinancial companies |
(45 | ) | (32 | ) | ||||
| Other, net |
(15 | ) | (15 | ) | ||||
| Tier 1 risk-based capital |
6,040 | 5,794 | ||||||
| Subordinated debt |
1,886 | 1,924 | ||||||
| Eligible allowance for credit losses |
713 | 683 | ||||||
| Total risk-based capital |
$ | 8,639 | $ | 8,401 | ||||
| Assets |
||||||||
| Risk-weighted assets, including off-balance sheet instruments and market risk equivalent assets |
$ | 72,900 | $ | 64,539 | ||||
| Adjusted average total assets |
83,686 | 75,757 | ||||||
| Capital ratios |
||||||||
| Tier 1 risk-based |
8.3 | % | 9.0 | % | ||||
| Total risk-based |
11.9 | 13.0 | ||||||
| Leverage |
7.2 | 7.6 | ||||||
| Tangible common |
5.0 | 5.7 | ||||||
| (a) | See Note 18 Capital Securities Of Subsidiary Trusts in the Notes To Consolidated Financial Statements in our 2004 Form 10-K regarding the deconsolidation of trust preferred securities at December 31, 2003 under GAAP. However, these securities remained a component of Tier 1 risk-based capital at June 30, 2005 and December 31, 2004 based upon guidance provided to bank holding companies from the Federal Reserve. |
The access to, and cost of, funding new business initiatives including acquisitions, the ability to engage in expanded business activities, the ability to pay dividends, the level of deposit insurance costs, and the level and nature of regulatory oversight depend, in part, on a financial institutions capital strength. The declines in the capital ratios at June 30, 2005 compared with the ratios at December 31, 2004 were primarily caused by the addition of goodwill and other intangibles associated with the Riggs and SSRM acquisitions. At June 30, 2005, each of our banking subsidiaries was considered well-capitalized based on regulatory capital ratio requirements.
13
OFF-BALANCE SHEET ARRANGEMENTS AND CONSOLIDATED VIES
We engage in a variety of activities that involve unconsolidated entities or that are otherwise not reflected in our Consolidated Balance Sheet that are generally referred to as off-balance sheet arrangements. Further information on these types of activities is included in Note 15 Commitments And Guarantees included in the Notes To Consolidated Financial Statements in Part I, Item 1 of this Report.
As discussed in our 2004 Form 10-K, we are involved with various entities in the normal course of business that may be deemed to be variable interest entities (VIEs). We consolidated certain VIEs effective in 2004 and 2003 for which we were determined to be the primary beneficiary. These consolidated VIEs and relationships with PNC are described in our 2004 Form 10-K under this same heading in Part I, Item 7 and in Note 2 Variable Interest Entities in the Notes To Consolidated Financial Statements included in Part II, Item 8 of that Report.
At June 30, 2005, the aggregate assets and debt of VIEs that we have consolidated in our financial statements are as follows:
Consolidated VIEs PNC Is Primary Beneficiary
| In millions |
Aggregate Assets |
Aggregate Debt |
||||
| June 30, 2005 |
||||||
| Market Street Funding Corporation |
$ | 2,550 | $ | 2,550 | ||
| Partnership interests in low income housing projects |
483 | 483 | ||||
| Other |
13 | 11 | ||||
| Total consolidated VIEs |
3,046 | 3,044 | ||||
| December 31, 2004 |
||||||
| Market Street Funding Corporation |
$ | 2,167 | $ | 2,167 | ||
| Partnership interests in low income housing projects |
504 | 504 | ||||
| Other |
13 | 10 | ||||
| Total consolidated VIEs |
$ | 2,684 | $ | 2,681 | ||
We also hold significant variable interests in other VIEs that have not been consolidated because we are not considered the primary beneficiary. Information on these VIEs follows:
Non-Consolidated VIEs - Significant Variable Interests
| In millions |
Aggregate Assets |
Aggregate Debt |
PNC Risk of Loss (b) |
||||||
| June 30, 2005 |
|||||||||
| Collateralized debt obligations (a) |
$ | 5,691 | $ | 5,211 | $ | 53 | |||
| Private investment funds (a) |
4,530 | 1,351 | 13 | ||||||
| Other partnership interests in low income housing projects |
37 | 28 | 4 | ||||||
| Total significant variable interests |
$ | 10,258 | $ | 6,590 | $ | 70 | |||
| December 31, 2004 |
|||||||||
| Collateralized debt obligations (a) |
$ | 3,152 | $ | 2,700 | $ | 33 | |||
| Private investment funds (a) |
1,872 | 125 | 24 | ||||||
| Other partnership interests in low income housing projects |
37 | 28 | 4 | ||||||
| Total significant variable interests |
$ | 5,061 | $ | 2,853 | $ | 61 | |||
| (a) | Held by BlackRock. |
| (b) | Includes both PNCs risk of loss and BlackRocks risk of loss, limited to PNCs ownership interest in BlackRock. |
The increase in collateralized debt obligations at June 30, 2005 compared with December 31, 2004 reflected the impact of BlackRocks first quarter 2005 acquisition of SSRM.
We also have subsidiaries that invest in and act as the investment manager for a private equity fund that is organized as a limited partnership as part of our equity management activities. The fund invests in private equity investments to generate capital appreciation and profits. As permitted by FASB Interpretation No. 46 (Revised 2003), Consolidation of Variable Interest Entities, we have deferred applying the provisions of the interpretation for this entity pending further action by the FASB. Information on this entity follows:
Investment Company Accounting Deferred Application
| In millions |
Aggregate Assets |
Aggregate Equity |
PNC Risk of Loss |
||||||
| Private Equity Fund |
|||||||||
| June 30, 2005 |
$ | 94 | $ | 94 | $ | 24 | |||
| December 31, 2004 |
$ | 78 | $ | 76 | $ | 20 | |||
14
We operate five major businesses engaged in providing banking, asset management and global fund processing services. Banking businesses include regional community banking (consumer/small business), wholesale banking (corporate/institutional) and wealth management.
Our treasury management activities, which include cash and investment management, receivables management, disbursement services, funds transfer services, information reporting, and global trade services; capital markets products, which include foreign exchange, derivatives, loan syndications, and securities underwriting and distribution; commercial loan servicing; and equipment leasing products are offered through Wholesale Banking and marketed by several businesses across PNC.
Results of individual businesses are presented based on our management accounting practices and our management structure. There is no comprehensive, authoritative body of guidance for management accounting equivalent to GAAP; therefore, the financial results of individual businesses are not necessarily comparable with similar information for any other company. We refine our methodologies from time to time as our management accounting practices are enhanced and our businesses change. Financial results are presented, to the extent practicable, as if each business operated on a stand-alone basis.
Our capital measurement methodology is based on the concept of economic capital for our banking businesses. However, we have increased the capital assigned to Regional Community Banking to 6% of funds to reflect the capital required for well-capitalized banks and to approximate market comparables for this business. The capital for BlackRock and PFPC reflects legal entity shareholders equity. BlackRocks capital is consistent with its separate public financial statement disclosures.
We have allocated the allowance for loan and lease losses and unfunded loan commitments and letters of credit based on our assessment of risk inherent in the loan portfolios. Our allocation of the costs incurred by operations and other support areas not directly aligned with the businesses is primarily based on the use of services.
Total business segment financial results differ from total consolidated results. The impact of these differences is primarily reflected in minority interest in income of BlackRock and in the Other category in the Results of Businesses Summary table that follows. Other includes residual activities that do not meet the criteria for disclosure as a separate reportable business, such as asset and liability management activities, related net securities gains or losses, equity management activities, differences between business segment performance reporting and financial statement reporting (GAAP), corporate overhead and intercompany eliminations. Business segment results, including inter-segment revenues, are included in Note 14 Business Segments included in the Notes To Consolidated Financial Statements under Part I, Item 1 of this Report.
Other Information included in the tables that follow is presented as of period end, except for the following, which represent amounts for the periods presented: net charge-offs and the related annualized net charge-off ratio; home equity portfolio credit statistics; gains on sales of education loans; average small business deposits; consolidated revenue from Treasury management, Capital markets, Midland Loan Services and Equipment leasing; and average full-time equivalent employees (FTEs). FTE statistics as reported by business reflect staff directly employed by the respective businesses and exclude corporate and shared services employees. Prior period FTE amounts generally are not restated for organizational changes.
RESULTS OF BUSINESSES - SUMMARY
|
Earnings |
Revenue |
Return on Capital (b) |
Average Assets (c) |
||||||||||||||||||||||||
| Six months ended June 30 - dollars in millions |
2005 |
2004 |
2005 |
2004 |
2005 |
2004 |
2005 |
2004 |
|||||||||||||||||||
| Banking businesses |
|||||||||||||||||||||||||||
| Regional Community Banking |
$ | 258 | $ | 227 | $ | 1,057 | $ | 1,012 | 21 | % | 19 | % | $ | 23,745 | $ | 21,193 | |||||||||||
| Wholesale Banking |
254 | 235 | 635 | 639 | 30 | 27 | 25,138 | 21,979 | |||||||||||||||||||
| PNC Advisors |
53 | 58 | 315 | 324 | 38 | 37 | 2,907 | 2,698 | |||||||||||||||||||
| Total banking businesses |
565 | 520 | 2,007 | 1,975 | 26 | 24 | 51,790 | 45,870 | |||||||||||||||||||
| Asset management and fund processing businesses |
|||||||||||||||||||||||||||
| BlackRock |
100 | 103 | 521 | 366 | 24 | 28 | 1,563 | 966 | |||||||||||||||||||
| PFPC |
47 | 33 | 451 | 402 | 34 | 25 | 2,083 | 2,037 | |||||||||||||||||||
| Total asset management and fund processing businesses |
147 | 136 | 972 | 768 | 27 | 28 | 3,646 | 3,003 | |||||||||||||||||||
| Total business segment earnings |
712 | 656 | 2,979 | 2,743 | 26 | 24 | 55,436 | 48,873 | |||||||||||||||||||
| Minority interest in income of BlackRock |
(30 | ) | (30 | ) | |||||||||||||||||||||||
| Other |
(46 | ) | 6 | (28 | ) | 60 | 30,036 | 24,573 | |||||||||||||||||||
| Total consolidated (a) |
$ | 636 | $ | 632 | $ | 2,951 | $ | 2,803 | 17 | 18 | $ | 85,472 | $ | 73,446 | |||||||||||||
| (a) | Business revenue is presented on a taxable-equivalent basis except for PFPC, which is presented on a book (GAAP) basis. A reconciliation of total consolidated revenue on a book basis to total consolidated revenue on a taxable-equivalent basis follows: |
| Six months ended June 30 - in millions |
2005 |
2004 |
||||
| Total consolidated revenue, book (GAAP) basis |
$ | 2,938 | $ | 2,796 | ||
| Taxable-equivalent adjustment |
13 | 7 | ||||
| Total consolidated revenue, taxable-equivalent basis |
$ | 2,951 | $ | 2,803 | ||
| (b) | Percentages for BlackRock and PFPC reflect average return on equity. |
| (c) | Period-end balances for BlackRock and PFPC. |
15
| REGIONAL | COMMUNITY BANKING (Unaudited) |
| Six months ended June 30 |
2005 |
2004 |
||||||
| INCOME STATEMENT |
||||||||
| Net interest income |
$ | 708 | $ | 673 | ||||
| Noninterest income |
||||||||
| Service charges on deposits |
122 | 117 | ||||||
| Investment products |
57 | 58 | ||||||
| Other |
170 | 164 | ||||||
| Total noninterest income |
349 | 339 | ||||||
| Total revenue |
1,057 | 1,012 | ||||||
| Provision for credit losses |
30 | 35 | ||||||
| Noninterest expense |
||||||||
| Compensation and employee benefits |
264 | 266 | ||||||
| Net occupancy and equipment |
134 | 134 | ||||||
| Other |
217 | 219 | ||||||
| Total noninterest expense |
615 | 619 | ||||||
| Pretax earnings |
412 | 358 | ||||||
| Income taxes |
154 | 131 | ||||||
| Earnings |
$ | 258 | $ | 227 | ||||
| AVERAGE BALANCE SHEET |
||||||||
| Loans |
||||||||
| Consumer |
||||||||
| Home equity |
$ | 12,072 | $ | 10,106 | ||||
| Indirect |
904 | 805 | ||||||
| Other consumer |
410 | 607 | ||||||
| Total consumer |
13,386 | 11,518 | ||||||
| Commercial |
4,486 | 3,899 | ||||||
| Floor plan |
1,031 | 996 | ||||||
| Residential mortgage |
957 | 795 | ||||||
| Other |
26 | 27 | ||||||
| Total loans |
19,886 | 17,235 | ||||||
| Goodwill |
1,041 | 1,000 | ||||||
| Loans held for sale |
1,400 | 1,135 | ||||||
| Other assets |
1,418 | 1,823 | ||||||
| Total assets |
$ | 23,745 | $ | 21,193 | ||||
| Deposits |
||||||||
| Noninterest-bearing demand |
$ | 6,883 | $ | 6,355 | ||||
| Interest-bearing demand |
7,115 | 6,916 | ||||||
| Money market |
12,194 | 12,411 | ||||||
| Total transaction deposits |
26,192 | 25,682 | ||||||
| Savings |
2,697 | 2,528 | ||||||
| Certificates of deposit |
10,282 | 8,493 | ||||||
| Total deposits |
39,171 | 36,703 | ||||||
| Other liabilities |
131 | 312 | ||||||
| Capital |
2,479 | 2,363 | ||||||
| Total funds |
$ | 41,781 | $ | 39,378 | ||||
| PERFORMANCE RATIOS |
||||||||
| Return on capital |
21 | % | 19 | % | ||||
| Noninterest income to total revenue |
33 | 33 | ||||||
| Efficiency |
58 | 61 | ||||||
| Six months ended June 30 |
2005 |
2004 |
||||||
| OTHER INFORMATION |
||||||||
| Total nonperforming assets (a)(b) |
$ | 79 | $ | 81 | ||||
| Net charge-offs (b) |
$ | 30 | $ | 42 | ||||
| Annualized net charge-off ratio (b) |
.30 | % | .49 | % | ||||
| Home equity portfolio credit statistics: |
||||||||
| % of first lien positions |
51 | % | 51 | % | ||||
| Weighted average loan-to-value ratios |
71 | % | 71 | % | ||||
| Weighted average FICO scores |
719 | 717 | ||||||
| Loans 90 days past due |
.19 | % | .20 | % | ||||
| Gains on sales of education loans (c) |
$ | 4 | $ | 2 | ||||
| Average FTE staff |
10,037 | 10,317 | ||||||
| ATMs |
3,788 | 3,528 | ||||||
| Branches |
825 | 775 | ||||||
| Consumer and small business checking relationships |
1,860,000 | 1,700,000 | ||||||
| Consumer DDA households using online banking |
787,000 | 663,000 | ||||||
| % of consumer DDA households using online banking |
47 | % | 43 | % | ||||
| Consumer DDA households using online bill payment |
166,000 | 112,000 | ||||||
| % of consumer DDA households using online bill payment |
10 | % | 7 | % | ||||
| Small business deposits: |
||||||||
| Noninterest-bearing |
$ | 4,177 | $ | 3,832 | ||||
| Interest-bearing |
$ | 1,517 | $ | 1,583 | ||||
| Money market |
$ | 2,702 | $ | 2,609 | ||||
| Certificates of deposit |
$ | 352 | $ | 312 | ||||
| (a) | Includes nonperforming loans of $69 million at June 30, 2005 and $70 million at June 30, 2004. |
| (b) | During the first quarter of 2004, management changed its policy for recognizing charge-offs on smaller nonperforming commercial loans. This change resulted in the recognition of an additional $24 million of gross charge-offs for the first quarter of 2004. |
| (c) | Included in Noninterest income-Other above. |
Regional Community Banking earnings were $258 million for the first half of 2005 compared with $227 million for the first half of 2004. Continued organic customer growth and the Riggs acquisition have driven a growing balance sheet and a 4% revenue increase. These positive results combined with slightly lower expenses and a lower provision for credit losses drove the 14% increase in earnings over last year.
Highlights of the Regional Community Banks performance during the first half of 2005 include:
| | The addition of Riggs increased total checking relationships by 5% and expanded the branch network by an additional 51 locations in the greater Washington, D.C. market a new retail banking geography for PNC. |
| | The small business segment continued its positive momentum, as customer and balance sheet growth were both strong. Average commercial loans increased 15% over 2004 on the strength of increased demand from existing customers as well as the acquisition of new relationships. Small business deposits increased 5% over the same period as new checking relationships increased 9%. |
| | The consumer segment also exhibited solid growth over the first half of 2004 as new checking relationships increased nearly 10%, average demand deposits increased 6% and home equity loans increased 19%. |
16
| | Expenses decreased compared with the first half of 2004 including the additional Riggs expenses for a portion of the second quarter of 2005. The efficiency ratio improved for the first six months of 2005 to 58% from 61% in the comparable 2004 period. |
| | Credit quality indicators remain stable to improving in both the consumer and small business segments. |
Total revenue for the first half of 2005 was $1.057 billion compared with $1.012 billion for the same period last year. Taxable-equivalent net interest income of $708 million increased by $35 million or 5% compared with the first six months of 2004 due to a 7% increase in average deposits and a 15% increase in average loan balances. The net interest income growth has been somewhat mitigated by a narrower spread between loan yields and deposit costs.
Noninterest income increased $10 million or 3% compared with the first half of 2004 primarily driven by consumer checking related fees. The offering of free checking to both the consumer and small business segments has hindered this increase. Although it has reduced service charge fees, free checking has positively impacted customer demand and demand deposit growth. Other factors impacting noninterest income growth were lower investment products revenue from annuity sales and reductions in ATM surcharge revenue from changing customer behavior and a strategic decision to reduce the out-of-footprint ATM network.
The provision for credit losses decreased $5 million for the first six months of 2005 compared with the first six months of 2004 primarily due to a one-time impact in the first quarter 2004 associated with the decision to change the charge-off policy related to smaller nonperforming commercial loans. Overall credit quality remains stable as evidenced by the decline in nonperforming loans as a percentage of total loans to .35% as of June 30, 2005 compared with .41% at the same time last year. Provisions for loan charge-offs are expected to increase commensurate with loan growth for the remainder of the year.
Noninterest expenses in the first half of 2005 were $615 million, down $4 million compared with the first half of 2004. Excluding the $11 million in nonrecurring costs associated with the United National acquisition in 2004, expenses increased $7 million from 2004. Although integration costs for Riggs are recorded in Other for business segment reporting purposes, Regional Community Banking incurred $14 million of Riggs operating costs in the 2005 period. Excluding the impact of the Riggs expenses and the United National acquisition costs, noninterest expense decreased $7 million compared with the first half of 2004. Funding new business investments with expense saves will continue to be a priority. The build-out of our branch network and the expansion of our sales force will be areas targeted for investment.
We have adopted a relationship-based lending strategy to target specific customer segments (homeowners, small businesses and auto dealerships) while seeking to maintain a moderate risk profile in the loan portfolio.
| | Average home equity loans grew by $2.0 billion or 19% compared with the first half of 2004. The increase is attributable to $1.9 billion from organic loan growth and $.1 billion from the Riggs acquisition. We have noticed that consumer loan demand is starting to slow as a result of the rising rate environment. |
| | Average commercial loans have grown 15% on the strength of increased loan demand from existing small business customers and the acquisition of new relationships through our sales efforts. New loan volume in the small business segment increased 24% over the first half of 2004. |
| | Floor plan and indirect loan portfolios grew 4% and 12% respectively over 2004 levels due to managed increases in our dealer portfolio through new relationships. |
| | Residential mortgage loans increased $162 million or 20% primarily due to the addition of the Riggs portfolio. Continuing payoffs in our existing portfolio, which will continue throughout 2005, reduced the impact of the additional loans acquired from Riggs. |
Growth in core deposits as a lower cost funding source is one of the primary objectives of our checking relationship growth strategy. Average total deposits increased $2.5 billion or 7% compared with the first half of 2004. The deposit growth was driven by increases in the number of consumer and small business checking relationships (new customer acquisition and Riggs) and the recapture of consumer savings and certificate of deposit balances as interest rates have risen.
During this rising rate environment, we expect the rate of growth in demand deposit balances to be less than the rate of growth for customer checking relationships. Additionally, we expect to see customers shift their funds from lower interest-bearing deposits to higher yielding deposits or investment products. The shift was evident during the second quarter of 2005 and impacted the level of average demand deposits in that period.
| | Average demand deposit growth of $727 million or 5% was driven by a $454 million increase in the core business due to the continued growth in total checking relationships and the $273 million attributable to the Riggs acquisition. |
| | Small business checking relationship retention has improved while consumer retention remains steady and strong. Consumer relationship retention remains strong due to increased penetration rates of debit card, online banking and online bill payment products and services. |
| | Customer balances in other deposit products remained consistent while certificates of deposits increased $1.8 billion. This increase is attributable to the rising interest rate environment attracting customers back into this product. |
Regional Community Banking provides deposit, lending, cash management and investment services to 2.3 million consumer and small business customers within our primary geographic area. Products and services offered to our customers include:
| | Checking accounts |
| | Savings, money market and certificates of deposit |
| | Personal and business loans |
| | Cash management, collection and payment services, and |
| | Investment and insurance services |
17
WHOLESALE BANKING (Unaudited)
| Six months ended June 30 |
2005 |
2004 |
||||||
| INCOME STATEMENT |
||||||||
| Net interest income |
$ | 358 | $ | 335 | ||||
| Noninterest income |
||||||||
| Net commercial mortgage banking |
||||||||
| Net gains on loan sales |
27 | 24 | ||||||
| Servicing and other fees, net of amortization |
29 | 23 | ||||||
| Net gains on institutional loans held for sale |
4 | 45 | ||||||
| Other |
217 | 212 | ||||||
| Noninterest income |
277 | 304 | ||||||
| Total revenue |
635 | 639 | ||||||
| Provision for (recoveries of) credit losses |
(52 | ) | (5 | ) | ||||
| Noninterest expense |
335 | 324 | ||||||
| Pretax earnings |
352 | 320 | ||||||
| Noncontrolling interests in income of consolidated entities |
(22 | ) | (20 | ) | ||||
| Income taxes |
120 | 105 | ||||||
| Earnings |
$ | 254 | $ | 235 | ||||
| AVERAGE BALANCE SHEET |
||||||||
| Loans |
||||||||
| Corporate banking (a) |
$ | 10,680 | $ | 9,771 | ||||
| Commercial real estate |
1,974 | 1,806 | ||||||
| Commercial real estate related |
1,937 | 1,537 | ||||||
| PNC Business Credit |
4,177 | 3,698 | ||||||
| Total loans (a) |
18,768 | 16,812 | ||||||
| Loans held for sale |
646 | 489 | ||||||
| Other assets |
5,724 | 4,678 | ||||||
| Total assets |
$ | 25,138 | $ | 21,979 | ||||
| Deposits |
$ | 8,925 | $ | 6,837 | ||||
| Commercial paper |
2,148 | 1,963 | ||||||
| Other liabilities |
3,892 | 3,698 | ||||||
| Capital |
1,681 | 1,757 | ||||||
| Total funds |
$ | 16,646 | $ | 14,255 | ||||
| PERFORMANCE RATIOS |
||||||||
| Return on capital |
30 | % | 27 | % | ||||
| Noninterest income to total revenue |
44 | 48 | ||||||
| Efficiency |
53 | 51 | ||||||
| COMMERCIAL MORTGAGE SERVICING PORTFOLIO (in billions) |
||||||||
| Beginning of period |
$ | 98 | $ | 83 | ||||
| Acquisitions/additions |
35 | 18 | ||||||
| Repayments/transfers |
(14 | ) | (12 | ) | ||||
| End of period |
$ | 119 | $ | 89 | ||||
| OTHER INFORMATION |
||||||||
| Consolidated revenue from: (b) |
||||||||
| Treasury management |
$ | 200 | $ | 179 | ||||
| Capital markets |
$ | 71 | $ | 69 | ||||
| Midland Loan Services |
$ | 59 | $ | 51 | ||||
| Equipment leasing |
$ | 36 | $ | 42 | ||||
| Total loans (a) (c) |
$ | 20,726 | $ | 17,171 | ||||
| Total nonperforming assets (c) (d) |
$ | 77 | $ | 110 | ||||
| Net charge-offs (recoveries) |
$ | (56 | ) | $ | 46 | |||
| Average FTE staff |
3,139 | 2,962 | ||||||
| Net carrying amount of commercial mortgage servicing rights (c) |
$ | 276 | $ | 226 | ||||
| (a) | Reflects reclassification to loans of Market Street conduit purchased customer receivables. |
| (b) | Revenue includes net interest on loans and deposits and noninterest income. |
| (c) | Presented as of period-end. |
| (d) | Includes nonperforming loans of $57 million at June 30, 2005 and $85 million at June 30, 2004. |
Earnings from Wholesale Banking for the first half of 2005 totaled $254 million, an 8% increase over the first half of 2004. The higher earnings compared with a year ago was primarily attributable to the benefit of a higher negative provision for credit losses resulting from improved asset quality and a $53 million loan recovery recorded during the second quarter of 2005 and higher taxable-equivalent net interest income. This benefit was partially offset by lower net gains from institutional loans held for sale.
Highlights of the first half of 2005 for Wholesale Banking included:
| | Average loan balances increased $2.0 billion, or 12%, over the first half of 2004, driven by increased market demand and the Riggs acquisition. |
| | Average deposits increased $2.1 billion, or 31%, compared with the year-earlier period, driven by sales of treasury management products, a larger commercial mortgage servicing portfolio, and strong liquidity positions within our customer base. |
| | Nonperforming assets at June 30, 2005 declined 30% compared with June 30, 2004 and increased modestly since year-end 2004 despite a 15% increase in period-end loans. |
Taxable-equivalent net interest income for the first half of 2005 increased 7% compared with the previous year primarily as a result of higher loan balances primarily funded by higher deposits.
The provision for credit losses was a negative $52 million for the first six months of 2005 compared with a negative $5 million for the first half of 2004. The higher negative provision for the first half of 2005 resulted from the $53 million loan recovery as well as continued improvements in asset quality. While we do not expect credit quality to deteriorate markedly, we expect the provision for credit losses to increase throughout the remainder of 2005 as loan balances continue to rise.
Noninterest income for the first half of 2005 decreased 9% compared with the first half of 2004. The decrease was primarily attributable to a $41 million decrease in net gains on institutional loans held for sale. Because the liquidation of institutional loans held for sale is essentially complete, we do not expect significant additional gains or losses for the remainder of 2005. Apart from the impact of this item, noninterest income increased $14 million due to higher fees from our capital markets-related and commercial mortgage servicing products.
Noninterest expense for the first six months of 2005 increased 3% compared with the first half of 2004 primarily as a result of higher staff expenses in support of customer and loan growth.
Through Wholesale Banking we provide lending, treasury management and capital markets-related products and services, and commercial loan servicing to mid-sized corporations, government entities and selectively to large corporations. Wholesale Banking provides products and services generally within our primary geographic markets and provides certain products and services nationally.
18
Lending products include:
| | Secured and unsecured loans |
| | Letters of credit |
| | Equipment leases |
Treasury management services include:
| | Cash and investment management |
| | Receivables management |
| | Disbursement services |
| | Funds transfer services |
| | Information reporting |
| | Global trade services |
Capital markets-related products include:
| | Foreign exchange |
| | Derivatives |
| | Loan syndications |
| | Securities underwriting and distribution |
See the additional revenue discussion regarding treasury management, capital markets, Midland Loan Services and equipment leasing on pages 8 and 9.
19
PNC Advisors (Unaudited)
| Six months ended June 30 |
2005 |
2004 |
||||||
| INCOME STATEMENT |
||||||||
| Net interest income |
$ | 56 | $ | 54 | ||||
| Noninterest income |
||||||||
| Investment management and trust |
164 | 160 | ||||||
| Brokerage |
55 | 58 | ||||||
| Other |
40 | 52 | ||||||
| Total noninterest income |
259 | 270 | ||||||
| Total revenue |
315 | 324 | ||||||
| Provision for (recoveries of) credit losses |
(1 | ) | (1 | ) | ||||
| Noninterest expense |
232 | 234 | ||||||
| Pretax earnings |
84 | 91 | ||||||
| Income taxes |
31 | 33 | ||||||
| Earnings |
$ | 53 | $ | 58 | ||||
| AVERAGE BALANCE SHEET |
||||||||
| Loans |
||||||||
| Consumer |
$ | 1,711 | $ | 1,430 | ||||
| Residential mortgage |
96 | 146 | ||||||
| Commercial |
417 | 416 | ||||||
| Other |
273 | 297 | ||||||
| Total loans |
2,497 | 2,289 | ||||||
| Other assets |
410 | 409 | ||||||
| Total assets |
$ | 2,907 | $ | 2,698 | ||||
| Deposits |
$ | 2,434 | $ | 2,244 | ||||
| Other liabilities |
271 | 270 | ||||||
| Capital |
282 | 313 | ||||||
| Total funds |
$ | 2,987 | $ | 2,827 | ||||
| PERFORMANCE RATIOS |
||||||||
| Return on capital |
38 | % | 37 | % | ||||
| Noninterest income to total revenue |
82 | 83 | ||||||
| Efficiency |
74 | 72 | ||||||
| ASSETS UNDER ADMINISTRATION (in billions) (a) (b) |
||||||||
| Assets under management |
||||||||
| Personal |
$ | 41 | $ | 40 | ||||
| Institutional |
9 | 9 | ||||||
| Total |
$ | 50 | $ | 49 | ||||
| Asset type |
||||||||
| Equity |
$ | 31 | $ | 29 | ||||
| Fixed income |
13 | 14 | ||||||
| Liquidity/Other |
6 | 6 | ||||||
| Total |
$ | 50 | $ | 49 | ||||
| Nondiscretionary assets under administration |
||||||||
| Personal |
$ | 26 | $ | 27 | ||||
| Institutional |
59 | 64 | ||||||
| Total |
$ | 85 | $ | 91 | ||||
| Asset type |
||||||||
| Equity |
$ | 31 | $ | 32 | ||||
| Fixed income |
26 | 33 | ||||||
| Liquidity/Other |
28 | 26 | ||||||
| Total |
$ | 85 | $ | 91 | ||||
| OTHER INFORMATION (b) |
||||||||
| Total nonperforming assets |
$ | 5 | $ | 10 | ||||
| Brokerage assets administered (in billions) |
$ | 25 | $ | 23 | ||||
| Full service brokerage offices |
75 | 75 | ||||||
| Financial consultants |
434 | 436 | ||||||
| Margin loans |
$ | 218 | $ | 268 | ||||
| Average FTE staff |
2,830 | 2,796 | ||||||
| (a) | Excludes brokerage assets administered. |
| (b) | Presented as of period-end, except for average FTEs. |
Earnings from PNC Advisors totaled $53 million in the first half of 2005 compared with $58 million in the prior year first half. PNC Advisors earnings increased $2 million in the first half of 2005 compared with the first half of 2004, excluding the effect in the first quarter of 2004 of a $7 million after-tax gain from the sale of certain investment consulting activities of the Hawthorn unit. Apart from this item, the increase in earnings in 2005 primarily reflected disciplined expense control and higher asset management fees that more than offset a decline in client-related trading revenue.
First half 2005 business highlights for PNC Advisors include:
| | Average consumer loans increased 20% in the first six months of 2005 compared with the prior year primarily due to home equity loan and line of credit volume. |
| | Average deposits increased 8% in the first six months of 2005 compared with the first six months of 2004. |
| | Average loan and deposit increases reflected the successful sales initiatives aimed at PNC Advisors advantage over its non-bank competitors. |
| | Hilliard Lyons retail trading volume declined in the first half of 2005 from December 2004 levels, in line with other brokerage firms. |
Assets under management of $50 billion at June 30, 2005 increased $1 billion compared with the balance at June 30, 2004. The effect of comparatively higher equity markets and the acquisition of Riggs more than offset net client asset outflows. The assets from the Riggs acquisition are net of the exit of certain domestic and foreign customer relationships. Net client asset outflows are the result of ordinary course distributions from trust and investment management accounts and account closures exceeding investment additions from new and existing clients.
Nondiscretionary assets under administration of $85 billion at June 30, 2005 declined $6 billion compared with the balance at June 30, 2004. The decline primarily reflects the loss of two sizeable master custody accounts with minimal earnings impact.
Taxable-equivalent net interest income increased $2 million in the first half of 2005 compared with the comparable prior year period primarily due to higher average consumer loan and deposit volume.
Investment management and trust revenue increased $4 million in the comparison primarily due to relatively higher equity markets in the first half of 2005. Brokerage revenue in the first six months of 2005 decreased $3 million compared with the prior year period primarily due to weaker retail trading. Excluding the effect in 2004 of the $10 million pretax gain from the Hawthorn transaction, other noninterest income in the first half of 2005 declined $2 million from the first half of 2004 primarily due to lower client-related trading.
Noninterest expense declined $2 million in the first half of 2005 compared with the same period of the prior year. Lower expenses reflected efficiency initiatives as well as lower variable costs related to client-related trading.
PNC Advisors provides a broad range of tailored investment management, trust and private banking products and services to affluent individuals and families, including services to the ultra-affluent through its Hawthorn unit, and provides full-service brokerage through J.J.B. Hilliard, W.L. Lyons, Inc. (Hilliard Lyons). We also serve as investment manager and trustee for employee benefit plans and charitable and endowment assets and provide defined contribution plan services and investment options through our Vested Interest® product. We provide services to individuals and corporations primarily within PNCs geographic markets.
20
BLACKROCK (Unaudited)
| Six months ended June 30 |
2005 |
2004 |
||||||
| INCOME STATEMENT |
||||||||
| Investment advisory and administrative fees |
$ | 443 | $ | 322 | ||||
| Other income |
78 | 44 | ||||||
| Total revenue |
521 | 366 | ||||||
| Operating expense |
324 | 217 | ||||||
| Operating expense LTIP |
30 | |||||||
| Fund administration and servicing costs |
19 | 16 | ||||||
| Total expense |
373 | 233 | ||||||
| Operating income |
148 | 133 | ||||||
| Nonoperating income |
13 | 21 | ||||||
| Pretax earnings |
161 | 154 | ||||||
| Minority interest |
1 | 4 | ||||||
| Income taxes |
60 | 47 | ||||||
| Earnings |
$ | 100 | $ | 103 | ||||
| PERIOD-END BALANCE SHEET |
||||||||
| Goodwill and other intangible assets |
$ | 500 | $ | 186 | ||||
| Other assets |
1,063 | 780 | ||||||
| Total assets |
$ | 1,563 | $ | 966 | ||||
| Liabilities and minority interest |
$ | 709 | $ | 211 | ||||
| Stockholders equity |
854 | 755 | ||||||
| Total liabilities and stockholders equity |
$ | 1,563 | $ | 966 | ||||
| PERFORMANCE DATA |
||||||||
| Return on average equity |
24 | % | 28 | % | ||||
| Operating margin (a) |
37 | 41 | ||||||
| Diluted earnings per share |
$ | 1.49 | $ | 1.57 | ||||
| ASSETS UNDER MANAGEMENT (in billions) (b) |
||||||||
| Separate accounts |
||||||||
| Fixed income |
$ | 258 | $ | 200 | ||||
| Cash management |
8 | 7 | ||||||
| Cash management securities lending |
7 | 9 | ||||||
| Equity |
19 | 9 | ||||||
| Alternative investment products |
23 | 6 | ||||||
| Total separate accounts |
315 | 231 | ||||||
| Mutual funds (c) |
||||||||
| Fixed income |
26 | 24 | ||||||
| Cash management |
60 | 50 | ||||||
| Equity |
13 | 5 | ||||||
| Total mutual funds |
99 | 79 | ||||||
| Total assets under management |
$ | 414 | $ | 310 | ||||
| OTHER INFORMATION |
||||||||
| Average FTE staff |
1,415 | 965 | ||||||
| (a) | Calculated as operating income, adjusted for the LTIP expense, SSRM acquisition costs, appreciation on Rabbi trust assets related to BlackRocks deferred compensation plans, and the Trepp LLC bonus divided by total revenue less reimbursable property management compensation and fund administration and servicing costs. The following is a reconciliation of this presentation to operating margin calculated on a GAAP basis (operating income divided by total revenue) in millions. |
| Operating income, GAAP basis |
$ | 148 | $ | 133 | ||||
| Add back: LTIP expense |
30 | |||||||
| Less: portion of LTIP to be funded by BlackRock |
(6 | ) | ||||||
| Add back: SSRM acquisition costs |
9 | |||||||
| Add back: appreciation on Rabbi trust assets |
2 | 2 | ||||||
| Add back: Trepp LLC bonus |
7 | |||||||
| Operating income, as adjusted |
$ | 183 | $ | 142 | ||||
| Total revenue, GAAP basis |
$ | 521 | $ | 366 | ||||
| Less: reimbursable property management compensation |
10 | |||||||
| Less: fund administration and servicing costs |
19 | 16 | ||||||
| Revenue used for operating margin calculation, as reported |
$ | 492 | $ | 350 | ||||
| Operating margin, GAAP basis |
28 | % | 36 | % | ||||
| Operating margin, as adjusted |
37 | % | 41 | % |
We believe that operating margin, as reported, is an effective indicator of managements ability to, and useful to management in deciding how to, effectively employ BlackRocks resources and, as such, provides useful disclosure to investors. The portion of the LTIP expense associated with awards to be met by the distribution to the LTIP participants of shares of BlackRock stock currently held by PNC has been excluded from operating income because it will result in no economic cost to BlackRock and, exclusive of the impact related to LTIP participants put options, these charges will not impact BlackRocks book value. Appreciation on Rabbi trust assets related to BlackRocks deferred compensation plans has been excluded because investment performance of these assets has a nominal impact on net income. Reimbursable property management compensation represents compensation and benefits paid to certain BlackRock Realty Advisors, Inc. (Realty) personnel. These employees are retained on Realtys payroll when properties are acquired by Realtys clients. The related compensation and benefits are fully reimbursed by Realtys clients and have been excluded from operating margin, as adjusted, because they bear no economic cost to BlackRock. We have excluded fund administration and servicing costs from the operating margin calculation because these costs are a fixed, asset-based expense which can fluctuate based on the discretion of a third party. We have excluded the impact on operating margin of the incentive compensation recognized during the second quarter of 2004 related to the gain on the sale of BlackRocks interest in Trepp LLC as such expense is not indicative of the ongoing level of incentive compensation for BlackRock.
| (b) | At June 30. |
| (c) | Includes BlackRock Funds, BlackRock Liquidity Funds, BlackRock Closed End Funds, Short Term Investment Fund and BlackRock Global Series Funds. |
BlackRock earned $100 million in the first six months of 2005 compared with $103 million in the first half of 2004. The lower earnings compared with the first half of 2004 reflected nonrecurring pretax expenses of $9 million associated with the 2005 SSRM acquisition and $30 million of LTIP expense in 2005, as well as the impact of a $9 million income tax benefit in the first quarter of 2004 resulting from the resolution of a New York State tax audit. Results for the first half of 2004 also reflected the sale of BlackRocks equity interest in Trepp LLC, a leading provider of commercial mortgage-backed security information, analytics and technology.
Total revenue increased 42% compared with the first half of 2004 primarily due to a 38% increase in investment advisory and administrative fees driven by increased assets under management of $104 billion, including $50 billion assumed in the SSRM acquisition.
Total expense increased 60% over the first half of 2004 as a result of higher staffing levels following the SSRM acquisition, higher incentive compensation expense, including LTIP, and higher general and administration expense. General and administration expense rose in the comparison primarily due to an increase in marketing, promotional and travel expense related to new closed-end fund launches and expanded international calling efforts, a rise in occupancy expense and the assumption of additional office space through the SSRM acquisition.
During the first half of 2005, BlackRock continued to operate in a global marketplace characterized by substantial volatility. Increasing short-term interest rates, a flattening of the yield curve and volatility in global equity and commodities markets created challenging conditions across BlackRocks asset classes.
Assets under management at June 30, 2005 increased $104 billion, or 34%, compared with June 30, 2004. The increase was attributable to the SSRM acquisition and net new business. Apart from the SSRM acquisition, the increase in assets under management reflected net new subscriptions of $35.6 billion and market appreciation of $19.1 billion in the 12-month period.
BlackRock is listed on the New York Stock Exchange under the symbol BLK. Additional information about BlackRock is available in its SEC filings at www.sec.gov and on BlackRocks website, www.blackrock.com.
21
PFPC (Unaudited)
| Six months ended June 30 |
2005 |
2004 |
||||||
| INCOME STATEMENT |
||||||||
| Fund servicing revenue |
$ | 441 | $ | 402 | ||||
| Other revenue |
10 | |||||||
| Total revenue |
451 | 402 | ||||||
| Operating expense |
342 | 325 | ||||||
| Amortization (accretion) of other intangibles, net |
7 | (4 | ) | |||||
| Operating income |
102 | 81 | ||||||
| Debt financing |
18 | 28 | ||||||
| Other nonoperating income (expense) |
(7 | ) | 2 | |||||
| Pretax earnings |
77 | 55 | ||||||
| Income taxes |
30 | 22 | ||||||
| Earnings |
$ | 47 | $ | 33 | ||||
| PERIOD-END BALANCE SHEET |
||||||||
| Goodwill and other intangible assets |
$ | 1,009 | $ | 1,023 | ||||
| Other assets |
1,074 | 1,014 | ||||||
| Total assets |
$ | 2,083 | $ | 2,037 | ||||
| Debt financing |
$ | 987 | $ | 1,118 | ||||
| Other liabilities |
778 | 690 | ||||||
| Capital |
318 | 229 | ||||||
| Total funds |
$ | 2,083 | $ | 2,037 | ||||
| PERFORMANCE RATIOS |
||||||||
| Return on average capital |
34 | % | 25 | % | ||||
| Operating margin (a) |
23 | 20 | ||||||
| SERVICING STATISTICS (At June 30) |
||||||||
| Accounting/administration net fund assets (in billions) (b) |
||||||||
| Domestic |
$ | 699 | $ | 612 | ||||
| Offshore |
67 | 53 | ||||||
| Total |
$ | 766 | $ | 665 | ||||
| Asset type (in billions) |
||||||||
| Money market |
$ | 333 | $ | 326 | ||||
| Equity |
262 | 200 | ||||||
| Fixed income |
111 | 94 | ||||||
| Other |
60 | 45 | ||||||
| Total |
$ | 766 | $ | 665 | ||||
| Custody fund assets (in billions) |
$ | 462 | $ | 416 | ||||
| Shareholder accounts (in millions) |
||||||||
| Transfer agency |
20 | 21 | ||||||
| Subaccounting |
38 | 34 | ||||||
| Total |
58 | 55 | ||||||
| OTHER INFORMATION |
||||||||
| Average FTE staff |
4,811 | 4,863 | ||||||
| (a) | Operating income divided by total revenue. |
| (b) | Includes alternative investment net assets serviced. |
PFPC earnings for the first half of 2005 increased 42 % compared with the first half of 2004 due to disciplined expense control and improved operating leverage, as well as strong performance in key PFPC business units. Earnings for the first half of 2005 included a $6 million after-tax gain related to the resolution of a client contract dispute and a $5 million after-tax charge related to the prepayment of intercompany debt.
Highlights of PFPCs first half 2005 performance include:
| | Managed account services continued to grow its client base, as assets on the ADVISORport separate accounts platform reached $32 billion, an increase of 47% compared with June 30, 2004. |
| | Alternative investment net assets serviced now exceed $50 billion, reflecting continued success in pursuing hedge fund and other alternative investment business. |
| | Offshore revenues grew 23% and assets serviced offshore grew 26% compared with the first half of 2004 reflecting continued strong offshore sales performance. |
Fund servicing revenue increased $39 million, or 10%, over the first six months of 2004 reflecting strong overall performance due in part to continued business expansion of our existing clients and new business wins, as well as comparatively favorable equity market conditions. Increases related to out-of-pocket and pass-through items of $8 million had no impact on earnings.
Operating expense increased 5% in the first half of 2005 compared with the year-earlier period and reflected disciplined expense control. Of this increase, $8 million represented out-of-pocket and pass-through items referred to above.
Operating income for the first six months of 2004 benefited from accretion of $11 million related to a single discounted client contract liability, which ended during the second quarter of 2004.
PFPCs 2005 earnings benefited from a reduction in pretax financing costs of $10 million, attributable to the debt refinancing discussed below and the retirement of debt during 2004 totaling $115 million. PFPC repaid another $63 million in intercompany debt during the first half of 2005 and anticipates continued debt reductions over the remainder of the year.
Effective January 2005, PFPC restructured its remaining intercompany term debt obligations given the comparatively favorable interest rate environment at that time. PFPC recorded debt prepayment penalties totaling $8 million on a pretax basis in the first quarter of 2005 to effect the restructuring, which is expected to be more than offset by resulting interest expense savings of approximately $10 million over the course of 2005.
As previously reported, in January 2005 PFPC accepted approximately $10 million to resolve a client contract dispute, which is reflected as other revenue in the table above.
Increases in both accounting/administration and custody fund assets at June 30, 2005 compared with June 30, 2004 resulted primarily from new business, asset inflows from existing customers and equity market appreciation. Subaccounting shareholder accounts serviced by PFPC increased over the year-earlier period due to net new business and growth in existing client accounts. Total assets serviced by PFPC amounted to $1.9 trillion at June 30, 2005 compared with $1.6 trillion at June 30, 2004.
PFPCs performance is partially dependent on the underlying performance of its fund clients and, in particular, their ability to attract and retain customers. As a result, to the extent that PFPC clients businesses are adversely affected by ongoing governmental investigations into the practices of the mutual and hedge fund industries, PFPCs results also could be adversely impacted.
22
We are subject to a number of risks potentially affecting our business, financial condition, results of operations and cash flows. These include, among others, those described in the Consolidated Balance Sheet Review, Risk Management and Cautionary Statement Regarding Forward-Looking Information sections of this Financial Review and elsewhere in this Report. In addition to risks described in other parts of this Report, the Supervision and Regulation Section of Item 1 and the Risk Factors section of Item 7 of our 2004 Form 10-K describe the following key risk factors that affect us:
| | Supervision and regulation, |
| | Business and economic conditions, |
| | Impact of monetary and other policies, |
| | Competition, |
| | Asset management performance, |
| | Fund servicing, and |
| | Terrorist activities and international hostilities. |
Our 2004 Form 10-K includes a detailed description of these other key factors.
CRITICAL ACCOUNTING POLICIES AND JUDGMENTS
Our consolidated financial statements are prepared by applying certain accounting policies. Note 1 Accounting Policies in the Notes To Consolidated Financial Statements included in Part I, Item 1 of this Report and in Part II, Item 8 of our 2004 Form 10-K describe the most significant accounting policies that we use. Certain of these policies require us to make estimates and strategic or economic assumptions that may prove inaccurate or be subject to variations that may significantly affect our reported results and financial position for the period or in future periods.
We must use estimates, assumptions, and judgments when financial assets and liabilities are required to be recorded at, or adjusted to reflect, fair value. Assets and liabilities carried at fair value inherently result in a higher degree of financial statement volatility. Fair values and the information used to record valuation adjustments for certain assets and liabilities are based on either quoted market prices or are provided by other independent third-party sources, when available. When such third-party information is not available, we estimate fair value primarily by using cash flow and other financial modeling techniques. Changes in underlying factors, assumptions, or estimates in any of these areas could materially impact our future financial condition and results of operations.
We discuss the following critical accounting policies and judgments under this same heading in Item 7 of our 2004 Form 10-K:
| | Allowances for loan and lease losses and unfunded loan commitments and letters of credit |
| | Private equity asset valuation |
| | Commercial mortgage servicing rights |
| | Lease residuals |
| | Goodwill |
| | Revenue recognition |
| | Income taxes |
| | Legal contingencies |
Additional discussion and information on the application of these policies is found in other portions of this Financial Review and in the Notes To Consolidated Financial Statements in Part I, Item 1 of this Report.
2002 BLACKROCK LONG-TERM RETENTION AND INCENTIVE PLAN
See Note 9 Certain Employee Benefit And Stock-Based Compensation Plans in the Notes To Consolidated Financial Statements of this Report for a description of BlackRocks 2002 Long-Term Retention and Incentive Plan ( LTIP).
Under the BlackRock LTIP, awards fully vest at the end of any three-month period beginning on or after January 1, 2005 and ending on or prior to March 30, 2007 during which the average closing price of BlackRocks common stock is at least $62 per share. During the first quarter of 2005, BlackRocks average closing stock price exceeded the $62 threshold. In addition to the stock price threshold, the vesting of awards is contingent on the participants continued employment with BlackRock for periods ranging from two to five years through the payment date in early 2007.
We reported pretax charges in the second half of 2004 totaling $110 million in connection with the LTIP, based upon managements determination that full vesting of the LTIP Awards was probable as of September 30, 2004. Note 22 Stock-Based Compensation Plans included in Part II, Item 8 of our 2004 Form 10-K provides additional information on these charges.
We reported pretax expense of $32 million in the first six months of 2005, including $17 million during the second quarter, related to LTIP awards. We expect to report additional pretax charges of approximately $16 million per quarter through December 2006 related to the remaining service period of LTIP awards granted.
STATUS OF DEFINED BENEFIT PENSION PLAN
We have a noncontributory, qualified defined benefit pension plan (plan or pension plan) covering eligible employees. Retirement benefits are derived from a cash balance formula based on compensation levels, age and length of service. Pension contributions are based on an actuarially determined amount necessary to fund total benefits payable to plan participants. Plan assets are currently approximately 60% invested in equity investments with most of the remainder invested in fixed income instruments. Plan fiduciaries determine and review the plans investment policy.
23
We calculate the expense associated with the pension plan in accordance with SFAS 87, Employers Accounting for Pensions, and we use assumptions and methods that are compatible with the requirements of SFAS 87, including a policy of reflecting trust assets at their fair market value. On an annual basis, we review the actuarial assumptions related to the pension plan, including the discount rate, rate of compensation increase and the expected return on plan assets. Neither the discount rate nor the compensation increase assumptions significantly affect pension expense. However, the expected long-term return on assets assumption does significantly affect pension expense. Actual investment returns also significantly affect expense, as each one percentage point difference in actual return compared with our expected return causes the following years expense to change by up to $3 million. Below are the effects of certain changes in assumptions, using 2005 estimated expense as a baseline.
| Estimated (In millions) |
|||
| .5% decrease in discount rate |
$ | 1 | |
| .5% decrease in expected long-term return on assets |
7 | ||
| .5% increase in compensation rate |
1 | ||
We currently estimate a pretax $6 million benefit to pension expense in 2005 compared with pretax expense of $10 million in 2004. Actual pension benefit recognized for the first six months of 2005 totaled $3 million.
The primary reasons for the expected decrease in pension expense in 2005 are favorable returns on investment assets in 2004, which reduce amortization of actuarial losses and increase the value of assets used to calculate expected returns for 2005, and plan modifications covering employees at PFPC, as future retirement benefits for them will accrue only under a defined contribution plan.
In accordance with SFAS 87 and SFAS 132 (Revised 2003), Employers Disclosures about Pensions and Other Postretirement Benefits, we may have to eliminate any prepaid pension asset and recognize a minimum pension liability if the accumulated benefit obligation exceeds the fair value of plan assets at year-end. We would recognize the corresponding charge as a component of other comprehensive income and it would reduce total shareholders equity, but it would not affect net income. At December 31, 2004, the fair value of plan assets was $1.492 billion, which exceeded the accumulated benefit obligation of $1.111 billion. The status at year-end 2005 will depend primarily upon 2005 investment returns and the level of contributions, if any, made to the plan by us during 2005.
Plan asset investment performance has the most impact on contribution requirements. However, contribution requirements are not particularly sensitive to actuarial assumptions. Investment performance will drive the amount of permitted contributions in future years. Also, current law sets limits as to both minimum and maximum contributions to the plan. In any event, any large near-term contributions to the plan will be at our discretion, as we expect that the minimum required contributions under the law will be minimal or zero for several years.
During the second quarter of 2005, we acquired a frozen defined benefit pension plan as a result of the Riggs acquisition. Plan assets and accumulated benefit obligations of the Riggs plan were approximately $107 million and $116 million, respectively, at acquisition date. The $9 million funding deficit was recognized as part of the Riggs acquisition purchase price allocation. We plan to integrate the Riggs plan into the PNC plan before the end of 2005.
We maintain other defined benefit plans that have a less significant effect on financial results, including various nonqualified supplemental retirement plans for certain employees.
We encounter risk as part of the normal course of our business and we design risk management processes to help manage these risks. The Risk Management section included in Item 7 of our 2004 Form 10-K provides a general overview of the risk measurement, control strategies and monitoring aspects of our corporate-level risk management processes. Additionally, our 2004 Form 10-K provides an analysis of the risk management processes for what we view as our primary areas of risk: credit, operational, liquidity, and market, as well as a discussion of our use of financial derivatives as part of our overall asset and liability risk management process. The following information in this Risk Management section updates our 2004 Form 10-K and first quarter 2005 Form 10-Q disclosures in these areas.
CREDIT RISK MANAGEMENT
Credit risk represents the possibility that a customer, counterparty or issuer may not perform in accordance with contractual terms. Credit risk is inherent in the financial services business and results from extending credit to customers, purchasing securities, and entering into financial derivative transactions. Credit risk is one of the most common risks in banking and is one of our most significant risks.
24
Nonperforming, Past Due And Potential Problem Assets
Nonperforming assets include nonaccrual loans, troubled debt restructurings, nonaccrual loans held for sale or foreclosed, and other assets. In addition, certain performing assets have interest payments that are past due or have the potential for future repayment problems.
Nonperforming Assets By Type
| Dollars in millions |
June 30 2005 |
December 31 2004 |
||||||
| Nonaccrual loans |
||||||||
| Commercial |
$ | 88 | $ | 89 | ||||
| Commercial real estate |
11 | 14 | ||||||
| Consumer |
10 | 11 | ||||||
| Residential mortgage |
19 | 21 | ||||||
| Lease financing |
4 | 5 | ||||||
| Total nonaccrual loans |
132 | 140 | ||||||
| Troubled debt restructured loan |
3 | |||||||
| Total nonperforming loans |
132 | 143 | ||||||
| Nonperforming loans held for sale (a) |
2 | 3 | ||||||
| Foreclosed and other assets |
||||||||
| Lease financing |
13 | 14 | ||||||
| Residential mortgage |
13 | 10 | ||||||
| Other |
4 | 5 | ||||||
| Total foreclosed and other assets |
30 | 29 | ||||||
| Total nonperforming assets (b) |
$ | 164 | $ | 175 | ||||
| Nonperforming loans to total loans |
.27 | % | .33 | % | ||||
| Nonperforming assets to total loans, loans held for sale and foreclosed assets |
.32 | .39 | ||||||
| Nonperforming assets to total assets |
.18 | .22 | ||||||
| (a) | Includes troubled debt restructured loans held for sale of $2 million as of June 30, 2005 and December 31, 2004. |
| (b) | Excludes equity management assets carried at estimated fair value of $31 million at June 30, 2005 and $32 million at December 31, 2004 and included in Other assets on the Consolidated Balance Sheet. These amounts include troubled debt restructured assets of $15 million at June 30, 2005 and $11 million at December 31, 2004. |
The foreclosed lease assets at June 30, 2005 and December 31, 2004 primarily represent our repossession of collateral related to a single airline industry credit. This repossessed collateral is currently leased to a third party.
The amount of nonperforming loans that was current as to principal and interest was $73 million at June 30, 2005 and $44 million at December 31, 2004.
Nonperforming Assets By Business
| In millions |
June 30 2005 |
December 31 2004 |
||||
| Regional Community Banking |
$ | 79 | $ | 91 | ||
| Wholesale Banking |
77 | 71 | ||||
| PNC Advisors |
5 | 9 | ||||
| Other |
3 | 4 | ||||
| Total nonperforming assets |
$ | 164 | $ | 175 | ||
Change In Nonperforming Assets
| In millions |
2005 |
2004 |
||||||
| January 1 |
$ | 175 | $ | 328 | ||||
| Purchases |
12 | |||||||
| Transferred from accrual |
104 | 116 | ||||||
| Returned to performing |
(9 | ) | (2 | ) | ||||
| Principal reductions and payoffs |
(72 | ) | (139 | ) | ||||
| Asset sales |
(7 | ) | (48 | ) | ||||
| Charge-offs and valuation adjustments |
(27 | ) | (58 | ) | ||||
| June 30 |
$ | 164 | $ | 209 | ||||
The amount of nonperforming loans held for sale that was current as to principal and interest was zero at both June 30, 2005 and December 31, 2004.
Accruing Loans And Loans Held For Sale Past Due 90 Days Or More
|
Amount |
Percent of Total Outstandings |
|||||||||||
| Dollars in millions |
June 30 2005 |
Dec. 31 2004 |
June 30 2005 |
Dec. 31 2004 |
||||||||
| Commercial |
$ | 22 | $ | 15 | .11 | % | .09 | % | ||||
| Commercial real estate |
2 | 2 | .07 | .10 | ||||||||
| Consumer |
17 | 18 | .10 | .12 | ||||||||
| Residential mortgage |
12 | 14 | .18 | .29 | ||||||||
| Total loans |
53 | 49 | .11 | .11 | ||||||||
| Loans held for sale |
11 | 9 | .48 | .54 | ||||||||
| Total loans and loans held for sale |
$ | 64 | $ | 58 | .12 | % | .13 | % | ||||
Loans and loans held for sale that are not included in nonperforming or past due categories but cause us to be uncertain about the borrowers ability to comply with existing repayment terms over the next six months, totaled $32 million and zero, respectively, at June 30, 2005 compared with $65 million and zero, respectively at December 31, 2004. Approximately 86% of these loans are in the Wholesale Banking portfolio.
Allowances For Loan And Lease Losses And Unfunded Loan Commitments And Letters Of Credit
We maintain an allowance for loan and lease losses to absorb losses from the loan portfolio. We determine the allowance based on quarterly assessments of the probable estimated losses inherent in the loan portfolio. While we make allocations to specific loans and pools of loans, the total reserve is available for all loan and lease losses.
25
Allocation Of Allowance For Loan And Lease Losses
|
June 30, 2005 |
December 31, 2004 |
|||||||||||
| Dollars in millions |
Allowance |
Loans to Total Loans |
Allowance |
Loans to Total Loans |
||||||||
| Commercial |
$ | 523 | 40.6 | % | $ | 503 | 40.1 | % | ||||
| Commercial real estate |
31 | 5.7 | 26 | 4.5 | ||||||||
| Consumer |
32 | 33.6 | 35 | 35.9 | ||||||||
| Residential mortgage |
7 | 13.2 | 6 | 11.0 | ||||||||
| Lease financing |
30 | 6.0 | 33 | 7.3 | ||||||||
| Other |
5 | .9 | 4 | 1.2 | ||||||||
| Total |
$ | 628 | 100.0 | % | $ | 607 | 100.0 | % | ||||
In addition to the allowance for loan and lease losses, we maintain an allowance for unfunded loan commitments and letters of credit. We report this allowance as a liability on our Consolidated Balance Sheet. We determine this amount using estimates of the probability of the ultimate funding and losses related to those credit exposures. This methodology is similar to the one we use for determining the adequacy of our allowance for loan and lease losses.
In addition to the impact of the second quarter loan recovery of $53 million, the provision for credit losses for 2005 and the evaluation of the allowances for loan and lease losses and unfunded loan commitments and letters of credit as of June 30, 2005 reflected changes in loan portfolio composition, the impact of refinements to our reserve methodology, and changes in asset quality. The provision includes amounts for probable losses on loans and credit exposure related to unfunded loan commitments and letters of credit.
Rollforward Of Allowance For Unfunded Loan Commitments And Letters Of Credit
| In millions |
2005 |
2004 |
|||||
| January 1 |
$ | 75 | $ | 91 | |||
| Net change in allowance for unfunded loan commitments and letters of credit |
9 | (7 | ) | ||||
| June 30 |
$ | 84 | $ | 84 | |||
Rollforward Of Allowance For Loan And Lease Losses
| In millions |
2005 |
2004 |
||||||
| January 1 |
$ | 607 | $ | 632 | ||||
| Charge-offs |
(50 | ) | (113 | ) | ||||
| Recoveries (a) |
76 | 25 | ||||||
| Net recoveries (charge-offs) (a) |
26 | (88 | ) | |||||
| Provision for (recoveries of) credit losses |
(19 | ) | 20 | |||||
| Acquired allowance (b) |
23 | 22 | ||||||
| Net change in allowance for unfunded loan commitments and letters of credit |
(9 | ) | 7 | |||||
| June 30 |
$ | 628 | $ | 593 | ||||
| (a) | A $53 million loan recovery is reflected in the 2005 amounts. |
| (b) | The 2005 acquired allowance related to the Riggs acquisition and the 2004 acquired allowance related to the United National acquisition. |
The allowance as a percent of nonperforming loans was 476% and as a percent of total loans was 1.27% at June 30, 2005. The comparable percentages at December 31, 2004 were 424% and 1.40%.
Charge-Offs And Recoveries
| Six months ended June 30 |
Charge- offs |
Recoveries |
Net Charge- offs |
Percent of Average Loans |
|||||||||
| 2005 |
|||||||||||||
| Commercial (a) |
$ | 28 | $ | 68 | $ | (40 | ) | (.43 | )% | ||||
| Consumer |
21 | 7 | 14 | .18 | |||||||||
| Residential mortgage |
1 | 1 | .04 | ||||||||||
| Lease financing |
1 | (1 | ) | (.07 | ) | ||||||||
| Total |
$ | 50 | $ | 76 | $ | (26 | ) | (.12 | ) | ||||
| 2004 |
|||||||||||||
| Commercial (b) |
$ | 85 | $ | 13 | $ | 72 | .90 | % | |||||
| Commercial real estate |
2 | 1 | 1 | .09 | |||||||||
| Consumer |
22 | 6 | 16 | .24 | |||||||||
| Residential mortgage |
1 | 1 | |||||||||||
| Lease financing |
3 | 4 | (1 | ) | (.05 | ) | |||||||
| Total |
$ | 113 | $ | 25 | $ | 88 | .45 | ||||||
| (a) | Includes a $53 million loan recovery. |
| (b) | During the first quarter of 2004, we changed our policy for recognizing charge-offs on smaller nonperforming commercial loans. This change resulted in the recognition of an additional $24 million of gross charge-offs for the first quarter of 2004. |
Apart from the 2004 policy change referred to above, commercial charge-offs declined $33 million in the first half of 2005 compared with the prior year first half primarily due to an improvement in the overall credit quality of the commercial loan portfolio.
We establish reserves to provide coverage for probable losses not considered in the specific, pool and consumer reserve methodologies, such as, but not limited to, potential judgment and data errors. Furthermore, events may have occurred as of the reserve evaluation date that are not yet reflected in risk measures or characteristics of the portfolio due to inherent lags in information. Our evaluation of these factors and other relevant factors, such as the imprecision in estimating probable losses, determines the level of reserves established at the evaluation date. The total amount of reserves for these factors was $101 million at June 30, 2005 and at December 31, 2004 and was assigned in the tables above to loan categories and to business segments based on the relative specific and pool allocation amounts. This portion of the allowance for loan and lease losses represented 16% of the total allowance and .20% of total loans at June 30, 2005 and 17% of the total allowance and .23% of total loans at December 31, 2004.
CREDIT-RELATED INSTRUMENTS
Credit Default Swaps
Credit default swaps provide, for a fee, an assumption by a third party of a portion of the credit risk related to the underlying financial instruments. We use the contracts to mitigate credit risk associated with commercial lending activities as well as proprietary derivative and convertible bond trading. At June 30, 2005, we used credit default swaps with $444 million in notional amount to reduce credit risk associated with commercial lending activities, $111 million in notional amount to reduce risk associated with convertible arbitrage trading and $798 million in notional amount related to proprietary trading activities. The comparable amounts were $336 million, $23 million and zero at December 31, 2004. Credit default swaps, which are marked to market quarterly, are included in the Free-Standing Derivatives table in the Financial Derivatives section of this Risk Management discussion. We realized minimal net gains in connection with credit default swaps during the first six months of 2005 and minimal net loss in the first six months of 2004.
26
Interest Rate Derivative Risk Participation Agreements
We enter into risk participation agreements to share credit exposure with other financial counterparties related to interest rate derivative contracts or take on credit exposure to generate revenue. Risk participation agreements entered into subsequent to June 30, 2003 used by us to mitigate credit risk had a notional amount of $223 million at June 30, 2005 compared with $200 million at December 31, 2004. Risk participation agreements in which we assumed credit exposure had a notional amount of $116 million at June 30, 2005 and $30 million at December 31, 2004.
Agreements entered into prior to July 1, 2003 are considered to be financial guarantees and, therefore, are not included in the Financial Derivatives section of this Risk Management discussion. Risk participation agreements entered into prior to July 1, 2003 used by us to mitigate credit risk had a notional amount of $9 million at June 30, 2005 compared with $36 million at December 31, 2004. Risk participation agreements entered into in which we assumed credit risk exposure had a total notional amount of $19 million at June 30, 2005 compared with $24 million at December 31, 2004.
OPERATIONAL RISK MANAGEMENT
Operational risk is defined as the risk of financial loss or other damage to us resulting from inadequate or failed internal processes or systems, human factors, or from external events. Operational risk may occur in any of our business activities and manifests itself in various ways, including but not limited to the following:
| | Errors related to transaction processing and systems, |
| | Breaches of the system of internal controls and compliance requirements, and |
| | Business interruptions and execution of unauthorized transactions and fraud by employees or third parties. |
Operational losses may arise from legal actions due to operating deficiencies or noncompliance with contracts, laws or regulations.
To monitor and control operational risk, we maintain a comprehensive framework including policies and a system of internal controls that is designed to manage risk and to provide management with timely and accurate information about the operations of PNC.
LIQUIDITY RISK MANAGEMENT
Liquidity risk is the risk of potential loss if we were unable to meet our funding requirements at a reasonable cost. We manage liquidity risk to help ensure that we can obtain cost-effective funding to meet current and future obligations under both normal business as usual and stressful circumstances.
Our largest source of funding on a consolidated basis is the deposit base that comes from our retail and wholesale banking activities. Other borrowed funds come from a diverse mix of long and short-term funding sources. Liquid assets and unused borrowing capacity from a number of sources are also available to maintain our liquidity position.
Liquid assets consist of short-term investments (federal funds sold and other short-term investments) and securities available for sale. At June 30, 2005, our liquid assets totaled $22.6 billion, with $9.8 billion pledged as collateral for borrowings, trust, and other commitments.
PNC Bank, N.A. is a member of the Federal Home Loan Bank and as such has access to advances from the Federal Home Loan Bank secured generally by residential mortgages, other real estate related loans, and mortgage-backed securities. During June 2005 we issued $1.0 billion of Federal Home Loan Bank advances, due in July 2006, at 3.81%. At June 30, 2005, our total unused borrowing capacity from the Federal Home Loan Bank under current collateral requirements was $22.8 billion.
We can also obtain funding through alternative forms of borrowing, including federal funds purchased, repurchase agreements, and short-term and long-term debt issuances. In July 2004, PNC Bank, N.A. established a program to offer up to $20 billion in senior and subordinated unsecured debt obligations with maturities of more than nine months. As of June 30, 2005, PNC Bank, N.A. had issued $1.4 billion of debt under this program. These notes are not redeemable or subject to repayment at the option of the holder prior to maturity. In addition, on July 29, 2005, PNC Bank, N.A. issued $500 million of senior bank notes under this program, maturing on January 29, 2007. Interest will be reset monthly to 1-month LIBOR minus 3 basis points and will be paid monthly. These notes are also not redeemable or subject to repayment at the option of the holder prior to maturity.
In December 2004, PNC Bank, N.A. established a program to offer up to $3.0 billion of its commercial paper. As of June 30, 2005, $1.4 billion of commercial paper was outstanding under this program.
Our parent companys routine funding needs consist primarily of dividends to PNC shareholders, share repurchases, debt service, the funding of non-bank affiliates, and acquisitions. The principal source of parent company cash flow is the dividends it receives from PNC Bank, N.A. There are statutory and regulatory limitations on the ability of national banks to pay dividends or make other capital distributions or to extend credit to the parent company or its non-bank subsidiaries. Dividends may also be impacted by the banks capital needs and by contractual restrictions. The amount available for dividend payments to the parent company by PNC Bank, N.A. without prior regulatory approval was approximately $370 million at June 30, 2005.
In addition to dividends from PNC Bank, N.A., other sources of parent company liquidity include cash and short-term investments, as well as dividends and loan repayments from other subsidiaries. As of June 30, 2005, the parent company had approximately $787 million in funds available from its cash and short-term investments.
We can also generate liquidity for the parent company and PNCs non-bank subsidiaries through the issuance of securities in public or private markets. BlackRock, one of our majority-owned non-bank subsidiaries, also has access to public and private financing. On June 30, 2005, we filed a new shelf registration statement with the SEC which allows us to issue up to $2.0 billion of debt or equity securities. This shelf registration statement replaced a prior shelf registration statement. In addition, at June 30, 2005, we had unused capacity under a separate shelf registration statement of approximately $100 million of trust preferred capital securities. During the second quarter of 2005, no parent company senior debt matured. As of June 30, 2005, there were no parent company contractual obligations with maturities less than one year.
27
Commitments
The following tables set forth contractual obligations and various commitments representing required and potential cash outflows as of June 30, 2005.
Contractual Obligations
| June 30, 2005 - in millions |
Total |
||
| Remaining contractual maturities of time deposits |
$ | 16,504 | |
| Borrowed funds |
18,206 | ||
| Minimum annual rentals on noncancellable leases |
1,016 | ||
| Nonqualified pension and postretirement benefits |
300 | ||
| Purchase obligations (a) |
373 | ||
| Total contractual cash obligations |
$ | 36,399 | |
| (a) | Includes purchase obligations for goods and services covered by noncancellable contracts and contracts including cancellation fees. |
Other Commitments (a)
| June 30, 2005 - in millions |
Total Amounts Committed |
||
| Loan commitments |
$ | 34,377 | |
| Standby letters of credit |
3,746 | ||
| Other commitments (b) |
1,195 | ||
| Total commitments |
$ | 39,318 | |
| (a) | Other commitments are funding commitments that could potentially require performance in the event of demands by third parties or contingent events. Loan commitments are reported net of participations, assignments and syndications. |
| (b) | Includes standby bond repurchase agreements and equity funding commitments related to equity management and affordable housing as well as BlackRocks investment commitments and obligation under an acquired management contract. |
MARKET RISK MANAGEMENT OVERVIEW
Market risk is the risk of a loss in earnings or economic value due to adverse movements in market factors such as interest rates, credit spreads, foreign exchange rates, and equity prices.
MARKET RISK MANAGEMENT INTEREST RATE RISK
Interest rate risk results primarily from our traditional banking activities of gathering deposits and extending loans. Many factors, including economic and financial conditions, movements in interest rates, and consumer preferences, affect the difference between the interest that we earn on assets and the interest that we pay on liabilities.
PNCs Asset and Liability Management group centrally manages interest rate risk subject to interest rate risk limits and certain policies approved by the Asset and Liability Committee and the Board Finance Committee. In February 2005, the Board Finance Committee approved a policy change which entailed limiting the sensitivity of PNCs duration of equity. This limit replaced the previous economic value of equity (EVE) sensitivity limits.
Sensitivity results and market interest rate benchmarks for the second quarter of 2005 and 2004 follow:
INTEREST SENSITIVITY ANALYSIS
| Second Quarter |
Second Quarter |
|||||
| Net Interest Income Sensitivity Simulation |
||||||
| Effect on net interest income in first year from gradual interest rate change over following 12 months of: |
||||||
| 100 basis point increase |
1.5 | % | (.7 | )% | ||
| 100 basis point decrease |
(2.0 | )% | .2 | % | ||
| Effect on net interest income in second year from gradual interest rate change over the preceding 12 months of: |
||||||
| 100 basis point increase |
3.1 | % | 1.9 | % | ||
| 100 basis point decrease |
(6.9 | )% | (6.1 | )% | ||
| Duration of Equity Model |
||||||
| Base case duration of equity (in years): |
(2.0 | ) | (.2 | ) | ||
| Key Period-End Interest Rates |
||||||
| One month LIBOR |
3.34 | % | 1.37 | % | ||
| Three-year swap |
4.03 | % | 3.59 | % |
In addition to measuring the effect on net interest income assuming parallel changes in current interest rates, we routinely simulate the effects of a number of nonparallel interest rate environments. The following Net Interest Income Sensitivity To Alternative Rate Scenarios table reflects the percentage change in net interest income over the next two 12 month periods assuming the PNC Economists most likely rate forecast, implied market forward rates and a lower/flatter rate scenario. We are inherently sensitive to a flatter yield curve.
Net Interest Income Sensitivity To Alternative Rate Scenarios (for second quarter 2005)
|
PNC Economist |
Market Forward |
Low/Flat |
|||||||
| Change in forecasted net interest income: |
|||||||||
| First year sensitivity |
1.3 | % | .9 | % | (1.9 | )% | |||
| Second year sensitivity |
3.0 | % | 1.5 | % | (1.7 | )% |
When forecasting net interest income, we make assumptions about interest rates and the shape of the yield curve, the volume and characteristics of new business, and the behavior of existing positions. These assumptions determine the future level of simulated net interest income in the base interest rate scenario and the other interest rate scenarios presented in the following table. These simulations assume that as assets and liabilities mature, they are replaced or repriced at market rates.
All changes in forecasted net interest income are relative to results in a base rate scenario where current market rates are assumed to remain unchanged over the forecast horizon.
28
The graph below presents the yield curves for the base rate scenario and each of the alternative scenarios one year forward.
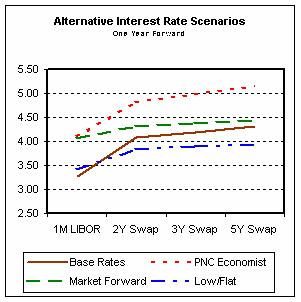
Over the last several years, we have taken steps to position our balance sheet to benefit from rising long-term interest rates. Going forward, we believe that we have the deposit funding base and flexibility to change our investment profile to take advantage, where appropriate, of changing interest rates and to adjust to changing market conditions.
MARKET RISK MANAGEMENT TRADING RISK
Our trading activities include the underwriting of fixed income and equity securities, as well as customer-driven and proprietary trading in fixed income securities, equities, derivatives, and foreign exchange contracts.
We use value-at-risk (VaR) as the primary means to measure and monitor market risk in trading activities. Our Board Finance Committee establishes an enterprise-wide VaR limit on our trading activities.
The following table shows VaR usage for the second quarter of 2005 by product type:
VaR Usage by Product Type
| In millions |
Min |
Max |
Avg |
||||||
| Fixed Income |
$ | 5.3 | $ | 9.4 | $ | 7.1 | |||
| Equity |
.7 | 1.8 | 1.1 | ||||||
| Foreign Exchange |
.1 | .5 | .2 | ||||||
| Total |
6.4 | 10.6 | 8.4 | ||||||
To help ensure the integrity of the models used to calculate VaR for each portfolio and enterprise-wide, we use a process known as backtesting. The backtesting process consists of comparing actual observations of trading-related gains or losses against the VaR levels that were calculated at the close of the prior day. We would expect a maximum of two to three instances a year in which actual losses exceeded the prior day VaR measure. During the first six months of 2005, there were no such instances at the enterprise-wide level.
The following graph shows a comparison of enterprise-wide trading-related gains and losses against prior day VaR for the period.
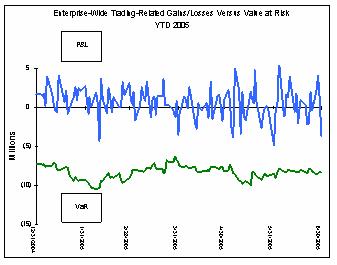
Total trading revenue for the first half and second quarter of 2005 and 2004 was as follows:
| Six months ended June 30 - in millions |
2005 |
2004 |
||||
| Net interest income |
$ | 6 | $ | 6 | ||
| Other noninterest income |
61 | 53 | ||||
| Total trading revenue |
$ | 67 | $ | 59 | ||
| Securities underwriting and trading |
$ | 10 | $ | 26 | ||
| Foreign exchange |
17 | 14 | ||||
| Financial derivatives |
40 | 19 | ||||
| Total trading revenue |
$ | 67 | $ | 59 | ||
| Three months ended June 30 - in millions |
2005 |
2004 |
||||
| Net interest income |
$ | 4 | $ | 4 | ||
| Other noninterest income |
11 | 30 | ||||
| Total trading revenue |
$ | 15 | $ | 34 | ||
| Securities underwriting and trading |
$ | 5 | $ | 16 | ||
| Foreign exchange |
9 | 7 | ||||
| Financial derivatives |
1 | 11 | ||||
| Total trading revenue |
$ | 15 | $ | 34 | ||
Average trading assets and liabilities consisted of the following:
| Six months ended - in millions |
June 30, 2005 |
June 30, 2004 |
||||
| Assets |
||||||
| Securities (a) |
$ | 1,907 | $ | 562 | ||
| Resale agreements (b) |
828 | 164 | ||||
| Financial derivatives (c) |
772 | 573 | ||||
| Total assets |
$ | 3,507 | $ | 1,299 | ||
| Liabilities |
||||||
| Securities sold short (d) |
$ | 1,104 | $ | 189 | ||
| Repurchase agreements and other borrowings (e) |
1,131 | 107 | ||||
| Financial derivatives (f) |
789 | 567 | ||||
| Total liabilities |
$ | 3,024 | $ | 863 | ||
29
| Three months ended - in millions |
June 30, 2005 |
June 30, 2004 |
||||
| Assets |
||||||
| Securities (a) |
$ | 1,932 | $ | 740 | ||
| Resale agreements (b) |
411 | 142 | ||||
| Financial derivatives (c) |
864 | 541 | ||||
| Total assets |
$ | 3,207 | $ | 1,423 | ||
| Liabilities |
||||||
| Securities sold short (d) |
$ | 750 | $ | 177 | ||
| Repurchase agreements and other borrowings (e) |
1,078 | 127 | ||||
| Financial derivatives (f) |
909 | 500 | ||||
| Total liabilities |
$ | 2,737 | $ | 804 | ||
| (a) | Included in Other short-term investments, including trading securities, on the Consolidated Balance Sheet. |
| (b) | Included in Federal funds sold and resale agreements. |
| (c) | Included in Other assets. |
| (d) | Included in Other borrowed funds. |
| (e) | Included in Repurchase agreements and Other borrowed funds. |
| (f) | Included in Other liabilities. |
See Note 3 Trading Activities in the Notes To Consolidated Financial Statements in Part I, Item 1 of this Report for additional information.
MARKET RISK MANAGEMENT EQUITY AND OTHER INVESTMENT RISK
Equity investment risk is the risk of potential losses associated with investing in both private and public equity markets.
The primary risk measurement for equity and other investments is economic capital. In addition to extending credit, taking deposits, and underwriting and trading financial instruments, we make and manage direct investments in a variety of transactions, including management buyouts, recapitalizations, and later-stage growth financings in a variety of industries. We have investments in non-affiliated and affiliated funds that make similar private equity investments, although new investments in non-affiliated funds will be minimal. The economic and/or book value of these investments and other assets such as loan servicing rights are directly affected by changes in market factors.
Private Equity
At June 30, 2005, private equity investments carried at estimated fair value totaled $500 million compared with $470 million at December 31, 2004. As of June 30, 2005, approximately 42% of the amount is invested directly in a variety of companies and approximately 58% is invested in various limited partnerships. Private equity unfunded commitments totaled $97 million at June 30, 2005 compared with $119 million at December 31, 2004. In addition to the investments referred to above, private equity investments valued at $28 million at June 30, 2005 were acquired as part of the Riggs transaction. We have an agreement to sell these assets at their carrying value. This transaction is expected to close during the third quarter of 2005.
The private equity portfolio is comprised of investments that vary by industry, stage and type of investment. We continue to make private equity investments at a moderate pace, consistent with current market conditions.
Other Investments
We also make investments in affiliated and non-affiliated funds with both traditional and alternative investment strategies. Such investments include investments in BlackRocks mutual funds, hedge funds, and CDOs. The economic values could be driven by either the fixed-income market or the equity markets, or both. As of June 30, 2005, major investments of this type included low income housing tax credits and capitalized servicing rights for commercial mortgage loans.
ECONOMIC CAPITAL
Our Economic Capital Committee governs the measurement of economic capital. This Committee meets at least quarterly to review economic capital measurements and approve methodology changes. The economic capital framework is a measure of the potential losses above and beyond expected losses. Potential one year losses are capitalized to a level consistent with a financial institution with an A rating. Economic capital incorporates risk associated with potential credit losses (Credit Risk), fluctuations of the estimated market value of financial instruments (Market Risk), failure of people, processes or systems (Operational Risk), and income losses associated with declining volumes, margins and/or fees, and the fixed cost structure of the business (Business Risk). We estimate credit and market risks at an exposure level while we estimate the remaining risk types at an institution or business segment level. We routinely compare the output of our economic capital model with industry benchmarks.
FINANCIAL DERIVATIVES
We use a variety of financial derivatives as part of the overall asset and liability risk management process to help manage interest rate, market and credit risk inherent in our business activities. Substantially all such instruments are used to manage risk related to changes in interest rates. Interest rate and total return swaps, interest rate caps and floors and futures contracts are the primary instruments used by us for interest rate risk management.
Financial derivatives involve, to varying degrees, interest rate, market and credit risk. For interest rate swaps and total return swaps, caps and floors and futures contracts, only periodic cash payments and, with respect to caps and floors, premiums, are exchanged. Therefore, cash requirements and exposure to credit risk are significantly less than the notional amount.
30
Not all elements of interest rate, market and credit risk are addressed through the use of financial or other derivatives, and such instruments may be ineffective for their intended purposes due to unanticipated market characteristics, among other reasons.
Accounting Hedges-Fair Value Hedging Strategies
We enter into interest rate and total return swaps, caps, floors and interest rate futures derivative contracts to hedge designated commercial mortgage loans held for sale, commercial loans, bank notes, senior debt and subordinated debt for changes in fair value primarily due to changes in interest rates. Adjustments related to the ineffective portion of fair value hedging instruments are recorded in interest income, interest expense or noninterest income depending on the hedged item.
Accounting Hedges-Cash Flow Hedging Strategy
We enter into interest rate swap contracts to modify the interest rate characteristics of designated commercial loans from variable to fixed in order to reduce the impact of interest rate changes on future interest income. The fair value of these derivatives is reported in other assets or other liabilities and offset in accumulated other comprehensive income for the effective portion of the derivatives. When the hedged transaction culminates, any unrealized gains or losses related to these swap contracts are removed from accumulated other comprehensive income and are included in interest income. Any ineffectiveness of the strategy, as defined by our documented policies and procedures, is reported in interest income.
Free-Standing Derivatives
To accommodate customer needs, we also enter into financial derivative transactions primarily consisting of interest rate swaps, caps, floors and foreign exchange and equity contracts. We manage our market risk exposure from customer positions through transactions with third-party dealers. The credit risk associated with derivatives executed with customers is essentially the same as that involved in extending loans and is subject to normal credit policies. We may obtain collateral based on our assessment of the customer. For derivatives not designated as an accounting hedge, the gain or loss is recognized in other noninterest income.
Also included in free-standing derivatives are transactions that we enter into for risk management and proprietary purposes that are not designated as accounting hedges, primarily interest rate basis swaps, total return swaps, credit default swaps and certain interest rate-lock loan origination commitments as well as commitments to buy or sell mortgage loans.
Basis swaps are agreements involving the exchange of payments, based on notional amounts, of two floating rate financial instruments denominated in the same currency, one pegged to one reference rate and the other tied to a second reference rate (e.g., swapping payments tied to one-month LIBOR for payments tied to three-month LIBOR). We use these contracts to mitigate the impact on earnings of exposure to a certain referenced interest rate.
Interest rate-lock commitments for, as well as commitments to buy or sell, real estate mortgage loans that we intend to sell are considered free-standing derivatives. Our interest rate exposure on the rate lock commitments is economically hedged with pay-fixed interest rate swaps and forward sale commitments. These contracts mitigate the impact on earnings of exposure to a certain referenced rate.
We purchase credit default swaps to mitigate the economic impact of credit losses on specifically identified existing lending relationships. These derivatives typically are based upon the change in value, due to changing credit spreads, of publicly-issued bonds issued by our customer.
We enter into risk participation agreements to share some of the credit exposure with other financial counterparties related to interest rate derivative contracts or to take on credit exposure to generate revenue. We will be required to make/receive payments under these guaranties if a customer defaults on its obligation to perform under certain credit agreements. Agreements entered into prior to July 1, 2003 are considered financial guarantees. Agreements entered into after June 30, 2003 are considered free-standing derivatives.
We occasionally purchase or originate financial instruments that contain an embedded derivative. At the inception of the financial instrument, we assess whether the economic characteristics of the embedded derivative are clearly and closely related to the economic characteristics of the financial instrument (host contract), whether the financial instrument that embodies both the embedded derivative and the host contract is measured at fair value with changes in fair value reported in earnings, and whether a separate instrument with the same terms as the embedded instrument would not meet the definition of a derivative. If the embedded derivative does not meet these three conditions, the embedded derivative would qualify as a derivative instrument and be recorded apart from the host contract and carried at fair value with changes recorded in current earnings.
Free-standing derivatives also include positions we take based on market expectations or to benefit from price differentials between financial instruments and the market based upon stated risk management objectives.
31
The following tables provide the notional amount and fair value of financial derivatives used for risk management and designated as accounting hedges as well as free-standing derivatives at June 30, 2005 and December 31, 2004. Weighted-average interest rates presented are based on contractual terms, if fixed, or the implied forward yield curve at each respective date, if floating. The credit risk amounts of these derivatives as of June 30, 2005 and December 31, 2004 are presented in Note 10 Financial Derivatives in the Notes To Consolidated Financial Statements in Part I, Item 1 of this Report.
Financial Derivatives - 2005
|
Notional Amount |
Fair Value |
Weighted- Average Maturity |
Weighted-Average Interest Rates |
||||||||||||
| June 30, 2005 - dollars in millions |
Paid |
Received |
|||||||||||||
| Accounting Hedges |
|||||||||||||||
| Interest rate risk management |
|||||||||||||||
| Asset rate conversion |
|||||||||||||||
| Interest rate swaps (a) |
|||||||||||||||
| Receive fixed |
$ | 1,289 | $ | 11 | 4 yrs. 4 mos. | 4.03 | % | 4.20 | % | ||||||
| Pay fixed |
12 | 2 yrs. 7 mos. | 3.68 | 3.99 | |||||||||||
| Forward purchase commitments |
500 | 2 | 4 yrs. 11 mos. | NM | NM | ||||||||||
| Futures contracts |
82 | 1 yr. 3 mos. | NM | NM | |||||||||||
| Total asset rate conversion |
1,883 | 13 | |||||||||||||
| Liability rate conversion |
|||||||||||||||
| Interest rate swaps (a) |
|||||||||||||||
| Receive fixed |
4,445 | 235 | 6 yrs. 5 mos. | 4.14 | 5.45 | ||||||||||
| Total interest rate risk management |
6,328 | 248 | |||||||||||||
| Commercial mortgage banking risk management |
|||||||||||||||
| Pay fixed interest rate swaps (a) |
286 | (13 | ) | 10 yrs. 6 mos. | 4.85 | 4.34 | |||||||||
| Pay total return swaps designated to loans held for sale (a) |
250 | (2 | ) | 2 mos. | NM | 3.05 | |||||||||
| Total commercial mortgage banking risk management |
536 | (15 | ) | ||||||||||||
| Total accounting hedges (b) |
$ | 6,864 | $ | 233 | |||||||||||
| Free-Standing Derivatives |
|||||||||||||||
| Customer-related |
|||||||||||||||
| Interest rate |
|||||||||||||||
| Swaps |
$ | 37,046 | $ | 19 | 4 yrs. | 4.12 | % | 4.13 | % | ||||||
| Caps/floors |
|||||||||||||||
| Sold |
720 | (6 | ) | 4 yrs. 5 mos. | NM | NM | |||||||||
| Purchased |
274 | 4 | 2 yrs. 10 mos. | NM | NM | ||||||||||
| Futures |
3,908 | 1 yr. 5 mos. | NM | NM | |||||||||||
| Foreign exchange |
10,082 | (1 | ) | 4 mos. | NM | NM | |||||||||
| Equity |
2,080 | (58 | ) | 2 yrs. 3 mos. | NM | NM | |||||||||
| Swaptions |
1,364 | 6 | 18 yrs. 2 mos. | NM | NM | ||||||||||
| Other |
330 | 1 | 10 yrs. 11 mos. | NM | NM | ||||||||||
| Total customer-related |
55,804 | (35 | ) | ||||||||||||
| Other risk management and proprietary |
|||||||||||||||
| Interest rate |
|||||||||||||||
| Swaps |
8,640 | 1 | 6 yrs. 3 mos. | 4.32 | % | 4.29 | % | ||||||||
| Basis swaps |
1,267 | 2 yrs. 4 mos. | 3.75 | 4.18 | |||||||||||
| Pay fixed swaps |
1,872 | (36 | ) | 9 yrs. 11 mos. | 4.40 | 4.18 | |||||||||
| Caps/floors |
|||||||||||||||
| Sold |
1,000 | (15 | ) | 3 yrs. 11 mos. | NM | NM | |||||||||
| Purchased |
1,010 | 15 | 3 yrs. 11 mos. | NM | NM | ||||||||||
| Futures |
23,125 | 1 | 1 yr. | NM | NM | ||||||||||
| Credit derivatives |
1,353 | (5 | ) | 4 yrs. 9 mos. | NM | NM | |||||||||
| Risk participation agreements |
339 | 8 yrs. 2 mos. | NM | NM | |||||||||||
| Commitments related to mortgage-related assets |
3,330 | 23 | 1 mo. | NM | NM | ||||||||||
| Options |
|||||||||||||||
| Eurodollar |
21,600 | (1 | ) | 5 mos. | NM | NM | |||||||||
| Treasury notes/bonds |
60 | 2 mos. | NM | NM | |||||||||||
| Mortgage |
300 | 2 mos. | NM | NM | |||||||||||
| Swaptions |
20,004 | 32 | 5 yrs. 10 mos. | NM | NM | ||||||||||
| Other |
49 | 2 | 6 mos. | NM | NM | ||||||||||
| Total other risk management and proprietary |
83,949 | 17 | |||||||||||||
| Total free-standing derivatives |
$ | 139,753 | $ | (18 | ) | ||||||||||
| (a) | The floating rate portion of interest rate contracts is based on money-market indices. As a percent of a notional amount, 57% were based on 1-month LIBOR, 43% on 3-month LIBOR. |
| (b) | Fair value amounts include accrued interest of $65 million. |
NM Not meaningful
32
Financial Derivatives - 2004
|
Notional Amount |
Fair Value |
Weighted-Average Maturity |
Weighted-Average Interest Rates |
||||||||||||
| December 31, 2004 - dollars in millions |
Paid |
Received |
|||||||||||||
| Accounting Hedges |
|||||||||||||||
| Interest rate risk management |
|||||||||||||||
| Asset rate conversion |
|||||||||||||||
| Interest rate swaps (a) |
|||||||||||||||
| Receive fixed |
$ | 360 | $ | (1 | ) | 5 yrs. 1 mo. | 3.97 | % | 3.72 | % | |||||
| Pay fixed |
12 | 3 yrs. 1 mo. | 3.68 | 3.69 | |||||||||||
| Interest rate caps (b) |
4 | 5 yrs. 3 mos. | NM | NM | |||||||||||
| Futures contracts |
124 | 2 yrs. | NM | NM | |||||||||||
| Total asset rate conversion |
500 | (1 | ) | ||||||||||||
| Liability rate conversion |
|||||||||||||||
| Interest rate swaps (a) |
|||||||||||||||
| Receive fixed |
3,745 | 215 | 7 yrs. 5 mos. | 4.12 | 5.64 | ||||||||||
| Total interest rate risk management |
4,245 | 214 | |||||||||||||
| Commercial mortgage banking risk management |
|||||||||||||||
| Pay fixed interest rate swaps (a) |
195 | (4 | ) | 10 yrs. 4 mos. | 4.79 | 4.66 | |||||||||
| Pay total return swaps designated to loans held for sale (a) |
75 | (1 | ) | NM | 1.98 | ||||||||||
| Total commercial mortgage banking risk management |
270 | (5 | ) | ||||||||||||
| Total accounting hedges (c) |
$ | 4,515 | $ | 209 | |||||||||||
| Free-Standing Derivatives |
|||||||||||||||
| Customer-related |
|||||||||||||||
| Interest rate |
|||||||||||||||
| Swaps |
$ | 32,339 | $ | 18 | 3 yrs. 9 mos. | 3.91 | % | 3.90 | % | ||||||
| Caps/floors |
|||||||||||||||
| Sold |
698 | (8 | ) | 3 yrs. 8 mos. | NM | NM | |||||||||
| Purchased |
452 | 7 | 2 yrs. 5 mos. | NM | NM | ||||||||||
| Futures |
3,014 | 1 | 1 yr. | NM | NM | ||||||||||
| Foreign exchange |
7,245 | 10 | 6 mos. | NM | NM | ||||||||||
| Equity |
2,186 | (29 | ) | 2 yrs. 4 mos. | NM | NM | |||||||||
| Swaptions |
644 | 17 yrs. 11 mos. | NM | NM | |||||||||||
| Other |
330 | 1 | 10 yrs. 9 mos. | NM | NM | ||||||||||
| Total customer-related |
46,908 | ||||||||||||||
| Other risk management and proprietary |
|||||||||||||||
| Interest rate |
|||||||||||||||
| Swaps |
4,347 | (2 | ) | 7 yrs. 10 mos. | 4.29 | 4.30 | |||||||||
| Basis swaps |
1,064 | 2 | 1 yr. 1 mo. | 3.04 | 3.15 | ||||||||||
| Pay fixed swaps |
1,204 | (10 | ) | 10 yrs. 7 mos. | 4.37 | 4.41 | |||||||||
| Futures |
9,329 | 2 yrs. 4 mos. | NM | NM | |||||||||||
| Credit derivatives |
359 | (4 | ) | 4 yrs. 5 mos. | NM | NM | |||||||||
| Risk participation agreements |
230 | 6 yrs. 8 mos. | NM | NM | |||||||||||
| Commitments related to mortgage-related assets |
782 | 1 | 2 mos. | NM | NM | ||||||||||
| Options |
|||||||||||||||
| Eurodollar |
27,750 | 2 | 4 mos. | NM | NM | ||||||||||
| Treasury notes/bonds |
890 | (2 | ) | 2 mos. | NM | NM | |||||||||
| Swaptions |
9,589 | (1 | ) | 5 yrs. 10 mos. | NM | NM | |||||||||
| Other |
45 | 4 mos. | NM | NM | |||||||||||
| Total other risk management and proprietary |
55,589 | (14 | ) | ||||||||||||
| Total free-standing derivatives |
$ | 102,497 | $ | (14 | ) | ||||||||||
| (a) | The floating rate portion of interest rate contracts is based on money-market indices. As a percent of a notional amount, 38% were based on 1-month LIBOR, 62% on 3-month LIBOR. |
| (b) | Interest rate caps with a notional amount of $4 million require the counterparty to pay the Corporation the excess, if any, of the Prime Rate over a weighted-average strike of 5.03%. At December 31, 2004, the Prime Rate was 5.25%. |
| (c) | Fair value amounts include accrued interest of $45 million. |
NM - Not meaningful
33
INTERNAL CONTROLS AND DISCLOSURE CONTROLS AND PROCEDURES
As of June 30, 2005, we performed an evaluation under the supervision and with the participation of our management, including the Chairman and Chief Executive Officer and the Vice Chairman and Chief Financial Officer, of the effectiveness of the design and operation of our disclosure controls and procedures and of changes in our internal control over financial reporting.
Based on that evaluation, our management, including the Chairman and Chief Executive Officer and the Vice Chairman and Chief Financial Officer, concluded that our disclosure controls and procedures were effective as of June 30, 2005, and that there has been no change in internal control over financial reporting that occurred during the second quarter of 2005 that has materially affected, or is reasonably likely to materially affect, our internal control over financial reporting.
Accounting/administration net fund assets - Net domestic and foreign fund investment assets for which we provide accounting and administration services. We do not include these assets on our Consolidated Balance Sheet.
Adjusted average total assets - Primarily comprised of total average quarterly (or annual) assets plus (less) unrealized losses (gains) on available-for-sale debt securities, less goodwill and certain other intangible assets.
Annualized - Adjusted to reflect a full year of activity.
Assets under management - Assets over which we have sole or shared investment authority for our customers/clients. We do not include these assets on our Consolidated Balance Sheet.
Charge-off - Process of removing a loan or portion of a loan from a banks balance sheet because the loan is considered uncollectible. A charge-off is also recorded when a loan is transferred to held for sale and the loans market value is less than its carrying amount.
Common shareholders equity to total assets - Common shareholders equity divided by total assets. Common shareholders equity equals total shareholders equity less preferred stock and the portion of capital surplus and retained interest related to the preferred stock.
Credit derivatives - Contractual agreements that provide protection against a credit event of one or more referenced credits. The nature of a credit event is established by the protection buyer and protection seller at the inception of a transaction, and such events include bankruptcy, insolvency and failure to meet payment obligations when due. The buyer of the credit derivative pays a periodic fee in return for a payment by the protection seller upon the occurrence, if any, of a credit event.
Custody assets - All investment assets held on behalf of clients under safekeeping arrangements. We do not include these assets on our Consolidated Balance Sheet. Investment assets held in custody at other institutions on our behalf are included in the appropriate asset categories on the Consolidated Balance Sheet as if physically held by us.
Derivatives - Financial contracts whose value is derived from publicly traded securities, interest rates, currency exchange rates or market indices. Derivatives cover a wide assortment of financial contracts, including forward contracts, futures, options and swaps.
Duration of equity - An estimate of the rate sensitivity of a firms economic value of equity. A negative duration of equity is associated with asset sensitivity (i.e., positioned for rising interest rates), while a positive value implies liability sensitivity (i.e., vulnerable to rising rates). For example, if the duration of equity is +1.5 years, the economic value of equity declines by 1.5% for each 100 basis point increase in interest rates.
Earning assets - Assets that generate income, which include: federal funds sold; resale agreements; other short-term investments, including trading securities; loans held for sale; loans, net of unearned income; securities; and certain other assets.
Economic Capital - Represents the amount of resources that a business segment should hold to guard against potentially large losses that could cause insolvency. It is based on a measurement of economic risk, as opposed to risk as defined by regulatory bodies or generally accepted accounting principles. The economic capital measurement process involves converting a risk distribution to the capital that is required to support the risk, consistent with an institutions target credit rating. As such, economic risk serves as a common currency of risk that allows an institution to compare different risks on a similar basis.
Economic value of equity (EVE) - The present value of the expected cash flows of our existing assets less the present value of the expected cash flows of our existing liabilities, plus the present value of the net cash flows of our existing off-balance sheet positions.
Effective duration - A measurement, expressed in years, that, when multiplied by a change in interest rates, would approximate the percentage change in value of on- and off-balance sheet positions.
Efficiency - Noninterest expense divided by the sum of net interest income and noninterest income.
Foreign exchange contracts - Contracts that provide for the future receipt and delivery of foreign currency at previously agreed-upon terms.
34
Funds transfer pricing - A management accounting methodology designed to recognize the net interest income effects of sources and uses of funds provided by the assets and liabilities of business segments. These balances are assigned funding rates that represent the interest cost for us to raise/invest funds with similar maturity and repricing structures, using the least-cost funding sources available.
Futures and forward contracts - - Contracts in which the buyer agrees to purchase and the seller agrees to deliver a specific financial instrument at a predetermined price or yield. May be settled either in cash or by delivery of the underlying financial instrument.
Institutional lending repositioning - A 2001 PNC strategic action taken to build a more diverse and valuable business mix designed to create shareholder value over time by reducing lending leverage and improving the risk/return characteristics of the banking business.
Interest rate floors and caps - Interest rate protection instruments that involve payment from the seller to the buyer of an interest differential, which represents the difference between a short-term rate (e.g., three-month LIBOR) and an agreed-upon rate (the strike rate) applied to a notional principal amount.
Interest rate swap contracts - Contracts that are entered into primarily as an asset/liability management strategy to reduce interest rate risk. Interest rate swap contracts are exchanges of interest rate payments, such as fixed-rate payments for floating-rate payments, based on notional principal amounts.
Leverage ratio - Tier 1 risk-based capital divided by adjusted average total assets.
Net interest margin - Annualized taxable-equivalent net interest income divided by average earning assets.
Nondiscretionary assets under administration - Assets we hold for our customers/clients in a non-discretionary, custodial capacity. We do not include these assets on our Consolidated Balance Sheet.
Noninterest income to total revenue - Noninterest income divided by the sum of net interest income and noninterest income.
Nonperforming assets - Nonperforming assets include nonaccrual loans, troubled debt restructured loans, nonaccrual loans held for sale, foreclosed assets and other assets. Interest income does not accrue on assets classified as nonperforming.
Nonperforming loans - Nonperforming loans include loans to commercial, lease financing, consumer, commercial real estate and residential mortgage customers as well as troubled debt restructured loans. Nonperforming loans do not include nonaccrual loans held for sale or foreclosed and other assets. Interest income does not accrue on loans classified as nonperforming.
Notional amount - A number of currency units, shares, or other units specified in a derivatives contract.
Recovery - Cash proceeds received on a loan that had previously been charged off. The amount received is credited to the allowance for loan and lease losses.
Return on capital - Annualized net income divided by average capital.
Return on average assets - Annualized net income divided by average assets.
Return on average common equity - Annualized net income divided by average common shareholders equity.
Risk-weighted assets - Primarily computed by the assignment of specific risk-weights (as defined by The Board of Governors of the Federal Reserve System) to assets and off-balance sheet instruments.
Securitization - The process of legally transforming financial assets into securities.
Tangible common capital ratio - Common shareholders equity less goodwill and other intangible assets (excluding mortgage servicing rights) divided by assets less goodwill and other intangible assets (excluding mortgage servicing rights).
Taxable-equivalent interest - The interest income earned on certain assets is completely or partially exempt from federal income tax. As such, these tax-exempt instruments typically yield lower returns than a taxable investment. To provide more meaningful comparisons of yields and margins for all earning assets, the interest income earned on tax-exempt assets is increased to make it fully equivalent to interest income on other taxable investments.
Tier 1 risk-based capital - - Tier 1 risk-based capital equals: total shareholders equity, plus trust preferred capital securities, plus certain minority interests that are held by others; less goodwill and certain other intangible assets, less equity investments in nonfinancial companies and less net unrealized holding losses on available-for-sale equity securities. Net unrealized holding gains on available-for-sale equity securities, net unrealized holding gains (losses) on available-for-sale debt securities and net unrealized holding gains (losses) on cash flow hedge derivatives are excluded from total shareholders equity for tier 1 risk-based capital purposes.
Tier 1 risk-based capital ratio - Tier 1 risk-based capital divided by period-end risk-weighted assets.
Total fund assets serviced - Total domestic and offshore fund investment assets for which we provide related processing services. We do not include these assets on our Consolidated Balance Sheet.
Total deposits - The sum of total transaction deposits, savings accounts, retail certificates of deposit, other time deposits and time deposits in foreign offices.
Total return swap - A non-traditional swap where one party agrees to pay the other the total return of a defined underlying asset (e.g., loan), usually in return for receiving a stream of LIBOR based cash flows. The total returns of the asset, including interest and any default shortfall, are passed through to the counterparty. The counterparty is therefore assuming the credit and economic risk of the underlying asset.
35
Total risk-based capital - Tier 1 risk-based capital plus qualifying senior and subordinated debt, other minority interest not qualified as tier 1, and the allowance for loan and lease losses, subject to certain limitations.
Total risk-based capital ratio - Total risk-based capital divided by period-end risk-weighted assets.
Transaction deposits - The sum of money market and interest-bearing demand deposits and demand and other noninterest-bearing deposits.
Yield curve (shape of the yield curve, flat yield curve) - A graph showing the relationship between the yields on financial instruments or market indices of the same credit quality with different maturities. For example, a normal or positive yield curve exists when long-term bonds have higher yields than short-term bonds. A flat yield curve exists when yields are the same for short-term and long-term bonds. A steep yield curve exists when yields on long-term bonds are significantly higher than on short-term bonds.
CAUTIONARY STATEMENT REGARDING FORWARD-LOOKING INFORMATION
We make statements in this Report, and we may from time to time make other statements, regarding our outlook or expectations for earnings, revenues, expenses and/or other matters regarding or affecting PNC that are forward-looking statements within the meaning of the Private Securities Litigation Reform Act. Forward-looking statements are typically identified by words such as believe, expect, anticipate, intend, outlook, estimate, forecast, project and other similar words and expressions.
Forward-looking statements are subject to numerous assumptions, risks and uncertainties, which change over time. Forward-looking statements speak only as of the date they are made. We do not assume any duty and do not undertake to update our forward-looking statements. Actual results or future events could differ, possibly materially, from those that we anticipated in our forward-looking statements, and future results could differ materially from our historical performance.
In addition to factors that we have disclosed in our 2004 Annual Report on Form 10-K and in other reports that we file with the SEC and those that we discuss elsewhere in this Report, our forward-looking statements are subject to, among others, the following risks and uncertainties, which could cause actual results or future events to differ materially from those that we anticipated in our forward-looking statements or from our historical performance:
| | changes in political, economic or industry conditions, the interest rate environment, or the financial and capital markets (including as a result of actions of the Federal Reserve Board affecting interest rates, the money supply, or otherwise reflecting changes in monetary policy), which could affect: (a) credit quality and the extent of our credit losses; (b) the extent of funding of our unfunded loan commitments and letters of credit; (c) our allowances for loan and lease losses and unfunded loan commitments and letters of credit; (d) demand for our credit or fee-based products and services; (e) our net interest income; (f) the value of assets under management and assets serviced, of private equity investments, of other debt and equity investments, of loans held for sale, or of other on-balance sheet or off-balance sheet assets; or (g) the availability and terms of funding necessary to meet our liquidity needs; |
| | the impact on us of legal and regulatory developments, including the following: (a) the resolution of legal proceedings or regulatory and other governmental inquiries; (b) increased litigation risk from recent regulatory and other governmental developments; (c) the results of the regulatory examination process, our failure to satisfy the requirements of agreements with governmental agencies, and regulators future use of supervisory and enforcement tools; (d) legislative and regulatory reforms, including changes to tax laws; and (e) changes in accounting policies and principles, with the impact of any such developments possibly affecting our ability to operate our businesses or our financial condition or results of operations or our reputation, which in turn could have an impact on such matters as business generation and retention, our ability to attract and retain management, liquidity and funding; |
| | the impact on us of changes in the nature and extent of our competition; |
| | the introduction, withdrawal, success and timing of our business initiatives and strategies; |
| | customer acceptance of our products and services, and our customers borrowing, repayment, investment and deposit practices; |
| | the impact on us of changes in the extent of customer or counterparty delinquencies, bankruptcies or defaults, which could affect, among other things, credit and asset quality risk and our provision for credit losses; |
| | the ability to identify and effectively manage risks inherent in our businesses; |
| | how we choose to redeploy available capital, including the extent and timing of any share repurchases and acquisitions or other investments in our businesses; |
| | the impact, extent and timing of technological changes, the adequacy of intellectual property protection, and costs associated with obtaining rights in intellectual property claimed by others; |
36
| | the timing and pricing of any sales of loans or other financial assets held for sale; |
| | our ability to obtain desirable levels of insurance and to successfully submit claims under applicable insurance policies; |
| | the relative and absolute investment performance of assets under management; and |
| | the extent of terrorist activities and international hostilities, increases or continuations of which may adversely affect the economy and financial and capital markets generally or us specifically. |
Our future results are likely to be affected significantly by the results of the implementation of our One PNC initiative, as discussed in this Report. Generally, the amounts of our anticipated cost savings and revenue enhancements are based to some extent on estimates and assumptions regarding future business performance and expenses, and these estimates and assumptions may prove to be inaccurate in some respects. Some or all of the above factors may cause the anticipated expense savings and revenue enhancements from that initiative not to be achieved in their entirety, not to be accomplished within the expected time frame, or to result in implementation charges beyond those currently contemplated or some other unanticipated adverse impact. Furthermore, the implementation of cost savings ideas may have unintended impacts on our ability to attract and retain business and customers, while revenue enhancement ideas may not be successful in the marketplace or may result in unintended costs. Assumed attrition required to achieve workforce reductions may not come in the right places or at the right times to meet planned goals.
In addition, we grow our business from time to time by acquiring other financial services companies. Acquisitions in general present us with a number of risks and uncertainties related both to the acquisition transactions themselves and to the integration of the acquired businesses into PNC after closing. In particular, acquisitions may be substantially more expensive to complete (including the integration of the acquired company) and the anticipated benefits, including anticipated cost savings and strategic gains, may be significantly harder or take longer to achieve than expected. As a regulated financial institution, our pursuit of attractive acquisition opportunities could be negatively impacted due to regulatory delays or other regulatory issues. Regulatory and/or legal issues of an acquired business may cause reputational harm to PNC following the acquisition and integration of the acquired business into ours and may result in additional future costs and expenses arising as a result of those issues. Recent acquisitions, including our acquisition of Riggs National Corporation, continue to present the post-closing risks and uncertainties described above.
You can find additional information on the foregoing risks and uncertainties and additional factors that could affect the results anticipated in our forward-looking statements or from our historical performance in our 2004 Annual Report on Form 10-K and in other reports that we file with the SEC. You can access our SEC reports on the SECs website at www.sec.gov or on or through the PNC corporate website at www.pnc.com.
Also, risks and uncertainties that could affect the results anticipated in forward-looking statements or from historical performance relating to our majority-owned subsidiary BlackRock, Inc. are discussed in more detail in BlackRocks filings with the SEC, accessible on the SECs website and on or through BlackRocks website at www.blackrock.com.
37
THE PNC FINANCIAL SERVICES GROUP, INC.
|
Three months ended June 30 |
Six months ended June 30 |
|||||||||||||
| In millions, except per share data Unaudited |
2005 |
2004 |
2005 |
2004 |
||||||||||
| INTEREST INCOME | ||||||||||||||
| Loans and fees on loans |
$ | 646 | $ | 490 | $ | 1,224 | $ | 980 | ||||||
| Securities available for sale and held to maturity |
199 | 130 | 372 | 275 | ||||||||||
| Other |
56 | 38 | 109 | 69 | ||||||||||
| Total interest income |
901 | 658 | 1,705 | 1,324 | ||||||||||
| INTEREST EXPENSE | ||||||||||||||
| Deposits |
224 | 107 | 406 | 211 | ||||||||||
| Borrowed funds |
143 | 70 | 259 | 138 | ||||||||||
| Total interest expense |
367 | 177 | 665 | 349 | ||||||||||
| Net interest income |
534 | 481 | 1,040 | 975 | ||||||||||
| Provision for (recoveries of) credit losses |
(27 | ) | 8 | (19 | ) | 20 | ||||||||
| Net interest income less provision for credit losses |
561 | 473 | 1,059 | 955 | ||||||||||
| NONINTEREST INCOME | ||||||||||||||
| Asset management |
334 | 252 | 648 | 505 | ||||||||||
| Fund servicing |
219 | 200 | 439 | 404 | ||||||||||
| Service charges on deposits |
67 | 63 | 126 | 122 | ||||||||||
| Brokerage |
57 | 56 | 112 | 114 | ||||||||||
| Consumer services |
74 | 67 | 140 | 130 | ||||||||||
| Corporate services |
117 | 128 | 224 | 253 | ||||||||||
| Equity management gains |
12 | 35 | 44 | 42 | ||||||||||
| Net securities gains (losses) |
(26 | ) | 14 | (35 | ) | 29 | ||||||||
| Other |
71 | 95 | 200 | 222 | ||||||||||
| Total noninterest income |
925 | 910 | 1,898 | 1,821 | ||||||||||
| NONINTEREST EXPENSE | ||||||||||||||
| Compensation |
481 | 414 | 960 | 803 | ||||||||||
| Employee benefits |
86 | 77 | 169 | 151 | ||||||||||
| Net occupancy |
72 | 67 | 145 | 135 | ||||||||||
| Equipment |
74 | 70 | 148 | 144 | ||||||||||
| Marketing |
25 | 24 | 45 | 44 | ||||||||||
| Other |
298 | 258 | 568 | 528 | ||||||||||
| Total noninterest expense |
1,036 | 910 | 2,035 | 1,805 | ||||||||||
| Income before minority and noncontrolling interests and income taxes |
450 | 473 | 922 | 971 | ||||||||||
| Minority and noncontrolling interests in income of consolidated entities |
9 | 11 | 15 | 18 | ||||||||||
| Income taxes |
159 | 158 | 271 | 321 | ||||||||||
| Net income |
$ | 282 | $ | 304 | $ | 636 | $ | 632 | ||||||
| EARNINGS PER COMMON SHARE | ||||||||||||||
| Basic |
$ | .99 | $ | 1.08 | $ | 2.25 | $ | 2.24 | ||||||
| Diluted |
$ | .98 | $ | 1.07 | $ | 2.22 | $ | 2.22 | ||||||
| AVERAGE COMMON SHARES OUTSTANDING | ||||||||||||||
| Basic |
285 | 281 | 283 | 282 | ||||||||||
| Diluted |
288 | 283 | 286 | 284 | ||||||||||
See accompanying Notes To Consolidated Financial Statements.
38
THE PNC FINANCIAL SERVICES GROUP, INC.
| In millions, except par value Unaudited |
June 30 2005 |
December 31 2004 |
||||||
| ASSETS | ||||||||
| Cash and due from banks |
$ | 3,442 | $ | 3,230 | ||||
| Federal funds sold and resale agreements |
89 | 1,635 | ||||||
| Other short-term investments, including trading securities |
2,203 | 1,848 | ||||||
| Loans held for sale |
2,275 | 1,670 | ||||||
| Securities available for sale and held to maturity |
20,437 | 16,761 | ||||||
| Loans, net of unearned income of $847 and $902 |
49,317 | 43,495 | ||||||
| Allowance for loan and lease losses |
(628 | ) | (607 | ) | ||||
| Net loans |
48,689 | 42,888 | ||||||
| Goodwill |
3,418 | 3,001 | ||||||
| Other intangible assets |
752 | 354 | ||||||
| Other |
9,489 | 8,336 | ||||||
| Total assets |
$ | 90,794 | $ | 79,723 | ||||
| LIABILITIES | ||||||||
| Deposits |
||||||||
| Noninterest-bearing |
$ | 13,751 | $ | 12,915 | ||||
| Interest-bearing |
44,922 | 40,354 | ||||||
| Total deposits |
58,673 | 53,269 | ||||||
| Borrowed funds |
||||||||
| Federal funds purchased |
2,701 | 219 | ||||||
| Repurchase agreements |
2,042 | 1,376 | ||||||
| Bank notes and senior debt |
2,920 | 2,383 | ||||||
| Subordinated debt |
4,105 | 4,050 | ||||||
| Commercial paper |
3,998 | 2,251 | ||||||
| Other borrowed funds |
2,440 | 1,685 | ||||||
| Total borrowed funds |
18,206 | 11,964 | ||||||
| Allowance for unfunded loan commitments and letters of credit |
84 | 75 | ||||||
| Accrued expenses |
2,358 | 2,406 | ||||||
| Other |
2,723 | 4,032 | ||||||
| Total liabilities |
82,044 | 71,746 | ||||||
| Minority and noncontrolling interests in consolidated entities |
507 | 504 | ||||||
| SHAREHOLDERS EQUITY | ||||||||
| Preferred stock (a) |
||||||||
| Common stock - $5 par value |
||||||||
| Authorized 800 shares, issued 353 shares |
1,764 | 1,764 | ||||||
| Capital surplus |
1,353 | 1,265 | ||||||
| Retained earnings |
8,626 | 8,273 | ||||||
| Deferred compensation expense |
(70 | ) | (51 | ) | ||||
| Accumulated other comprehensive loss |
(41 | ) | (54 | ) | ||||
| Common stock held in treasury at cost: 62 and 70 shares |
(3,389 | ) | (3,724 | ) | ||||
| Total shareholders equity |
8,243 | 7,473 | ||||||
| Total liabilities, minority and noncontrolling interests, and shareholders equity |
$ | 90,794 | $ | 79,723 | ||||
| (a) | Less than $.5 million at each date. |
See accompanying Notes To Consolidated Financial Statements.
39
CONSOLIDATED STATEMENT OF CASH FLOWS
THE PNC FINANCIAL SERVICES GROUP, INC.
| Six months ended June 30 - in millions Unaudited |
2005 |
2004 |
||||||
| OPERATING ACTIVITIES | ||||||||
| Net income |
$ | 636 | $ | 632 | ||||
| Adjustments to reconcile net income to net cash provided by operating activities |
||||||||
| Provision for (recoveries of) credit losses |
(19 | ) | 20 | |||||
| Depreciation, amortization and accretion |
166 | 150 | ||||||
| Deferred income taxes |
15 | 21 | ||||||
| Securities transactions |
35 | (29 | ) | |||||
| Valuation adjustments |
(4 | ) | (32 | ) | ||||
| Net change in |
||||||||
| Loans held for sale |
(590 | ) | (53 | ) | ||||
| Other short-term investments |
(221 | ) | (726 | ) | ||||
| Other |
(1,105 | ) | (44 | ) | ||||
| Net cash used by operating activities |
(1,087 | ) | (61 | ) | ||||
| INVESTING ACTIVITIES | ||||||||
| Net change in |
||||||||
| Loans |
(1,808 | ) | (1,748 | ) | ||||
| Federal funds sold and resale agreements |
2,036 | 780 | ||||||
| Repayment of securities |
1,653 | 2,058 | ||||||
| Sales |
||||||||
| Securities |
9,993 | 4,608 | ||||||
| Loans |
7 | 1 | ||||||
| Foreclosed and other nonperforming assets |
9 | 10 | ||||||
| Purchases |
||||||||
| Securities |
(15,397 | ) | (5,514 | ) | ||||
| Loans |
(1,200 | ) | (1,382 | ) | ||||
| Cash received from acquisitions and divestitures |
237 | 584 | ||||||
| Cash paid for acquisitions |
(609 | ) | (336 | ) | ||||
| Other |
(118 | ) | (118 | ) | ||||
| Net cash used by investing activities |
(5,197 | ) | (1,057 | ) | ||||
| FINANCING ACTIVITIES | ||||||||
| Net change in |
||||||||
| Noninterest-bearing deposits |
(1,517 | ) | 354 | |||||
| Interest-bearing deposits |
3,173 | 2,118 | ||||||
| Federal funds purchased |
2,481 | 850 | ||||||
| Repurchase agreements |
356 | 52 | ||||||
| Commercial paper |
1,747 | (483 | ) | |||||
| Sales/issuances |
||||||||
| Bank notes and senior debt |
1,299 | |||||||
| Subordinated debt |
6 | |||||||
| Other borrowed funds |
58,190 | 14,890 | ||||||
| Common stock |
80 | 93 | ||||||
| Repayments/maturities |
||||||||
| Bank notes and senior debt |
(750 | ) | ||||||
| Subordinated debt |
(351 | ) | (200 | ) | ||||
| Other borrowed funds |
(57,849 | ) | (15,942 | ) | ||||
| Acquisition of treasury stock |
(80 | ) | (240 | ) | ||||
| Cash dividends paid |
(283 | ) | (283 | ) | ||||
| Net cash provided by financing activities |
6,496 | 1,215 | ||||||
| NET INCREASE IN CASH AND DUE FROM BANKS | 212 | 97 | ||||||
| Cash and due from banks at beginning of period |
3,230 | 2,968 | ||||||
| Cash and due from banks at end of period |
$ | 3,442 | $ | 3,065 | ||||
| CASH PAID FOR | ||||||||
| Interest |
$ | 603 | $ | 337 | ||||
| Income taxes |
313 | 237 | ||||||
| NON-CASH ITEMS | ||||||||
| Transfer from (to) loans to (from) loans held for sale, net |
11 | (30 | ) | |||||
| Transfer from loans to other assets |
10 | 14 | ||||||
See accompanying Notes To Consolidated Financial Statements.
40
NOTES TO CONSOLIDATED FINANCIAL STATEMENTS (UNAUDITED)
THE PNC FINANCIAL SERVICES GROUP, INC.
BUSINESS
We are one of the largest diversified financial services companies in the United States, operating businesses engaged in:
| | Regional community banking, |
| | Wholesale banking, |
| | Wealth management, |
| | Asset management, and |
| | Global fund processing services. |
We provide many of our products and services nationally and others in our primary geographic markets located in Pennsylvania, New Jersey, Delaware, Ohio, Kentucky and the greater Washington, D.C. region. We also provide certain asset management and global fund processing services internationally. We are subject to intense competition from other financial services companies and are subject to regulation by various domestic and international authorities.
BASIS OF FINANCIAL STATEMENT PRESENTATION
Our unaudited interim consolidated financial statements include the accounts of the parent company and its subsidiaries, most of which are wholly owned, and certain partnership interests and variable interest entities. We prepared these interim consolidated financial statements in accordance with accounting principles generally accepted in the United States of America (GAAP). We have eliminated all significant intercompany accounts and transactions. We have also reclassified certain prior period amounts to conform with the 2005 presentation. These reclassifications did not have a material impact on our consolidated financial condition or results of operations.
In our opinion, the interim consolidated financial statements reflect all normal, recurring adjustments needed to present fairly our results for the interim periods.
When preparing these interim consolidated financial statements, we have assumed that you have read the audited consolidated financial statements included in our 2004 Annual Report on Form 10-K.
BUSINESS COMBINATIONS
We record the net assets of companies that we acquire at their estimated fair value at the date of acquisition and we include the results of operations of the acquired business in our consolidated income statement from the date of acquisition. We recognize as goodwill the excess of the purchase price over the estimated fair value of the net assets acquired.
USE OF ESTIMATES
We prepare the interim consolidated financial statements using financial information available at the time, which requires us to make estimates and assumptions that affect the amounts reported. Actual results will differ from these estimates and the differences may be material to the consolidated financial statements.
REVENUE RECOGNITION
We earn net interest and noninterest income from various sources, including:
| | Lending, |
| | Securities portfolio, |
| | Investment management and fund servicing, |
| | Customer deposits, |
| | Loan servicing, |
| | Brokerage services, and |
| | Securities and derivatives trading activities including foreign exchange. |
We also earn revenue from selling loans and securities, and we recognize income or loss from certain private equity activities. We also earn fees and commissions from:
| | Issuing loan commitments, standby letters of credit and financial guarantees, |
| | Selling various insurance products, |
| | Providing treasury management services, and |
| | Participating in certain capital markets transactions. |
We recognize revenue from loan servicing, securities and derivatives and foreign exchange trading, and securities underwriting activities as they are earned based on contractual terms, as transactions occur or as services are provided. Revenue earned on interest-earning assets is recognized based on the effective yield of the financial instrument. Service charges on deposit accounts are recognized as charged. Brokerage fees and gains on the sale of securities and certain derivatives are recognized on a trade-date basis.
We recognize asset management and fund servicing fees primarily as the services are performed. Asset management fees are generally based on a percentage of the fair value of the assets under management and performance fees are generally based on a percentage of the returns on such assets. Fund servicing fees are primarily based on a percentage of the fair value of the fund assets and the number of shareholder accounts we service.
We recognize revenue from the sale of loans upon closing of the transaction. We record private equity income or loss based on changes in the valuation of the underlying investments or when we dispose of our interest.
In certain circumstances, revenue is reported net of associated expenses in accordance with applicable accounting guidance and industry practice.
LOANS AND LEASES
Loans are stated at the principal amounts outstanding, net of unearned income and premium or discount on loans purchased. Interest income related to loans other than nonaccrual loans is accrued based on the principal amount outstanding and credited to interest income as earned using the interest method. Significant loan fees are deferred and accreted to interest income over the respective lives of the
41
loans. Loan origination costs are not deferred and are included in noninterest expense. The net impact of this practice compared with full accrual of fees and amortization of costs is not material to our consolidated results of operations.
We also provide financing for various types of equipment, aircraft, energy and power systems, and rolling stock through a variety of lease arrangements. Direct financing leases are carried at the aggregate of lease payments plus estimated residual value of the leased property, less unearned income. Leveraged leases, a form of financing lease, are carried net of nonrecourse debt. We recognize income over the term of the lease using methods that approximate the interest method. Lease residual values are reviewed for impairment on at least an annual basis. Gains or losses on the sale of leased assets are included in other noninterest income while valuation adjustments on lease residuals are included in other noninterest expense.
NONPERFORMING ASSETS
Nonperforming assets include:
| | Nonaccrual loans, |
| | Troubled debt restructurings, |
| | Nonaccrual loans held for sale, and |
| | Foreclosed assets. |
Other than consumer loans, we generally classify loans and loans held for sale as nonaccrual when we determine that the collection of interest or principal is doubtful or when a default of interest or principal has existed for 90 days or more, unless the loans are well secured and in the process of collection. When interest accrual is discontinued, accrued but uncollected interest credited to income in the current year is reversed and unpaid interest accrued in the prior year, if any, is charged against the allowance for loan and lease losses. We classify home equity loans as nonaccrual at 120 days past due and home equity lines of credit as nonaccrual at 180 days past due and record them at the lower of cost or market value, less liquidation costs, unless the loans are well-secured and in the process of collection. Loans well-secured by residential real estate, including home equity and home equity lines of credit, are classified as nonaccrual at 12 months past due. We charge off loans other than consumer loans based on the facts and circumstances of the individual loan. Consumer loans that are not well-secured or in the process of collection are generally charged-off in the month they become 120 days past due.
A loan is categorized as a troubled debt restructuring in the period of restructuring if a significant concession is granted due to deterioration in the financial condition of the borrower.
Nonperforming loans are generally not returned to performing status until the obligation is brought current and the borrower has performed in accordance with the contractual terms for a reasonable period of time and collection of the contractual principal and interest is no longer doubtful.
Nonaccrual commercial and commercial real estate loans and troubled debt restructurings are designated as impaired loans. We recognize interest collected on these loans on the cash basis or cost recovery method.
41
Foreclosed assets are comprised of any asset seized or property acquired through a foreclosure proceeding or acceptance of a deed-in-lieu of foreclosure. These assets are recorded on the date acquired at the lower of the related loan balance or market value of the collateral less estimated disposition costs. We estimate market values primarily based on appraisals when available or quoted market prices on liquid assets. Subsequently, foreclosed assets are valued at the lower of the amount recorded at acquisition date or the current market value less estimated disposition costs. Valuation adjustments on these assets and gains or losses realized from disposition of such property are reflected in noninterest expense.
ALLOWANCE FOR LOAN AND LEASE LOSSES
We maintain the allowance for loan and lease losses at a level that we believe to be adequate to absorb estimated probable credit losses inherent in the loan portfolio. The allowance is increased by the provision for credit losses, which is charged against operating results, and decreased by the amount of charge-offs, net of recoveries. Our determination of the adequacy of the allowance is based on periodic evaluations of the credit portfolio and other relevant factors. This evaluation is inherently subjective as it requires material estimates, all of which may be susceptible to significant change, including, among others:
| | Expected default probabilities, |
| | Loss given default, |
| | Exposure at default, |
| | Amounts and timing of expected future cash flows on impaired loans, |
| | Value of collateral, |
| | Estimated losses on consumer loans and residential mortgages, and |
| | General amounts for historical loss experience, economic conditions, potential estimation or judgmental errors, losses and inherent risks in the various credit portfolios. |
In determining the adequacy of the allowance for loan and lease losses, we make specific allocations to impaired loans, to pools of watchlist and nonwatchlist loans and to consumer and residential mortgage loans. We also allocate reserves to provide coverage for probable losses not covered in specific, pool and consumer reserve methodologies related to qualitative and measurement factors. While allocations are made to specific loans and pools of loans, the total reserve is available for all credit losses.
Specific allocations made to significant impaired loans are determined in accordance with Statement of Financial Accounting Standards No. (SFAS) 114, Accounting by Creditors for Impairment of a Loan, with impairment measured generally based on the present value of the loans expected cash flows, the loans observable market price or the fair value of the loans collateral. We establish a specific allowance on all other impaired loans at the applicable pool reserve allocation rate for similar loans.
42
Allocations to loan pools are developed by business segment and risk rating and are based on historical loss trends and our judgment concerning those trends and other relevant factors. These factors may include, among others:
| | Actual versus estimated losses, |
| | Regional and national economic conditions, |
| | Business segment and portfolio concentrations, |
| | Industry competition and consolidation, and |
| | The impact of government regulations. |
Loss factors are based on industry and/or internal experience and may be adjusted for significant factors that, based on our judgment, impact the collectibility of the portfolio as of the balance sheet date. Consumer and residential mortgage loan allocations are made at a total portfolio level based on historical loss experience adjusted for portfolio activity and economic conditions.
While our pool reserve methodologies strive to reflect all risk factors, there continues to be a certain element of uncertainty associated with, but not limited to, potential estimation or judgmental errors. We provide additional reserves that are designed to provide coverage for expected losses attributable to such risks. In addition, these incremental reserves also include factors which may not be directly measured in the determination of specific or pooled reserves. These factors include:
| | General economic and business conditions affecting our key lending areas, |
| | Credit quality trends, |
| | Recent loss experience in particular segments of the portfolio, |
| | Duration of the current economic cycle, and |
| | Bank regulatory examination results. |
STOCK-BASED COMPENSATION
We did not recognize stock-based employee compensation expense related to stock options before 2003 under prior GAAP.
Effective January 1, 2003, we adopted the fair value recognition provisions of SFAS 123, Accounting for Stock-Based Compensation, as amended by SFAS 148, Accounting for Stock-Based Compensation-Transition and Disclosure, prospectively to all employee awards granted, modified or settled after January 1, 2003. We did not restate results for prior years upon our adoption of SFAS 123. Since we adopted SFAS 123 prospectively, the cost related to stock-based employee compensation included in net income for the three months and six months ended June 30, 2005 and 2004 is less than what we would have recognized if we had applied the fair value based method to all awards since the original effective date of the standard.
The following table shows the effect on net income and earnings per share if we had applied the fair value recognition provisions of SFAS 123, as amended, to all outstanding and unvested awards in each period.
Pro Forma Net Income And Earnings Per Share
|
Three months ended |
||||||||
| In millions, except per share data |
June 30, 2005 |
June 30, 2004 |
||||||
| Net income as reported |
$ | 282 | $ | 304 | ||||
| Add: Stock-based employee compensation expense included in reported net income, net of related tax effects |
11 | 8 | ||||||
| Deduct: Total stock-based employee compensation expense determined under the fair value method for all awards, net of related tax effects |
(13 | ) | (13 | ) | ||||
| Pro forma net income |
$ | 280 | $ | 299 | ||||
| Earnings per share |
||||||||
| Basic-as reported |
$ | .99 | $ | 1.08 | ||||
| Basic-pro forma |
$ | .99 | $ | 1.06 | ||||
| Diluted-as reported |
$ | .98 | $ | 1.07 | ||||
| Diluted-pro forma |
$ | .97 | $ | 1.05 | ||||
|
Six months ended |
||||||||
| In millions, except per share data |
June 30, 2005 |
June 30, 2004 |
||||||
| Net income as reported |
$ | 636 | $ | 632 | ||||
| Add: Stock-based employee compensation expense included in reported net income, net of related tax effects |
23 | 16 | ||||||
| Deduct: Total stock-based employee compensation expense determined under the fair value method for all awards, net of related tax effects |
(26 | ) | (26 | ) | ||||
| Pro forma net income |
$ | 633 | $ | 622 | ||||
| Earnings per share |
||||||||
| Basic-as reported |
$ | 2.25 | $ | 2.24 | ||||
| Basic-pro forma |
$ | 2.23 | $ | 2.21 | ||||
| Diluted-as reported |
$ | 2.22 | $ | 2.22 | ||||
| Diluted-pro forma |
$ | 2.20 | $ | 2.19 | ||||
For purposes of computing stock option expense and pro forma results, we estimated the fair value of stock options and employee stock purchase plan shares using the Black-Scholes option pricing model. The model requires the use of numerous assumptions, many of which are very subjective. Therefore, the pro forma results are estimates of results of operations as if compensation expense had been recognized for all stock-based compensation awards and are not indicative of the impact on future periods.
43
We used the following assumptions in the option pricing model to determine 2005 and 2004 stock option expense.
Option Pricing Assumptions
| Weighted-average for the six months ended June 30 |
2005 |
2004 |
||||
| Risk-free interest rate |
3.7 | % | 3.4 | % | ||
| Dividend yield |
3.8 | % | 3.6 | % | ||
| Volatility |
26.1 | % | 28.9 | % | ||
| Expected life |
4.9 yrs. | 5.0 yrs. |
RECENT ACCOUNTING PRONOUNCEMENTS
In June 2005, the Emerging Issues Task Force (EITF) of the Financial Accounting Standards Board (FASB) issued EITF Issue 04-5, Determining Whether a General Partner, or the General Partners as a Group, Controls a Limited Partnership or Similar Entity When the Limited Partners Have Certain Rights. EITF 04-5 provides that the general partner(s) in a limited partnership is presumed to control the limited partnership, unless the limited partners possess either substantive participating rights or the substantive ability to dissolve the limited partnership or otherwise remove the general partner(s) without cause (kick-out rights). Kick-out rights are substantive if they can be exercised by a simple majority of the limited partners voting interests. The guidance applies to limited partnerships formed or modified after June 29, 2005, and to existing limited partnerships no later than January 1, 2006. We currently do not believe that EITF 04-5 will have a material impact on our consolidated financial statements.
In May 2005, the FASB issued SFAS 154, Accounting Changes and Error Corrections a replacement of APB Opinion No. 20 and FASB Statement No. 3. SFAS 154 generally requires retrospective application to prior periods financial statements of all voluntary changes in accounting principle and changes required when a new pronouncement does not include specific transition provisions. This standard applies to PNC beginning January 1, 2006. We do not expect the adoption of SFAS 154 to have a significant impact on our consolidated financial statements.
In September 2004, the FASB issued FASB Staff Position (FSP) EITF Issue 03-1-1, Effective Date of Paragraphs 10-20 of EITF Issue 03-1, which deferred the effective date of the recognition and measurement provisions of EITF 03-1, The Meaning of Other-Than-Temporary Impairment and Its Application to Certain Investments, until further guidance is issued. EITF 03-1 provided guidance for evaluating whether an investment is other-than-temporarily impaired and required disclosures about unrealized losses on available for sale debt and equity securities. In June 2005, the FASB decided not to provide additional guidance on the meaning of other-than-temporary impairment but intends to issue FSP FAS 115-1, The Meaning of Other-Than-Temporary Impairment and Its Application to Certain Investments. FSP FAS 115-1 will supersede EITF 03-1 and replace the guidance set forth in paragraphs 10-18 of EITF 03-1 with references to existing FASB, Securities and Exchange Commission (SEC) and EITF other-than-temporary impairment guidance. While we do not expect FSP 115-1 to have a material impact on our consolidated financial statements, the impact, if any, cannot be fully assessed until the final guidance is issued. At June 30, 2005, the total unrealized losses in the securities available for sale portfolio was $105 million compared with total unrealized losses of $125 million at December 31, 2004.
In December 2004, the FASB issued SFAS 123 (Revised 2004), Share-Based Payment (SFAS 123R). SFAS 123R replaces SFAS 123 and supersedes APB 25. SFAS 123R requires compensation cost related to share-based payments to employees to be recognized in the financial statements based on their fair value. In April 2005, the SEC issued a rule which delays the required effective date to the beginning of an entitys fiscal year which begins after June 15, 2005. Accordingly, we will adopt SFAS 123R effective January 1, 2006, using the modified prospective method of transition. This method requires the provisions of SFAS 123R be applied to new awards and awards modified, repurchased or cancelled after the effective date. Based on our review of the provisions of SFAS 123R and because we previously adopted the fair value recognition provisions of SFAS 123 on January 1, 2003, we do not expect the adoption of the revised standard to have a significant impact on our consolidated financial statements.
The American Jobs Creation Act of 2004 (the AJCA) created a one-time opportunity for US companies to repatriate undistributed earnings from foreign subsidiaries at a substantially reduced federal tax rate. The reduced rate is achieved via an 85% dividends received deduction. In our case, foreign earnings must be repatriated by December 31, 2005 to qualify for this deduction. FSP 109-2, Accounting and Disclosure Guidance for the Foreign Earnings Repatriation Provision within the American Jobs Creation Act of 2004, states that when an enterprise completes its evaluation of the repatriation provision, the total effect on income tax expense should be disclosed in the enterprises financial statements for that period. We do not expect that the impact of the foreign earnings repatriation provision of the AJCA on our consolidated financial statements will be significant.
44
RIGGS NATIONAL CORPORATION
We acquired Riggs National Corporation (Riggs), a Washington D.C. based banking company, effective May 13, 2005. Under the terms of the agreement, Riggs merged into The PNC Financial Services Group, Inc. and PNC Bank, National Association (PNC Bank, N.A.) acquired substantially all of the assets of Riggs Bank, National Association, the principal banking subsidiary of Riggs. The acquisition gives us a substantial presence on which to build a market leading franchise in the affluent Greater Washington, D.C. metropolitan area.
In connection with the acquisition, Riggs shareholders received an aggregate of approximately $297 million in cash and 6.6 million shares of PNC common stock. Our Consolidated Balance Sheet at June 30, 2005 includes $2.8 billion of loans, net of unearned income, and $3.5 billion of deposits, including $0.8 billion of brokered certificates of deposit, related to Riggs.
Our acquisition of Riggs resulted in $306 million of total cash paid and $184 million of cash and due from banks received.
SSRM HOLDINGS, INC.
As previously reported, effective January 31, 2005, our majority-owned subsidiary BlackRock closed the acquisition of SSRM Holdings, Inc. (SSRM), the holding company of State Street Research & Management Company and SSR Realty Advisors Inc., from MetLife, Inc. for an adjusted purchase price of approximately $233 million in cash and approximately 550,000 shares of BlackRock restricted class A common stock. SSRM, through its subsidiaries, actively manages stock, bond, balanced and real estate portfolios for both institutional and individual investors. Substantially all of SSRMs operations were integrated into BlackRock as of the closing date. BlackRock acquired assets under management totaling $50 billion in connection with this transaction.
The stock purchase agreement for the SSRM transaction provides for an additional payment to MetLife on the first anniversary of the closing of the SSRM transaction of up to $75 million based on BlackRock achieving specified retention levels of assets under management and run rate revenue as of the signing date of the stock purchase agreement. In addition, the stock purchase agreement provides for two other contingent payments. On December 21, 2006, MetLife will receive 32.5% of any performance fees earned on a large institutional real estate client. On the fifth anniversary of the closing of the SSRM transaction, MetLife could receive an additional payment up to a maximum of $10 million based on BlackRocks retained assets under management associated with the MetLife defined benefit and defined contribution plans.
The stock purchase agreement also provided for a hold-back of the initial purchase price payable to MetLife primarily associated with the value of customer accounts which, as of the closing date, had not committed to maintaining their accounts with BlackRock. The amount of the payment due to MetLife will be based on the status of these accounts as of July 31, 2005. BlackRock has estimated the amount of the true-up payment to be approximately $20 million.
BlackRocks acquisition of SSRM in January 2005 resulted in $248 million of net cash paid.
On January 18, 2005, our ownership in BlackRock was transferred from PNC Bank, N.A. to PNC Bancorp, Inc., our intermediate bank holding company. The transfer was effected primarily to give BlackRock more operating flexibility, particularly in connection with its acquisition of SSRM. As a result of the transfer, certain deferred tax liabilities recorded by PNC were reversed in the first quarter of 2005 in accordance with SFAS 109, Accounting for Income Taxes. The reversal of deferred tax liabilities increased our earnings by $45 million, or approximately $.16 per diluted share, in the first quarter of 2005.
In January 2005, BlackRock issued a bridge promissory note for $150 million, using the proceeds to facilitate the SSRM acquisition. In February 2005, BlackRock issued $250 million aggregate principal amount of convertible debentures. BlackRock used a portion of the net proceeds from this issuance to retire the bridge promissory note. These convertible debentures are included with bank notes and senior debt on our Consolidated Balance Sheet at June 30, 2005. Note 31 Subsequent Events in our 2004 Form 10-K includes further information on these convertible debentures.
Our trading activities include the underwriting of fixed income and equity securities, as well as customer-driven and proprietary trading in fixed income securities, equities, derivatives, and foreign exchange contracts.
Noninterest income from trading activities includes underwriting fees and changes in the fair value of trading securities and financial derivatives entered into to accommodate clients and for proprietary purposes. Specific components of noninterest income from trading activities are as follows:
| Six months ended June 30 in millions |
2005 |
2004 |
||||
| Securities underwriting and trading |
$ | 14 | $ | 19 | ||
| Financial derivatives |
30 | 20 | ||||
| Foreign exchange |
17 | 14 | ||||
| Total |
$ | 61 | $ | 53 | ||
45
| In millions |
Amortized Cost |
Unrealized |
Fair Value |
||||||||||
|
Gains |
Losses |
||||||||||||
| June 30, 2005 (a) | |||||||||||||
| SECURITIES AVAILABLE FOR SALE | |||||||||||||
| Debt securities |
|||||||||||||
| U.S. Treasury and government agencies |
$ | 4,363 | $ | 6 | $ | (16 | ) | $ | 4,353 | ||||
| Mortgage-backed |
12,921 | 11 | (81 | ) | 12,851 | ||||||||
| Commercial mortgage-backed |
1,325 | 9 | (4 | ) | 1,330 | ||||||||
| Asset-backed |
1,468 | (3 | ) | 1,465 | |||||||||
| State and municipal |
169 | 2 | (1 | ) | 170 | ||||||||
| Other debt |
99 | 99 | |||||||||||
| Total debt securities |
20,345 | 28 | (105 | ) | 20,268 | ||||||||
| Corporate stocks and other |
169 | 169 | |||||||||||
| Total securities available for sale |
$ | 20,514 | $ | 28 | $ | (105 | ) | $ | 20,437 | ||||
| December 31, 2004 | |||||||||||||
| SECURITIES AVAILABLE FOR SALE |
|||||||||||||
| Debt securities |
|||||||||||||
| U.S. Treasury and government agencies |
$ | 4,735 | $ | (13 | ) | $ | 4,722 | ||||||
| Mortgage-backed |
8,506 | $ | 9 | (82 | ) | 8,433 | |||||||
| Commercial mortgage-backed |
1,380 | 5 | (15 | ) | 1,370 | ||||||||
| Asset-backed |
1,910 | 5 | (14 | ) | 1,901 | ||||||||
| State and municipal |
175 | 2 | (1 | ) | 176 | ||||||||
| Other debt |
33 | 33 | |||||||||||
| Total debt securities |
16,739 | 21 | (125 | ) | 16,635 | ||||||||
| Corporate stocks and other |
123 | 2 | 125 | ||||||||||
| Total securities available for sale |
$ | 16,862 | $ | 23 | $ | (125 | ) | $ | 16,760 | ||||
| SECURITIES HELD TO MATURITY |
|||||||||||||
| Debt securities: Asset-backed |
$ | 1 | $ | 1 | |||||||||
| Total securities held to maturity |
$ | 1 | $ | 1 | |||||||||
| (a) | Securities held to maturity at June 30, 2005 totaled less than $1.0 million. |
Securities represented 23% of total assets at June 30, 2005 and 21% of total assets at December 31, 2004. The increase in total securities compared with December 31, 2004 was primarily due to the acquisition of Riggs and normal portfolio activity.
At June 30, 2005, the securities available for sale balance included a net unrealized loss of $77 million, which represented the difference between fair value and amortized cost. The comparable amount at December 31, 2004 was a net unrealized loss of $102 million. The decrease in the net unrealized loss at June 30, 2005 reflected the sales of securities during the second quarter of 2005 as discussed below and the change in portfolio mix, partially offset by the impact of increases in interest rates during the first six months of 2005.
We do not believe that any individual unrealized losses as of June 30, 2005 represent an other-than-temporary impairment. The $16 million unrealized losses reported for U.S. Treasury and government agencies were primarily related to obligations of the Federal National Mortgage Association (Fannie Mae) and the Federal Home Loan Mortgage Corporation (Freddie Mac). The $81 million unrealized losses reported for mortgage-backed securities relate primarily to securities issued by Fannie Mae, Freddie Mac and certain private issuers. The majority of the unrealized losses reported are attributable to changes in interest rates and not from the deterioration of the credit quality of the issuer.
We evaluate our portfolio of securities available for sale in light of changing market conditions and other factors and, where appropriate, take steps intended to improve our overall positioning.
During April 2005, the front-end of the yield curve rallied sharply. In our view, this market movement was not adequately reflective of a potential further rise in short-term interest rates given recent inflation trends and the expected Federal Open Market Committee tightening action on May 3, 2005.
As a result, in late April 2005, we performed a balance sheet review and decided to adjust our securities and other earning assets positions in order to address the following objectives:
| | Further reduce exposure to an anticipated rise in short-term interest rates, and |
| | Improve future net interest income levels without adding to duration risk. |
To achieve these objectives, in late April and early May 2005, we sold $2.1 billion of securities available for sale and terminated $1.0 billion of resale agreements that were most sensitive to extension risk due to rising short-term interest rates. We also purchased $2.1 billion of securities with higher yields and lower extension risk. These transactions resulted in realized net securities and other losses of approximately $31 million, which are included in our results of operations for the second quarter and first six months of 2005.
46
The fair value of securities available for sale decreases when interest rates increase and vice versa. Further increases in interest rates after June 30, 2005, if sustained, will adversely impact the fair value of securities available for sale going forward compared with the balance at June 30, 2005. Net unrealized gains and losses in the securities available for sale portfolio are included in shareholders equity as accumulated other comprehensive income or loss, net of tax.
The expected weighted-average life of securities available for sale was 3 years as of June 30, 2005 and 2 years and 8 months at December 31, 2004.
Information relating to securities sold is set forth in the following table:
Securities Sold
| Six months ended June 30 In millions |
Proceeds |
Gross Gains |
Gross Losses |
Net Gains |
Income Expense/ (Benefit) |
|||||||||||||
| 2005 |
$ | 9,993 | $ | 16 | $ | (51 | ) | $ | (35 | ) | $ | (12 | ) | |||||
| 2004 |
4,608 | 46 | (17 | ) | 29 | 10 | ||||||||||||
The carrying value of securities pledged to secure public and trust deposits and repurchase agreements and for other purposes was $9.8 billion at June 30, 2005 and $8.1 billion at December 31, 2004. The fair value of securities accepted as collateral that we are permitted by contract or custom to sell or repledge was $88 million at June 30, 2005 and $1.7 billion at December 31, 2004. The decrease was the result of the termination of a structured resale agreement. Of the permitted amount, all was repledged to others at June 30, 2005 and $.6 billion was repledged to others at December 31, 2004.
Nonperforming assets were as follows:
| In millions |
June 30 2005 |
December 31 2004 |
||||
| Nonperforming loans (a) |
$ | 132 | $ | 143 | ||
| Nonperforming loans held for sale (b) |
2 | 3 | ||||
| Foreclosed and other assets |
30 | 29 | ||||
| Total nonperforming assets (c) |
$ | 164 | $ | 175 | ||
| (a) | Includes a troubled debt restructured loan of $3 million as of December 31, 2004. |
| (b) | Includes troubled debt restructured loans held for sale of $2 million as of June 30, 2005 and December 31, 2004. |
| (c) | Excludes equity management assets carried at estimated fair value of $31 million as of June 30, 2005 and $32 million as of December 31, 2004. These assets included troubled debt restructured assets of $15 million at June 30, 2005 and $11 million as of December 31, 2004. |
Changes in the allowance for loan and lease losses were as follows:
| In millions |
2005 |
2004 |
||||||
| Allowance at January 1 |
$ | 607 | $ | 632 | ||||
| Charge-offs |
||||||||
| Commercial (a) |
(28 | ) | (85 | ) | ||||
| Commercial real estate |
(2 | ) | ||||||
| Consumer |
(21 | ) | (22 | ) | ||||
| Residential mortgage |
(1 | ) | (1 | ) | ||||
| Lease financing |
(3 | ) | ||||||
| Total charge-offs |
(50 | ) | (113 | ) | ||||
| Recoveries |
||||||||
| Commercial (b) |
68 | 13 | ||||||
| Commercial real estate |
1 | |||||||
| Consumer |
7 | 6 | ||||||
| Residential mortgage |
1 | |||||||
| Lease financing |
1 | 4 | ||||||
| Total recoveries (b) |
76 | 25 | ||||||
| Net recoveries (charge-offs) |
||||||||
| Commercial (b) |
40 | (72 | ) | |||||
| Commercial real estate |
(1 | ) | ||||||
| Consumer |
(14 | ) | (16 | ) | ||||
| Residential mortgage |
(1 | ) | ||||||
| Lease financing |
1 | 1 | ||||||
| Total net recoveries (charge-offs) (b) |
26 | (88 | ) | |||||
| Provision for (recoveries of) credit losses |
(19 | ) | 20 | |||||
| Acquired allowance (c) |
23 | 22 | ||||||
| Net change in allowance for unfunded loan commitments and letters of credit |
(9 | ) | 7 | |||||
| Allowance at June 30 |
$ | 628 | $ | 593 | ||||
| (a) | During the first quarter of 2004, we changed our policy for recognizing charge-offs on smaller nonperforming commercial loans. This change resulted in the recognition of an additional $24 million of gross charge-offs for the first quarter of 2004. |
| (b) | Amounts for 2005 reflect a $53 million loan recovery received during the second quarter. |
| (c) | The 2005 acquired allowance related to the Riggs acquisition and the 2004 acquired allowance related to the United National acquisition. |
Changes in the allowance for unfunded loan commitments and letters of credit were as follows:
| In millions |
2005 |
2004 |
|||||
| Allowance at January 1 |
$ | 75 | $ | 91 | |||
| Net change in allowance for unfunded loan commitments and letters of credit |
9 | (7 | ) | ||||
| Allowance at June 30 |
$ | 84 | $ | 84 | |||
47
NOTE 6 GOODWILL AND OTHER INTANGIBLE
ASSETS
A summary of the changes in goodwill by business for the six months ended June 30, 2005 follows:
Goodwill
| In millions |
December 31 2004 |
Additions/ Adjustments |
June 30 2005 |
|||||||
| Regional Community Banking |
$ | 991 | $ | 297 | $ | 1,288 | ||||
| Wholesale Banking |
679 | 110 | 789 | |||||||
| PNC Advisors |
153 | 17 | 170 | |||||||
| BlackRock |
177 | 12 | 189 | |||||||
| PFPC |
945 | 945 | ||||||||
| Other |
56 | (19 | ) | 37 | ||||||
| Total |
$ | 3,001 | $ | 417 | $ | 3,418 | ||||
We added $424 million of goodwill and $74 million of customer-related intangible assets in connection with our May 2005 acquisition of Riggs. The goodwill arising from the Riggs transaction is reflected in the Regional Community Banking, Wholesale Banking and PNC Advisors business segments as shown in the table above. Substantially all of the other intangible assets recorded in connection with the Riggs acquisition are included in the Regional Community Banking segment.
BlackRock recorded $12 million of goodwill and $304 million of customer-related intangible assets described below in connection with its January 2005 acquisition of SSRM. Note 2 Acquisitions contains further information on the Riggs and SSRM transactions.
Our ownership of BlackRock continues to change primarily when BlackRock repurchases its shares in the open market and issues shares for an acquisition or pursuant to its employee compensation plans. We recognize goodwill because BlackRock repurchases its shares at an amount greater than book value and this results in an increase in our percentage ownership interest. We reduced goodwill by $19 million in the first half of 2005 as a result of BlackRocks stock activity, including the issuance of shares in the SSRM transaction.
The gross carrying amount, accumulated amortization and net carrying amount of other intangible assets by major category consisted of the following:
Other Intangible Assets
| In millions |
June 30 2005 |
December 31 2004 |
||||||
| Customer-related and other intangibles |
||||||||
| Gross carrying amount |
$ | 593 | $ | 214 | ||||
| Accumulated amortization |
(118 | ) | (102 | ) | ||||
| Net carrying amount |
$ | 475 | $ | 112 | ||||
| Mortgage and other loan servicing rights |
||||||||
| Gross carrying amount |
$ | 450 | $ | 408 | ||||
| Accumulated amortization |
(173 | ) | (166 | ) | ||||
| Net carrying amount |
$ | 277 | $ | 242 | ||||
| Total |
$ | 752 | $ | 354 | ||||
Most of our other intangible assets have finite lives and are amortized primarily on a straight-line basis or, in the case of mortgage and other loan servicing rights, on an accelerated basis. At December 31, 2004, we had two indefinite-lived other intangible assets included in Customer-related and other intangibles in the table above with a total carrying value of $4 million. In connection with the SSRM acquisition, BlackRock recorded $304 million of management contracts during the first half of 2005, of which approximately $240 million are considered to have indefinite lives.
For customer-related intangibles, the estimated remaining useful lives range from approximately one year to 20 years, with a weighted-average remaining useful life of approximately eight years. Our mortgage and other loan servicing rights are amortized primarily over a period of seven to ten years in proportion to the estimated net servicing income from the related loans.
The changes in the carrying amount of goodwill and net other intangible assets for the six months ended June 30, 2005, are as follows:
Changes in Goodwill and Other Intangibles
| In millions |
Goodwill |
Customer- Related |
Servicing Rights |
|||||||||
| Balance at December 31, 2004 |
$ | 3,001 | $ | 112 | $ | 242 | ||||||
| Additions/adjustments: |
||||||||||||
| Riggs acquisition |
424 | 74 | ||||||||||
| BlackRock acquisition of SSRM |
12 | 304 | ||||||||||
| BlackRock acquisition of Cigna management contracts |
1 | |||||||||||
| Other - BlackRock share repurchases |
(19 | ) | ||||||||||
| Wholesale Banking |
50 | |||||||||||
| Amortization |
(16 | ) | (15 | ) | ||||||||
| Balance at June 30, 2005 |
$ | 3,418 | $ | 475 | $ | 277 | ||||||
Amortization expense on intangible assets for the first half of 2005 was $31 million. Amortization expense on existing intangible assets for the remainder of 2005 and for 2006 through 2010 is estimated to be as follows:
| | Remainder of 2005: $40 million |
| | 2006: $71 million, |
| | 2007: $66 million, |
| | 2008: $61 million, |
| | 2009: $55 million, and |
| | 2010: $37 million. |
48
NOTE 7 VARIABLE INTEREST ENTITIES
As discussed in our 2004 Form 10-K, we are involved with various entities in the normal course of business that may be deemed to be variable interest entities (VIEs). We consolidate certain VIEs for which we are the primary beneficiary. These consolidated VIEs and relationships with PNC are described in our 2004 Form 10-K.
At June 30, 2005, the aggregate assets and debt of VIEs that we have consolidated in our financial statements are as follows:
Consolidated VIEs PNC Is Primary Beneficiary
| In millions |
Aggregate Assets |
Aggregate Debt |
||||
| June 30, 2005 | ||||||
| Market Street Funding Corporation |
$ | 2,550 | $ | 2,550 | ||
| Partnership interests in low income housing projects |
483 | 483 | ||||
| Other |
13 | 11 | ||||
| Total consolidated VIEs |
$ | 3,046 | $ | 3,044 | ||
| December 31, 2004 |
||||||
| Market Street Funding Corporation |
$ | 2,167 | $ | 2,167 | ||
| Partnership interests in low income housing projects |
504 | 504 | ||||
| Other |
13 | 10 | ||||
| Total consolidated VIEs |
$ | 2,684 | $ | 2,681 | ||
We also hold significant variable interests in other VIEs that have not been consolidated because we are not considered the primary beneficiary. Information on these VIEs follows:
Non-Consolidated VIEs - Significant Variable Interests
| In millions |
Aggregate Assets |
Aggregate Debt |
PNC Risk of Loss(b) |
||||||
| June 30, 2005 | |||||||||
| Collateralized debt obligations (a) |
$ | 5,691 | $ | 5,211 | $ | 53 | |||
| Private investment funds (a) |
4,530 | 1,351 | 13 | ||||||
| Other partnership interests in low income housing projects |
37 | 28 | 4 | ||||||
| Total significant variable interests |
$ | 10,258 | $ | 6,590 | $ | 70 | |||
| December 31, 2004 |
|||||||||
| Collateralized debt obligations (a) |
$ | 3,152 | $ | 2,700 | $ | 33 | |||
| Private investment funds (a) |
1,872 | 125 | 24 | ||||||
| Other partnership interests in low income housing projects |
37 | 28 | 4 | ||||||
| Total significant variable interests |
$ | 5,061 | $ | 2,853 | $ | 61 | |||
| (a) | Held by BlackRock. |
| (b) | Includes both PNCs risk of loss and BlackRocks risk of loss, limited to PNCs ownership interest in BlackRock. |
We also have subsidiaries that invest in and act as the investment manager for a private equity fund that is organized as a limited partnership as part of our equity management activities. The fund invests in private equity investments to generate capital appreciation and profits. As permitted by FASB Interpretation No. 46 (Revised 2003), Consolidation of Variable Interest Entities (FIN 46R), we have deferred applying the provisions of the interpretation for this entity pending further action by the FASB. Information on this entity follows:
Investment Company Accounting Deferred Application
| In millions |
Aggregate Assets |
Aggregate Equity |
PNC Risk of Loss |
||||||
| Private Equity Fund |
|||||||||
| June 30, 2005 | $ | 94 | $ | 94 | $ | 24 | |||
| December 31, 2004 |
$ | 78 | $ | 76 | $ | 20 | |||
NOTE 8 CAPITAL SECURITIES OF SUBSIDIARY TRUSTS
Capital securities represent non-voting preferred beneficial interests in the assets of PNC Institutional Capital Trusts A and B, PNC Capital Trusts C and D, the United National Bank Capital Trust I and Capital Statutory Trust II, and the Riggs Capital Trust and Capital Trust II (the Trusts).
The Riggs Trusts were acquired in May 2005 as part of the Riggs acquisition.
| | Riggs Capital Trust was formed in December 1996 when $150 million of 8 5/8% capital securities were issued. These securities are due December 31, 2026, and are redeemable after December 31, 2006 at a premium that declines from 104.313% to par on or after December 31, 2016. Riggs had acquired more than 50% of the capital securities and, therefore, under FIN 46R PNC is deemed to be the primary beneficiary of the Trust. Accordingly, this Trust is included in PNCs consolidated financial statements. The net outstanding capital securities are included as borrowed funds, and the related dividends are included in interest expense. |
| | Riggs Capital Trust II was formed in March 1997 when $200 million of 8 7/8% capital securities were issued. These securities are due March 15, 2027, and are redeemable after March 15, 2007 at a premium that declines from 104.438% to par on or after March 15, 2017. Riggs had acquired less than 50% of the capital securities and, therefore, under FIN 46R PNC is not deemed to be the primary beneficiary. Accordingly, this Trust is not consolidated into PNCs financial results. Junior subordinated debt of $206.2 million owed by PNC to this Trust is included in PNCs balance sheet, with the related service cost included in interest expense. The acquired capital securities are included as securities available for sale, with the related dividends included in interest income. |
49
The United Trusts were acquired effective January 2004 as part of the United National Bancorp acquisition. Trust A is a wholly owned finance subsidiary of PNC Bank, N.A., PNCs principal bank subsidiary. All other Trusts are wholly owned finance subsidiaries of PNC.
The obligations of the respective parent of each Trust, when taken collectively, are the equivalent of a full and unconditional guarantee of the obligations of such Trust under the terms of the Capital Securities. Such guarantee is subordinate in right of payment in the same manner as other junior subordinated debt. In the event of certain changes or amendments to regulatory requirements or federal tax rules, the capital securities are redeemable in whole. There are certain restrictions on PNCs overall ability to obtain funds from its subsidiaries. For additional disclosure on these funding restrictions, including an explanation of dividend and inter-company loan limitations, see Note 4 Regulatory Matters in our 2004 Form 10-K.
We have more information on the Trusts in Note 18 Capital Securities Of Subsidiary Trusts in our 2004 Form 10-K.
NOTE 9 CERTAIN EMPLOYEE BENEFIT AND STOCK-BASED COMPENSATION PLANS
Pension and Post-Retirement Plans
As more fully described in our 2004 Form 10-K, we have a noncontributory, qualified defined benefit pension plan covering eligible employees. Retirement benefits are derived from a cash balance formula based on compensation levels, age and length of service. Pension contributions are based on an actuarially determined amount necessary to fund total benefits payable to plan participants.
We also maintain nonqualified supplemental retirement plans for certain employees. All retirement benefits provided under these plans are unfunded and we make any payments to plan participants. We also provide certain health care and life insurance benefits for qualifying retired employees (post-retirement benefits) through various plans.
The components of our net periodic pension and post-retirement benefit cost for the second quarter and first six months of 2005 and 2004 were as follows:
|
Qualified Pension Plan |
Nonqualified Pension Plan |
Post-retirement Benefits |
||||||||||||||||||||
| Three months ended June 30 In millions |
2005 |
2004 |
2005 |
2004 |
2005 |
2004 |
||||||||||||||||
| Service cost |
$ | 7 | $ | 10 | $ | 1 | $ | 1 | $ | 1 | ||||||||||||
| Interest cost |
14 | 16 | 1 | 1 | $ | 3 | 4 | |||||||||||||||
| Expected return on plan assets |
(30 | ) | (29 | ) | ||||||||||||||||||
| Amortization of prior service cost |
(1 | ) | (1 | ) | ||||||||||||||||||
| Recognized net actuarial loss |
6 | 6 | 1 | |||||||||||||||||||
| Net periodic cost |
$ | (3 | ) | $ | 3 | $ | 2 | $ | 2 | $ | 3 | $ | 4 | |||||||||
|
Qualified Pension Plan |
Nonqualified Pension Plan |
Post-retirement Benefits |
||||||||||||||||||||
| Six months ended June 30 In millions |
2005 |
2004 |
2005 |
2004 |
2005 |
2004 |
||||||||||||||||
| Service cost |
$ | 16 | $ | 20 | $ | 1 | $ | 1 | $ | 1 | $ | 2 | ||||||||||
| Interest cost |
30 | 33 | 2 | 2 | 7 | 8 | ||||||||||||||||
| Expected return on plan assets |
(61 | ) | (59 | ) | ||||||||||||||||||
| Amortization of prior service cost |
(3 | ) | (3 | ) | ||||||||||||||||||
| Recognized net actuarial loss |
12 | 12 | 1 | 1 | 2 | 2 | ||||||||||||||||
| Net periodic cost |
$ | (3 | ) | $ | 6 | $ | 4 | $ | 4 | $ | 7 | $ | 9 | |||||||||
2002 BlackRock Long-Term Retention and Incentive Plan
BlackRocks long-term retention and incentive plan (LTIP) permits the grant of up to $240 million in deferred compensation awards (the LTIP Awards), subject to the achievement of certain performance hurdles by BlackRock no later than March 2007. If the performance hurdles are achieved, up to $200 million of the LTIP Awards will be funded with up to 4 million shares of BlackRock Class A common stock to be surrendered by PNC and distributed to LTIP participants, less income tax withholding. Shares attributable to value in excess of our $200 million LTIP funding requirement will be available to support BlackRocks future long-term retention and incentive programs but are not subject to surrender until the programs are approved by BlackRocks Compensation Committee of its Board of Directors. In addition, shares distributed to LTIP participants will include an option to put such distributed shares back to BlackRock at fair market value. BlackRock will fund the remainder of the LTIP Awards with up to $40 million in cash. BlackRock has granted approximately $232 million in LTIP Awards, net of forfeitures.
The LTIP Awards fully vest at the end of any three-month period beginning on or after January 1, 2005 and ending on or prior to March 30, 2007 during which the average closing price of BlackRocks common stock is at least $62 per share. During the first quarter of 2005, BlackRocks average closing stock price exceeded the $62 threshold. In addition to the stock price threshold, the vesting of awards is contingent on the participants continued employment with BlackRock for periods ranging from two to five years through the payment date in early 2007.
We reported pretax charges in the second half of 2004 totaling $110 million in connection with the LTIP, based upon managements determination that full vesting of the LTIP Awards was probable as of September 30, 2004. Note 22 Stock-Based Compensation Plans included in our 2004 Form 10-K provides additional information on these charges.
We reported pretax expense of $32 million in the first six months of 2005, including $17 million during the second quarter, related to the LTIP Awards. We expect to report additional pretax charges of approximately $16 million per quarter through December 2006 related to the remaining service period of the LTIP Awards granted.
50
We use a variety of derivative financial instruments to help manage interest rate risk and reduce the effects that changes in interest rates may have on net income, the fair value of assets and liabilities, and cash flows caused by interest rate volatility. These instruments include interest rate swaps, interest rate caps and floors, future contracts, and total return swaps.
Fair Value Hedging Strategies
We enter into interest rate and total return swaps, interest rate caps and floors, and interest rate futures derivative contracts to hedge designated commercial mortgage loans held for sale, commercial loans, bank notes, senior debt and subordinated debt for changes in fair value primarily due to changes in interest rates. Adjustments related to the ineffective portion of fair value hedging instruments are recorded in interest income, interest expense or noninterest income depending on the hedged item.
Cash Flow Hedging Strategy
We enter into interest rate swap contracts to modify the interest rate characteristics of designated commercial loans from variable to fixed in order to reduce the impact of interest rate changes on future interest income. We are hedging our exposure to the variability of future cash flows for all forecasted transactions for a maximum of 10 years for hedges converting floating-rate commercial loans to fixed. The fair value of these derivatives is reported in other assets or other liabilities and offset in accumulated other comprehensive income for the effective portion of the derivatives. When the hedged transaction culminates, any unrealized gains or losses related to these swap contracts are reclassified from accumulated other comprehensive income and into earnings in the same period or periods during which the hedged forecasted transaction affects earnings and are included in interest income. Ineffectiveness of the strategy, as defined by risk management policies and procedures, if any, is reported in interest income.
During the next twelve months, we expect to reclassify to earnings $3.8 million of pretax net gains, or $2.5 million after-tax, on cash flow hedge derivatives currently reported in accumulated other comprehensive income. This amount could differ from amounts actually recognized due to changes in interest rates and the addition of other hedges subsequent to June 30, 2005. These net gains are anticipated to result from net cash flows on receive fixed interest rate swaps that would impact interest income recognized on the related floating rate commercial loans.
As of June 30, 2005 we have determined that there were no hedging positions where it was probable that certain forecasted transactions may not occur within the originally designated time period.
If a derivative is not effective in accomplishing the hedge objective of offsetting either changes in the fair value or cash flows of the hedged item for the risk being hedged, then any ineffectiveness present in the hedge relationship is recognized in current earnings. The ineffective portion of the change in value of these derivatives resulted in a $2 million net loss for the six months ended June 30, 2005 compared with net loss of $3 million in the same period of 2004.
Free-Standing Derivatives
To accommodate customer needs, we also enter into financial derivative transactions primarily consisting of interest rate swaps, interest rate caps and floors, and foreign exchange and equity contracts. We manage our market risk exposure from customer positions through transactions with third-party dealers. The credit risk associated with derivatives executed with customers is essentially the same as that involved in extending loans and is subject to normal credit policies. We may obtain collateral based on our assessment of the customer. For derivatives not designated as an accounting hedge, the gain or loss is recognized in other noninterest income.
Basis swaps are agreements involving the exchange of payments, based on notional amounts, of two floating rate financial instruments denominated in the same currency, one pegged to one reference rate and the other tied to a second reference rate (e.g., swapping payments tied to one-month LIBOR for payments tied to three-month LIBOR). We use these contracts to mitigate the impact on earnings of exposure to a certain referenced interest rate.
We purchase credit default swaps to mitigate the economic impact of credit losses on specifically identified existing lending relationships. These derivatives typically are based on the change in value, due to changing credit spreads, of publicly-issued bonds issued by our customer.
Interest rate lock commitments for, as well as commitments to buy or sell, mortgage loans that we intend to sell are considered free-standing derivatives. Our interest rate exposure on certain commercial mortgage interest rate lock commitments is economically hedged with pay-fixed interest rate swaps and forward sales agreements. These contracts mitigate the impact on earnings of exposure to a certain referenced rate.
Free-standing derivatives also include positions we take based on market expectations or to benefit from price differentials between financial instruments and the market based on stated risk management objectives.
Derivative Counterparty Credit Risk
By purchasing and writing derivative contracts we are exposed to credit risk if the counterparties fail to perform. Our credit risk is equal to the fair value gain in the derivative contract. We minimize credit risk through credit approvals, limits, monitoring procedures and collateral requirements. We generally enter into transactions with counterparties that carry high quality credit ratings.
We enter into risk participation agreements to share some of the credit exposure with other counterparties related to interest rate derivative contracts or to take on credit exposure to generate revenue. Risk participation
51
agreements entered into prior to July 1, 2003 were considered financial guarantees and therefore not included in derivatives. Agreements entered into subsequent to June 30, 2003 are included in the derivative table that follows. We determine that we meet our objective of reducing credit risk associated with certain counterparties to derivative contracts when the participation agreements share in their proportional credit losses of those counterparties.
We generally have established agreements with our major derivative dealer counterparties that provide for exchanges of marketable securities or cash to collateralize either partys positions. At June 30, 2005 we held cash and U.S. government and mortgage-backed securities with a fair value of $180 million and pledged U.S. agency and mortgage-backed securities with a fair value of $227 million under these agreements.
The total notional or contractual amounts, estimated net fair value and credit risk for derivatives at June 30, 2005 and December 31, 2004 were as follows:
|
June 30, 2005 |
December 31, 2004 |
|||||||||||||||||||
| In millions |
Notional amount |
Estimated net fair value |
Credit risk |
Notional amount |
Estimated net fair value |
Credit risk |
||||||||||||||
| ACCOUNTING HEDGES |
||||||||||||||||||||
| Fair value hedges |
$ | 5,575 | $ | 222 | $ | 238 | $ | 4,155 | $ | 210 | $ | 217 | ||||||||
| Cash flow hedges |
1,289 | 11 | 11 | 360 | (1 | ) | ||||||||||||||
| Total |
$ | 6,864 | $ | 233 | $ | 249 | $ | 4,515 | $ | 209 | $ | 217 | ||||||||
| FREE-STANDING DERIVATIVES |
||||||||||||||||||||
| Interest rate contracts |
$ | 78,862 | $ | (17 | ) | $ | 423 | $ | 52,447 | $ | 8 | $ | 385 | |||||||
| Equity contracts |
2,080 | (58 | ) | 177 | 2,186 | (29 | ) | 123 | ||||||||||||
| Foreign exchange contracts |
10,082 | (1 | ) | 64 | 7,245 | 10 | 79 | |||||||||||||
| Credit contracts |
1,353 | (5 | ) | 2 | 359 | (4 | ) | |||||||||||||
| Options |
43,328 | 37 | 196 | 38,873 | (1 | ) | 103 | |||||||||||||
| Risk participation agreements |
339 | 230 | ||||||||||||||||||
| Commitments related to mortgage-related assets |
3,330 | 23 | 25 | 782 | 1 | 3 | ||||||||||||||
| Other |
379 | 3 | 14 | 375 | 1 | 6 | ||||||||||||||
| Total |
$ | 139,753 | $ | (18 | ) | $ | 901 | $ | 102,497 | $ | (14 | ) | $ | 699 | ||||||
| NOTE | 11 EARNINGS PER SHARE |
Basic and diluted earnings per common share calculations follow:
|
Three months ended June 30 |
Six months ended June 30 |
|||||||||||
| In millions, except share and per share data |
2005 |
2004 |
2005 |
2004 |
||||||||
| CALCULATION OF BASIC EARNINGS PER COMMON SHARE | ||||||||||||
| Net income |
$ | 282 | $ | 304 | $ | 636 | $ | 632 | ||||
| Less: Preferred dividends declared |
1 | 1 | ||||||||||
| Net income applicable to basic earnings per common share |
$ | 282 | $ | 303 | $ | 636 | $ | 631 | ||||
| Basic weighted-average common shares outstanding (in thousands) |
284,900 | 280,823 | 283,106 | 281,530 | ||||||||
| Basic earnings per common share |
$ | .99 | $ | 1.08 | $ | 2.25 | $ | 2.24 | ||||
| CALCULATION OF DILUTED EARNINGS PER COMMON SHARE (a) | ||||||||||||
| Net income |
$ | 282 | $ | 304 | $ | 636 | $ | 632 | ||||
| Less: BlackRock adjustment for common stock equivalents |
1 | 2 | 2 | 3 | ||||||||
| Net income applicable to diluted earnings per common share |
$ | 281 | $ | 302 | $ | 634 | $ | 629 | ||||
| Basic weighted-average common shares outstanding (in thousands) |
284,900 | 280,823 | 283,106 | 281,530 | ||||||||
| Conversion of preferred stock Series A and B |
78 | 86 | 80 | 87 | ||||||||
| Conversion of preferred stock Series C and D |
623 | 666 | 627 | 680 | ||||||||
| Conversion of debentures |
2 | 12 | 2 | 13 | ||||||||
| Exercise of stock options |
897 | 832 | 909 | 929 | ||||||||
| Incentive share awards |
1,335 | 447 | 1,296 | 445 | ||||||||
| Diluted weighted-average common shares outstanding (in thousands) |
287,835 | 282,866 | 286,020 | 283,684 | ||||||||
| Diluted earnings per common share |
$ | .98 | $ | 1.07 | $ | 2.22 | $ | 2.22 | ||||
| (a) Excludes stock options considered to be anti-dilutive (in thousands) |
13,160 | 11,222 | 13,192 | 10,027 | ||||||||
52
NOTE 12 SHAREHOLDERS EQUITY AND COMPREHENSIVE INCOME
Activity in shareholders equity for the first six months of 2005 follows. Our preferred stock outstanding as of June 30, 2005 and December 31, 2004 totaled less than $.5 million at each date and, therefore, is excluded from the table.
| In millions, except per share data |
Shares Common |
Common Stock |
Capital Surplus |
Retained Earnings |
Deferred Compen- sation Expense |
Accumulated Other Comprehensive Income (Loss) |
Treasury Stock |
Total |
|||||||||||||||||||||
| Balance at December 31, 2004 |
283 | $ | 1,764 | $ | 1,265 | $ | 8,273 | $ | (51 | ) | $ | (54 | ) | $ | (3,724 | ) | $ | 7,473 | |||||||||||
| Net income |
636 | 636 | |||||||||||||||||||||||||||
| Other comprehensive income (loss), net of tax |
|||||||||||||||||||||||||||||
| Net unrealized securities gains |
16 | 16 | |||||||||||||||||||||||||||
| Other (a) |
(3 | ) | (3 | ) | |||||||||||||||||||||||||
| Comprehensive income |
649 | ||||||||||||||||||||||||||||
| Cash dividends declared |
|||||||||||||||||||||||||||||
| Common ($1.00 per share) |
(283 | ) | (283 | ) | |||||||||||||||||||||||||
| Preferred |
|||||||||||||||||||||||||||||
| Treasury stock activity |
8 | 78 | 335 | 413 | |||||||||||||||||||||||||
| Tax benefit of stock option plans |
3 | 3 | |||||||||||||||||||||||||||
| Stock options granted |
14 | 14 | |||||||||||||||||||||||||||
| Subsidiary stock transactions |
(7 | ) | (7 | ) | |||||||||||||||||||||||||
| Deferred compensation expense |
(19 | ) | (19 | ) | |||||||||||||||||||||||||
| Balance at June 30, 2005 |
291 | $ | 1,764 | $ | 1,353 | $ | 8,626 | $ | (70 | ) | $ | (41 | ) | $ | (3,389 | ) | $ | 8,243 | |||||||||||
A summary of the components of the change in accumulated other comprehensive income (loss) follows:
| Six months ended June 30, 2005 In millions |
Pretax Amount |
Tax Benefit (Expense) |
After-tax Amount |
|||||||||
| Change in net unrealized securities losses |
||||||||||||
| Increase in net unrealized losses on securities held at period end |
$ | (9 | ) | $ | 3 | $ | (6 | ) | ||||
| Less: Net losses realized in net income (b) |
(34 | ) | 12 | (22 | ) | |||||||
| Change in net unrealized securities losses |
25 | (9 | ) | 16 | ||||||||
| Other (a) |
(5 | ) | 2 | (3 | ) | |||||||
| Other comprehensive income |
$ | 20 | $ | (7 | ) | $ | 13 | |||||
The accumulated balances related to each component of other comprehensive income (loss) are as follows:
|
June 30, 2005 |
December 31, 2004 |
|||||||||||||||
| In millions |
Pretax |
After-tax |
Pretax |
After-tax |
||||||||||||
| Net unrealized securities losses |
$ | (77 | ) | $ | (50 | ) | $ | (102 | ) | $ | (66 | ) | ||||
| Net unrealized gains on cash flow hedge derivatives |
9 | 6 | 9 | 6 | ||||||||||||
| Other (a) |
4 | 3 | 9 | 6 | ||||||||||||
| Accumulated other comprehensive loss |
$ | (64 | ) | $ | (41 | ) | $ | (84 | ) | $ | (54 | ) | ||||
| (a) | Consists of interest-only strip valuation adjustments, foreign currency translation adjustments and minimum pension liability adjustments. |
| (b) | The pretax amount represents net unrealized losses at December 31, 2004 that were realized in 2005 when the related securities were sold. This amount differs from net securities losses included in the Consolidated Income Statement primarily because it does not include gains or losses realized on securities that were purchased and then sold during 2005. |
53
There are several pending judicial or administrative proceedings or other matters arising out of the three 2001 transactions (the PAGIC transactions) that gave rise to a financial statement restatement that we announced in January 2002. In December 2004, we entered into settlement agreements relating to certain of the lawsuits and other claims arising out of the PAGIC transactions. These pending proceedings and settlement agreements are described in our 2004 Annual Report on Form 10-K under Item 3 and updated in our first quarter 2005 Form 10-Q under Part II, Item 1. We are making progress towards completing those aspects of the settlement agreements that remain subject to conditions. In particular, the United States District Court for the Western District of Pennsylvania held a hearing on August 4, 2005 in the consolidated class action lawsuit brought on behalf of certain purchasers of our common stock to determine whether to approve the proposed settlement agreement.
Some of our subsidiaries are defendants (or have potential contractual contribution obligations to other defendants) in several pending lawsuits brought during late 2002 and 2003 arising out of the bankruptcy of Adelphia Communications Corporation. There also are threatened additional proceedings arising out of the same matters. One of the lawsuits is pending in the United States Bankruptcy Court for the Southern District of New York and has been brought on Adelphias behalf as an adversary proceeding by the unsecured creditors committee in Adelphias bankruptcy proceeding. A motion to intervene on behalf of the equity committee is also pending in this case. The other lawsuits (one of which is a putative consolidated class action) have been brought by holders of debt and equity securities of Adelphia and have been consolidated for pretrial purposes in the United States District Court for the Southern District of New York. These lawsuits arise out of lending and securities underwriting activities engaged in by these PNC subsidiaries together with other financial services companies. In the aggregate, more than 400 other financial services companies and numerous other companies and individuals have been named as defendants in one or more of the lawsuits. Collectively, with respect to some or all of the defendants, the lawsuits allege violations of federal securities laws, violations of common law duties, aiding and abetting such violations, voidable preference payments, and fraudulent transfers, among other matters. The lawsuits seek unquantified monetary damages, interest, attorneys fees and other expenses, and a return of the alleged voidable preference and fraudulent transfer payments, among other remedies. We believe that we have substantial defenses to the claims against us in these lawsuits and intend to defend them vigorously. These lawsuits are currently in initial stages and present complex issues of law and fact. As a result, we are not currently capable of evaluating our exposure, if any, resulting from these lawsuits.
On April 29, 2005, an amended complaint was filed in the putative class action against PNC; PNC Bank, N.A.; our Pension Plan and its Pension Committee in the United States District Court for the Eastern District of Pennsylvania (originally filed in December 2004). The complaint claims violations of the Employee Retirement Income Security Act of 1974, as amended (ERISA), arising out of the January 1, 1999 conversion of our Pension Plan from a traditional defined benefit formula into a cash balance formula, the design and continued operation of the Plan, and other related matters. Plaintiffs seek to represent a class of all current and former employee-participants in and beneficiaries of the Plan as of December 31, 1998 and thereafter. Plaintiffs also seek to represent a subclass of all current and former employee-participants in and beneficiaries of the Plan as of December 31, 1998 and thereafter who were or would have become eligible for an early retirement subsidy under the former Plan at some time prior to the date of the amended complaint. The plaintiffs are seeking damages and equitable relief available under ERISA, including interest, costs, and attorneys fees. We filed a motion to dismiss the amended complaint on May 23, 2005, which is currently pending. We believe that we have substantial defenses to the claims against us in this lawsuit and intend to defend it vigorously.
In its Form 10-Q for the quarter ended March 31, 2005, Riggs disclosed a number of pending lawsuits. All material lawsuits have been finally resolved or are subject to pending settlement agreements in principle. The pending settlements are subject, in some cases, to final documentation and otherwise to court approval and other standard conditions. None of the pending settlement amounts is material to PNC. The pending settlement amount for each of these lawsuits has been reserved upon the recording of our acquisition of Riggs.
As a result of the acquisition of Riggs, PNC is now responsible for Riggs obligations to provide indemnification to its directors, officers, and, in some cases, employees and agents against certain liabilities incurred as a result of their service on behalf of or at the request of Riggs. PNC is also now responsible for Riggs obligations to advance on behalf of covered individuals costs incurred in connection with certain claims or proceedings, subject to written undertakings to repay all amounts so advanced if it is ultimately determined that the individual is not entitled to indemnification. Since the acquisition, we have advanced such costs on behalf of covered individuals from Riggs and expect to continue to do so in the future at least with respect to the lawsuits and other legal matters identified in Riggs first quarter 2005 Form 10-Q.
In addition to the proceedings or other matters referred to above, PNC and persons to whom we may have indemnification obligations, in the normal course of business, are subject to various other pending and threatened legal proceedings in which claims for monetary damages and other relief are asserted. Management does not anticipate, at the present time, that the ultimate aggregate liability, if any, arising out of such other legal proceedings will have a material adverse effect on our financial position. However, we cannot now determine whether or not any claims asserted against us, whether in the proceedings or other matters specifically described above or otherwise, will have a material adverse effect on our results of operations in any future reporting period.
54
We operate five major businesses engaged in providing banking, asset management and global fund processing products and services. Banking businesses include regional community banking (consumer/small business), wholesale banking (corporate/institutional) and wealth management.
Assets, revenue and earnings attributable to foreign activities were not material in the periods presented.
Results of individual businesses are presented based on our management accounting practices and our operating structure. There is no comprehensive, authoritative body of guidance for management accounting equivalent to GAAP; therefore, the financial results of individual businesses are not necessarily comparable with similar information for any other company. We refine our methodologies from time to time as our management accounting practices are enhanced and our businesses change. Financial results are presented, to the extent practicable, as if each business operated on a stand-alone basis.
Assets receive a funding charge and liabilities and capital receive a funding credit based on a transfer pricing methodology that incorporates product maturities, duration and other factors. Capital is intended to cover unexpected losses and is assigned to the banking businesses using our risk-based economic capital model. We increased the capital assigned to Regional Community Banking to 6% of funds to reflect the capital required for well-capitalized banks and to approximate market comparables for this business. The capital for BlackRock and PFPC reflects legal entity shareholders equity. BlackRocks capital is consistent with its separate public company financial statement disclosures.
We have allocated the allowances for loan and lease losses and unfunded loan commitments and letters of credit based on our assessment of risk inherent in the loan portfolios. The costs incurred by operations and other support areas not directly aligned with the businesses are allocated primarily based on the use of services.
Total business segment financial results differ from total consolidated results. The impact of these differences is reflected in the Intercompany Eliminations and Other categories. Intercompany Eliminations reflects activities conducted among our businesses that are eliminated in the consolidated results. Other includes residual activities that do not meet the criteria for disclosure as a separate reportable business, such as asset and liability management activities, related net securities gains or losses, equity management activities and minority interest in income of BlackRock, differences between business segment performance reporting and financial statement reporting (GAAP), and corporate overhead.
BUSINESS SEGMENT PRODUCTS AND SERVICES
Regional Community Banking provides deposit, lending, and cash management services, and investment services through PNC Investments, LLC, to approximately 2.3 million consumer and small business customers within our primary geographic footprint. See Note 2 Acquisitions for further information regarding the 2005 Riggs acquisition.
Wholesale Banking provides lending, treasury management, and capital markets-related products and services and commercial loan servicing to mid-sized corporations, government entities and selectively to large corporations. Lending products include secured and unsecured loans, letters of credit and equipment leases. Treasury management services include cash and investment management, receivables management, disbursement services, funds transfer services, information reporting, and global trade services. Capital markets-related products include foreign exchange, derivatives, loan syndications and securities underwriting and distribution. Wholesale Banking provides products and services generally within our primary geographic markets and provides certain products and services nationally.
PNC Advisors provides a broad range of tailored investment management, trust and private banking products and services to affluent individuals and families, including services to the ultra-affluent through its Hawthorn unit and full-service brokerage through J.J.B. Hilliard, W.L. Lyons, Inc. PNC Advisors also serves as investment manager and trustee for employee benefit plans and charitable and endowment assets and provides nondiscretionary defined contribution plan services and investment options through its Vested Interest® product. PNC Advisors provides services to individuals and corporations primarily within our primary geographic markets.
BlackRock is one of the largest publicly traded investment management firms in the United States with approximately $414 billion of assets under management at June 30, 2005. BlackRock manages assets on behalf of institutional and individual investors worldwide through a variety of equity, fixed income, cash management and alternative investment products. Mutual funds include the flagship fund families, BlackRock Funds and BlackRock Liquidity Funds (formerly BlackRock Provident Institutional Funds). In addition, BlackRock provides risk management, investment system outsourcing and financial advisory services to a growing number of institutional investors. See Note 2 Acquisitions for further information regarding BlackRocks 2005 SSRM acquisition.
PFPC is among the largest providers of mutual fund transfer agency and accounting and administration services in the United States, offering a wide range of fund processing services to the investment management industry, and providing processing solutions to the international marketplace through its Ireland and Luxembourg operations.
55
| Business | Segment Results |
| Three months ended June 30 In millions |
Regional Community Banking |
Wholesale Banking |
PNC Advisors |
BlackRock |
PFPC |
Other |
Intercompany Eliminations |
Consolidated |
||||||||||||||||||||||
| 2005 INCOME STATEMENT | ||||||||||||||||||||||||||||||
| Net interest income (expense) |
$ | 366 | $ | 180 | $ | 28 | $ | 4 | $ | (7 | ) | $ | (35 | ) | $ | (2 | ) | $ | 534 | |||||||||||
| Noninterest income |
184 | 141 | 131 | 271 | 219 | (1 | ) | (20 | ) | 925 | ||||||||||||||||||||
| Total revenue |
550 | 321 | 159 | 275 | 212 | (36 | ) | (22 | ) | 1,459 | ||||||||||||||||||||
| Provision for (recoveries of) credit losses |
16 | (48 | ) | (1 | ) | 6 | (27 | ) | ||||||||||||||||||||||
| Depreciation and amortization |
15 | 6 | 3 | 7 | 15 | 18 | 64 | |||||||||||||||||||||||
| Other noninterest expense |
301 | 162 | 117 | 182 | 158 | 69 | (17 | ) | 972 | |||||||||||||||||||||
| Earnings before minority and other interests and income taxes |
218 | 201 | 40 | 86 | 39 | (129 | ) | (5 | ) | 450 | ||||||||||||||||||||
| Minority and other interests in income of consolidated entities |
(11 | ) | 1 | 19 | 9 | |||||||||||||||||||||||||
| Income taxes |
81 | 68 | 15 | 32 | 15 | (37 | ) | (15 | ) | 159 | ||||||||||||||||||||
| Earnings |
$ | 137 | $ | 144 | $ | 25 | $ | 53 | $ | 24 | $ | (111 | ) | $ | 10 | $ | 282 | |||||||||||||
| Inter-segment revenue |
$ | 1 | $ | 2 | $ | 3 | $ | 8 | $ | 8 | $ | (22 | ) | |||||||||||||||||
| AVERAGE ASSETS (a) |
$ | 24,511 | $ | 26,180 | $ | 2,935 | $ | 1,563 | $ | 2,083 | $ | 31,744 | $ | (1,457 | ) | $ | 87,559 | |||||||||||||
| 2004 INCOME STATEMENT |
||||||||||||||||||||||||||||||
| Net interest income (expense) |
$ | 339 | $ | 170 | $ | 27 | $ | 15 | $ | (13 | ) | $ | (64 | ) | $ | 7 | $ | 481 | ||||||||||||
| Noninterest income |
171 | 151 | 127 | 184 | 198 | 97 | (18 | ) | 910 | |||||||||||||||||||||
| Total revenue |
510 | 321 | 154 | 199 | 185 | 33 | (11 | ) | 1,391 | |||||||||||||||||||||
| Provision for (recoveries of) credit losses |
6 | 8 | (2 | ) | (4 | ) | 8 | |||||||||||||||||||||||
| Depreciation and amortization |
13 | 5 | 2 | 5 | 9 | 18 | 52 | |||||||||||||||||||||||
| Other noninterest expense |
294 | 157 | 112 | 116 | 148 | 48 | (17 | ) | 858 | |||||||||||||||||||||
| Earnings before minority and other interests and income taxes |
197 | 151 | 42 | 78 | 28 | (29 | ) | 6 | 473 | |||||||||||||||||||||
| Minority and other interests in income of consolidated entities |
(10 | ) | 4 | 17 | 11 | |||||||||||||||||||||||||
| Income taxes |
72 | 48 | 15 | 26 | 11 | (18 | ) | 4 | 158 | |||||||||||||||||||||
| Earnings |
$ | 125 | $ | 113 | $ | 27 | $ | 48 | $ | 17 | $ | (28 | ) | $ | 2 | $ | 304 | |||||||||||||
| Inter-segment revenue |
$ | 2 | $ | 2 | $ | 8 | $ | (3 | ) | $ | 2 | $ | (11 | ) | ||||||||||||||||
| AVERAGE ASSETS (a) |
$ | 21,631 | $ | 21,989 | $ | 2,737 | $ | 966 | $ | 2,037 | $ | 26,464 | $ | (1,956 | ) | $ | 73,868 | |||||||||||||
| Six months ended June 30 In millions |
Regional Community Banking |
Wholesale Banking |
PNC Advisors |
BlackRock |
PFPC |
Other |
Intercompany Eliminations |
Consolidated |
||||||||||||||||||||||
| 2005 INCOME STATEMENT |
||||||||||||||||||||||||||||||
| Net interest income (expense) |
$ | 706 | $ | 355 | $ | 56 | $ | 12 | $ | (21 | ) | $ | (65 | ) | $ | (3 | ) | $ | 1,040 | |||||||||||
| Noninterest income |
349 | 277 | 259 | 521 | 447 | 83 | (38 | ) | 1,898 | |||||||||||||||||||||
| Total revenue |
1,055 | 632 | 315 | 533 | 426 | 18 | (41 | ) | 2,938 | |||||||||||||||||||||
| Provision for (recoveries of) credit losses |
30 | (52 | ) | (1 | ) | 4 | (19 | ) | ||||||||||||||||||||||
| Depreciation and amortization |
27 | 11 | 5 | 14 | 29 | 37 | 123 | |||||||||||||||||||||||
| Other noninterest expense |
588 | 324 | 227 | 359 | 320 | 127 | (33 | ) | 1,912 | |||||||||||||||||||||
| Earnings before minority and other interests and income taxes |
410 | 349 | 84 | 160 | 77 | (150 | ) | (8 | ) | 922 | ||||||||||||||||||||
| Minority and other interests in income of consolidated entities |
(22 | ) | 1 | 36 | 15 | |||||||||||||||||||||||||
| Income taxes |
152 | 117 | 31 | 59 | 30 | (103 | ) | (15 | ) | 271 | ||||||||||||||||||||
| Earnings |
$ | 258 | $ | 254 | $ | 53 | $ | 100 | $ | 47 | $ | (83 | ) | $ | 7 | $ | 636 | |||||||||||||
| Inter-segment revenue |
$ | 2 | $ | 3 | $ | 6 | $ | 16 | $ | 1 | $ | 13 | $ | (41 | ) | |||||||||||||||
| AVERAGE ASSETS (a) |
$ | 23,745 | $ | 25,138 | $ | 2,907 | $ | 1,563 | $ | 2,083 | $ | 31,577 | $ | (1,541 | ) | $ | 85,472 | |||||||||||||
| 2004 INCOME STATEMENT |
||||||||||||||||||||||||||||||
| Net interest income (expense) |
$ | 671 | $ | 333 | $ | 54 | $ | 21 | $ | (24 | ) | $ | (77 | ) | $ | (3 | ) | $ | 975 | |||||||||||
| Noninterest income |
339 | 304 | 270 | 366 | 400 | 177 | (35 | ) | 1,821 | |||||||||||||||||||||
| Total revenue |
1,010 | 637 | 324 | 387 | 376 | 100 | (38 | ) | 2,796 | |||||||||||||||||||||
| Provision for (recoveries of) credit losses |
35 | (5 | ) | (1 | ) | (9 | ) | 20 | ||||||||||||||||||||||
| Depreciation and amortization |
25 | 10 | 5 | 10 | 16 | 35 | 101 | |||||||||||||||||||||||
| Other noninterest expense |
594 | 314 | 229 | 223 | 305 | 76 | (37 | ) | 1,704 | |||||||||||||||||||||
| Earnings before minority and other interests and income taxes |
356 | 318 | 91 | 154 | 55 | (2 | ) | (1 | ) | 971 | ||||||||||||||||||||
| Minority and other interests in income of consolidated entities |
(20 | ) | 4 | 34 | 18 | |||||||||||||||||||||||||
| Income taxes |
129 | 103 | 33 | 47 | 22 | (15 | ) | 2 | 321 | |||||||||||||||||||||
| Earnings |
$ | 227 | $ | 235 | $ | 58 | $ | 103 | $ | 33 | $ | (21 | ) | $ | (3 | ) | $ | 632 | ||||||||||||
| Inter-segment revenue |
$ | 4 | $ | 1 | $ | 6 | $ | 17 | $ | 10 | $ | (38 | ) | |||||||||||||||||
| AVERAGE ASSETS (a) |
$ | 21,193 | $ | 21,979 | $ | 2,698 | $ | 966 | $ | 2,037 | $ | 26,637 | $ | (2,064 | ) | $ | 73,446 | |||||||||||||
| (a) | Period-end balances for BlackRock and PFPC. |
| (b) | Certain revenue and expense amounts shown in the preceding table differ from amounts included in the Business Segments Review section of Part I, Item 2 of this Form 10-Q due to the presentation in Item 2 of business revenues on a taxable-equivalent basis (except for PFPC) and classification differences related to BlackRock and PFPC. BlackRock income classified as net interest income in the preceding table represents the net of investment income and interest expense as presented in the Business Segments Review section. PFPC income classified as net interest income (expense) in the preceding table represents the interest components of other nonoperating income (net of nonoperating expense), debt financing, and fund servicing revenue as disclosed in the Business Segments Review section. |
56
NOTE 15 COMMITMENTS AND GUARANTEES
EQUITY FUNDING COMMITMENTS
We had commitments to make additional equity investments in certain equity management entities of $97 million and in affordable housing limited partnerships of $49 million at June 30, 2005.
STANDBY LETTERS OF CREDIT
We issue standby letters of credit and have risk participations in standby letters of credit and bankers acceptances issued by other financial institutions, in each case to support obligations of our customers to third parties. If the customer fails to meet its financial or performance obligation to the third party under the terms of the contract, then upon the request of the guaranteed party, we would be obligated to make payment to them. The standby letters of credit and risk participations in standby letters of credit and bankers acceptances outstanding on June 30, 2005 had terms ranging from less than one year to 9 years. The aggregate maximum amount of future payments we could be required to make under outstanding standby letters of credit and risk participations in standby letters of credit and bankers acceptances was $5.7 billion at June 30, 2005.
Assets valued as of June 30, 2005 of approximately $900 million secured certain specifically identified standby letters of credit. Approximately $2.0 billion in recourse provisions from third parties was also available for this purpose as of June 30, 2005. In addition, a portion of the remaining standby letters of credit and letter of credit risk participations issued on behalf of specific customers is also secured by collateral or guarantees that secure the customers other obligations to us. The carrying amount of the liability for our obligations related to standby letters of credit and risk participations in standby letters of credit and bankers acceptances was $52 million at June 30, 2005.
STANDBY BOND PURCHASE AGREEMENTS AND
OTHER LIQUIDITY FACILITIES
We enter into standby bond purchase agreements to support municipal bond obligations and enter into certain other liquidity facilities to support individual pools of receivables acquired by unrelated commercial paper conduits. At June 30, 2005, our total commitments under these facilities were $296 million and $239 million, respectively.
INDEMNIFICATIONS
We are a party to numerous acquisition or divestiture agreements under which we have purchased or sold, or agreed to purchase or sell, various types of assets. These agreements can cover the purchase or sale of:
| | Entire businesses, |
| | Loan portfolios, |
| | Branch banks, |
| | Partial interests in companies, or |
| | Other types of assets. |
These agreements generally include indemnification provisions under which we indemnify the third parties to these agreements against a variety of risks to the indemnified parties as a result of the transaction in question. When PNC is the seller, the indemnification provisions will generally also provide the buyer with protection relating to the quality of the assets we are selling and the extent of any liabilities being assumed by the buyer. Due to the nature of these indemnification provisions, we cannot quantify the total potential exposure to us resulting from them.
We provide indemnification in connection with securities offering transactions in which we are involved. When we are the issuer of the securities, we provide indemnification to the underwriters or placement agents analogous to the indemnification provided to the purchasers of businesses from us, as described above. When we are an underwriter or placement agent, we provide a limited indemnification to the issuer related to our actions in connection with the offering and, if there are other underwriters, indemnification to the other underwriters intended to result in an appropriate sharing of the risk of participating in the offering. Due to the nature of these indemnification provisions, we cannot quantify the total potential exposure to us resulting from them.
We enter into certain types of agreements that include provisions for indemnifying third parties, such as:
| | Agreements relating to providing various servicing and processing functions to third parties, |
| | Agreements relating to the creation of trusts or other legal entities to facilitate leasing transactions, commercial mortgage-backed securities transactions (loan securitizations) and certain other off-balance sheet transactions, |
| | Syndicated credit agreements, as a syndicate member, |
| | Sales of individual loans, and |
| | Litigation settlement agreements. |
Due to the nature of these indemnification provisions, we cannot calculate our aggregate potential exposure under them.
We enter into certain types of agreements, including leases, assignments of leases, and subleases, in which we agree to indemnify third parties for acts by our agents, assignees and/or sublessees, and employees. While we do not believe these indemnification liabilities are material, either individually or in total, we cannot calculate our potential exposure.
We enter into contracts for the delivery of technology service in which we indemnify the other party against claims of patent and copyright infringement by third parties. Due to the nature of these indemnification provisions, we cannot calculate our aggregate potential exposure under this type of indemnification.
57
We engage in certain insurance activities which require our employees to be bonded. We satisfy this bonding requirement by issuing letters of credit in a total amount of approximately $5 million.
In the ordinary course of business, we enter into contracts with third parties under which the third parties provide services on behalf of PNC. In many of these contracts, we agree to indemnify the third party service provider under certain circumstances. The terms of the indemnity vary from contract to contract and the amount of the indemnification liability, if any, cannot be determined.
We are a general or limited partner in certain asset management and investment limited partnerships, many of which contain indemnification provisions that would require us to make payments in excess of our remaining funding commitments. While in certain of these partnerships the maximum liability to us is limited to the sum of our unfunded commitments and partnership distributions received by us, in the others the indemnification liability is unlimited. As a result, we cannot determine our aggregate potential exposure for these indemnifications.
Pursuant to their bylaws, PNC and its subsidiaries provide indemnification to directors, officers and, in some cases, employees and agents against certain liabilities incurred as a result of their service on behalf of or at the request of PNC and its subsidiaries. PNC and its subsidiaries also advance on behalf of covered individuals costs incurred in connection with certain claims or proceedings, subject to written undertakings by each such individual to repay all amounts so advanced if it is ultimately determined that the individual is not entitled to indemnification. We generally are responsible for similar indemnifications and advancement obligations that companies we acquire, including Riggs, had to their officers, directors and sometimes employees and agents at the time of acquisition. We advanced such costs on behalf of several such individuals (including some from Riggs) with respect to pending litigation or investigations during the first six months of 2005. It is not possible for us to determine the aggregate potential exposure resulting from the obligation to provide this indemnity or to advance such costs.
In connection with the lending of securities held by PFPC as an intermediary on behalf of certain of its clients, we provide indemnification to those clients against the failure of the borrowers to return the securities. The market value of the securities lent is fully secured on a daily basis; therefore, the exposure to us is limited to temporary shortfalls in the collateral as a result of short-term fluctuations in trading prices of the loaned securities. At June 30, 2005, the total maximum potential exposure as a result of these indemnity obligations was approximately $7.0 billion, although we held collateral at the time in excess of that amount.
CONTINGENT PAYMENTS IN CONNECTION WITH CERTAIN ACQUISITIONS
A number of the acquisition agreements to which we are a party and under which we have purchased various types of assets, including the purchase of entire businesses, partial interests in companies, or other types of assets, require us to make additional payments in future years if certain predetermined goals occur within a specific time period. As some of these provisions do not specify dollar limitations, we cannot quantify our total exposure resulting from these agreements.
In July 2005, PNC announced plans to achieve cost savings, revenue enhancements and other objectives related to the One PNC initiative. One PNC is an ongoing, company-wide review of business practices with goals of moving closer to the customer, improving the companys overall efficiency, and targeting resources to more value-added activities. Implementation of ideas generated through the One PNC initiative has begun and will continue through the second quarter of 2007.
We estimate that changes resulting from the One PNC initiative will result in employee severance and other implementation costs of approximately $85 million, the majority of which will be recognized beginning in the third quarter of 2005 and continuing through 2006.
58
STATISTICAL INFORMATION
THE PNC FINANCIAL SERVICES GROUP, INC.
AVERAGE CONSOLIDATED BALANCE SHEET AND NET INTEREST ANALYSIS
|
Six months ended June 30 |
||||||||||||||||||||
|
2005 |
2004 |
|||||||||||||||||||
| Taxable-equivalent basis Dollars in millions |
Average Balances |
Interest Income/Expense |
Average Yields/Rates |
Average Balances |
Interest Income/Expense |
Average Yields/Rates |
||||||||||||||
| ASSETS | ||||||||||||||||||||
| Interest-earning assets |
||||||||||||||||||||
| Securities available for sale and held to maturity |
||||||||||||||||||||
| Securities available for sale |
||||||||||||||||||||
| Mortgage-backed, asset-backed, and other debt |
$ | 10,389 | $ | 218 | 4.20 | % | $ | 8,958 | $ | 167 | 3.73 | % | ||||||||
| U.S. Treasury and government agencies/corporations |
7,153 | 143 | 3.99 | 6,543 | 97 | 2.97 | ||||||||||||||
| State and municipal |
171 | 7 | 8.61 | 245 | 7 | 5.38 | ||||||||||||||
| Corporate stocks and other |
181 | 6 | 6.64 | 270 | 6 | 4.23 | ||||||||||||||
| Total securities available for sale |
17,894 | 374 | 4.18 | 16,016 | 277 | 3.45 | ||||||||||||||
| Securities held to maturity |
1 | 1.65 | 2 | 9.07 | ||||||||||||||||
| Total securities available for sale and held to maturity |
17,895 | 374 | 4.18 | 16,018 | 277 | 3.45 | ||||||||||||||
| Loans, net of unearned income |
||||||||||||||||||||
| Commercial |
18,601 | 522 | 5.58 | 16,136 | 406 | 4.98 | ||||||||||||||
| Commercial real estate |
2,248 | 63 | 5.57 | 2,174 | 50 | 4.57 | ||||||||||||||
| Consumer |
15,919 | 429 | 5.43 | 13,344 | 342 | 5.15 | ||||||||||||||
| Residential mortgage |
5,301 | 137 | 5.16 | 3,557 | 93 | 5.23 | ||||||||||||||
| Lease financing |
3,009 | 67 | 4.51 | 3,744 | 85 | 4.57 | ||||||||||||||
| Other |
490 | 11 | 4.34 | 507 | 7 | 2.82 | ||||||||||||||
| Total loans, net of unearned income |
45,568 | 1,229 | 5.40 | 39,462 | 983 | 4.97 | ||||||||||||||
| Loans held for sale |
2,047 | 41 | 4.00 | 1,598 | 21 | 2.60 | ||||||||||||||
| Federal funds sold and resale agreements |
1,444 | 17 | 2.29 | 2,065 | 17 | 1.58 | ||||||||||||||
| Other |
3,018 | 57 | 3.83 | 1,357 | 33 | 4.92 | ||||||||||||||
| Total interest-earning assets/interest income |
69,972 | 1,718 | 4.91 | 60,500 | 1,331 | 4.39 | ||||||||||||||
| Noninterest-earning assets |
||||||||||||||||||||
| Allowance for loan and lease losses |
(633 | ) | (628 | ) | ||||||||||||||||
| Cash and due from banks |
3,047 | 2,844 | ||||||||||||||||||
| Other assets |
13,086 | 10,730 | ||||||||||||||||||
| Total assets |
$ | 85,472 | $ | 73,446 | ||||||||||||||||
| LIABILITIES, MINORITY AND NONCONTROLLING INTERESTS, AND SHAREHOLDERS EQUITY |
||||||||||||||||||||
| Interest-bearing liabilities |
||||||||||||||||||||
| Interest-bearing deposits |
||||||||||||||||||||
| Money market |
$ | 17,024 | 159 | 1.89 | $ | 15,804 | 58 | .74 | ||||||||||||
| Demand |
8,086 | 24 | .59 | 7,876 | 14 | .36 | ||||||||||||||
| Savings |
2,809 | 9 | .65 | 2,592 | 4 | .33 | ||||||||||||||
| Retail certificates of deposit |
10,758 | 158 | 2.95 | 8,715 | 118 | 2.70 | ||||||||||||||
| Other time |
1,195 | 23 | 3.84 | 512 | 11 | 4.26 | ||||||||||||||
| Time deposits in foreign offices |
2,425 | 33 | 2.69 | 1,145 | 6 | .98 | ||||||||||||||
| Total interest-bearing deposits |
42,297 | 406 | 1.93 | 36,644 | 211 | 1.15 | ||||||||||||||
| Borrowed funds |
||||||||||||||||||||
| Federal funds purchased |
2,085 | 29 | 2.81 | 2,108 | 10 | .96 | ||||||||||||||
| Repurchase agreements |
2,356 | 30 | 2.57 | 1,333 | 6 | .90 | ||||||||||||||
| Bank notes and senior debt |
2,978 | 46 | 3.05 | 2,752 | 30 | 2.16 | ||||||||||||||
| Subordinated debt |
3,868 | 87 | 4.49 | 3,569 | 68 | 3.83 | ||||||||||||||
| Commercial paper |
2,391 | 34 | 2.80 | 1,963 | 11 | 1.09 | ||||||||||||||
| Other borrowed funds |
2,012 | 33 | 3.28 | 1,126 | 13 | 2.18 | ||||||||||||||
| Total borrowed funds |
15,690 | 259 | 3.29 | 12,851 | 138 | 2.14 | ||||||||||||||
| Total interest-bearing liabilities/interest expense |
57,987 | 665 | 2.30 | 49,495 | 349 | 1.41 | ||||||||||||||
| Noninterest-bearing liabilities, minority and noncontrolling interests, and shareholders equity |
||||||||||||||||||||
| Demand and other noninterest-bearing deposits |
12,711 | 11,516 | ||||||||||||||||||
| Allowance for unfunded loan commitments and letters of credit |
77 | 90 | ||||||||||||||||||
| Accrued expenses and other liabilities |
6,473 | 4,897 | ||||||||||||||||||
| Minority and noncontrolling interests in consolidated entities |
526 | 427 | ||||||||||||||||||
| Shareholders equity |
7,698 | 7,021 | ||||||||||||||||||
| Total liabilities, minority and noncontrolling interests, and shareholders equity |
$ | 85,472 | $ | 73,446 | ||||||||||||||||
| Interest rate spread |
2.61 | 2.98 | ||||||||||||||||||
| Impact of noninterest-bearing sources |
.40 | .26 | ||||||||||||||||||
| Net interest income/margin |
$ | 1,053 | 3.01 | % | $ | 982 | 3.24 | % | ||||||||||||
Nonaccrual loans are included in loans, net of unearned income. The impact of financial derivatives used in interest rate risk management is included in the interest income/expense and average yields/rates of the related assets and liabilities. Basis adjustments related to hedged items are included in noninterest-earning assets and noninterest-bearing liabilities. Average balances of securities are based on amortized historical cost (excluding SFAS 115 adjustments to fair value which are included in other assets).
59
|
Second Quarter 2005 |
First Quarter 2005 |
Second Quarter 2004 |
||||||||||||||||||||||||||||
| Taxable-equivalent basis Dollars in millions |
Average Balances |
Interest Income/Expense |
Average Yields/Rates |
Average Balances |
Interest Income/Expense |
Average Yields/Rates |
Average Balances |
Interest Income/Expense |
Average Yields/Rates |
|||||||||||||||||||||
| ASSETS |
||||||||||||||||||||||||||||||
| Interest-earning assets |
||||||||||||||||||||||||||||||
| Securities available for sale and held to maturity |
||||||||||||||||||||||||||||||
| Securities available for sale |
||||||||||||||||||||||||||||||
| Mortgage-backed, asset-backed, and other debt |
$ | 11,138 | $ | 117 | 4.22 | % | $ | 9,631 | $ | 101 | 4.19 | % | $ | 8,624 | $ | 78 | 3.63 | % | ||||||||||||
| U.S. Treasury and government agencies/corporations |
7,406 | 77 | 4.12 | 6,897 | 66 | 3.85 | 6,654 | 48 | 2.91 | |||||||||||||||||||||
| State and municipal |
171 | 3 | 8.72 | 172 | 4 | 8.50 | 225 | 3 | 5.65 | |||||||||||||||||||||
| Corporate stocks and other |
190 | 3 | 5.92 | 172 | 3 | 7.55 | 259 | 2 | 2.40 | |||||||||||||||||||||
| Total securities available for sale |
18,905 | 200 | 4.24 | 16,872 | 174 | 4.13 | 15,762 | 131 | 3.33 | |||||||||||||||||||||
| Securities held to maturity |
1 | 1.84 | 2 | 5.78 | ||||||||||||||||||||||||||
| Total securities available for sale and held to maturity |
18,906 | 200 | 4.24 | 16,872 | 174 | 4.13 | 15,764 | 131 | 3.33 | |||||||||||||||||||||
| Loans, net of unearned income |
||||||||||||||||||||||||||||||
| Commercial |
19,259 | 277 | 5.69 | 17,935 | 245 | 5.47 | 16,445 | 203 | 4.89 | |||||||||||||||||||||
| Commercial real estate |
2,478 | 36 | 5.67 | 2,015 | 27 | 5.44 | 2,100 | 23 | 4.41 | |||||||||||||||||||||
| Consumer |
16,195 | 223 | 5.53 | 15,641 | 206 | 5.33 | 13,968 | 177 | 5.08 | |||||||||||||||||||||
| Residential mortgage |
5,742 | 74 | 5.16 | 4,855 | 63 | 5.18 | 3,622 | 47 | 5.18 | |||||||||||||||||||||
| Lease financing |
2,978 | 33 | 4.52 | 3,041 | 34 | 4.51 | 3,437 | 38 | 4.46 | |||||||||||||||||||||
| Other |
484 | 6 | 4.58 | 495 | 5 | 4.11 | 497 | 3 | 2.91 | |||||||||||||||||||||
| Total loans, net of unearned income |
47,136 | 649 | 5.48 | 43,982 | 580 | 5.30 | 40,069 | 491 | 4.89 | |||||||||||||||||||||
| Loans held for sale |
2,152 | 26 | 4.71 | 1,941 | 15 | 3.16 | 1,636 | 13 | 3.19 | |||||||||||||||||||||
| Federal funds sold and resale agreements |
649 | 4 | 2.43 | 2,249 | 13 | 2.25 | 1,896 | 9 | 1.68 | |||||||||||||||||||||
| Other |
3,098 | 29 | 3.85 | 2,937 | 28 | 3.82 | 1,551 | 18 | 4.64 | |||||||||||||||||||||
| Total interest-earning assets/interest income |
71,941 | 908 | 5.03 | 67,981 | 810 | 4.79 | 60,916 | 662 | 4.34 | |||||||||||||||||||||
| Noninterest-earning assets |
||||||||||||||||||||||||||||||
| Allowance for loan and lease losses |
(655 | ) | (611 | ) | (603 | ) | ||||||||||||||||||||||||
| Cash and due from banks |
3,106 | 2,987 | 2,793 | |||||||||||||||||||||||||||
| Other assets |
13,167 | 13,005 | 10,762 | |||||||||||||||||||||||||||
| Total assets |
$ | 87,559 | $ | 83,362 | $ | 73,868 | ||||||||||||||||||||||||
| LIABILITIES, MINORITY AND NONCONTROLLING INTERESTS, AND SHAREHOLDERS EQUITY |
||||||||||||||||||||||||||||||
| Interest-bearing liabilities |
||||||||||||||||||||||||||||||
| Interest-bearing deposits |
||||||||||||||||||||||||||||||
| Money market |
$ | 17,482 | 89 | 2.05 | $ | 16,562 | 70 | 1.71 | $ | 16,027 | 30 | .75 | ||||||||||||||||||
| Demand |
8,205 | 13 | .62 | 7,965 | 11 | .57 | 7,878 | 7 | .35 | |||||||||||||||||||||
| Savings |
2,787 | 4 | .63 | 2,831 | 5 | .67 | 2,595 | 2 | .34 | |||||||||||||||||||||
| Retail certificates of deposit |
11,215 | 86 | 3.04 | 10,296 | 72 | 2.86 | 8,650 | 58 | 2.69 | |||||||||||||||||||||
| Other time |
1,484 | 14 | 3.82 | 902 | 9 | 3.87 | 680 | 6 | 3.46 | |||||||||||||||||||||
| Time deposits in foreign offices |
2,477 | 18 | 2.91 | 2,373 | 15 | 2.47 | 1,485 | 4 | .99 | |||||||||||||||||||||
| Total interest-bearing deposits |
43,650 | 224 | 2.05 | 40,929 | 182 | 1.80 | 37,315 | 107 | 1.15 | |||||||||||||||||||||
| Borrowed funds |
||||||||||||||||||||||||||||||
| Federal funds purchased |
2,506 | 19 | 3.00 | 1,659 | 10 | 2.49 | 2,303 | 6 | 1.00 | |||||||||||||||||||||
| Repurchase agreements |
2,405 | 17 | 2.86 | 2,306 | 13 | 2.25 | 1,508 | 4 | .86 | |||||||||||||||||||||
| Bank notes and senior debt |
3,288 | 27 | 3.21 | 2,663 | 19 | 2.84 | 2,752 | 15 | 2.18 | |||||||||||||||||||||
| Subordinated debt |
3,826 | 45 | 4.72 | 3,911 | 42 | 4.27 | 3,545 | 33 | 3.79 | |||||||||||||||||||||
| Commercial paper |
2,438 | 19 | 3.07 | 2,344 | 15 | 2.52 | 1,815 | 5 | 1.08 | |||||||||||||||||||||
| Other borrowed funds |
1,867 | 16 | 3.40 | 2,159 | 17 | 3.20 | 633 | 7 | 4.36 | |||||||||||||||||||||
| Total borrowed funds |
16,330 | 143 | 3.48 | 15,042 | 116 | 3.09 | 12,556 | 70 | 2.21 | |||||||||||||||||||||
| Total interest-bearing liabilities/interest expense |
59,980 | 367 | 2.44 | 55,971 | 298 | 2.15 | 49,871 | 177 | 1.42 | |||||||||||||||||||||
| Noninterest-bearing liabilities, minority and noncontrolling interests, and shareholders equity |
||||||||||||||||||||||||||||||
| Demand and other noninterest-bearing deposits |
12,987 | 12,432 | 11,681 | |||||||||||||||||||||||||||
| Allowance for unfunded loan commitments and letters of credit |
78 | 76 | 90 | |||||||||||||||||||||||||||
| Accrued expenses and other liabilities |
6,095 | 6,856 | 4,773 | |||||||||||||||||||||||||||
| Minority and noncontrolling interests in consolidated entities |
526 | 527 | 419 | |||||||||||||||||||||||||||
| Shareholders equity |
7,893 | 7,500 | 7,034 | |||||||||||||||||||||||||||
| Total liabilities, minority and noncontrolling interests, and shareholders equity |
$ | 87,559 | $ | 83,362 | $ | 73,868 | ||||||||||||||||||||||||
| Interest rate spread |
2.59 | 2.64 | 2.92 | |||||||||||||||||||||||||||
| Impact of noninterest-bearing sources |
.41 | .38 | .26 | |||||||||||||||||||||||||||
| Net interest income/margin |
$ | 541 | 3.00 | % | $ | 512 | 3.02 | % | $ | 485 | 3.18 | % | ||||||||||||||||||
Loan fees for the six months ended June 30, 2005 and June 30, 2004 were $51 million and $55 million, respectively. Loan fees for the three months ended June 30, 2005, March 31, 2005 and June 30, 2004 were $27 million, $24 million and $29 million, respectively. Interest income includes the effects of taxable-equivalent adjustments using a marginal federal income tax rate of 35% to increase tax-exempt interest income to a taxable-equivalent basis. The taxable-equivalent adjustments for the six months ended June 30, 2005 and June 30, 2004 were $13 million and $7 million, respectively. The taxable-equivalent adjustments for the three months ended June 30, 2005, March 31, 2005 and June 30, 2004 were $7 million, $6 million and $4 million, respectively.
60
PART II OTHER INFORMATION
There are several pending judicial or administrative proceedings or other matters arising out of the three 2001 transactions (the PAGIC transactions) that gave rise to a financial statement restatement that we announced in January 2002. In December 2004, we entered into settlement agreements relating to certain of the lawsuits and other claims arising out of the PAGIC transactions. These pending proceedings and settlement agreements are described in our 2004 Annual Report on Form 10-K under Item 3 and updated in our first quarter 2005 Form 10-Q under Part II, Item 1. We are making progress towards completing those aspects of the settlement agreements that remain subject to conditions. In particular, the United States District Court for the Western District of Pennsylvania held a hearing on August 4, 2005 in the consolidated class action lawsuit brought on behalf of certain purchasers of our common stock to determine whether to approve the proposed settlement agreement.
Some of our subsidiaries are defendants (or have potential contractual contribution obligations to other defendants) in several pending lawsuits brought during late 2002 and 2003 arising out of the bankruptcy of Adelphia Communications Corporation. There also are threatened additional proceedings arising out of the same matters. One of the lawsuits is pending in the United States Bankruptcy Court for the Southern District of New York and has been brought on Adelphias behalf as an adversary proceeding by the unsecured creditors committee in Adelphias bankruptcy proceeding. A motion to intervene on behalf of the equity committee is also pending in this case. The other lawsuits (one of which is a putative consolidated class action) have been brought by holders of debt and equity securities of Adelphia and have been consolidated for pretrial purposes in the United States District Court for the Southern District of New York. These lawsuits arise out of lending and securities underwriting activities engaged in by these PNC subsidiaries together with other financial services companies. In the aggregate, more than 400 other financial services companies and numerous other companies and individuals have been named as defendants in one or more of the lawsuits. Collectively, with respect to some or all of the defendants, the lawsuits allege violations of federal securities laws, violations of common law duties, aiding and abetting such violations, voidable preference payments, and fraudulent transfers, among other matters. The lawsuits seek unquantified monetary damages, interest, attorneys fees and other expenses, and a return of the alleged voidable preference and fraudulent transfer payments, among other remedies. We believe that we have substantial defenses to the claims against us in these lawsuits and intend to defend them vigorously. These lawsuits are currently in initial stages and present complex issues of law and fact. As a result, we are not currently capable of evaluating our exposure, if any, resulting from these lawsuits.
On April 29, 2005, an amended complaint was filed in the putative class action against PNC; PNC Bank, N.A.; our Pension Plan and its Pension Committee in the United States District Court for the Eastern District of Pennsylvania (originally filed in December 2004). The complaint claims violations of the Employee Retirement Income Security Act of 1974, as amended (ERISA), arising out of the January 1, 1999 conversion of our Pension Plan from a traditional defined benefit formula into a cash balance formula, the design and continued operation of the Plan, and other related matters. Plaintiffs seek to represent a class of all current and former employee-participants in and beneficiaries of the Plan as of December 31, 1998 and thereafter. Plaintiffs also seek to represent a subclass of all current and former employee participants in and beneficiaries of the Plan as of December 31, 1998 and thereafter who were or would have become eligible for an early retirement subsidy under the former Plan at some time prior to the date of the amended complaint. The plaintiffs are seeking damages and equitable relief available under ERISA, including interest, costs, and attorneys fees. We filed a motion to dismiss the amended complaint on May 23, 2005, which is currently pending. We believe that we have substantial defenses to the claims against us in this lawsuit and intend to defend it vigorously.
In its Form 10-Q for the quarter ended March 31, 2005, Riggs disclosed a number of pending lawsuits. All material lawsuits have been finally resolved or are subject to pending settlement agreements in principle. The pending settlements are subject, in some cases, to final documentation and otherwise to court approval and other standard conditions. None of the pending settlement amounts is material to PNC. The pending settlement amount for each of these lawsuits has been reserved upon the recording of our acquisition of Riggs.
As a result of the acquisition of Riggs, PNC is now responsible for Riggs obligations to provide indemnification to its directors, officers, and, in some cases, employees and agents against certain liabilities incurred as a result of their service on behalf of or at the request of Riggs. PNC is also now responsible for Riggs obligations to advance on behalf of covered individuals costs incurred in connection with certain claims or proceedings, subject to written undertakings to repay all amounts so advanced if it is ultimately determined that the individual is not entitled to indemnification. Since the acquisition, we have advanced such costs on behalf of covered individuals from Riggs and expect to continue to do so in the future at least with respect to the lawsuits and other legal matters identified in Riggs first quarter 2005 Form 10-Q.
In addition to the proceedings or other matters referred to above, PNC and persons to whom we may have indemnification obligations, in the normal course of business, are subject to various other pending and threatened legal proceedings in which claims for monetary damages and other relief are asserted. Management does not anticipate, at the present time, that the ultimate aggregate liability, if any, arising out of such other legal proceedings will have a material adverse effect on our financial position. However, we cannot now determine whether or not any claims asserted against us, whether in the proceedings or other matters specifically described above or otherwise, will have a material adverse effect on our results of operations in any future reporting period.
61
ITEM 2. UNREGISTERED SALES OF EQUITY SECURITIES AND USE OF PROCEEDS
Details of our repurchases of PNC common stock during the second quarter of 2005 are included in the following table:
In thousands, except per share data
| 2005 period |
Total shares purchased (a) |
Average price paid per share |
Total shares purchased as part of publicly announced programs (b) |
Maximum number of shares that may yet be purchased under the programs (b) |
|||||
| April 1 April 30 |
76 | $ | 51.62 | | 19,522 | ||||
| May 1 May 31 |
124 | $ | 54.59 | | 19,522 | ||||
| June 1 June 30 |
85 | $ | 54.75 | | 19,522 | ||||
| Total |
285 | $ | 53.84 | ||||||
| (a) | Includes PNC common stock purchased under the program referred to in note (b) to this table and PNC common stock purchased in connection with our various employee benefit plans. |
| (b) | Our current stock repurchase program, which was authorized as of February 16, 2005, allows us to purchase up to 20 million shares on the open market or in privately negotiated transactions. This program will remain in effect until fully utilized or until modified, superseded or terminated. We did not purchase any shares under this program during the second quarter of 2005. |
| ITEM | 6. EXHIBITS |
The following exhibit index lists Exhibits filed, or in the case of Exhibits 32.1 and 32.2 furnished, with this Quarterly Report on Form 10-Q:
EXHIBIT INDEX
| 12.1 | Computation of Ratio of Earnings to Fixed Charges | |
| 12.2 | Computation of Ratio of Earnings to Fixed Charges and Preferred Stock Dividends | |
| 31.1 | Certification of Chairman and Chief Executive Officer pursuant to Section 302 of the Sarbanes-Oxley Act of 2002 | |
| 31.2 | Certification of Vice Chairman and Chief Financial Officer pursuant to Section 302 of the Sarbanes-Oxley Act of 2002 | |
| 32.1 | Certification of Chairman and Chief Executive Officer pursuant to 18 U.S.C. Section 1350 as adopted pursuant to Section 906 of the Sarbanes-Oxley Act of 2002 | |
| 32.2 | Certification of Vice Chairman and Chief Financial Officer pursuant to 18 U.S.C. Section 1350 as adopted pursuant to Section 906 of the Sarbanes-Oxley Act of 2002 | |
You can receive copies of these Exhibits electronically at the SECs home page at www.sec.gov or from the public reference section of the SEC, at prescribed rates, at 100 F Street NE, Room 1580, Washington, D.C. 20549. The Exhibits are also available as part of this Form 10-Q on or through PNCs corporate website at www.pnc.com in the For Investors section. Shareholders may also receive copies of Exhibits, without charge, by contacting Shareholder Relations at (800) 843-2206 or via e-mail at investor.relations@pnc.com.
Pursuant to the requirements of the Securities Exchange Act of 1934, the registrant has duly caused this report to be signed on August 5, 2005 on its behalf by the undersigned thereunto duly authorized.
| The PNC Financial Services Group, Inc. |
| /s/ William S. Demchak |
| William S. Demchak |
| Vice Chairman and Chief Financial Officer |
| (Principal Financial Officer) |
62
THE PNC FINANCIAL SERVICES GROUP, INC.
CORPORATE HEADQUARTERS
The PNC Financial Services Group, Inc.
One PNC Plaza
249 Fifth Avenue
Pittsburgh, Pennsylvania 15222-2707
(412) 762-2000
STOCK LISTING
The PNC Financial Services Group, Inc. common stock is listed on the New York Stock Exchange under the symbol PNC.
INTERNET INFORMATION
The PNC Financial Services Group, Inc. financial reports and information about its products and services are available on the internet at www.pnc.com.
FINANCIAL INFORMATION
We are subject to the informational requirements of the Securities Exchange Act of 1934. Therefore, we file annual, quarterly and current reports as well as proxy materials with the Securities and Exchange Commission (SEC). You may obtain copies of these and other filings, including exhibits, electronically at the SECs website at www.sec.gov or on or through PNCs corporate website at www.pnc.com in the For Investors section. Copies also may be obtained without charge by contacting Shareholder Services at (800) 982-7652 or via e-mail at web.queries@computershare.com.
CORPORATE GOVERNANCE AT PNC
Information about our Board of Directors (Board) and its committees and corporate governance at PNC is available in the corporate governance section of the For Investors page of PNCs corporate website at www.pnc.com. Shareholders who would like to request printed copies of the PNC Code of Business Conduct and Ethics, our Corporate Governance Guidelines or the charters of our Boards Audit, Nominating and Governance, and Personnel and Compensation Committees (all of which are posted on the PNC website) may do so by sending their requests to Thomas R. Moore, Corporate Secretary, at corporate headquarters at the above address. Copies will be provided without charge to shareholders.
INQUIRIES
For financial services call 1-888-PNC-2265. Individual shareholders should contact Shareholder Services at (800) 982-7652.
Analysts and institutional investors should contact William H. Callihan, Senior Vice President, Director of Investor Relations, at (412) 762-8257 or via e-mail at investor.relations@pnc.com.
News media representatives and others seeking general information should contact Brian Goerke, Director of External Communications, at (412) 762-4550 or via e-mail at corporate.communications@pnc.com.
COMMON STOCK PRICES/DIVIDENDS DECLARED
The table below sets forth by quarter the range of high and low sale and quarter-end closing prices for The PNC Financial Services Group, Inc. common stock and the cash dividends declared per common share.
|
High |
Low |
Close |
Cash Dividends |
|||||||||
| 2005 Quarter | ||||||||||||
| First |
$ | 57.57 | $ | 50.30 | $ | 51.48 | $ | .50 | ||||
| Second |
55.90 | 49.35 | 54.46 | .50 | ||||||||
| Total |
$ | 1.00 | ||||||||||
| 2004 Quarter | ||||||||||||
| First |
$ | 59.79 | $ | 52.68 | $ | 55.42 | $ | .50 | ||||
| Second |
56.00 | 50.70 | 53.08 | .50 | ||||||||
| Third |
54.22 | 48.90 | 54.10 | .50 | ||||||||
| Fourth |
57.64 | 50.70 | 57.44 | .50 | ||||||||
| Total |
$ | 2.00 | ||||||||||
DIVIDEND POLICY
Holders of The PNC Financial Services Group, Inc. common stock are entitled to receive dividends when declared by the Board out of funds legally available. The Board presently intends to continue the policy of paying quarterly cash dividends. However, future dividends will depend on earnings, the financial condition of The PNC Financial Services Group, Inc. and other factors, including applicable government regulations and policies and contractual restrictions.
DIVIDEND REINVESTMENT AND STOCK PURCHASE PLAN
The PNC Financial Services Group, Inc. Dividend Reinvestment and Stock Purchase Plan enables holders of common and preferred stock to purchase additional shares of common stock conveniently and without paying brokerage commissions for service charges. A prospectus and enrollment form may be obtained by contacting Shareholder Services at (800) 982-7652.
REGISTRAR AND TRANSFER AGENT
Computershare Investor Services, LLC
2 North LaSalle Street
Chicago, Illinois 60602
(800) 982-7652
63