SLIDE PRESENTATION
Published on January 26, 2005
EXHIBIT 99.1
PNC
The PNC Financial Services Group, Inc.
Smith Barney Citigroup
Financial Services Conference
New York, NY
January 26, 2005
Cautionary Statement Regarding
Forward-Looking Information
This presentation contains forward-looking statements regarding our outlook or expectations relating to PNCs future business, operations, financial condition, financial performance and asset quality. Forward-looking statements are necessarily subject to numerous assumptions, risks and uncertainties.
The forward-looking statements in this presentation are qualified by the factors affecting forward-looking statements identified in the more detailed Cautionary Statement included in the written materials we distributed at this conference and in the version of the presentation materials posted on our corporate website at www.pnc.com, as well as those factors previously disclosed in our 2003 Form 10-K, our 2004 Form 10-Qs, and other SEC reports (accessible on the SECs website at www.sec.gov and on our corporate website).
Future events or circumstances may change our outlook or expectations and may also affect the nature of the assumptions, risks and uncertainties to which our forward-looking statements are subject. The forward-looking statements in this presentation speak only as of the date of this presentation. We do not assume any duty and do not undertake to update those statements.
This presentation may also include a discussion of non-GAAP financial measures, which, to the extent not so qualified therein, is qualified by GAAP reconciliation information available on our corporate website at www.pnc.com under For Investors.
PNC
Todays Discussion
2004 accomplishments
Current environment and our 2005 opportunities
Summary
PNC
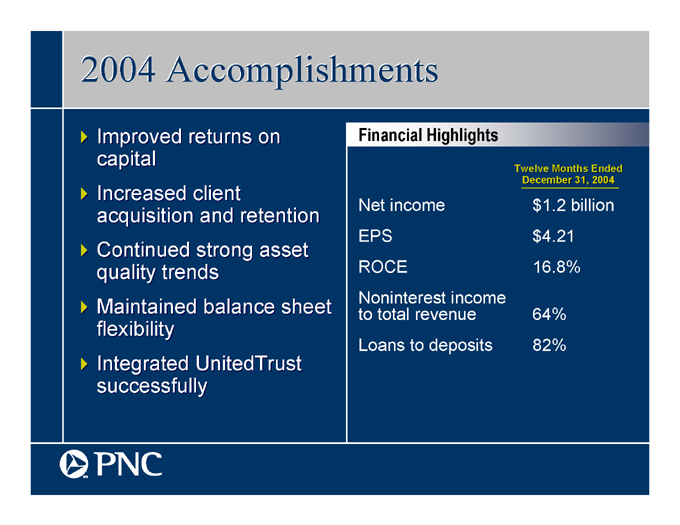
2004 Accomplishments
Improved returns on capital
Increased client acquisition and retention
Continued strong asset quality trends
Maintained balance sheet flexibility
Integrated UnitedTrust successfully
Financial Highlights
Twelve Months Ended
December 31, 2004
Net income $1.2 billion
EPS $4.21
ROCE 16.8%
Noninterest income to total revenue 64%
Loans to deposits 82%
PNC
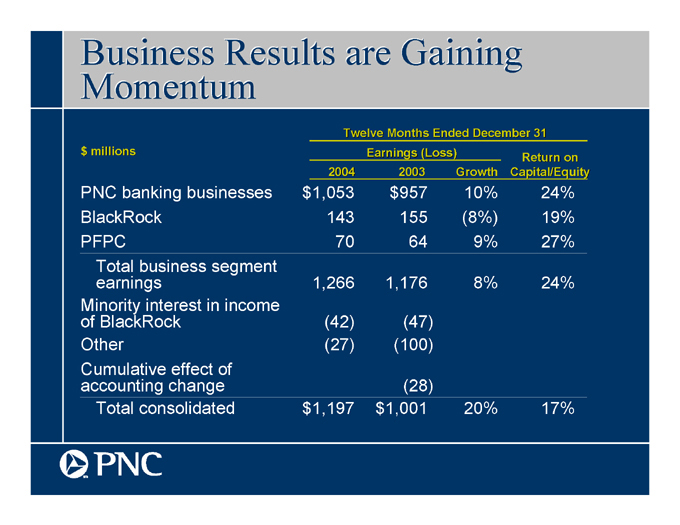
Business Results are Gaining
Momentum
Twelve Months Ended December 31
$ millions
Earnings (Loss)
2003
2004
Growth
Return on Capital/Equity
PNC banking businesses $1,053 $957 10% 24%
BlackRock 143 155 (8)% 19%
PFPC 70 64 9% 27%
Total business segment earnings 1,266 1,176 8% 24%
Minority interest in income of BlackRock (42) (47)
Other (27) (100)
Cumulative effect of accounting change (28)
Total consolidated $1,197 $1,001 20% 17%
PNC
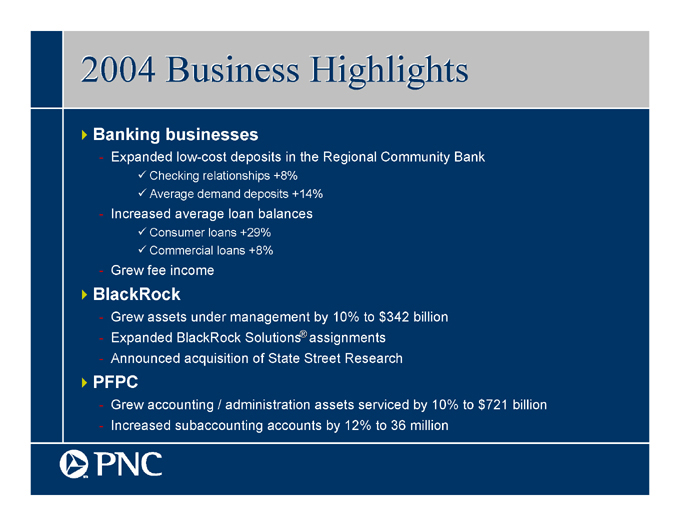
2004 Business Highlights
Banking businesses
Expanded low-cost deposits in the Regional Community Bank
Checking relationships +8%
Average demand deposits +14%
Increased average loan balances
Consumer loans +29%
Commercial loans +8%
Grew fee income
BlackRock
Grew assets under management by 10% to $342 billion
Expanded BlackRock Solutions® assignments
Announced acquisition of State Street Research
PFPC
Grew accounting / administration assets serviced by 10% to $721 billion
Increased subaccounting accounts by 12% to 36 million
PNC
Todays Discussion
2004 accomplishments
Current environment and our 2005 opportunities
Summary
PNC
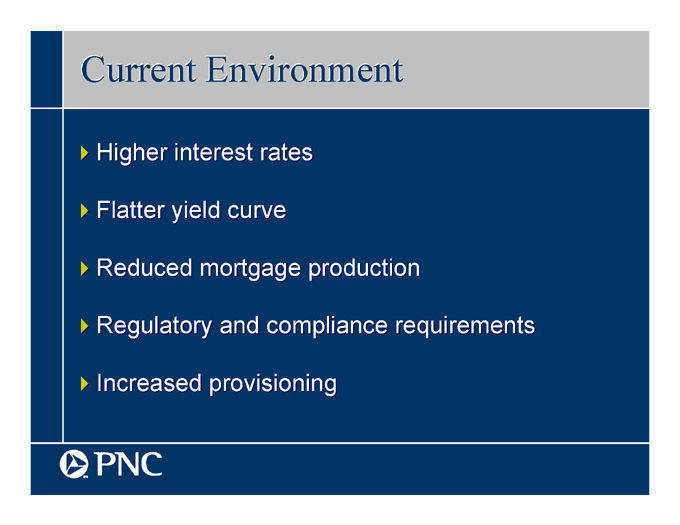
Current Environment
Higher interest rates
Flatter yield curve
Reduced mortgage production
Regulatory and compliance requirements
Increased provisioning
PNC
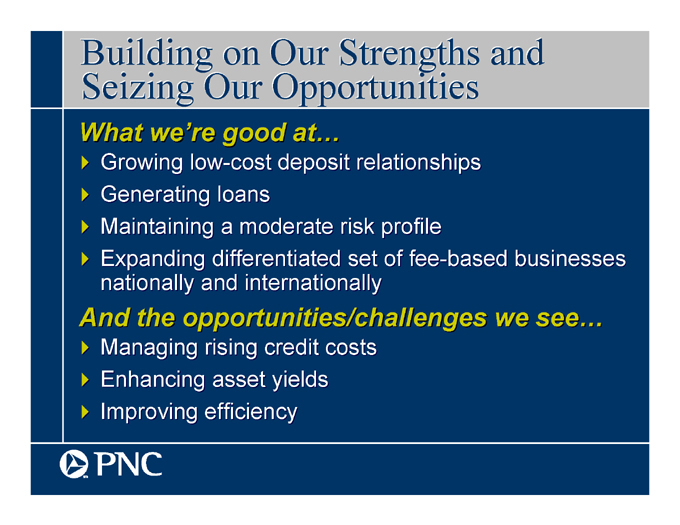
Building on Our Strengths and
Seizing Our Opportunities
What were good at
Growing low-cost deposit relationships
Generating loans
Maintaining a moderate risk profile
Expanding differentiated set of fee-based businesses nationally and internationally
And the opportunities/challenges we see
Managing rising credit costs
Enhancing asset yields
Improving efficiency
PNC
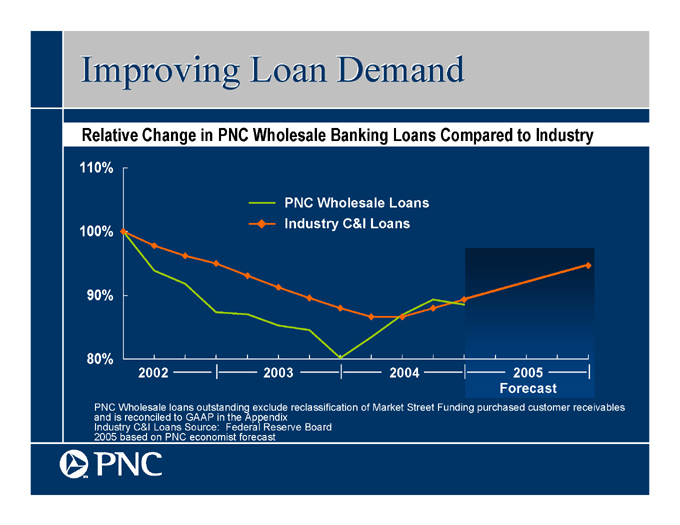
Improving Loan Demand
Relative Change in PNC Wholesale Banking Loans Compared to Industry
110%
PNC Wholesale Loans
Industry C&I Loans
100%
90%
80%
2002
2003
2004
2005
Forecast
PNC Wholesale loans outstanding exclude reclassification of Market Street Funding purchased customer receivables and is reconciled to GAAP in the Appendix
Industry C&I Loans Source: Federal Reserve Board
2005 based on PNC economist forecast
PNC
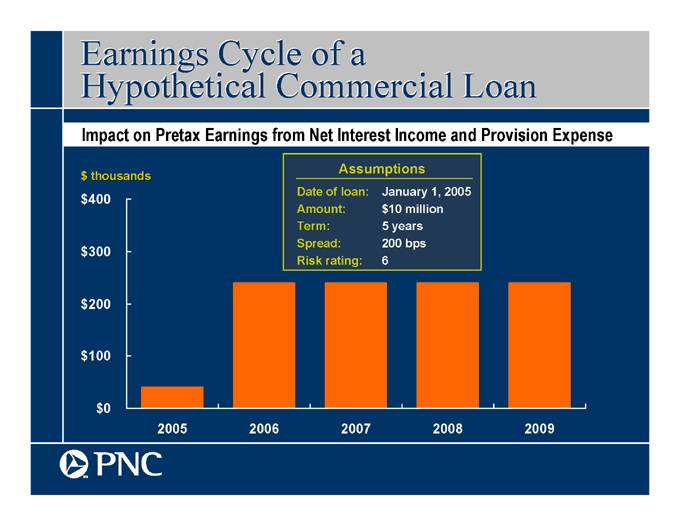
Earnings Cycle of a
Hypothetical Commercial Loan
Impact on Pretax Earnings from Net Interest Income and Provision Expense
$ thousands
$400
$300
$200
$100
$0
2005
2006
2007
2008
2009
Assumptions
Date of loan: January 1, 2005
Amount: $10 million
Term: 5 years
Spread: 200 bps
Risk rating: 6
PNC
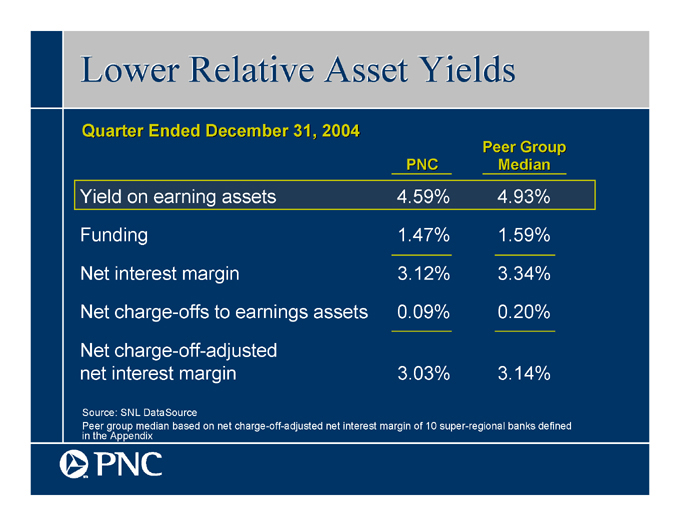
Lower Relative Asset Yields
Quarter Ended December 31, 2004
PNC
Peer Group
Median
Yield on earning assets 4.59% 4.93%
Funding 1.47% 1.59%
Net interest margin 3.12% 3.34%
Net charge-offs to earnings assets 0.09% 0.20%
Net charge-off-adjusted
net interest margin 3.03% 3.14%
Source: SNL DataSource
Peer group median based on net charge-off-adjusted net interest margin of 10 super-regional banks defined in the Appendix
PNC
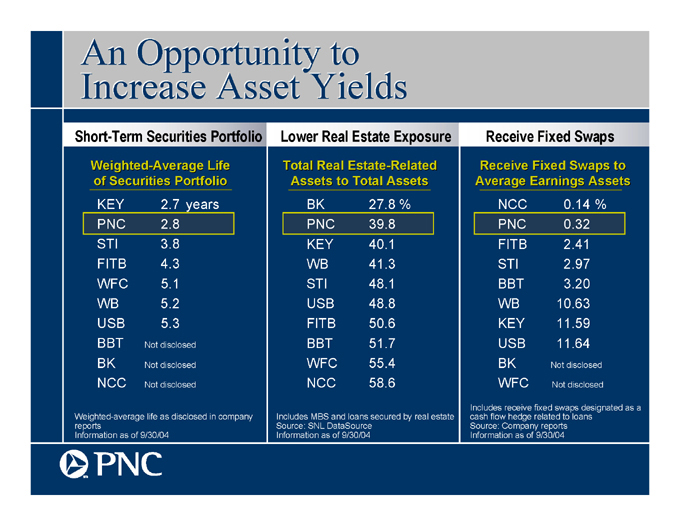
An Opportunity to
Increase Asset Yields
Short-Term Securities Portfolio
Lower Real Estate Exposure
Receive Fixed Swaps
Weighted-Average Life
of Securities Portfolio
Total Real Estate-Related
Assets to Total Assets
Receive Fixed Swaps to
Average Earnings Assets
NCC 0.14%
PNC 0.32
FITB 2.41
STI 2.97
BBT 3.20
WB 10.63
KEY 11.59
USB 11.64
BK Not disclosed
WFC Not disclosed
BK 27.8%
PNC 39.8
KEY 40.1
WB 41.3
STI 48.1
USB 48.8
FITB 50.6
BBT 51.7
WFC 55.4
NCC 58.6
KEY 2.7 years
PNC 2.8
STI 3.8
FITB 4.3
WFC 5.1
WB 5.2
USB 5.3
BBT Not disclosed
BK Not disclosed
NCC Not disclosed
Includes receive fixed swaps designated as a cash flow hedge related to loans
Source: Company reports
Information as of 9/30/04
Weighted-average life as disclosed in company reports
Information as of 9/30/04
Includes MBS and loans secured by real estate
Source: SNL DataSource
Information as of 9/30/04
PNC
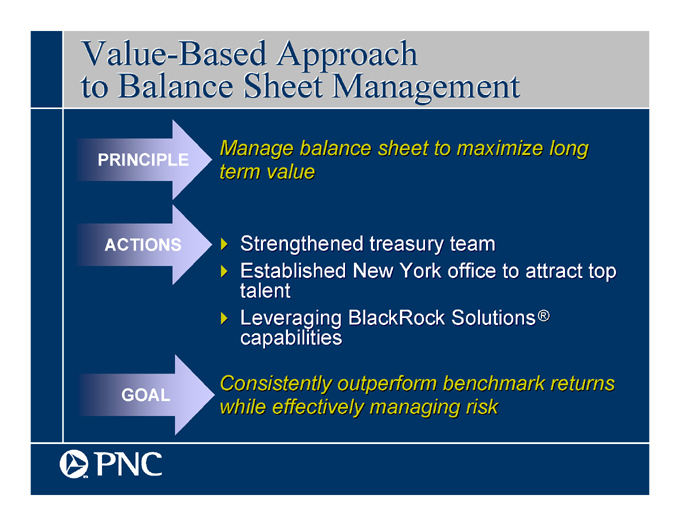
Value-Based Approach to Balance Sheet Management
PRINCIPLE
Manage balance sheet to maximize long term value
ACTIONS
Strengthened treasury team
Established New York office to attract top talent
Leveraging BlackRock Solutions® capabilities
GOAL
Consistently outperform benchmark returns while effectively managing risk
PNC
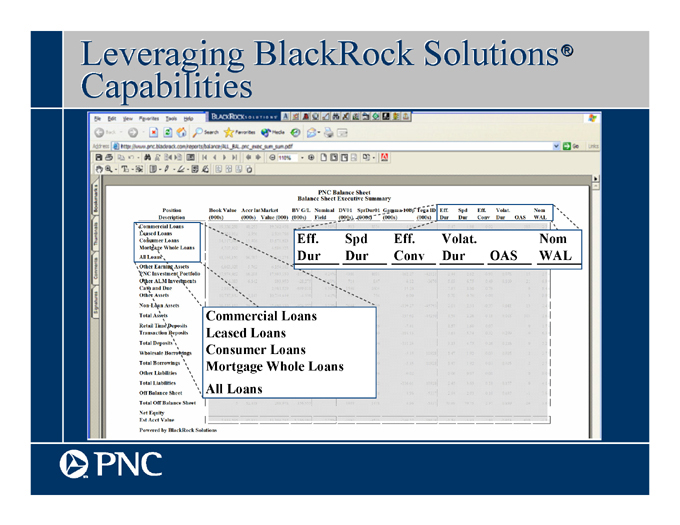
Leveraging BlackRock Solutions® Capabilities
PNC Balance Sheet
Balance Sheet Executive Summary
Position Description
Book Value (000s)
Accr Int Market (000s)
Value (000)
BV G/L (000s)
Nominal Field
DV01 (000s)
SprDur01 (000s)
Gamma 100p (000s)
Tega ID (000s)
Eff. Dur
Spd Dur
Eff. Conv
Volat. Dur
OAS
Nom WAL
Commercial Loans
Leased Loans
Consumer Loans
Mortgage Whole Loans
All Loans
Other Earning Assets
PNC Investment Portfolio
Other ALM Investments
Cash and Due
Other Assets
Non-Loan Assets
Total Assets
Retail Time Deposits
Trasanction Deposits
Total Deposits
Wholesale Borrowings
Total Borrowings
Other Liabilities
Total Liabilities
Off Balance Sheet
Total Off Balance Sheet
Net Equity
Est Acct Value
Powered by BlackRock Solutions
Commercial Loans
Leased Loans
Consumer Loans
Mortgage Whole Loans
All Loans
Eff. Dur
Spd Dur
Eff. Conv
Volat. Dur
OAS
Nom WAL
PNC
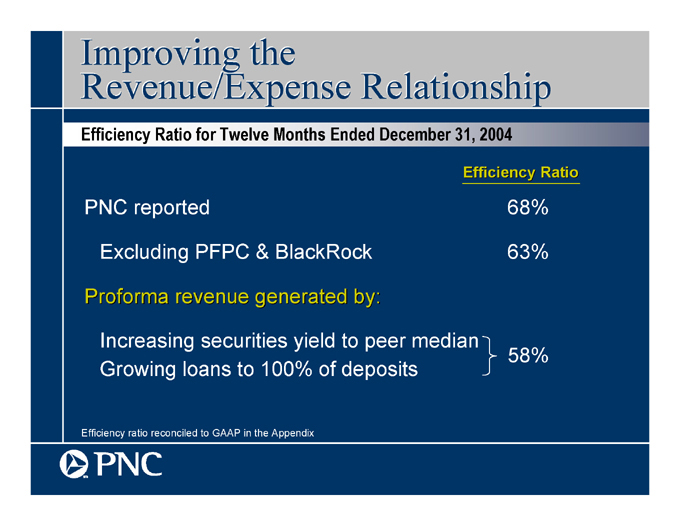
Improving the Revenue/Expense Relationship
Efficiency Ratio for Twelve Months Ended December 31, 2004
Efficiency Ratio
PNC reported 68%
Excluding PFPC & BlackRock 63%
Proforma revenue generated by:
Increasing securities yield to peer median
Growing loans to 100% of deposits
58%
Efficiency ratio reconciled to GAAP in the Appendix
PNC
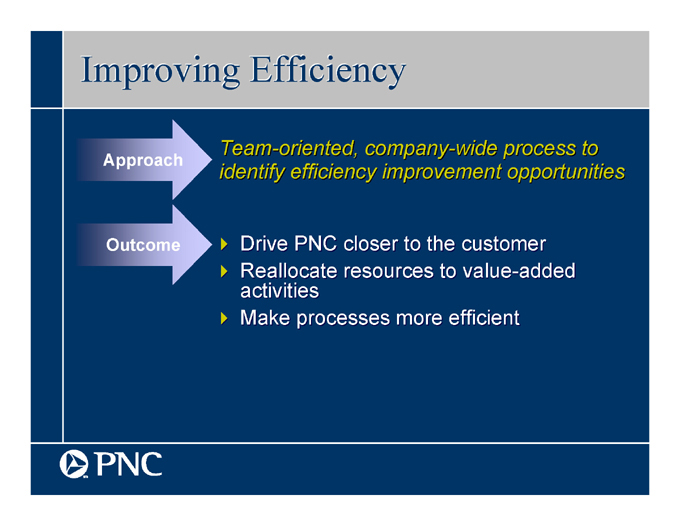
Improving Efficiency
Approach
Team-oriented, company-wide process to identify efficiency improvement opportunities
Outcome
Drive PNC closer to the customer
Reallocate resources to value-added activities
Make processes more efficient
PNC
Todays Discussion
2004 accomplishments
Current environment and our 2005 opportunities
Summary
PNC

PNC
Every day is an opportunity to do more.sm
Appendix
Cautionary Statement Regarding Forward-Looking Information
We make statements in this presentation, and we may from time to time make other statements, regarding our outlook or expectations for earnings, revenues, expenses, capital levels, asset quality or other future financial or business performance, strategies or expectations, or the impact of legal, regulatory or supervisory matters on our business operations or performance, that are forward-looking statements. Forward-looking statements are typically identified by words or phrases such as believe, feel, expect, anticipate, intend, outlook, estimate, forecast, project, position, target, assume, achievable, potential, strategy, goal, objective, plan, aspiration, outcome, continue, remain, maintain, seek, strive, trend, and variations of such words and similar expressions, or future or conditional verbs such as will, would, should, could, might, can, may or similar expressions.
Forward-looking statements are subject to numerous assumptions, risks and uncertainties, which change over time. Our forward-looking statements speak only as of the date they are made. We do not assume any duty and do not undertake to update our forward-looking statements. Actual results or future events could differ, possibly materially, from those that we anticipated in our forward-looking statements, and future results could differ materially from our historical performance.
The factors that we have previously disclosed in our SEC reports (accessible on our corporate website at www.pnc.com and on the SECs website at www.sec.gov) and the following risks & uncertainties, among others, could cause actual results or future events to differ materially from those that we anticipated in our forward-looking statements or from our historical performance:
(1) changes in political, economic or industry conditions, the interest rate environment or financial and capital markets (including as a result of actions of the Federal Reserve Board affecting interest rates or the money supply or otherwise reflecting changes in monetary policy), which could affect: (a) credit quality and the extent of our credit losses; (b) the extent of funding of our unfunded loan commitments and letters of credit; (c) our allowances for loan and lease losses and unfunded loan commitments and letters of credit; (d) demand for our credit or fee-based products and services; (e) our net interest income; (f) the value of assets under management and assets serviced, of private equity investments, of other debt and equity investments, of loans held for sale, or of other on-balance sheet or off-balance sheet assets or liabilities; or (g) the availability and terms of funding necessary to meet our liquidity needs;
(2) the impact on us of legal and regulatory developments (including the following: (a) the resolution of legal proceedings or regulatory and other governmental inquiries; (b) increased litigation risk from recent regulatory and other governmental developments; (c) the results of the regulatory examination process, our failure to satisfy the requirements of agreements with governmental agencies, and regulators future use of supervisory and enforcement tools; (d) legislative and regulatory reforms, including changes to tax laws; and (e) changes in accounting policies and principles), with the impact of any such developments possibly affecting our ability to operate our businesses or our financial condition or results of operations or our reputation, which in turn could have an impact on such matters as business generation and retention, our ability to attract and retain management, liquidity and funding;
(3) the impact on us of changes in the nature or extent of our competition;
(4) the introduction, withdrawal, success and timing of our business initiatives and strategies;
(5) customer acceptance of our products and services, and our customers borrowing, repayment, investment and deposit practices;
(6) the impact on us of changes in the extent of customer or counterparty delinquencies, bankruptcies or defaults, which could affect, among other things, credit and asset quality risk and our provision for credit losses;
(7) the ability to identify and effectively manage risks inherent in our business;
PNC
Cautionary Statement Regarding
Forward-Looking Information (continued)
(8) how we choose to redeploy available capital, including the extent and timing of any share repurchases and acquisitions or other investments in our businesses;
(9) the impact, extent and timing of technological changes, the adequacy of intellectual property protection, and costs associated with obtaining rights in intellectual property claimed by others;
(10) the timing and pricing of any sales of loans or other financial assets held for sale;
(11) our ability to obtain desirable levels of insurance, and whether or not insurance coverage for claims by PNC is denied;
(12) the relative and absolute investment performance of assets under management; and
(13) the extent of terrorist activities and international hostilities, increases or continuations of which may adversely affect the economy and financial and capital markets generally or us specifically.
In addition, our forward-looking statements are also subject to risks and uncertainties related to our pending acquisition of Riggs National Corporation and the expected consequences of the integration of the remaining Riggs businesses at closing into PNC, including the following: (a) completion of the transaction is dependent on, among other things, receipt of stockholder and regulatory approvals, and we cannot at this point predict with precision when those approvals may be obtained or if they will be received at all; (b) successful completion of the transaction and our ability to realize the benefits that we anticipate from the acquisition also depend on the nature of any future developments with respect to Riggs regulatory issues, the ability to comply with the terms of all current or future regulatory requirements (including any related action plan) resulting from these issues, and the extent of future costs and expenses arising as a result of these issues, including the impact of increased litigation risk and any claims for indemnification or advancement of costs; (c) the transaction may be materially more expensive to complete than we anticipate as a result of unexpected factors or events; (d) the integration into PNC of the Riggs business and operations that we acquire, which will include conversion of Riggs different systems and procedures, may take longer than we anticipate, may be more costly than we anticipate, or may have unanticipated adverse results relating to Riggs or PNCs existing businesses; (e) it may take longer that we expect to realize the anticipated cost savings of the acquisition, and those anticipated cost savings may not be achieved or may not be achieved in their entirety; and (f) the anticipated strategic and other benefits of the acquisition to us are dependent in part on the future performance of Riggs business, and there can be no assurance as to actual future results, which could be impacted by various factors, including the risks and uncertainties generally related to the performance of PNCs and Riggs businesses (with respect to Riggs, see Riggs SEC reports, which are accessible on the SECs website at www.sec.gov) or due to factors related to the acquisition of Riggs and the process of integrating Riggs business at closing into ours.
Other mergers, acquisitions, restructurings, divestitures, business alliances or similar transactions, including our completed acquisitions of United National Bancorp and the loan origination business of Aviation Finance Group, LLC, and our pending acquisition of SSRM Holdings, Inc., will also be subject to similar risks and uncertainties related to our ability to realize expected cost savings or revenue enhancements or to implement integration and strategic plans and, in the case of SSRM Holdings Inc., related to our successful completion of the transaction.
In addition, risks and uncertainties that could affect the results anticipated in forward-looking statements or from historical performance that involve BlackRock are discussed in more detail and additional factors are identified in BlackRocks SEC reports, accessible on the SECs website or on BlackRocks website at www.blackrock.com.
Any annualized, proforma, estimated, third party or consensus numbers in this presentation are used for illustrative or comparative purposes only and may not reflect actual results. Any consensus earnings estimates are calculated based on the earnings projections made by analysts who cover that company. The analysts opinions, estimates or forecasts (and therefore the consensus earnings estimates) are theirs alone, are not those of PNC or its management, and may not reflect PNCs actual or anticipated results.
PNC
Additional Information About the Proposed
Riggs National Corporation Acquisition
The PNC Financial Services Group, Inc. and Riggs National Corporation have filed a proxy statement/prospectus and will file other relevant documents concerning the merger with the United States Securities and Exchange Commission (the SEC). WE URGE INVESTORS TO READ THE PROXY STATEMENT/PROSPECTUS AND ANY OTHER DOCUMENTS TO BE FILED WITH THE SEC IN CONNECTION WITH THE MERGER OR INCORPORATED BY REFERENCE IN THE PROXY STATEMENT/PROSPECTUS, BECAUSE THEY WILL CONTAIN IMPORTANT INFORMATION. Investors will be able to obtain these documents free of charge at the SECs web site (www.sec.gov). In addition, documents filed with the SEC by The PNC Financial Services Group, Inc. will be available free of charge from Shareholder Relations at (800) 843-2206. Documents filed with the SEC by Riggs will be available free of charge from www.riggsbank.com.
The directors, executive officers, and certain other members of management of Riggs may be soliciting proxies in favor of the merger from its shareholders. For information about these directors, executive officers, and members of management, shareholders are asked to refer to Riggss most recent annual meeting proxy statement, which is available at the web addresses provided in the preceding paragraph.
PNC
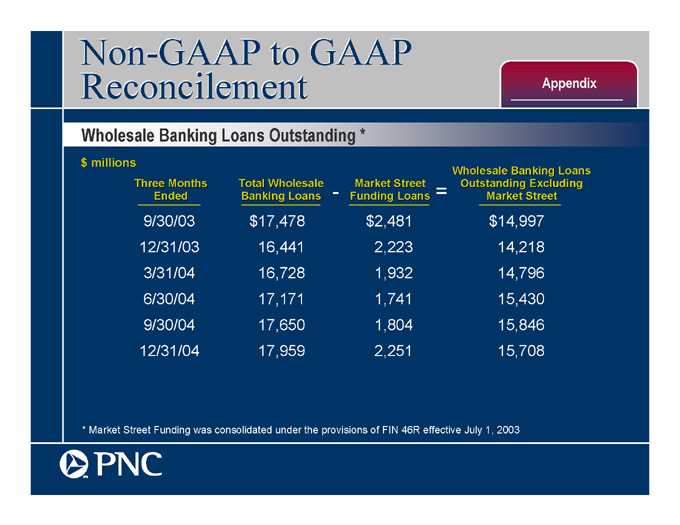
Non-GAAP to GAAP Reconcilement
Appendix
Wholesale Banking Loans Outstanding *
$ millions
Wholesale Banking Loans
Outstanding Excluding
Market Street
Market Street Funding Loans
Total Wholesale
Banking Loans
=
-
9/30/03 $17,478 $2,481 $14,997
12/31/03 16,441 2,223 14,218
3/31/04 16,728 1,932 14,796
6/30/04 17,171 1,741 15,430
9/30/04 17,650 1,804 15,846
12/31/04 17,959 2,251 15,708
Three Months
Ended
* Market Street Funding was consolidated under the provisions of FIN 46R effective July 1, 2003
PNC

Non-GAAP to GAAP
Reconcilement
Appendix
Efficiency Ratio
Twelve Months Ended 12/31/04
$ millions
Efficiency
Ratio
Total
Revenue
Noninterest
Expense
PNC, GAAP basis $5,532 $3,735 68%
Less: BlackRock (761) (559)
PFPC (763) (646)
PNC excluding BlackRock and PFPC $4,008 $2,530 63%
Proforma increase of securities yield to
peer median (from 3.61% in FY04 to 4.22%) 97
Proforma increase of loan to deposit
ratio to 100% (from 82% at 12/31/04 to 100%) 225
PNC with adjusted securities yield and
loan to deposit ratio $4,330 $2,530 58%
Efficiency ratio calculated as noninterest expense divided by the sum of net interest income and noninterest income
PNC
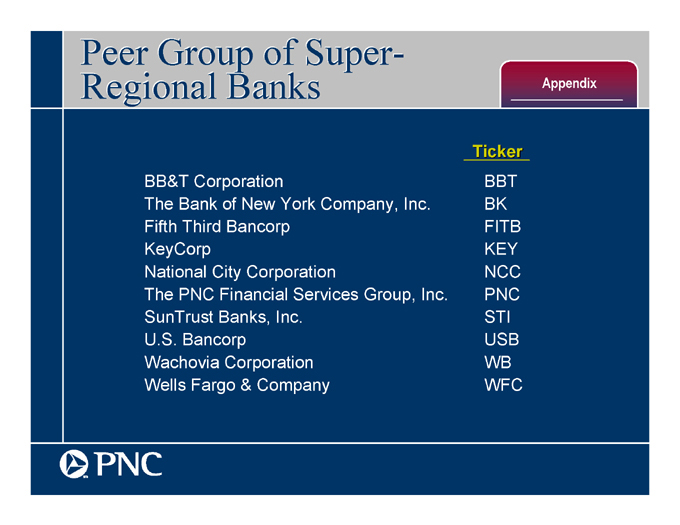
Peer Group of Super-Regional Banks
Appendix
Ticker
BB&T Corporation BBT
The Bank of New York Company, Inc. BK
Fifth Third Bancorp FITB
KeyCorp KEY
National City Corporation NCC
The PNC Financial Services Group, Inc. PNC
SunTrust Banks, Inc. STI
U.S. Bancorp USB
Wachovia Corporation WB
Wells Fargo & Company WFC
PNC