EX-99.1
Published on November 7, 2025
BancAnalysts Association of Boston Conference November 7, 2025 Exhibit 99.1
1 Cautionary Statement Regarding Forward-Looking and non-GAAP Financial Information This presentation is not intended as a full business or financial review and should be viewed in the context of all of the information made available by PNC in its SEC filings and on our corporate website. The presentation contains forward-looking statements regarding our outlook for financial performance, such as earnings, revenues, expenses, tax rates, capital and liquidity levels and ratios, asset levels, asset quality, financial position, and other matters regarding or affecting PNC and its future business and operations, including our sustainability strategy. Forward-looking statements are necessarily subject to numerous assumptions, risks and uncertainties, which change over time. The forward-looking statements in this presentation are qualified by the factors affecting forward- looking statements identified in the more detailed Cautionary Statement included in the Appendix. We provide greater detail regarding these as well as other factors in our most recent Form 10-K, any subsequent Form 10-Qs, and in our other subsequent SEC filings. Our forward-looking statements may also be subject to risks and uncertainties including those we may discuss in this presentation or in our SEC filings. Future events or circumstances may change our outlook and may also affect the nature of the assumptions, risks and uncertainties to which our forward-looking statements are subject. Forward-looking statements in this presentation speak only as of the date of this presentation. We do not assume any duty and do not undertake any obligation to update those statements. Actual results or future events could differ, possibly materially, from those anticipated in forward-looking statements, as well as from historical performance. As a result, we caution against placing undue reliance on any forward-looking statements. We include non-GAAP financial information in this presentation. Reconciliations for such financial information may be found in our presentation, in these slides, including the Appendix, in other materials on our corporate website, and in our SEC filings. This information supplements our results as reported in accordance with GAAP and should not be viewed in isolation from, or as a substitute for, our GAAP results. We believe that this information and the related reconciliations may be useful to investors, analysts, regulators and others to help understand and evaluate our financial results, and with respect to adjusted metrics, because we believe they better reflect the ongoing financial results and trends of our businesses and increase comparability of period-to-period results. We may also use annualized, pro forma, estimated or third party numbers for illustrative or comparative purposes only. These may not reflect actual results. References to our corporate website are to www.pnc.com under “About - Investor Relations.” Our SEC filings are available both on our corporate website and on the SEC’s website at www.sec.gov. We include web addresses here as inactive textual references only. Information on these websites is not part of this presentation.
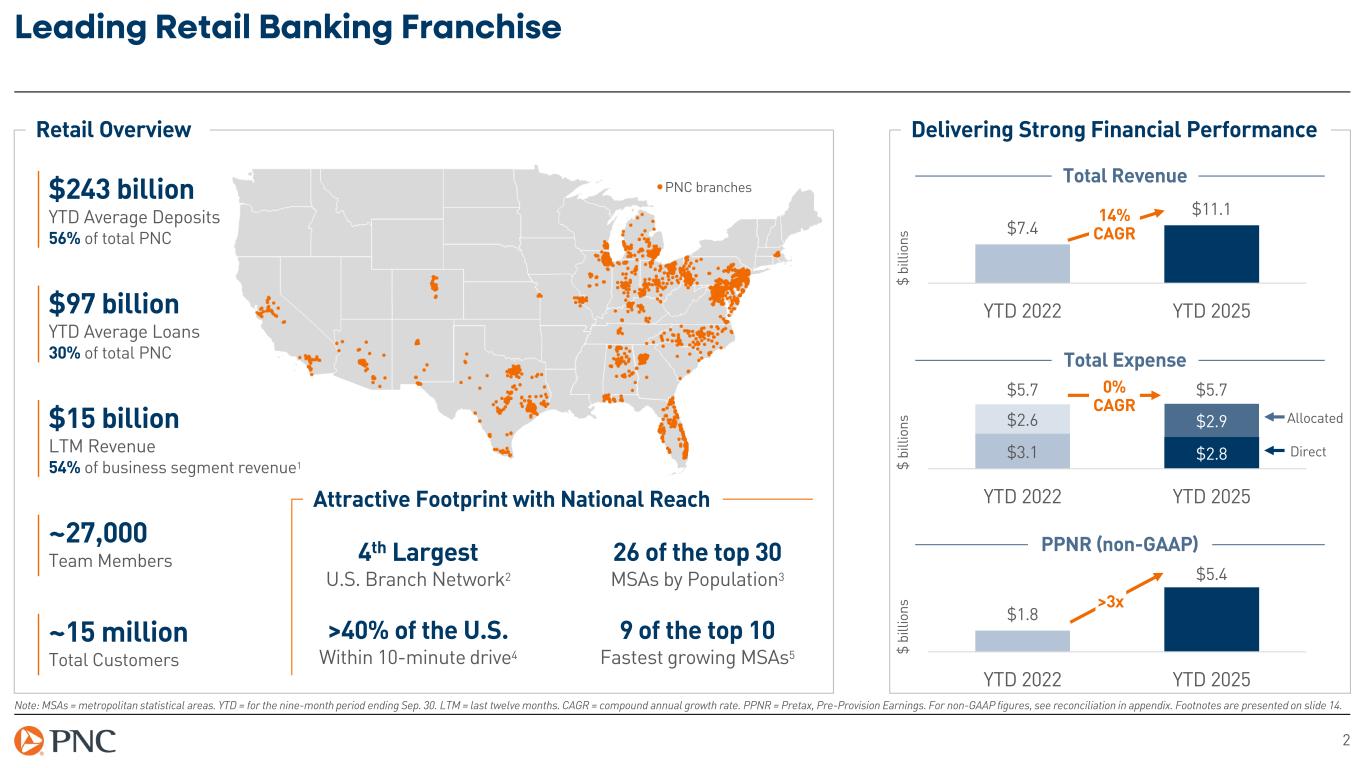
2 Leading Retail Banking Franchise Note: MSAs = metropolitan statistical areas. YTD = for the nine-month period ending Sep. 30. LTM = last twelve months. CAGR = compound annual growth rate. PPNR = Pretax, Pre-Provision Earnings. For non-GAAP figures, see reconciliation in appendix. Footnotes are presented on slide 14. Retail Overview $243 billion YTD Average Deposits 56% of total PNC $97 billion YTD Average Loans 30% of total PNC $15 billion LTM Revenue 54% of business segment revenue1 ~27,000 Team Members ~15 million Total Customers Attractive Footprint with National Reach 4th Largest U.S. Branch Network2 26 of the top 30 MSAs by Population3 9 of the top 10 Fastest growing MSAs5 >40% of the U.S. Within 10-minute drive4 Delivering Strong Financial Performance Total Revenue $7.4 $11.1 YTD 2022 YTD 2025 Total Expense $3.1 $2.8 $2.6 $2.9 $5.7 $5.7 YTD 2022 YTD 2025 PPNR (non-GAAP) $1.8 $5.4 YTD 2022 YTD 2025 $ bi lli on s $ bi lli on s $ bi lli on s 14% CAGR 0% CAGR >3x Direct Allocated PNC branches
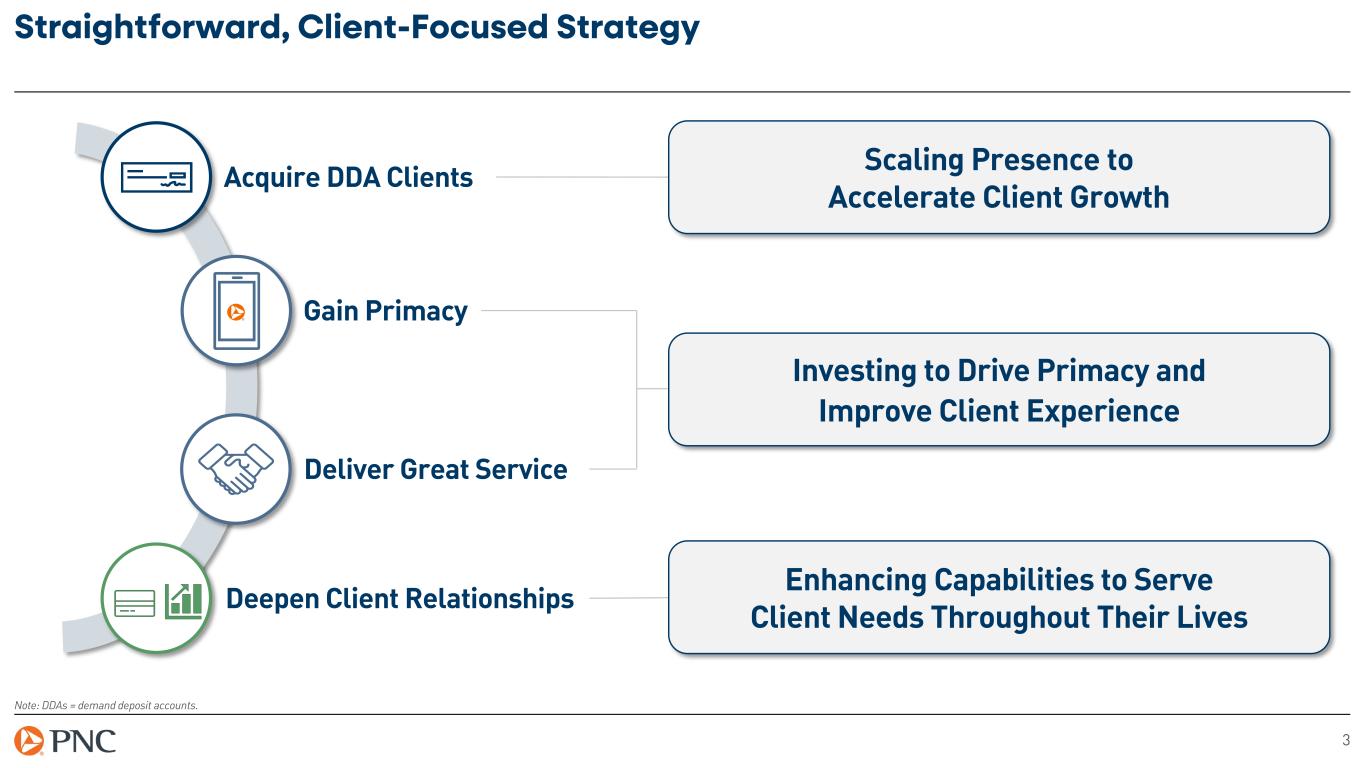
3 Straightforward, Client-Focused Strategy Note: DDAs = demand deposit accounts. Acquire DDA Clients Gain Primacy Deliver Great Service Deepen Client Relationships Scaling Presence to Accelerate Client Growth Investing to Drive Primacy and Improve Client Experience Enhancing Capabilities to Serve Client Needs Throughout Their Lives
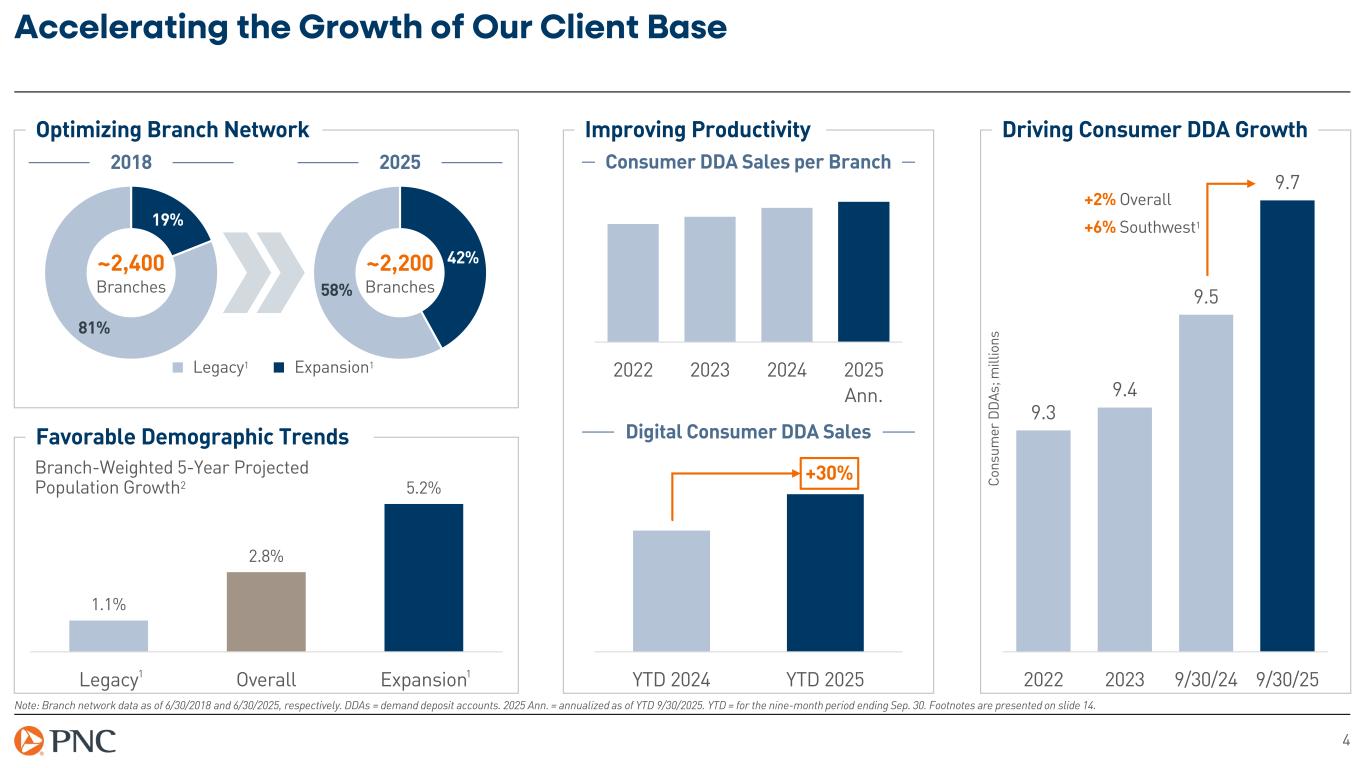
9.3 9.4 9.5 9.7 2022 2023 9/30/24 9/30/25 1.1% 2.8% 5.2% Legacy Overall Expansion 4 Accelerating the Growth of Our Client Base Note: Branch network data as of 6/30/2018 and 6/30/2025, respectively. DDAs = demand deposit accounts. 2025 Ann. = annualized as of YTD 9/30/2025. YTD = for the nine-month period ending Sep. 30. Footnotes are presented on slide 14. Optimizing Branch Network Favorable Demographic Trends Branch-Weighted 5-Year Projected Population Growth2 Legacy1 Expansion1 ~2,400 Branches 19% 81% 42% 58% ~2,200 Branches 2018 2025 Improving Productivity Consumer DDA Sales per Branch Digital Consumer DDA Sales YTD 2024 YTD 2025 +30% Driving Consumer DDA Growth +6% Southwest1 +2% Overall C on su m er D D As ; m ill io ns 1 1 2022 2023 2024 2025 Ann.
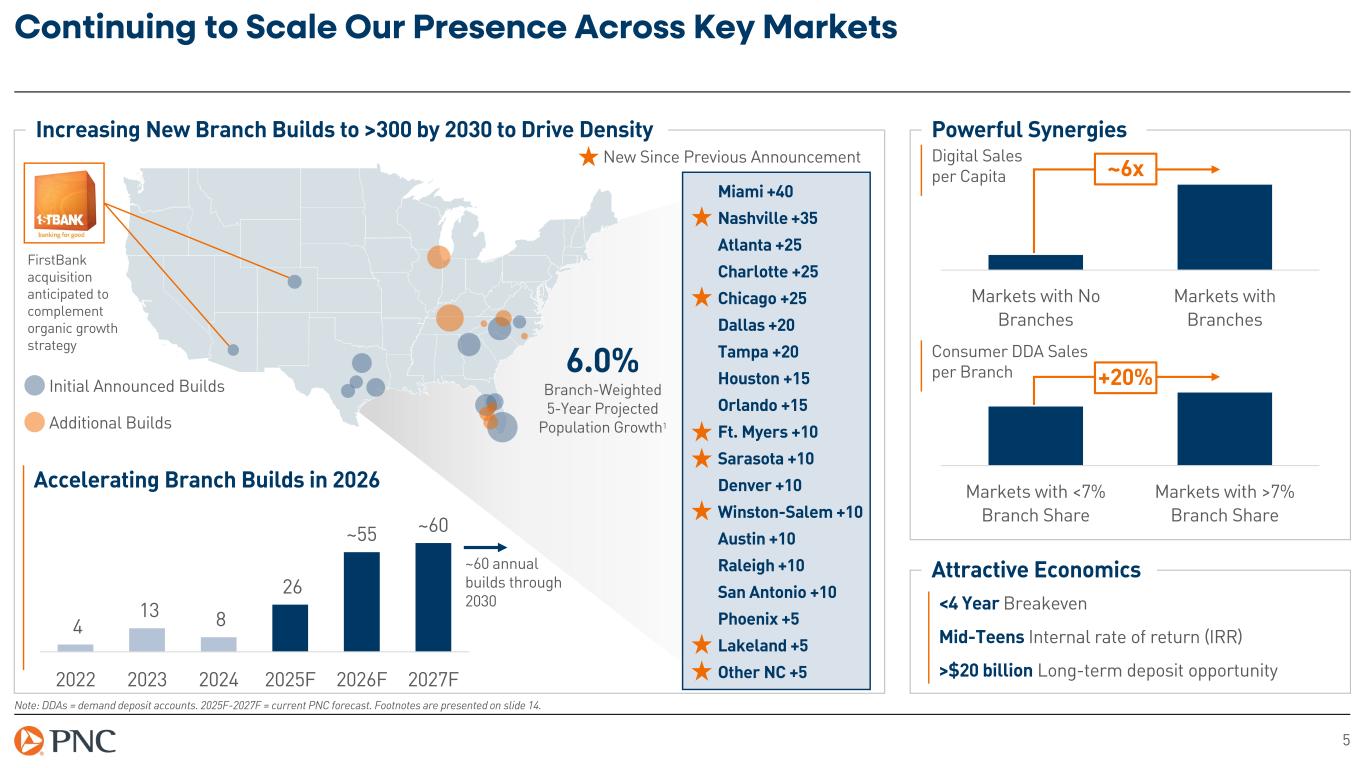
5 Continuing to Scale Our Presence Across Key Markets Note: DDAs = demand deposit accounts. 2025F-2027F = current PNC forecast. Footnotes are presented on slide 14. Powerful SynergiesIncreasing New Branch Builds to >300 by 2030 to Drive Density New Since Previous Announcement Miami +40 Atlanta +25 Charlotte +25 Denver +10 Dallas +20 Tampa +20 Houston +15 San Antonio +10 Orlando +15 Austin +10 Raleigh +10 Phoenix +5 Nashville +35 Chicago +25 Sarasota +10 Winston-Salem +10 Lakeland +5 Other NC +5 Accelerating Branch Builds in 2026 4 13 8 26 ~55 ~60 2022 2023 2024 2025F 2026F 2027F ~60 annual builds through 2030 FirstBank acquisition anticipated to complement organic growth strategy 6.0% Branch-Weighted 5-Year Projected Population Growth1 Markets with No Branches Markets with Branches Digital Sales per Capita ~6x Markets with <7% Branch Share Markets with >7% Branch Share Consumer DDA Sales per Branch +20% Attractive Economics <4 Year Breakeven Mid-Teens Internal rate of return (IRR) >$20 billion Long-term deposit opportunity Initial Announced Builds Additional Builds Ft. Myers +10
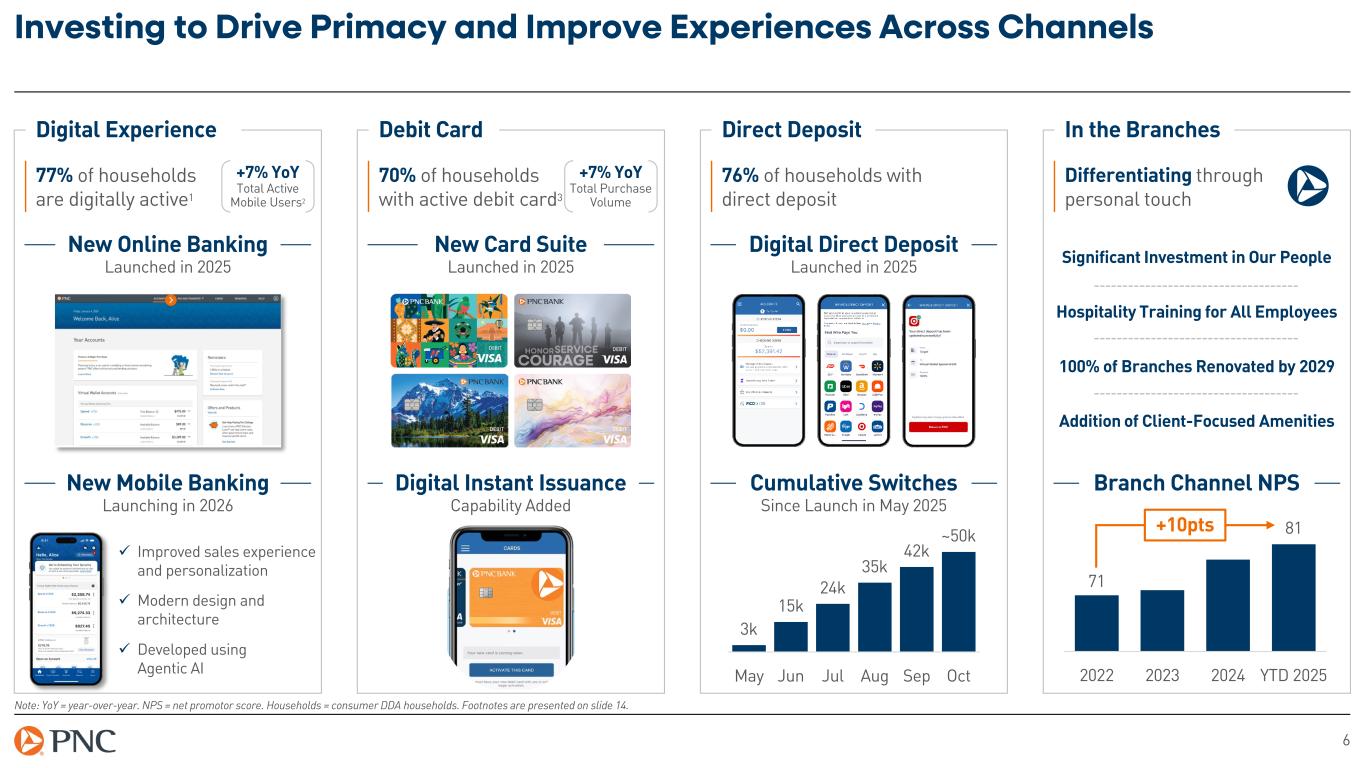
6 Investing to Drive Primacy and Improve Experiences Across Channels Note: YoY = year-over-year. NPS = net promotor score. Households = consumer DDA households. Footnotes are presented on slide 14. Digital Experience Debit Card Direct Deposit In the Branches 77% of households are digitally active1 70% of households with active debit card3 76% of households with direct deposit Differentiating through personal touch New Card Suite Launched in 2025 Digital Direct Deposit Launched in 2025 New Online Banking Launched in 2025 Digital Instant Issuance Capability Added Cumulative Switches Since Launch in May 2025 New Mobile Banking Launching in 2026 Improved sales experience and personalization Modern design and architecture Developed using Agentic AI Branch Channel NPS 3k 15k 24k 35k 42k ~50k May Jun Jul Aug Sep Oct 71 81 2022 2023 2024 YTD 2025 +10pts +7% YoY Total Active Mobile Users2 +7% YoY Total Purchase Volume Significant Investment in Our People Hospitality Training for All Employees 100% of Branches Renovated by 2029 Addition of Client-Focused Amenities
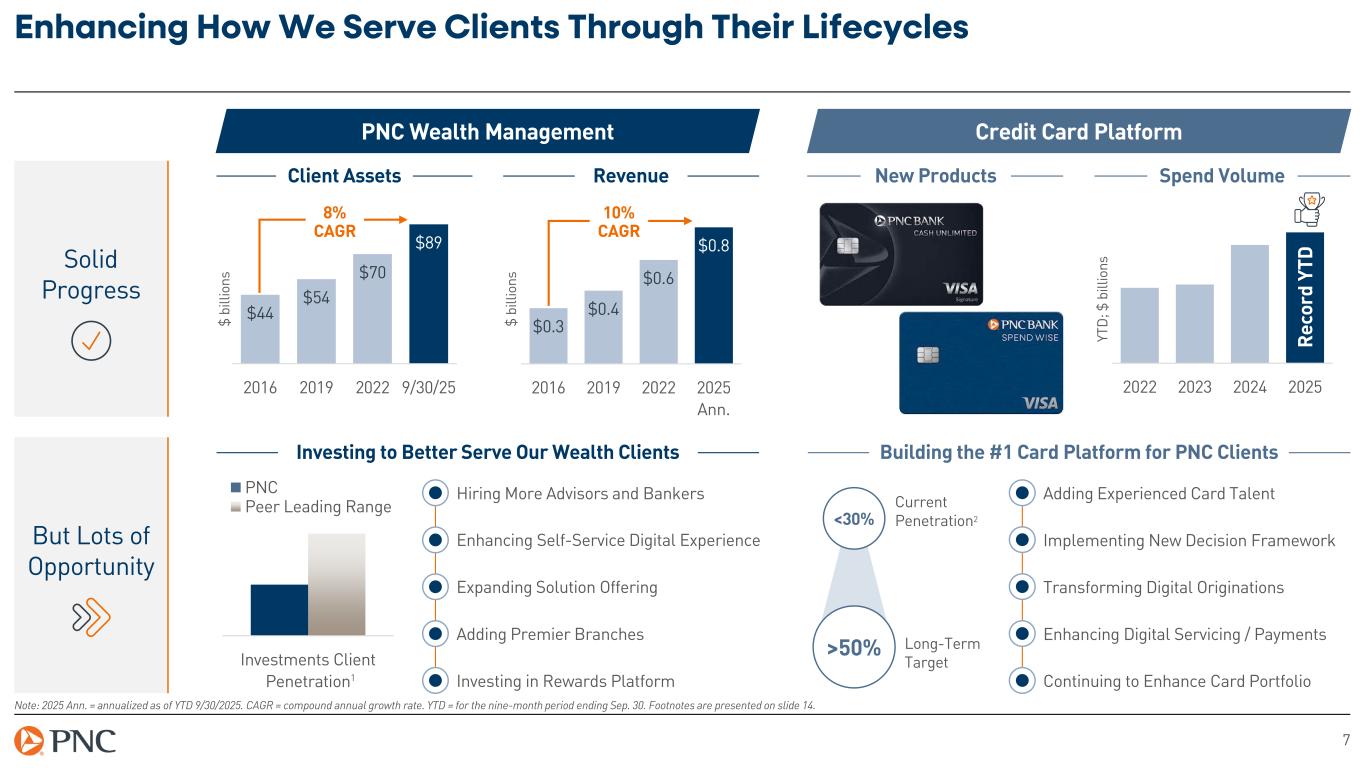
7 Enhancing How We Serve Clients Through Their Lifecycles Note: 2025 Ann. = annualized as of YTD 9/30/2025. CAGR = compound annual growth rate. YTD = for the nine-month period ending Sep. 30. Footnotes are presented on slide 14. PNC Wealth Management Credit Card Platform Solid Progress But Lots of Opportunity Client Assets $44 $54 $70 $89 2016 2019 2022 9/30/25 8% CAGR $ bi lli on s Revenue $0.3 $0.4 $0.6 $0.8 2016 2019 2022 2025 Ann. 10% CAGR $ bi lli on s New Products Spend Volume 2022 2023 2024 2025 R ec or d YT D Investing to Better Serve Our Wealth Clients Building the #1 Card Platform for PNC Clients Investments Client Penetration PNC Peer Leading Range Hiring More Advisors and Bankers Investing in Rewards Platform Adding Premier Branches Expanding Solution Offering Enhancing Self-Service Digital Experience Adding Experienced Card Talent Continuing to Enhance Card Portfolio Enhancing Digital Servicing / Payments Transforming Digital Originations Implementing New Decision Framework <30% Current Penetration2 >50% Long-Term Target YT D ; $ b ill io ns 1
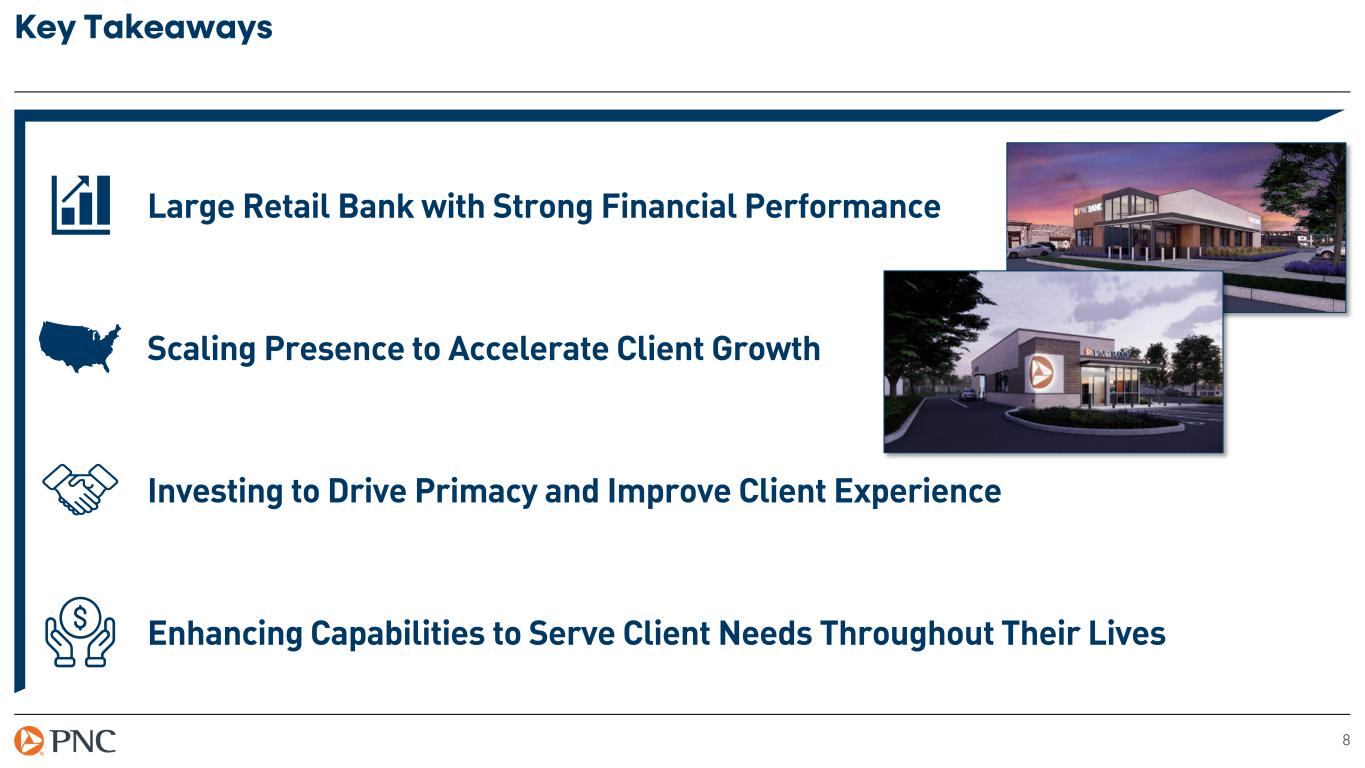
8 Key Takeaways Large Retail Bank with Strong Financial Performance Scaling Presence to Accelerate Client Growth Investing to Drive Primacy and Improve Client Experience Enhancing Capabilities to Serve Client Needs Throughout Their Lives
9 Appendix: Cautionary Statement Regarding Forward-Looking Information We make statements in this presentation, and we may from time to time make other statements, regarding our outlook for financial performance, such as earnings, revenues, expenses, tax rates, capital and liquidity levels and ratios, asset levels, asset quality, financial position, and other matters regarding or affecting us and our future business and operations, including our sustainability strategy, that are forward-looking statements within the meaning of the Private Securities Litigation Reform Act. Forward-looking statements are typically identified by words such as “believe,” “plan,” “expect,” “anticipate,” “see,” “look,” “intend,” “outlook,” “project,” “forecast,” “estimate,” “goal,” “will,” “should” and other similar words and expressions. Forward-looking statements are necessarily subject to numerous assumptions, risks and uncertainties, which change over time. Future events or circumstances may change our outlook and may also affect the nature of the assumptions, risks and uncertainties to which our forward-looking statements are subject. Forward-looking statements speak only as of the date made. We do not assume any duty and do not undertake any obligation to update forward-looking statements. Actual results or future events could differ, possibly materially, from those anticipated in forward-looking statements, as well as from historical performance. As a result, we caution against placing undue reliance on any forward-looking statements. Our forward-looking statements are subject to the following principal risks and uncertainties. Our businesses, financial results and balance sheet values are affected by business and economic conditions, including: − Changes in interest rates and valuations in debt, equity and other financial markets, − Disruptions in the U.S. and global financial markets, − Actions by the Federal Reserve Board, U.S. Treasury and other government agencies, including those that impact money supply, market interest rates and inflation, − Changes in customer behavior due to changing business and economic conditions or legislative or regulatory initiatives, − Changes in customers', suppliers' and other counterparties' performance and creditworthiness, − Impacts of sanctions, tariffs and other trade policies of the U.S. and its global trading partners, − Impacts of changes in federal, state and local governmental policy, including on the regulatory landscape, capital markets, taxes, infrastructure spending and social programs, − Our ability to attract, recruit and retain skilled employees, and − Commodity price volatility.
10 Appendix: Cautionary Statement Regarding Forward-Looking Information Our forward-looking financial statements are subject to the risk that economic and financial market conditions will be substantially different than those we are currently expecting. These statements are based on our views that: − PNC’s baseline forecast remains for continued expansion, but slower economic growth in 2025 and 2026 than in 2024. The government shutdown will weaken growth, but the economy should regain that growth once the shutdown ends. Tariffs are a drag on consumer spending and business investment, while AI-related capex and wealth effects have been key supports to growth. Consumer spending growth is slowing to a pace more consistent with household income growth, and government’s contribution to economic growth will be smaller. − The baseline forecast anticipates real GDP growth slowing to below 2% in both 2025 and 2026, accompanied by a modest increase in the unemployment rate, which is expected to peak above 4.5% in mid-2026. Tariffs remain a risk to the outlook, and a reversal in sentiment around AI would be a drag. Additionally, a prolonged government shutdown has emerged as a downside risk. − The baseline forecast is for two consecutive federal funds rate cuts of 25 basis points each at the next two FOMC meetings, ending in late-January 2026 and resulting in a federal funds rate in the range of 3.25% to 3.50%. However, there are two-sided risks to this outlook: (1) if inflation re-accelerates or proves more persistent than expected, the Federal Reserve may cut less or (2) if growth falters or recession emerges, easing could be deeper and more prolonged. PNC's ability to take certain capital actions, including returning capital to shareholders, is subject to PNC meeting or exceeding minimum capital levels, including a stress capital buffer established by the Federal Reserve Board in connection with the Federal Reserve Board's Comprehensive Capital Analysis and Review (CCAR) process. PNC's regulatory capital ratios in the future will depend on, among other things, PNC's financial performance, the scope and terms of final capital regulations then in effect and management actions affecting the composition of PNC's balance sheet. In addition, PNC's ability to determine, evaluate and forecast regulatory capital ratios, and to take actions (such as capital distributions) based on actual or forecasted capital ratios, will be dependent at least in part on the development, validation and regulatory review of related models and the reliability of and risks resulting from extensive use of such models. Legal and regulatory developments could have an impact on our ability to operate our businesses, financial condition, results of operations, competitive position, reputation, or pursuit of attractive acquisition opportunities. Reputational impacts could affect matters such as business generation and retention, liquidity, funding, and ability to attract and retain employees. These developments could include: − Changes to laws and regulations, including changes affecting oversight of the financial services industry, changes in the enforcement and interpretation of such laws and regulations, and changes in accounting and reporting standards. − Unfavorable resolution of legal proceedings or other claims and regulatory and other governmental investigations or other inquiries resulting in monetary losses, costs, or alterations in our business practices, and potentially causing reputational harm to PNC. − Results of the regulatory examination and supervision process, including our failure to satisfy requirements of agreements with governmental agencies. − Costs associated with obtaining rights in intellectual property claimed by others and of adequacy of our intellectual property protection in general.
11 Appendix: Cautionary Statement Regarding Forward-Looking Information Business and operating results are affected by our ability to identify and effectively manage risks inherent in our businesses, including, where appropriate, through effective use of systems and controls, third-party insurance, derivatives, and capital management techniques, and to meet evolving regulatory capital and liquidity standards. Our reputation and business and operating results may be affected by our ability to appropriately meet or address environmental, social or governance targets, goals, commitments or concerns that may arise. We grow our business in part through acquisitions and new strategic initiatives. Risks and uncertainties include those presented by the nature of the business acquired and strategic initiative, including in some cases those associated with our entry into new businesses or new geographic or other markets and risks resulting from our inexperience in those new areas, as well as risks and uncertainties related to the acquisition transactions themselves, regulatory issues, the integration of the acquired businesses into PNC after closing or any failure to execute strategic or operational plans. Competition can have an impact on customer acquisition, growth and retention and on credit spreads and product pricing, which can affect market share, deposits and revenues. Our ability to anticipate and respond to technological changes can also impact our ability to respond to customer needs and meet competitive demands. Business and operating results can also be affected by widespread manmade, natural and other disasters (including severe weather events), health emergencies, dislocations, geopolitical instabilities or events, terrorist activities, system failures or disruptions, security breaches, cyberattacks, international hostilities, or other extraordinary events beyond PNC's control through impacts on the economy and financial markets generally or on us or our counterparties, customers or third-party vendors and service providers specifically. We provide greater detail regarding these as well as other factors in our most recent Form 10-K and in any subsequent Form 10-Qs, including in the Risk Factors and Risk Management sections and the Legal Proceedings and Commitments Notes of the Notes to Consolidated Financial Statements in those reports, and in our other subsequent SEC filings. Our forward-looking statements may also be subject to other risks and uncertainties, including those we may discuss elsewhere in this news release or in our SEC filings, accessible on the SEC's website at www.sec.gov and on our corporate website at www.pnc.com/secfilings. We have included these web addresses as inactive textual references only. Information on these websites is not part of this document.
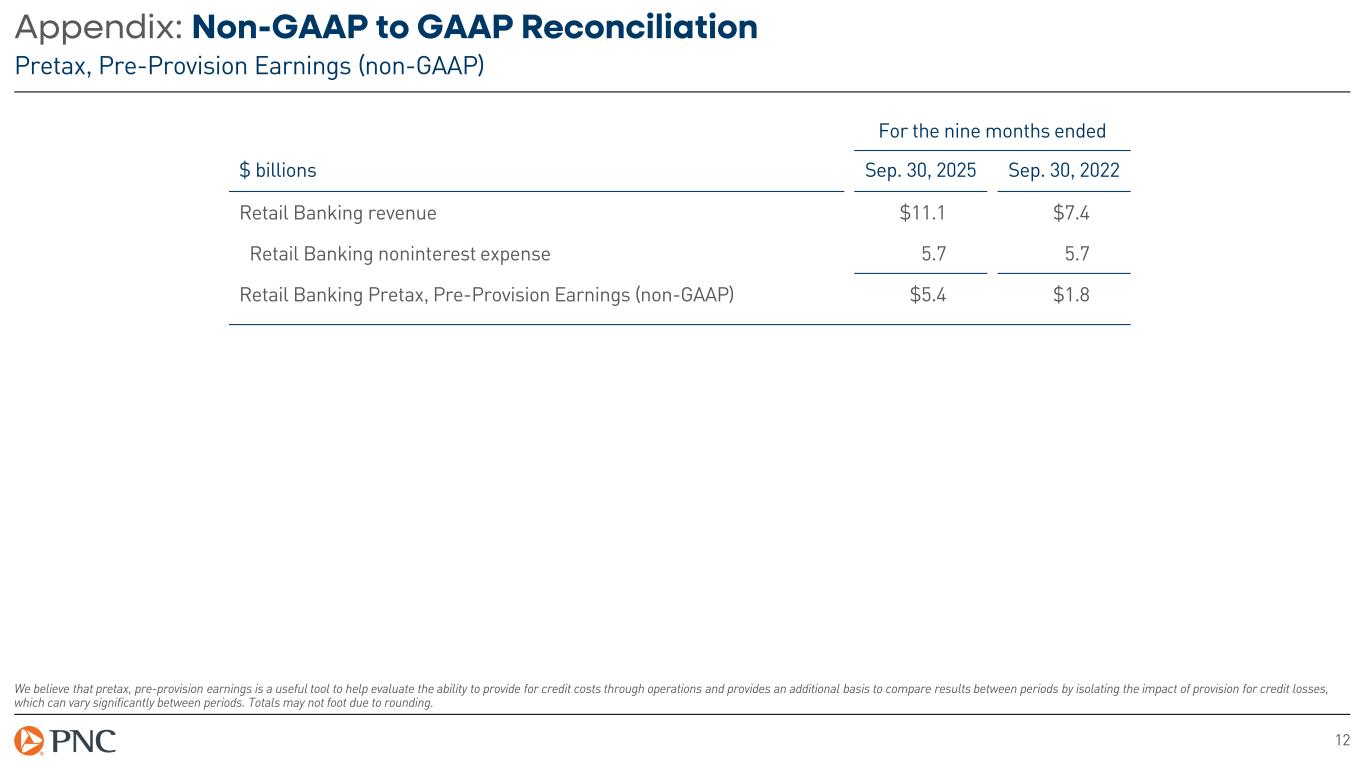
12 Appendix: Non-GAAP to GAAP Reconciliation Pretax, Pre-Provision Earnings (non-GAAP) For the nine months ended $ billions Sep. 30, 2025 Sep. 30, 2022 Retail Banking revenue $11.1 $7.4 Retail Banking noninterest expense 5.7 5.7 Retail Banking Pretax, Pre-Provision Earnings (non-GAAP) $5.4 $1.8 We believe that pretax, pre-provision earnings is a useful tool to help evaluate the ability to provide for credit costs through operations and provides an additional basis to compare results between periods by isolating the impact of provision for credit losses, which can vary significantly between periods. Totals may not foot due to rounding.
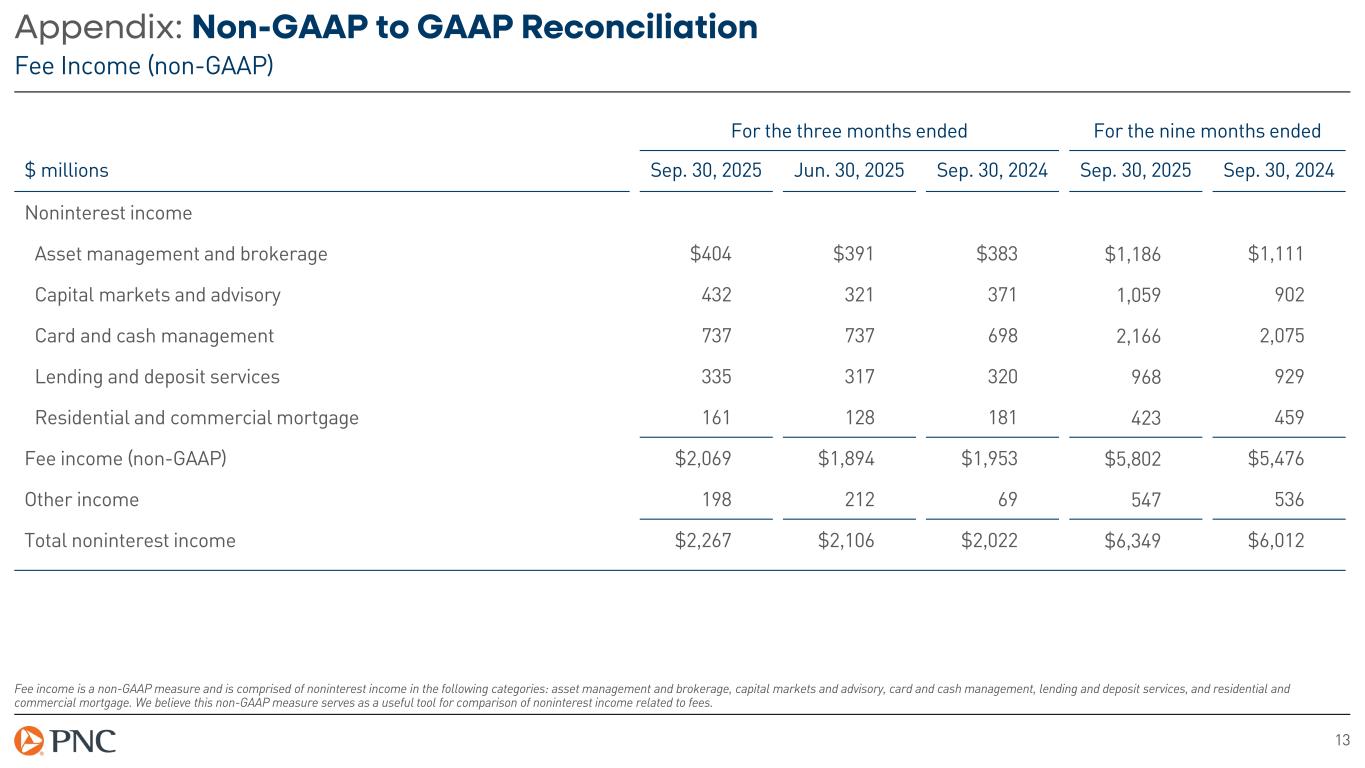
13 Appendix: Non-GAAP to GAAP Reconciliation Fee Income (non-GAAP) For the three months ended For the nine months ended $ millions Sep. 30, 2025 Jun. 30, 2025 Sep. 30, 2024 Sep. 30, 2025 Sep. 30, 2024 Noninterest income Asset management and brokerage $404 $391 $383 $1,186 $1,111 Capital markets and advisory 432 321 371 1,059 902 Card and cash management 737 737 698 2,166 2,075 Lending and deposit services 335 317 320 968 929 Residential and commercial mortgage 161 128 181 423 459 Fee income (non-GAAP) $2,069 $1,894 $1,953 $5,802 $5,476 Other income 198 212 69 547 536 Total noninterest income $2,267 $2,106 $2,022 $6,349 $6,012 Fee income is a non-GAAP measure and is comprised of noninterest income in the following categories: asset management and brokerage, capital markets and advisory, card and cash management, lending and deposit services, and residential and commercial mortgage. We believe this non-GAAP measure serves as a useful tool for comparison of noninterest income related to fees.
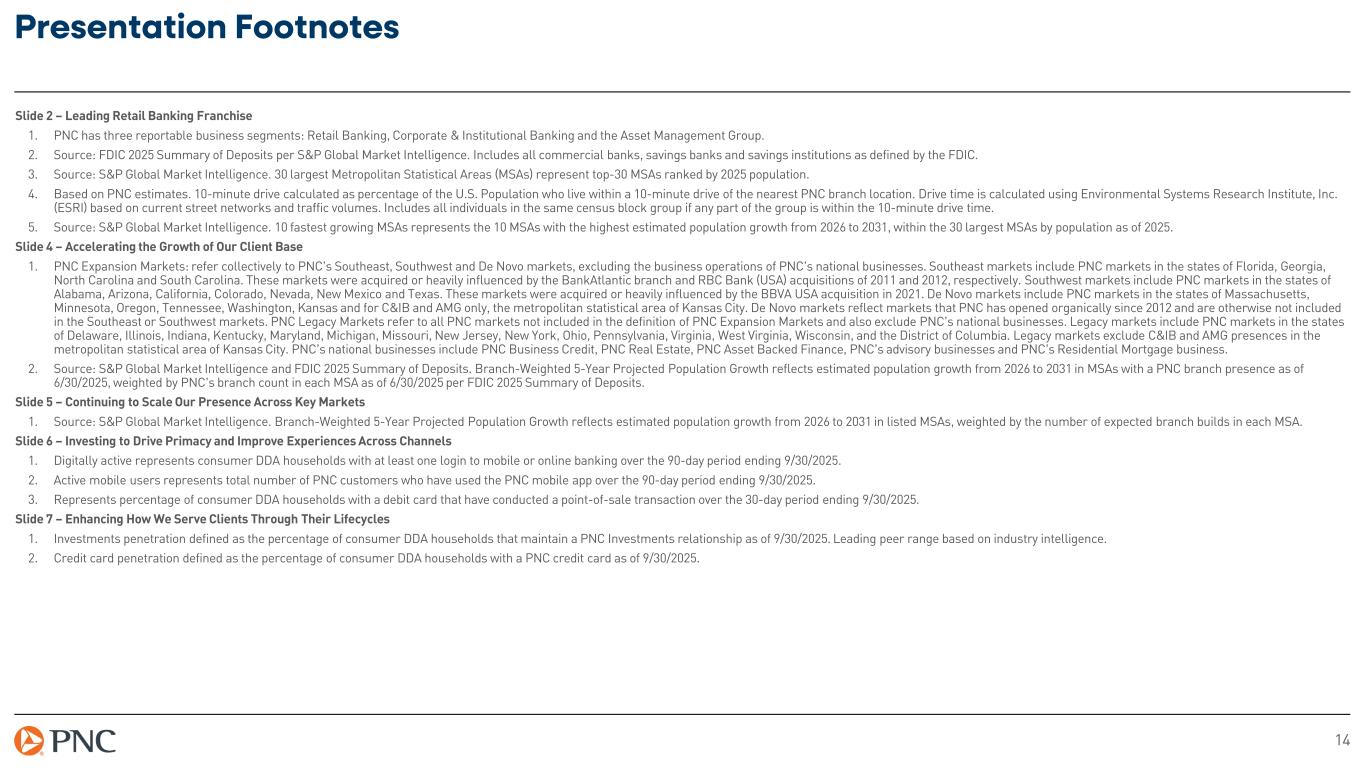
14 Presentation Footnotes Slide 2 – Leading Retail Banking Franchise 1. PNC has three reportable business segments: Retail Banking, Corporate & Institutional Banking and the Asset Management Group. 2. Source: FDIC 2025 Summary of Deposits per S&P Global Market Intelligence. Includes all commercial banks, savings banks and savings institutions as defined by the FDIC. 3. Source: S&P Global Market Intelligence. 30 largest Metropolitan Statistical Areas (MSAs) represent top-30 MSAs ranked by 2025 population. 4. Based on PNC estimates. 10-minute drive calculated as percentage of the U.S. Population who live within a 10-minute drive of the nearest PNC branch location. Drive time is calculated using Environmental Systems Research Institute, Inc. (ESRI) based on current street networks and traffic volumes. Includes all individuals in the same census block group if any part of the group is within the 10-minute drive time. 5. Source: S&P Global Market Intelligence. 10 fastest growing MSAs represents the 10 MSAs with the highest estimated population growth from 2026 to 2031, within the 30 largest MSAs by population as of 2025. Slide 4 – Accelerating the Growth of Our Client Base 1. PNC Expansion Markets: refer collectively to PNC’s Southeast, Southwest and De Novo markets, excluding the business operations of PNC’s national businesses. Southeast markets include PNC markets in the states of Florida, Georgia, North Carolina and South Carolina. These markets were acquired or heavily influenced by the BankAtlantic branch and RBC Bank (USA) acquisitions of 2011 and 2012, respectively. Southwest markets include PNC markets in the states of Alabama, Arizona, California, Colorado, Nevada, New Mexico and Texas. These markets were acquired or heavily influenced by the BBVA USA acquisition in 2021. De Novo markets include PNC markets in the states of Massachusetts, Minnesota, Oregon, Tennessee, Washington, Kansas and for C&IB and AMG only, the metropolitan statistical area of Kansas City. De Novo markets reflect markets that PNC has opened organically since 2012 and are otherwise not included in the Southeast or Southwest markets. PNC Legacy Markets refer to all PNC markets not included in the definition of PNC Expansion Markets and also exclude PNC’s national businesses. Legacy markets include PNC markets in the states of Delaware, Illinois, Indiana, Kentucky, Maryland, Michigan, Missouri, New Jersey, New York, Ohio, Pennsylvania, Virginia, West Virginia, Wisconsin, and the District of Columbia. Legacy markets exclude C&IB and AMG presences in the metropolitan statistical area of Kansas City. PNC’s national businesses include PNC Business Credit, PNC Real Estate, PNC Asset Backed Finance, PNC’s advisory businesses and PNC’s Residential Mortgage business. 2. Source: S&P Global Market Intelligence and FDIC 2025 Summary of Deposits. Branch-Weighted 5-Year Projected Population Growth reflects estimated population growth from 2026 to 2031 in MSAs with a PNC branch presence as of 6/30/2025, weighted by PNC’s branch count in each MSA as of 6/30/2025 per FDIC 2025 Summary of Deposits. Slide 5 – Continuing to Scale Our Presence Across Key Markets 1. Source: S&P Global Market Intelligence. Branch-Weighted 5-Year Projected Population Growth reflects estimated population growth from 2026 to 2031 in listed MSAs, weighted by the number of expected branch builds in each MSA. Slide 6 – Investing to Drive Primacy and Improve Experiences Across Channels 1. Digitally active represents consumer DDA households with at least one login to mobile or online banking over the 90-day period ending 9/30/2025. 2. Active mobile users represents total number of PNC customers who have used the PNC mobile app over the 90-day period ending 9/30/2025. 3. Represents percentage of consumer DDA households with a debit card that have conducted a point-of-sale transaction over the 30-day period ending 9/30/2025. Slide 7 – Enhancing How We Serve Clients Through Their Lifecycles 1. Investments penetration defined as the percentage of consumer DDA households that maintain a PNC Investments relationship as of 9/30/2025. Leading peer range based on industry intelligence. 2. Credit card penetration defined as the percentage of consumer DDA households with a PNC credit card as of 9/30/2025.