EX-99.2
Published on July 14, 2021
The PNC Financial Services Group Second Quarter 2021 Earnings Conference Call July 14, 2021 Exhibit 99.2
Cautionary Statement Regarding Forward-Looking and Non-GAAP Financial Information Our earnings conference call presentation is not intended as a full business or financial review and should be viewed in the context of all of the information made available by PNC in its SEC filings and on our corporate website. The presentation contains forward-looking statements regarding our outlook for earnings, revenues, expenses, tax rates, capital and liquidity levels and ratios, asset levels, asset quality, financial position, and other matters regarding or affecting PNC and its future business and operations. Forward-looking statements are necessarily subject to numerous assumptions, risks and uncertainties, which change over time. The forward-looking statements in this presentation are qualified by the factors affecting forward-looking statements identified in the more detailed Cautionary Statement included in the Appendix. We provide greater detail regarding these as well as other factors in our 2020 Form 10-K and subsequent Form 10-Qs, and in our other subsequent SEC filings. Our forward-looking statements may also be subject to risks and uncertainties including those we may discuss in this presentation or in our SEC filings. Future events or circumstances may change our outlook and may also affect the nature of the assumptions, risks and uncertainties to which our forward-looking statements are subject. Forward-looking statements in this presentation speak only as of the date of this presentation. We do not assume any duty and do not undertake to update those statements. Actual results or future events could differ, possibly materially, from those anticipated in forward-looking statements, as well as from historical performance. As a result, we caution against placing undue reliance on any forward-looking statements. We include non-GAAP financial information in this presentation. Non-GAAP financial information includes financial metrics such as fee income, tangible book value, pretax, pre-provision earnings, net interest margin, return on tangible common equity, and other adjusted metrics. Reconciliations for such financial information may be found in our presentation, in these slides, including the Appendix, in other materials on our corporate website, and in our SEC filings. This information supplements our results as reported in accordance with GAAP and should not be viewed in isolation from, or as a substitute for, our GAAP results. We believe that this information and the related reconciliations may be useful to investors, analysts, regulators and others to help understand and evaluate our financial results, and with respect to adjusted metrics, because we believe they better reflect the ongoing financial results and trends of our businesses and increase comparability of period-to-period results. We may also use annualized, pro forma, estimated or third party numbers for illustrative or comparative purposes only. These may not reflect actual results. References to our corporate website are to www.pnc.com under “About Us - Investor Relations.” Our SEC filings are available both on our corporate website and on the SEC’s website at www.sec.gov. We include web addresses here as inactive textual references only. Information on these websites is not part of this presentation. 1
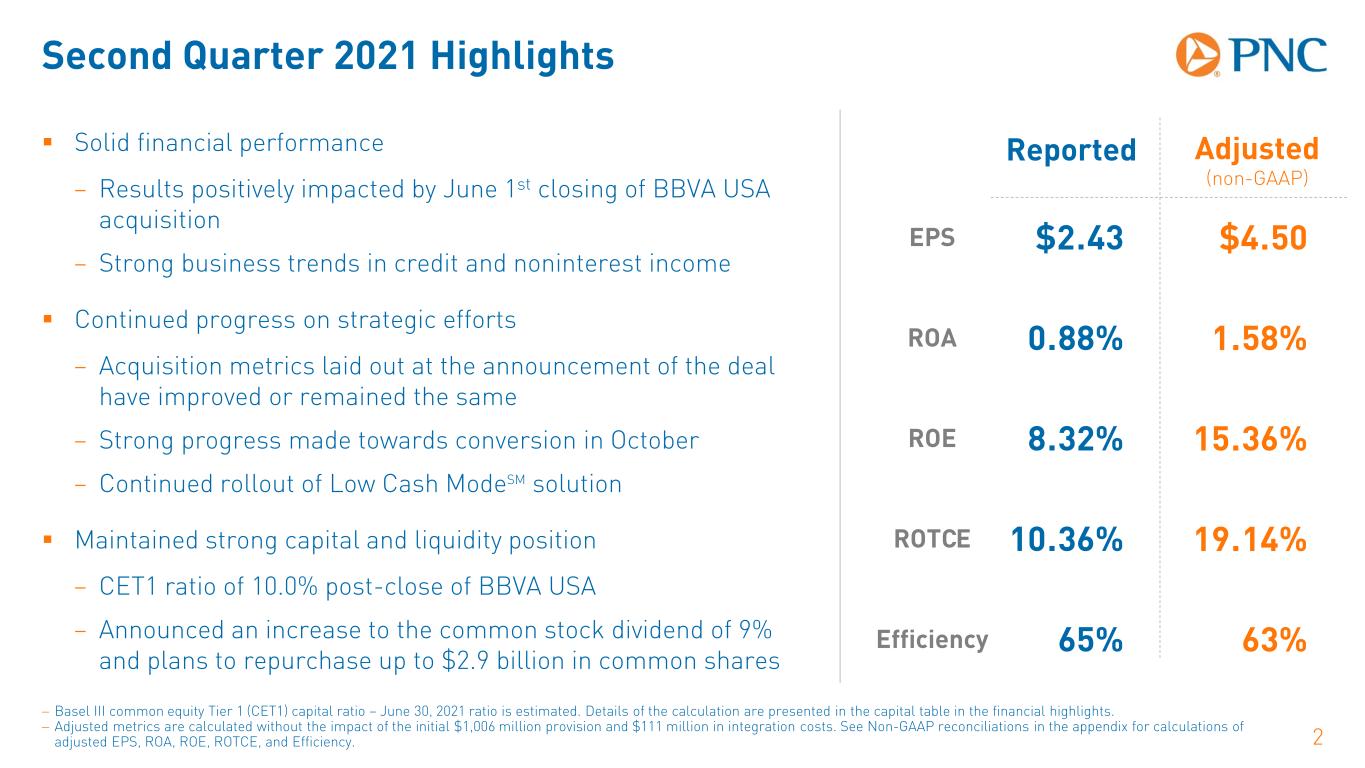
Second Quarter 2021 Highlights 2 − Basel III common equity Tier 1 (CET1) capital ratio – June 30, 2021 ratio is estimated. Details of the calculation are presented in the capital table in the financial highlights. − Adjusted metrics are calculated without the impact of the initial $1,006 million provision and $111 million in integration costs. See Non-GAAP reconciliations in the appendix for calculations of adjusted EPS, ROA, ROE, ROTCE, and Efficiency. Solid financial performance – Results positively impacted by June 1st closing of BBVA USA acquisition – Strong business trends in credit and noninterest income Continued progress on strategic efforts – Acquisition metrics laid out at the announcement of the deal have improved or remained the same – Strong progress made towards conversion in October – Continued rollout of Low Cash ModeSM solution Maintained strong capital and liquidity position – CET1 ratio of 10.0% post-close of BBVA USA – Announced an increase to the common stock dividend of 9% and plans to repurchase up to $2.9 billion in common shares Adjusted (non-GAAP) Reported EPS ROA ROE ROTCE Efficiency $2.43 0.88% 8.32% 10.36% 65% $4.50 1.58% 15.36% 19.14% 63%
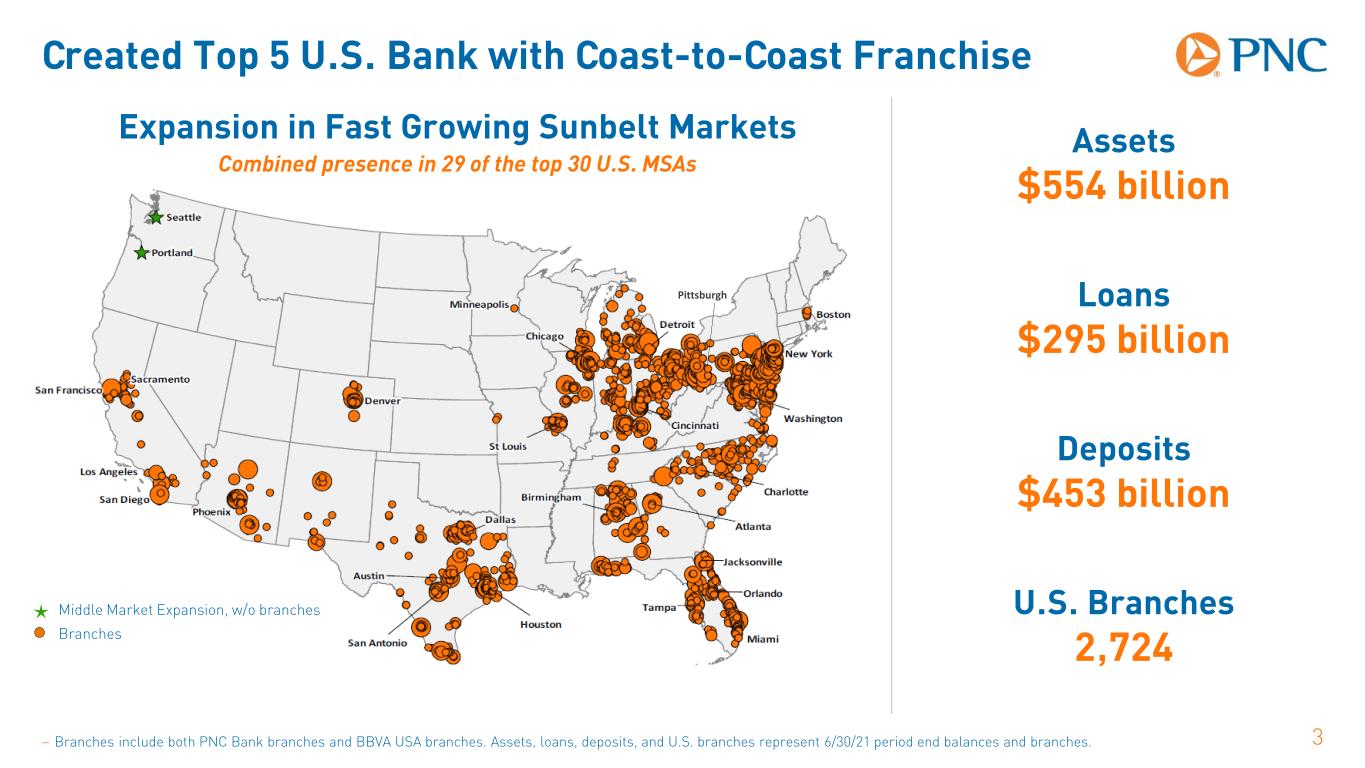
Created Top 5 U.S. Bank with Coast-to-Coast Franchise 3− Branches include both PNC Bank branches and BBVA USA branches. Assets, loans, deposits, and U.S. branches represent 6/30/21 period end balances and branches. Expansion in Fast Growing Sunbelt Markets Combined presence in 29 of the top 30 U.S. MSAs Assets $554 billion Loans $295 billion Deposits $453 billion U.S. Branches 2,724Branches Middle Market Expansion, w/o branches Pittsburgh
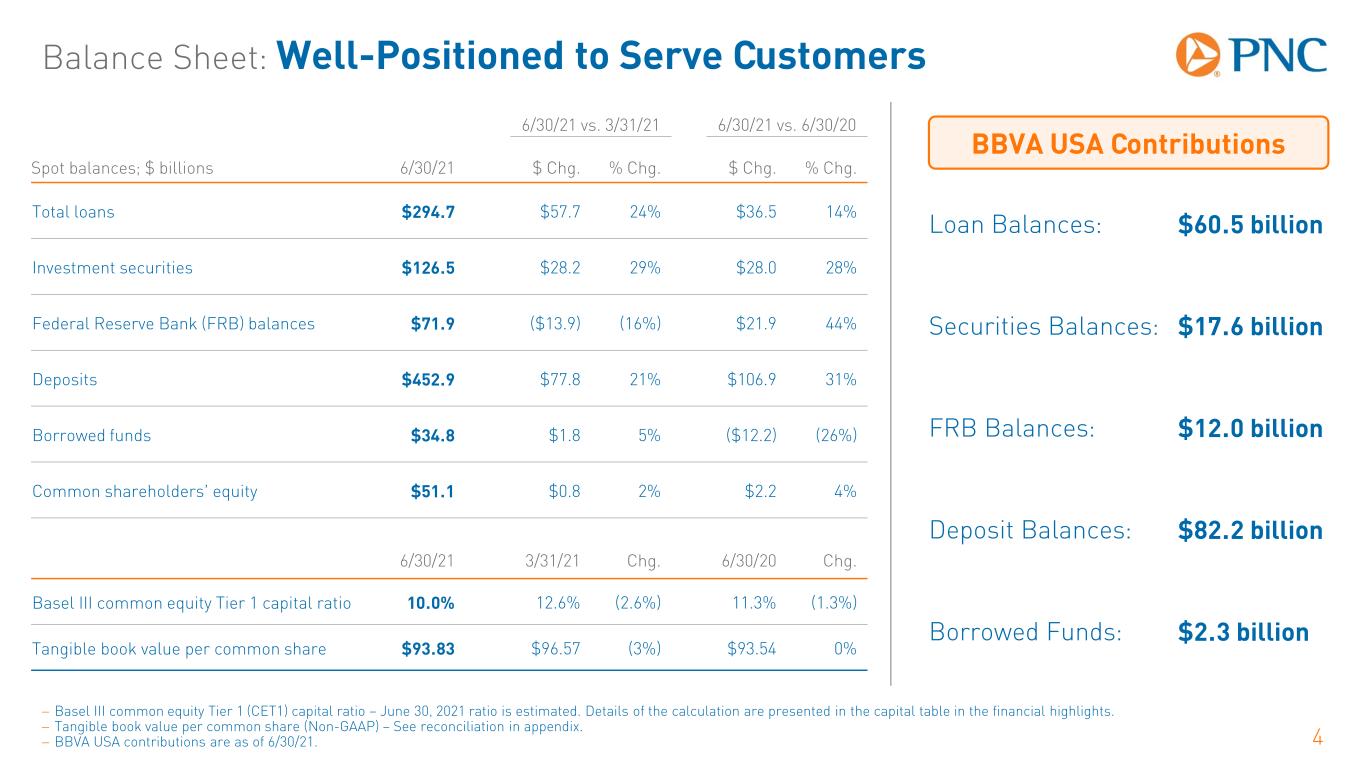
Balance Sheet: Well-Positioned to Serve Customers 4 Loan Balances: Securities Balances: Deposit Balances: FRB Balances: 6/30/21 vs. 3/31/21 6/30/21 vs. 6/30/20 Spot balances; $ billions 6/30/21 $ Chg. % Chg. $ Chg. % Chg. Total loans $294.7 $57.7 24% $36.5 14% Investment securities $126.5 $28.2 29% $28.0 28% Federal Reserve Bank (FRB) balances $71.9 ($13.9) (16%) $21.9 44% Deposits $452.9 $77.8 21% $106.9 31% Borrowed funds $34.8 $1.8 5% ($12.2) (26%) Common shareholders’ equity $51.1 $0.8 2% $2.2 4% 6/30/21 3/31/21 Chg. 6/30/20 Chg. Basel III common equity Tier 1 capital ratio 10.0% 12.6% (2.6%) 11.3% (1.3%) Tangible book value per common share $93.83 $96.57 (3%) $93.54 0% − Basel III common equity Tier 1 (CET1) capital ratio – June 30, 2021 ratio is estimated. Details of the calculation are presented in the capital table in the financial highlights. − Tangible book value per common share (Non-GAAP) – See reconciliation in appendix. − BBVA USA contributions are as of 6/30/21. Borrowed Funds: $60.5 billion $17.6 billion $82.2 billion $12.0 billion $2.3 billion BBVA USA Contributions
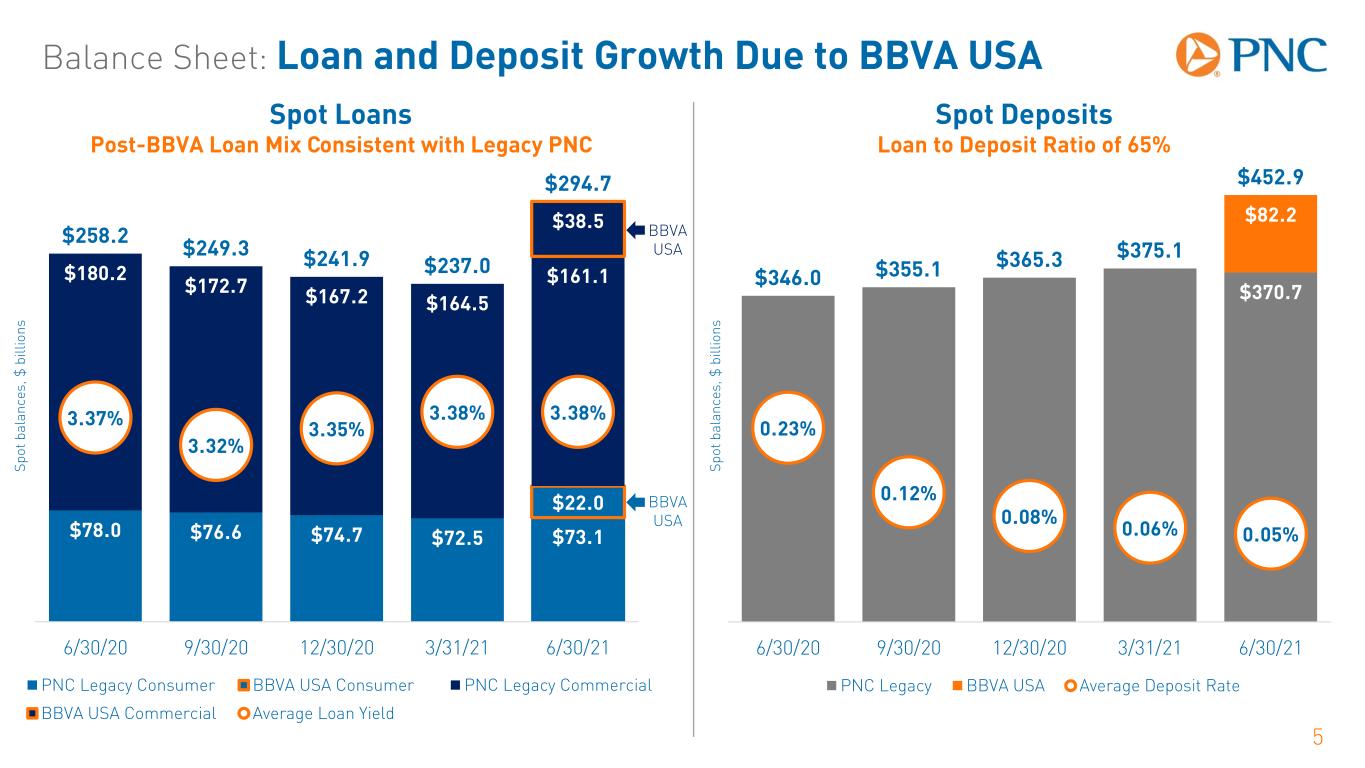
Balance Sheet: Loan and Deposit Growth Due to BBVA USA 5 Sp ot b al an ce s, $ b ill io ns Spot Loans Post-BBVA Loan Mix Consistent with Legacy PNC Spot Deposits Loan to Deposit Ratio of 65% Sp ot b al an ce s, $ b ill io ns $370.7 $82.2 $346.0 $355.1 $365.3 $375.1 $452.9 0.23% 0.12% 0.08% 0.06% 0.05% -0.10% 0.00% 0.10% 0.20% 0.30% 0.40% 0.50% 0.60% 0.70% 0 50 100 150 200 250 300 350 400 450 500 6/30/20 9/30/20 12/30/20 3/31/21 6/30/21 PNC Legacy BBVA USA Average Deposit Rate $78.0 $76.6 $74.7 $72.5 $73.1 $22.0 $180.2 $172.7 $167.2 $164.5 $161.1 $38.5 $258.2 $249.3 $241.9 $237.0 $294.7 3.37% 3.32% 3.35% 3.38% 3.38% 3.00% 3.10% 3.20% 3.30% 3.40% 3.50% 3.60% 3.70% 3.80% 0 50 100 150 200 250 300 6/30/20 9/30/20 12/30/20 3/31/21 6/30/21 PNC Legacy Consumer BBVA USA Consumer PNC Legacy Commercial BBVA USA Commercial Average Loan Yield BBVA USA BBVA USA
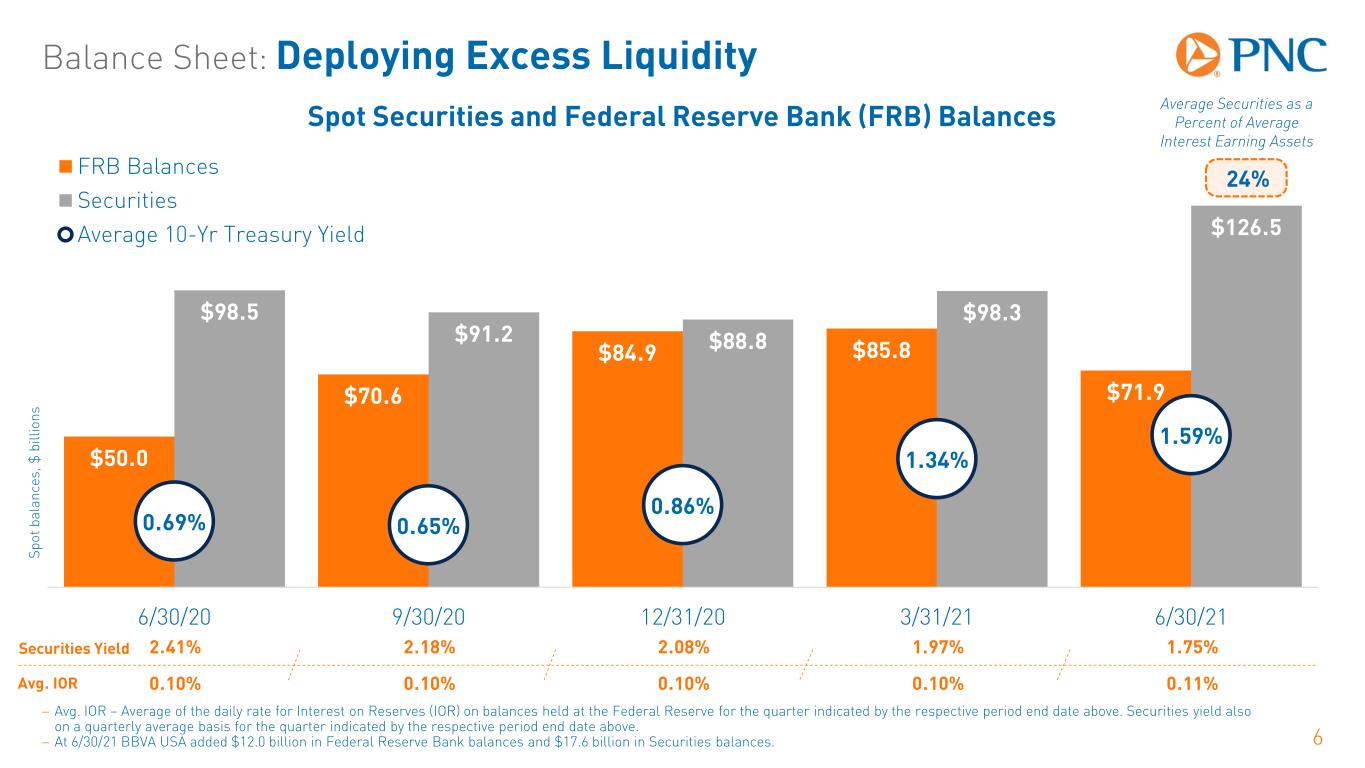
Balance Sheet: Deploying Excess Liquidity 6 Securities Yield Avg. IOR 2.41% 2.18% 2.08% 1.97% 1.75% 0.10% 0.10% 0.10% 0.10% 0.11% Sp ot b al an ce s, $ b ill io ns − Avg. IOR – Average of the daily rate for Interest on Reserves (IOR) on balances held at the Federal Reserve for the quarter indicated by the respective period end date above. Securities yield also on a quarterly average basis for the quarter indicated by the respective period end date above. − At 6/30/21 BBVA USA added $12.0 billion in Federal Reserve Bank balances and $17.6 billion in Securities balances. Spot Securities and Federal Reserve Bank (FRB) Balances $50.0 $70.6 $84.9 $85.8 $71.9 $98.5 $91.2 $88.8 $98.3 $126.5 0.69% 0.65% 0.86% 1.34% 1.59% 0.00% 0.50% 1.00% 1.50% 2.00% 2.50% 3.00% 3.50% 4.00% 0 20 40 60 80 100 120 140 6/30/20 9/30/20 12/31/20 3/31/21 6/30/21 FRB Balances Securities Average 10-Yr Treasury Yield Average Securities as a Percent of Average Interest Earning Assets 24%
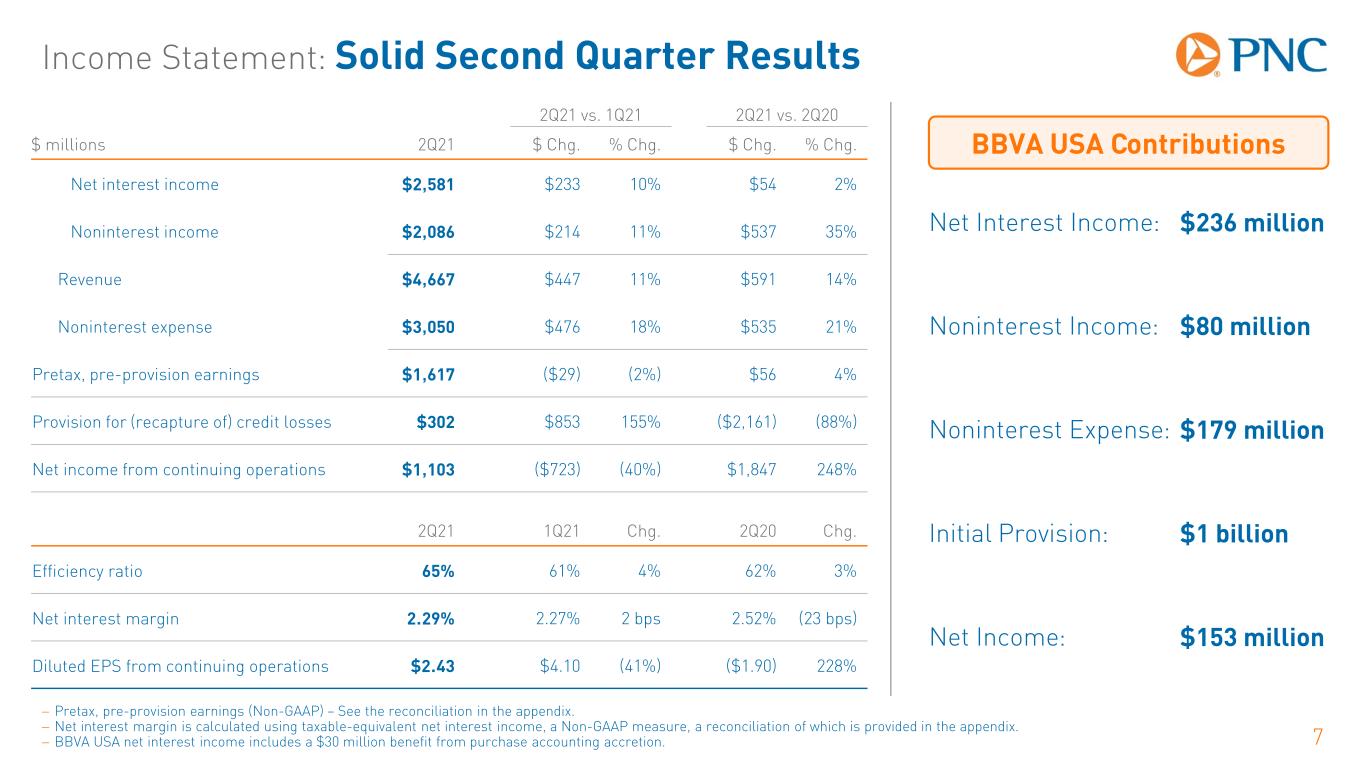
Income Statement: Solid Second Quarter Results 7 − Pretax, pre-provision earnings (Non-GAAP) – See the reconciliation in the appendix. − Net interest margin is calculated using taxable-equivalent net interest income, a Non-GAAP measure, a reconciliation of which is provided in the appendix. − BBVA USA net interest income includes a $30 million benefit from purchase accounting accretion. 2Q21 vs. 1Q21 2Q21 vs. 2Q20 $ millions 2Q21 $ Chg. % Chg. $ Chg. % Chg. Net interest income $2,581 $233 10% $54 2% Noninterest income $2,086 $214 11% $537 35% Revenue $4,667 $447 11% $591 14% Noninterest expense $3,050 $476 18% $535 21% Pretax, pre-provision earnings $1,617 ($29) (2%) $56 4% Provision for (recapture of) credit losses $302 $853 155% ($2,161) (88%) Net income from continuing operations $1,103 ($723) (40%) $1,847 248% 2Q21 1Q21 Chg. 2Q20 Chg. Efficiency ratio 65% 61% 4% 62% 3% Net interest margin 2.29% 2.27% 2 bps 2.52% (23 bps) Diluted EPS from continuing operations $2.43 $4.10 (41%) ($1.90) 228% Net Interest Income: Noninterest Income: Initial Provision: Noninterest Expense: Net Income: BBVA USA Contributions $236 million $80 million $1 billion $179 million $153 million
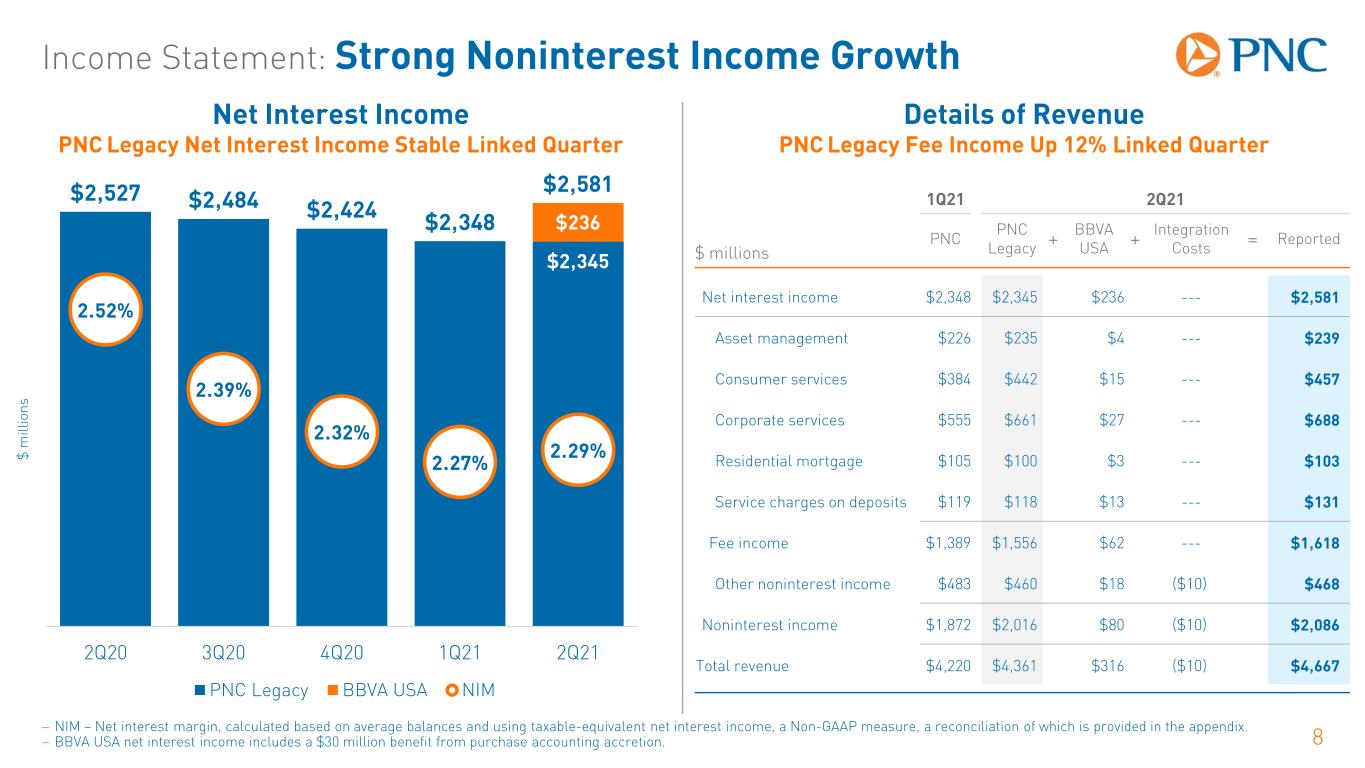
8 1Q21 2Q21 $ millions PNC PNC Legacy + BBVA USA + Integration Costs = Reported Net interest income $2,348 $2,345 $236 --- $2,581 Asset management $226 $235 $4 --- $239 Consumer services $384 $442 $15 --- $457 Corporate services $555 $661 $27 --- $688 Residential mortgage $105 $100 $3 --- $103 Service charges on deposits $119 $118 $13 --- $131 Fee income $1,389 $1,556 $62 --- $1,618 Other noninterest income $483 $460 $18 ($10) $468 Noninterest income $1,872 $2,016 $80 ($10) $2,086 Total revenue $4,220 $4,361 $316 ($10) $4,667 $ m ill io ns Net Interest Income PNC Legacy Net Interest Income Stable Linked Quarter $2,345 $236 $2,527 $2,484 $2,424 $2,348 $2,581 2.52% 2.39% 2.32% 2.27% 2.29% 2.00% 2.10% 2.20% 2.30% 2.40% 2.50% 2.60% 2.70% 0 500 1000 1500 2000 2500 2Q20 3Q20 4Q20 1Q21 2Q21 PNC Legacy BBVA USA NIM − NIM – Net interest margin, calculated based on average balances and using taxable-equivalent net interest income, a Non-GAAP measure, a reconciliation of which is provided in the appendix. − BBVA USA net interest income includes a $30 million benefit from purchase accounting accretion. Details of Revenue PNC Legacy Fee Income Up 12% Linked Quarter Income Statement: Strong Noninterest Income Growth
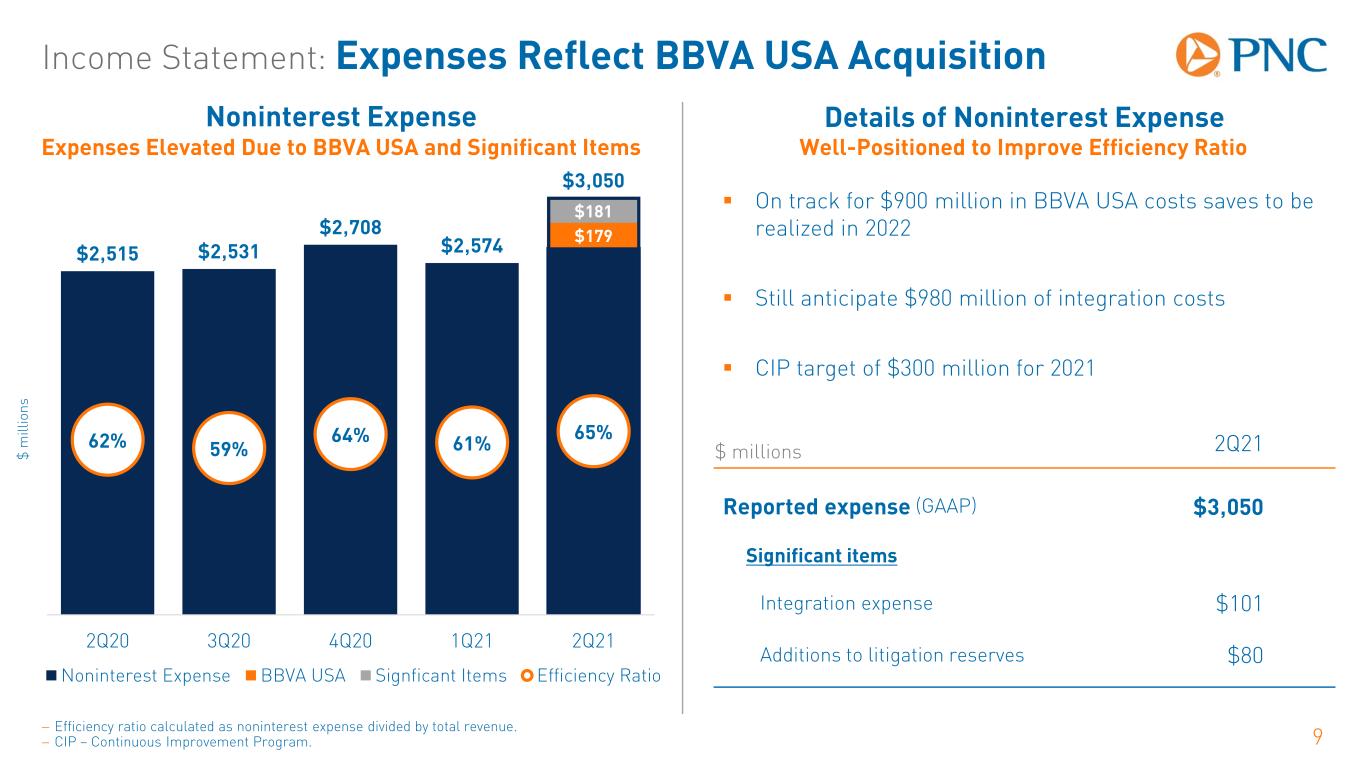
Income Statement: Expenses Reflect BBVA USA Acquisition 9 Noninterest Expense Expenses Elevated Due to BBVA USA and Significant Items Details of Noninterest Expense Well-Positioned to Improve Efficiency Ratio $ m ill io ns $ millions 2Q21 Reported expense (GAAP) $3,050 Significant items Integration expense $101 Additions to litigation reserves $80 $179 $181 $2,515 $2,531 $2,708 $2,574 $3,050 62% 59% 64% 61% 65% 0% 20% 40% 60% 80% 100% 120% 140% 0 500 1000 1500 2000 2500 3000 2Q20 3Q20 4Q20 1Q21 2Q21 Noninterest Expense BBVA USA Signficant Items Efficiency Ratio On track for $900 million in BBVA USA costs saves to be realized in 2022 Still anticipate $980 million of integration costs CIP target of $300 million for 2021 − Efficiency ratio calculated as noninterest expense divided by total revenue. − CIP – Continuous Improvement Program.
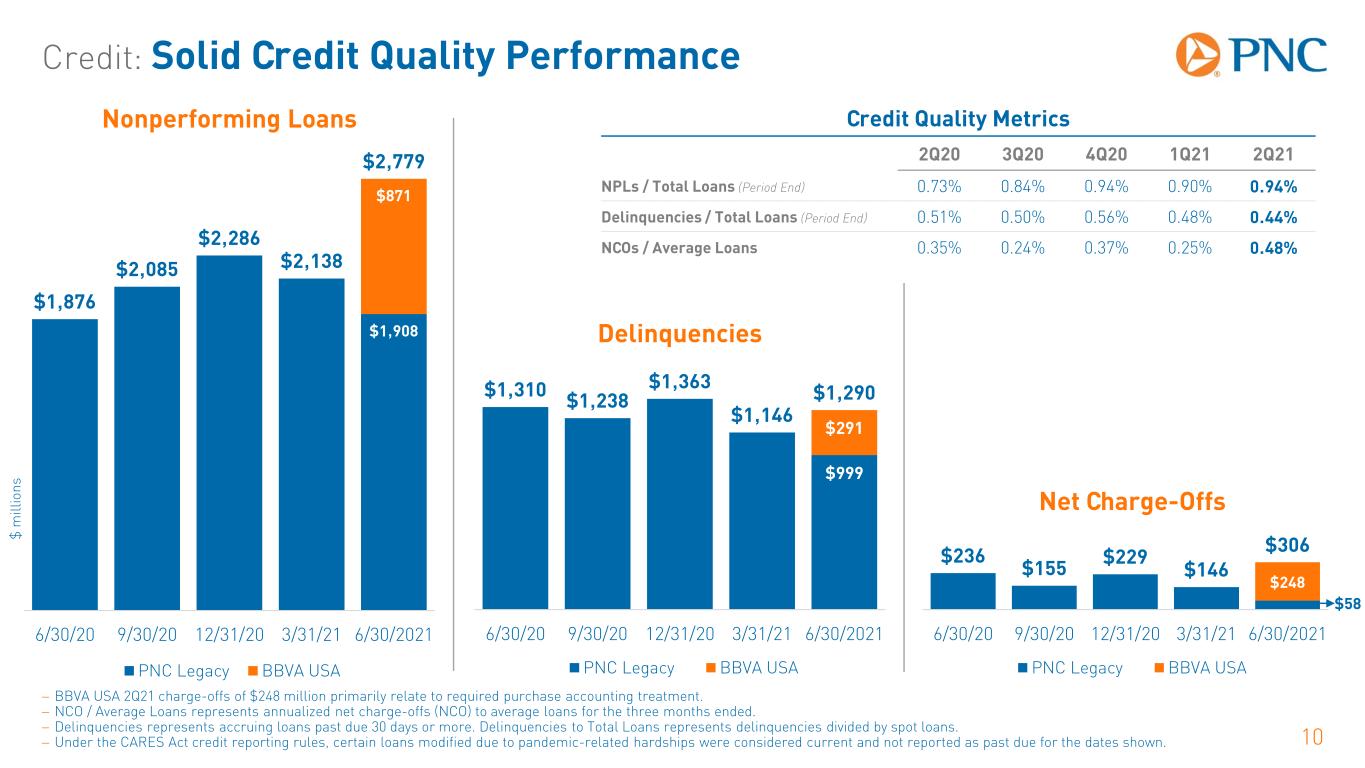
Credit: Solid Credit Quality Performance 10 − BBVA USA 2Q21 charge-offs of $248 million primarily relate to required purchase accounting treatment. − NCO / Average Loans represents annualized net charge-offs (NCO) to average loans for the three months ended. − Delinquencies represents accruing loans past due 30 days or more. Delinquencies to Total Loans represents delinquencies divided by spot loans. − Under the CARES Act credit reporting rules, certain loans modified due to pandemic-related hardships were considered current and not reported as past due for the dates shown. $999 $291 $1,310 $1,238 $1,363 $1,146 $1,290 0 500 1000 1500 2000 2500 6/30/20 9/30/20 12/31/20 3/31/21 6/30/2021 PNC Legacy BBVA USA $1,908 $871 $1,876 $2,085 $2,286 $2,138 $2,779 0 500 1000 1500 2000 2500 6/30/20 9/30/20 12/31/20 3/31/21 6/30/2021 PNC Legacy BBVA USA $ m ill io ns Nonperforming Loans Delinquencies Net Charge-Offs $248 $236 $155 $229 $146 $306 0 500 1000 1500 2000 2500 6/30/20 9/30/20 12/31/20 3/31/21 6/30/2021 PNC Legacy BBVA USA $58 Credit Quality Metrics 2Q20 3Q20 4Q20 1Q21 2Q21 NPLs / Total Loans (Period End) 0.73% 0.84% 0.94% 0.90% 0.94% Delinquencies / Total Loans (Period End) .51% 0.50% 0.56% 0.48% 0.44% NCOs / Average Loans 0.35% 0.24% 0.37% 0.25% 0.48%
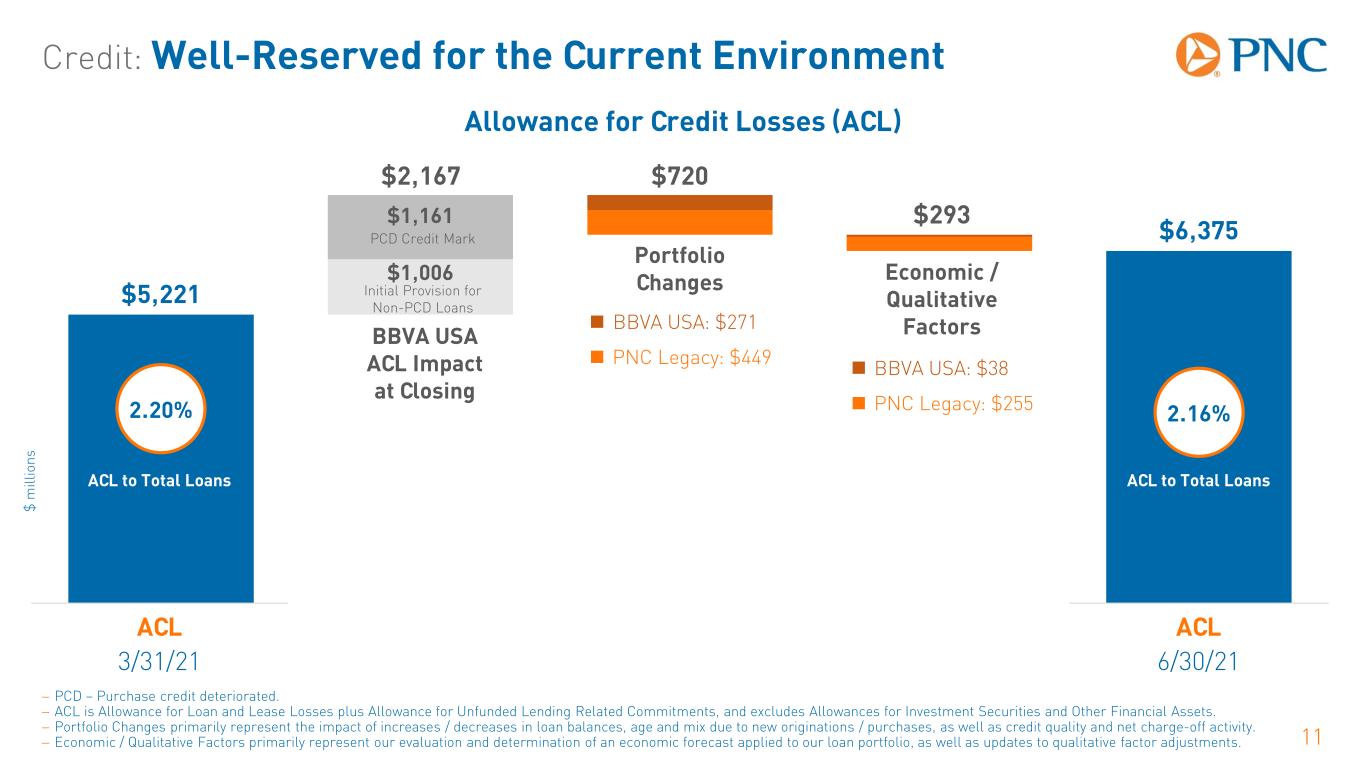
Credit: Well-Reserved for the Current Environment 11 Allowance for Credit Losses (ACL) ACL 3/31/21 ACL 6/30/21 $ m ill io ns $1,006 $1,161 $5,221 $6,375 2.20% 2.16% 0.00% 1.00% 2.00% 3.00% 4.00% 5.00% 0 1000 2000 3000 4000 5000 6000 7000 8000 3/31/21 BBVA USA Portfolio Econ 6/30/21 Portfolio Changes Economic / Qualitative Factors − PCD – Purchase credit deteriorated. − ACL is Allowance for Loan and Lease Losses plus Allowance for Unfunded Lending Related Commitments, and excludes Allowances for Investment Securities and Other Financial Assets. − Portfolio Changes primarily represent the impact of increases / decreases in loan balances, age and mix due to new originations / purchases, as well as credit quality and net charge-off activity. − Economic / Qualitative Factors primarily represent our evaluation and determination of an economic forecast applied to our loan portfolio, as well as updates to qualitative factor adjustments. ACL to Total LoansACL to Total Loans BBVA USA ACL Impact at Closing PCD Credit Mark Initial Provision for Non-PCD Loans $2,167 $720 $293 PNC Legacy: $449 BBVA USA: $271 PNC Legacy: $255 BBVA USA: $38
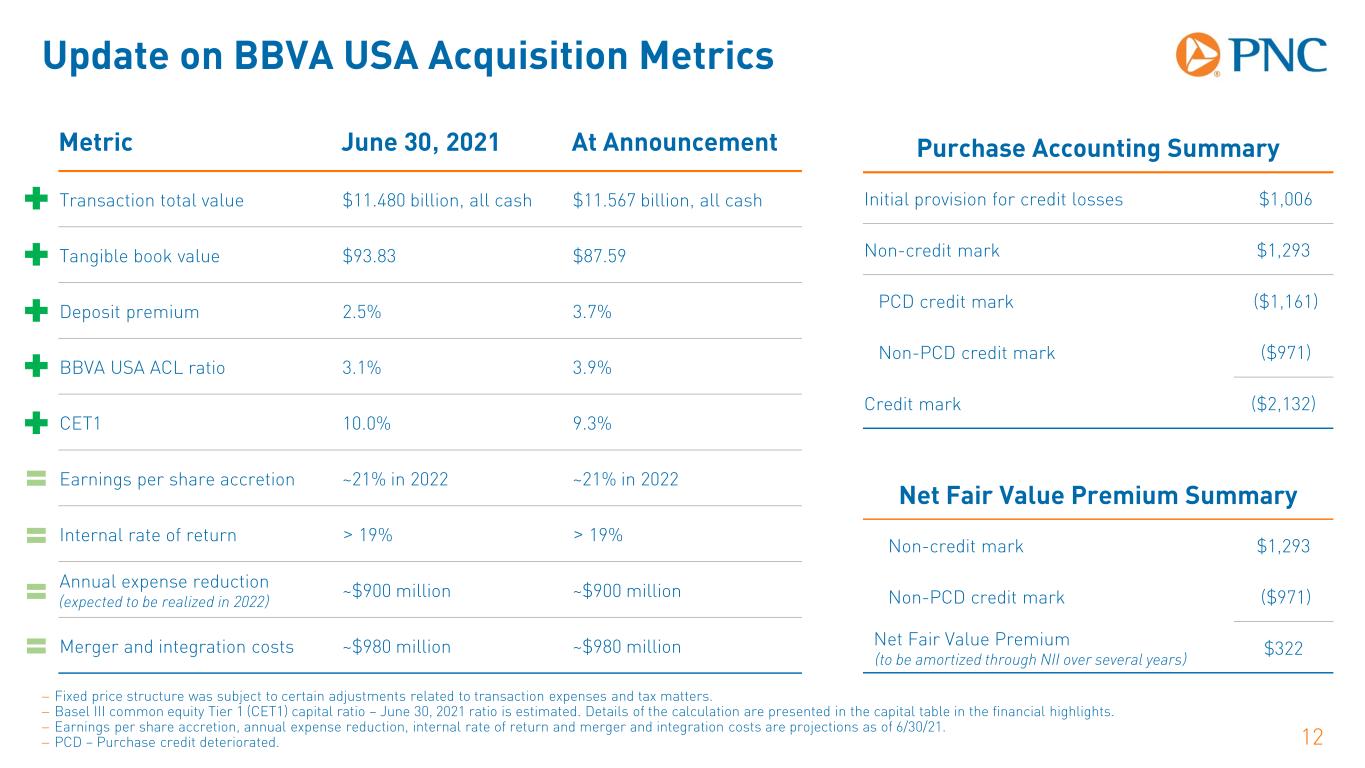
Update on BBVA USA Acquisition Metrics 12 Metric June 30, 2021 At Announcement Transaction total value $11.480 billion, all cash $11.567 billion, all cash Tangible book value $93.83 $87.59 Deposit premium 2.5% 3.7% BBVA USA ACL ratio 3.1% 3.9% CET1 10.0% 9.3% Earnings per share accretion ~21% in 2022 ~21% in 2022 Internal rate of return > 19% > 19% Annual expense reduction (expected to be realized in 2022) ~$900 million ~$900 million Merger and integration costs ~$980 million ~$980 million Purchase Accounting Summary Initial provision for credit losses $1,006 Non-credit mark $1,293 PCD credit mark ($1,161) Non-PCD credit mark ($971) Credit mark ($2,132) − Fixed price structure was subject to certain adjustments related to transaction expenses and tax matters. − Basel III common equity Tier 1 (CET1) capital ratio – June 30, 2021 ratio is estimated. Details of the calculation are presented in the capital table in the financial highlights. − Earnings per share accretion, annual expense reduction, internal rate of return and merger and integration costs are projections as of 6/30/21. − PCD – Purchase credit deteriorated. Net Fair Value Premium Summary Non-credit mark $1,293 Non-PCD credit mark ($971) Net Fair Value Premium (to be amortized through NII over several years) $322
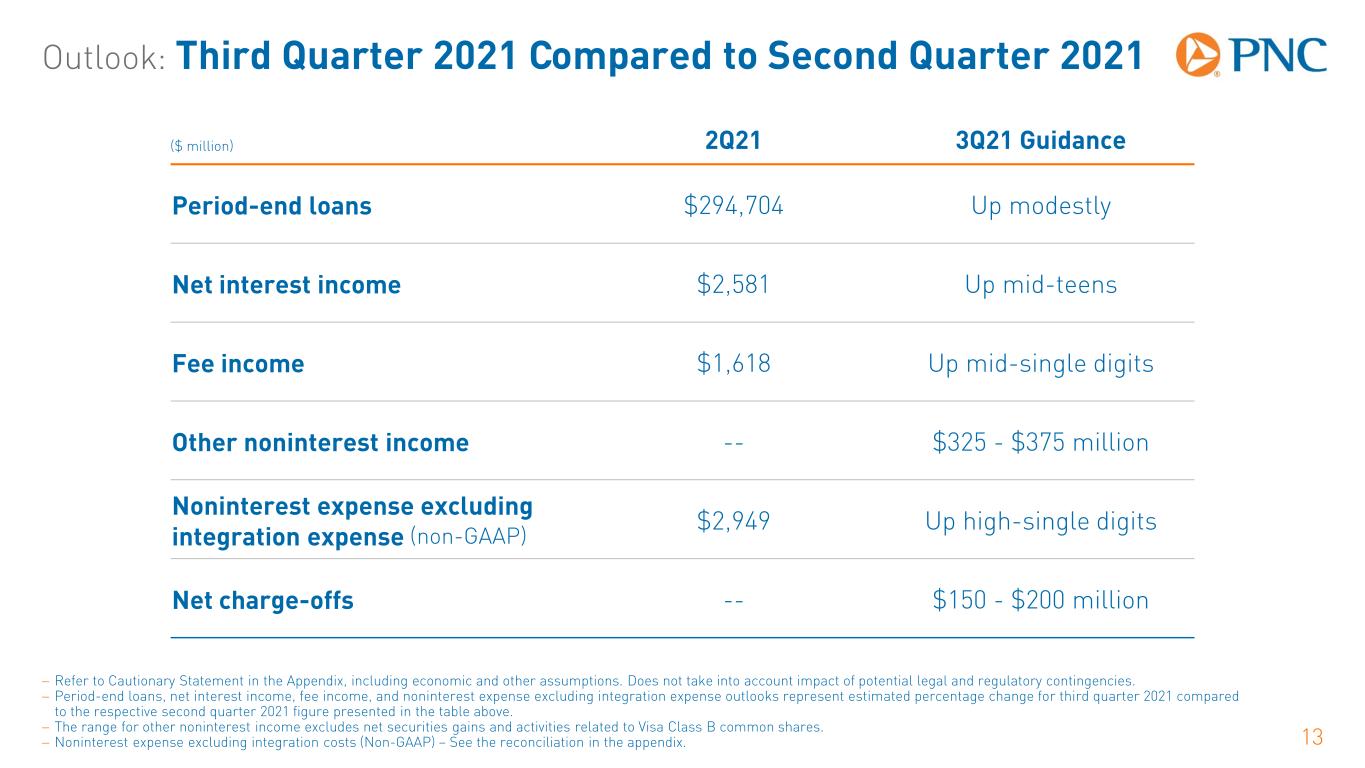
Outlook: Third Quarter 2021 Compared to Second Quarter 2021 13 − Refer to Cautionary Statement in the Appendix, including economic and other assumptions. Does not take into account impact of potential legal and regulatory contingencies. − Period-end loans, net interest income, fee income, and noninterest expense excluding integration expense outlooks represent estimated percentage change for third quarter 2021 compared to the respective second quarter 2021 figure presented in the table above. − The range for other noninterest income excludes net securities gains and activities related to Visa Class B common shares. − Noninterest expense excluding integration costs (Non-GAAP) – See the reconciliation in the appendix. ($ million) 2Q21 3Q21 Guidance Period-end loans $294,704 Up modestly Net interest income $2,581 Up mid-teens Fee income $1,618 Up mid-single digits Other noninterest income -- $325 - $375 million Noninterest expense excluding integration expense (non-GAAP) $2,949 Up high-single digits Net charge-offs -- $150 - $200 million
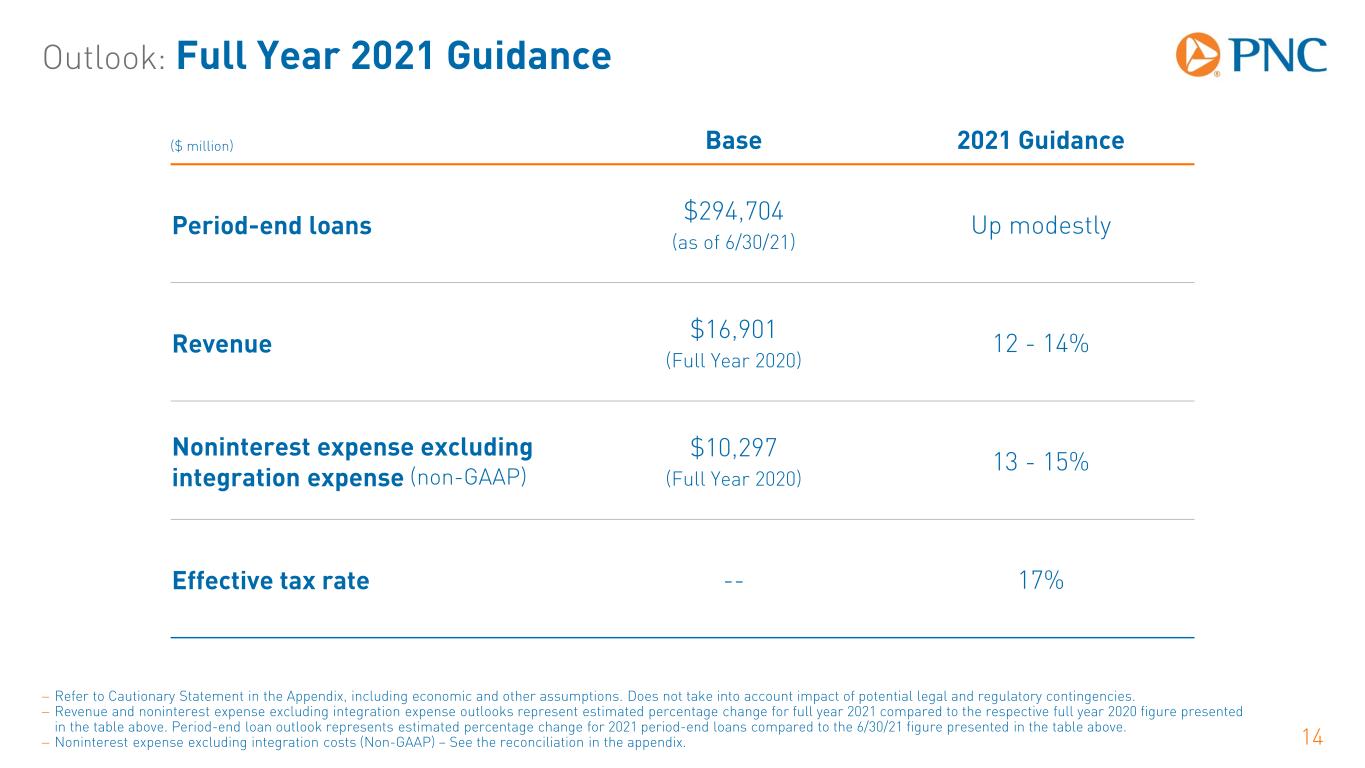
Outlook: Full Year 2021 Guidance 14 − Refer to Cautionary Statement in the Appendix, including economic and other assumptions. Does not take into account impact of potential legal and regulatory contingencies. − Revenue and noninterest expense excluding integration expense outlooks represent estimated percentage change for full year 2021 compared to the respective full year 2020 figure presented in the table above. Period-end loan outlook represents estimated percentage change for 2021 period-end loans compared to the 6/30/21 figure presented in the table above. − Noninterest expense excluding integration costs (Non-GAAP) – See the reconciliation in the appendix. ($ million) Base 2021 Guidance Period-end loans $294,704 (as of 6/30/21) Up modestly Revenue $16,901 (Full Year 2020) 12 - 14% Noninterest expense excluding integration expense (non-GAAP) $10,297 (Full Year 2020) 13 - 15% Effective tax rate -- 17%
Appendix: Cautionary Statement Regarding Forward-Looking Information 15 This presentation includes “snapshot” information about PNC used by way of illustration and is not intended as a full business or financial review. It should not be viewed in isolation but rather in the context of all of the information made available by PNC in its SEC filings. We also make statements in this presentation, and we may from time to time make other statements, regarding our outlook for earnings, revenues, expenses, tax rates, capital and liquidity levels and ratios, asset levels, asset quality, financial position, and other matters regarding or affecting PNC and its future business and operations that are forward-looking statements within the meaning of the Private Securities Litigation Reform Act. Forward-looking statements are typically identified by words such as “believe,” “plan,” “expect,” “anticipate,” “see,” “look,” “intend,” “outlook,” “project,” “forecast,” “estimate,” “goal,” “will,” “should” and other similar words and expressions. Forward-looking statements are necessarily subject to numerous assumptions, risks and uncertainties, which change over time. Future events or circumstances may change our outlook and may also affect the nature of the assumptions, risks and uncertainties to which our forward-looking statements are subject. Forward-looking statements speak only as of the date made. We do not assume any duty and do not undertake to update forward-looking statements. Actual results or future events could differ, possibly materially, from those anticipated in forward-looking statements, as well as from historical performance. As a result, we caution against placing undue reliance on any forward-looking statements. Our forward-looking statements are subject to the following principal risks and uncertainties. Our businesses, financial results and balance sheet values are affected by business and economic conditions, including: − Changes in interest rates and valuations in debt, equity and other financial markets, − Disruptions in the U.S. and global financial markets, − Actions by the Federal Reserve Board, U.S. Treasury and other government agencies, including those that impact money supply, market interest rates and inflation, − Changes in customer behavior due to changing business and economic conditions or legislative or regulatory initiatives, − Changes in customers’, suppliers’ and other counterparties’ performance and creditworthiness, − Impacts of tariffs and other trade policies of the U.S. and its global trading partners, − The length and extent of the economic impact of the COVID-19 pandemic, − The impact of the results of the recent U.S. elections on the regulatory landscape, capital markets, and the response to and management of the COVID-19 pandemic, including the effectiveness of already-enacted fiscal stimulus from the federal government and a potential infrastructure bill and changes in tax laws, and − Commodity price volatility.
Appendix: Cautionary Statement Regarding Forward-Looking Information 16 Our forward-looking financial statements are subject to the risk that economic and financial market conditions will be substantially different than those we are currently expecting and do not take into account potential legal and regulatory contingencies. These statements are based on our view that: − The U.S. economy is in an economic recovery, following a very severe but very short economic contraction in the first half of 2020 due to the COVID-19 pandemic and public health measures to contain it. − With passage of the American Rescue Plan Act of 2021 and continued vaccine distribution, economic growth has picked up in 2021 and will remain very strong through the rest of this year and into 2022. Real GDP is expected to return to its pre-pandemic level in the second quarter of 2021. Employment in June 2021 was still down by 6.8 million from before the pandemic; PNC expects employment to return to its pre-pandemic level in the spring of 2022. − Inflation has accelerated in mid-2021 on a year-ago basis due to comparisons with spring 2020 (when prices were falling), strong demand in specific segments, and supply chain disruptions. Inflation will slow in the second half of 2021. − PNC expects the Federal Open Market Committee to keep the fed funds rate in its current range of 0.00 to 0.25 percent until mid-2023. PNC's ability to take certain capital actions, including returning capital to shareholders, is subject to PNC meeting or exceeding a stress capital buffer established by the Federal Reserve Board in connection with the Federal Reserve Board's Comprehensive Capital Analysis and Review (CCAR) process. PNC’s regulatory capital ratios in the future will depend on, among other things, the company’s financial performance, the scope and terms of final capital regulations then in effect and management actions affecting the composition of PNC’s balance sheet. In addition, PNC’s ability to determine, evaluate and forecast regulatory capital ratios, and to take actions (such as capital distributions) based on actual or forecasted capital ratios, will be dependent at least in part on the development, validation and regulatory review of related models. Legal and regulatory developments could have an impact on our ability to operate our businesses, financial condition, results of operations, competitive position, reputation, or pursuit of attractive acquisition opportunities. Reputational impacts could affect matters such as business generation and retention, liquidity, funding, and ability to attract and retain management. These developments could include: − Changes to laws and regulations, including changes affecting oversight of the financial services industry, consumer protection, bank capital and liquidity standards, pension, bankruptcy and other industry aspects, and changes in accounting policies and principles. − Unfavorable resolution of legal proceedings or other claims and regulatory and other governmental investigations or other inquiries. These matters may result in monetary judgments or settlements or other remedies, including fines, penalties, restitution or alterations in our business practices, and in additional expenses and collateral costs, and may cause reputational harm to PNC. − Results of the regulatory examination and supervision process, including our failure to satisfy requirements of agreements with governmental agencies. − Impact on business and operating results of any costs associated with obtaining rights in intellectual property claimed by others and of adequacy of our intellectual property protection in general.
Appendix: Cautionary Statement Regarding Forward-Looking Information 17 Business and operating results are affected by our ability to identify and effectively manage risks inherent in our businesses, including, where appropriate, through effective use of systems and controls, third-party insurance, derivatives, and capital management techniques, and to meet evolving regulatory capital and liquidity standards. Our acquisition of BBVA USA Bancshares, Inc. presents us with risks and uncertainties related to the integration of the acquired business into PNC, including: − The business of BBVA USA Bancshares, Inc., including its U.S. banking subsidiary, BBVA USA, going forward may not perform as we currently project or in a manner consistent with historical performance. As a result, the anticipated benefits, including estimated cost savings, of the transaction may be significantly more difficult or take longer to achieve than expected or may not be achieved in their entirety as a result of unexpected factors or events, including those that are outside of our control. − The integration of BBVA USA Bancshares, Inc., including its U.S. banking subsidiary, BBVA USA, with PNC and PNC Bank, respectively, may be more difficult to achieve than anticipated or have unanticipated adverse results relating to BBVA USA Bancshares, Inc., including its U.S. banking subsidiary, BBVA USA, or our existing businesses. Our ability to integrate BBVA USA Bancshares, Inc., including its U.S. banking subsidiary, BBVA USA, successfully may be adversely affected by the fact that this transaction results in us entering several geographic markets where we did not previously have any meaningful presence. In addition to the BBVA USA Bancshares, Inc. transaction, we grow our business in part through acquisitions and new strategic initiatives. Risks and uncertainties include those presented by the nature of the business acquired and strategic initiative, including in some cases those associated with our entry into new businesses or new geographic or other markets and risks resulting from our inexperience in those new areas, as well as risks and uncertainties related to the acquisition transactions themselves, regulatory issues, and the integration of the acquired businesses into PNC after closing. Competition can have an impact on customer acquisition, growth and retention and on credit spreads and product pricing, which can affect market share, deposits and revenues. Our ability to anticipate and respond to technological changes can also impact our ability to respond to customer needs and meet competitive demands. Business and operating results can also be affected by widespread natural and other disasters, pandemics, dislocations, terrorist activities, system failures, security breaches, cyberattacks or international hostilities through impacts on the economy and financial markets generally or on us or our counterparties specifically. We provide greater detail regarding these as well as other factors in our 2020 Form 10-K and in our first quarter 2021 Form 10-Q, including in the Risk Factors and Risk Management sections and the Legal Proceedings and Commitments Notes of the Notes To Consolidated Financial Statements in those reports, and in our other subsequent SEC filings. Our forward- looking statements may also be subject to other risks and uncertainties, including those we may discuss elsewhere in this presentation or in our SEC filings, accessible on the SEC’s website at www.sec.gov and on our corporate website at www.pnc.com/secfilings. We have included these web addresses as inactive textual references only. Information on these websites is not part of this document.
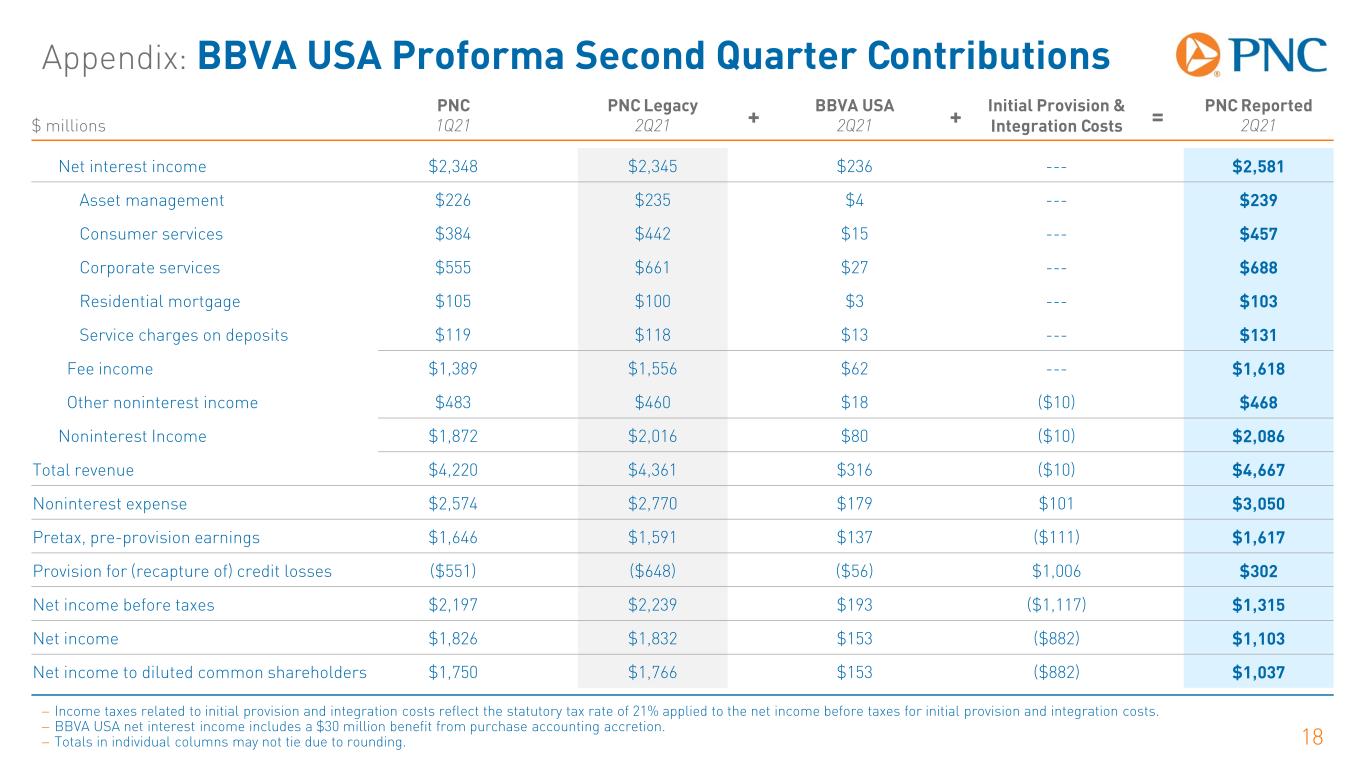
Appendix: BBVA USA Proforma Second Quarter Contributions 18 $ millions PNC 1Q21 PNC Legacy 2Q21 + BBVA USA 2Q21 + Initial Provision & Integration Costs = PNC Reported 2Q21 Net interest income $2,348 $2,345 $236 --- $2,581 Asset management $226 $235 $4 --- $239 Consumer services $384 $442 $15 --- $457 Corporate services $555 $661 $27 --- $688 Residential mortgage $105 $100 $3 --- $103 Service charges on deposits $119 $118 $13 --- $131 Fee income $1,389 $1,556 $62 --- $1,618 Other noninterest income $483 $460 $18 ($10) $468 Noninterest Income $1,872 $2,016 $80 ($10) $2,086 Total revenue $4,220 $4,361 $316 ($10) $4,667 Noninterest expense $2,574 $2,770 $179 $101 $3,050 Pretax, pre-provision earnings $1,646 $1,591 $137 ($111) $1,617 Provision for (recapture of) credit losses ($551) ($648) ($56) $1,006 $302 Net income before taxes $2,197 $2,239 $193 ($1,117) $1,315 Net income $1,826 $1,832 $153 ($882) $1,103 Net income to diluted common shareholders $1,750 $1,766 $153 ($882) $1,037 − Income taxes related to initial provision and integration costs reflect the statutory tax rate of 21% applied to the net income before taxes for initial provision and integration costs. − BBVA USA net interest income includes a $30 million benefit from purchase accounting accretion. − Totals in individual columns may not tie due to rounding.
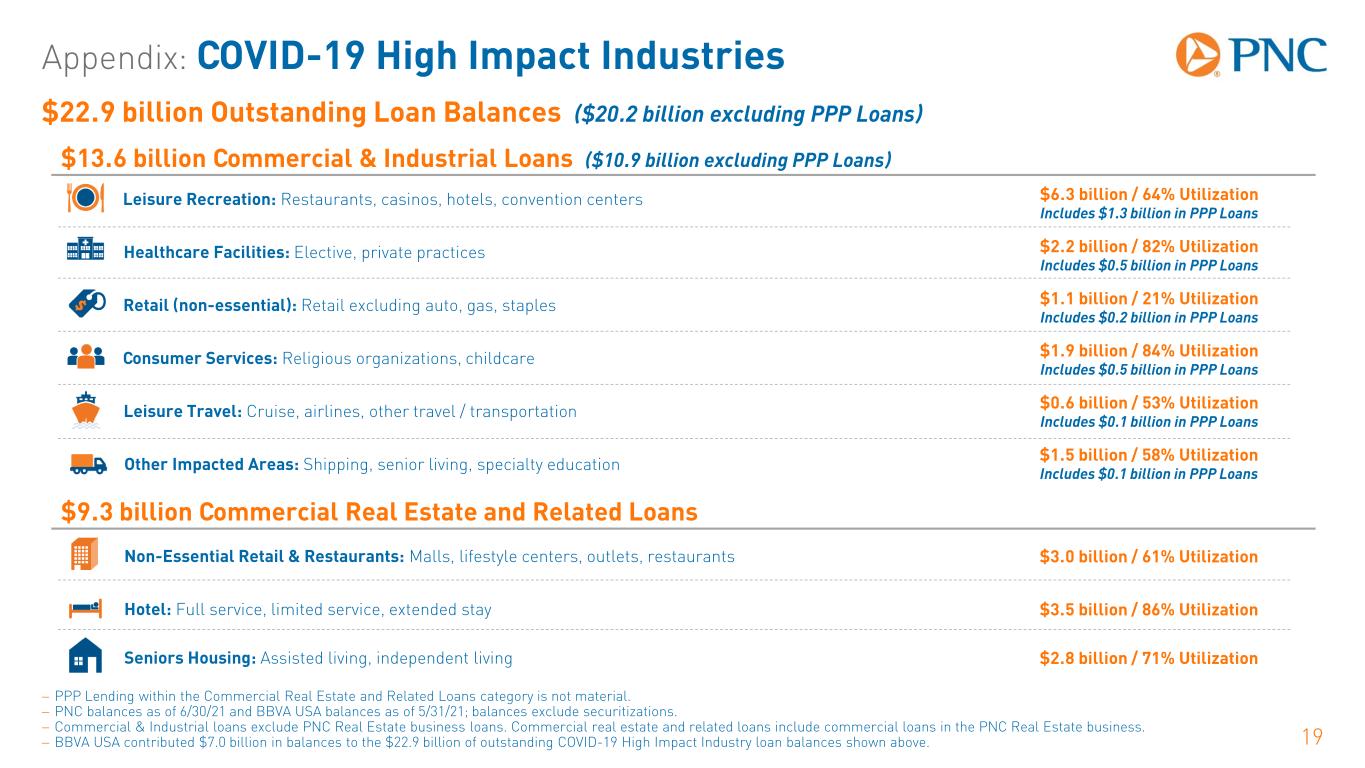
Appendix: COVID-19 High Impact Industries 19 − PPP Lending within the Commercial Real Estate and Related Loans category is not material. − PNC balances as of 6/30/21 and BBVA USA balances as of 5/31/21; balances exclude securitizations. − Commercial & Industrial loans exclude PNC Real Estate business loans. Commercial real estate and related loans include commercial loans in the PNC Real Estate business. − BBVA USA contributed $7.0 billion in balances to the $22.9 billion of outstanding COVID-19 High Impact Industry loan balances shown above. $9.3 billion Commercial Real Estate and Related Loans Non-Essential Retail & Restaurants: Malls, lifestyle centers, outlets, restaurants Hotel: Full service, limited service, extended stay Seniors Housing: Assisted living, independent living $3.0 billion / 61% Utilization $3.5 billion / 86% Utilization $2.8 billion / 71% Utilization $22.9 billion Outstanding Loan Balances ($20.2 billion excluding PPP Loans) $13.6 billion Commercial & Industrial Loans ($10.9 billion excluding PPP Loans) Leisure Recreation: Restaurants, casinos, hotels, convention centers Healthcare Facilities: Elective, private practices Other Impacted Areas: Shipping, senior living, specialty education Consumer Services: Religious organizations, childcare $2.2 billion / 82% Utilization Includes $0.5 billion in PPP Loans $1.5 billion / 58% Utilization Includes $0.1 billion in PPP Loans $1.9 billion / 84% Utilization Includes $0.5 billion in PPP Loans Leisure Travel: Cruise, airlines, other travel / transportation $0.6 billion / 53% Utilization Includes $0.1 billion in PPP Loans Retail (non-essential): Retail excluding auto, gas, staples $1.1 billion / 21% Utilization Includes $0.2 billion in PPP Loans $6.3 billion / 64% Utilization Includes $1.3 billion in PPP Loans
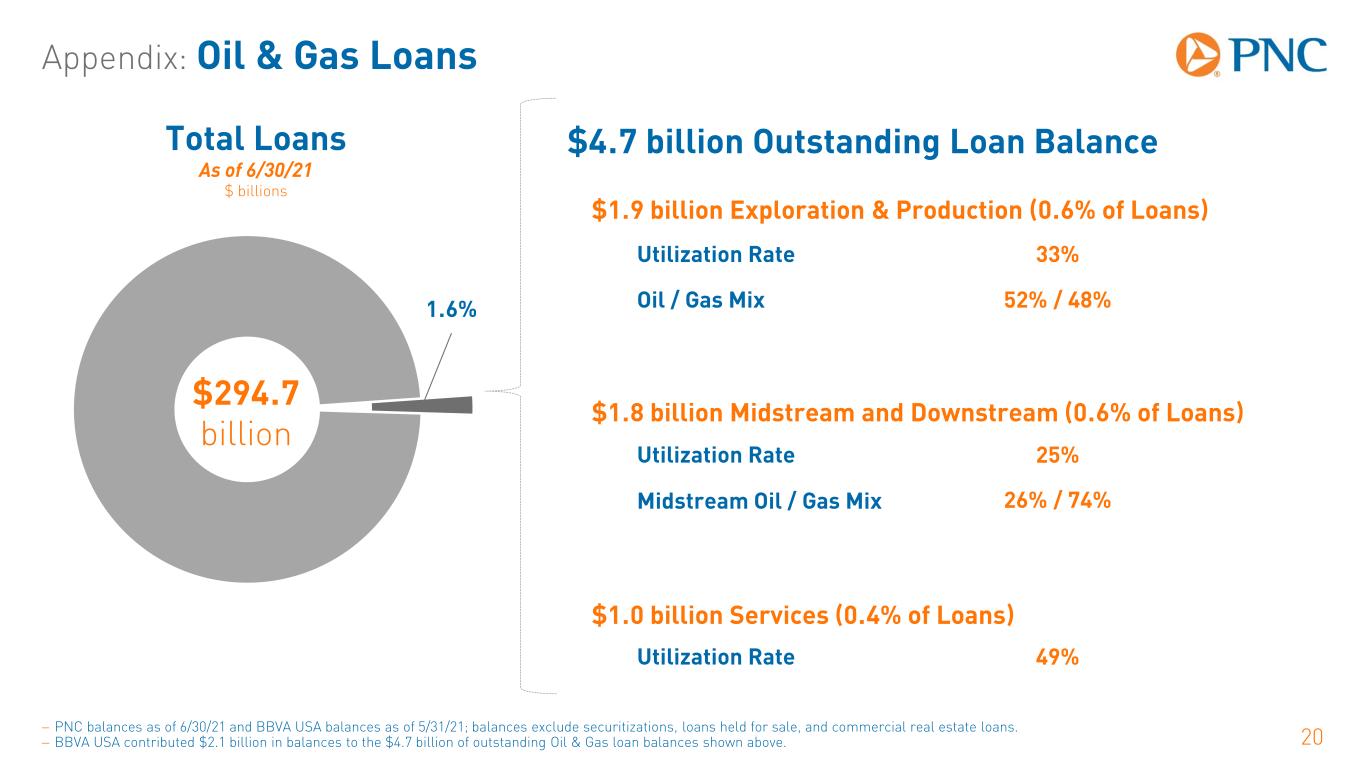
Appendix: Oil & Gas Loans 20− PNC balances as of 6/30/21 and BBVA USA balances as of 5/31/21; balances exclude securitizations, loans held for sale, and commercial real estate loans. − BBVA USA contributed $2.1 billion in balances to the $4.7 billion of outstanding Oil & Gas loan balances shown above. $1.9 billion Exploration & Production (0.6% of Loans) Utilization Rate 33% $4.7 billion Outstanding Loan Balance Oil / Gas Mix 52% / 48% $1.8 billion Midstream and Downstream (0.6% of Loans) $1.0 billion Services (0.4% of Loans) Utilization Rate 49% Utilization Rate 25% Midstream Oil / Gas Mix 26% / 74% 1.6% Total Loans As of 6/30/21 $ billions $294.7 billion
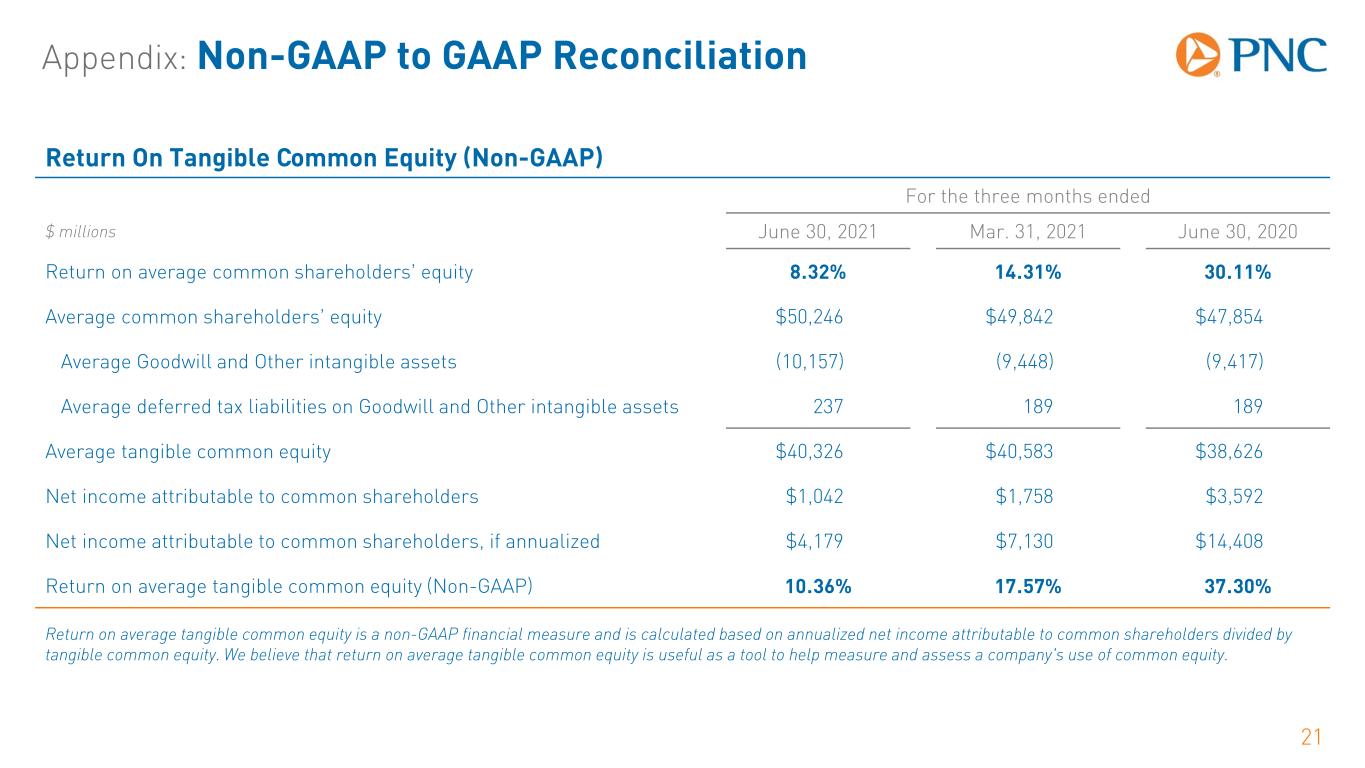
Appendix: Non-GAAP to GAAP Reconciliation 21 Return On Tangible Common Equity (Non-GAAP) For the three months ended $ millions June 30, 2021 Mar. 31, 2021 June 30, 2020 Return on average common shareholders’ equity 8.32% 14.31% 30.11% Average common shareholders’ equity $50,246 $49,842 $47,854 Average Goodwill and Other intangible assets (10,157) (9,448) (9,417) Average deferred tax liabilities on Goodwill and Other intangible assets 237 189 189 Average tangible common equity $40,326 $40,583 $38,626 Net income attributable to common shareholders $1,042 $1,758 $3,592 Net income attributable to common shareholders, if annualized $4,179 $7,130 $14,408 Return on average tangible common equity (Non-GAAP) 10.36% 17.57% 37.30% Return on average tangible common equity is a non-GAAP financial measure and is calculated based on annualized net income attributable to common shareholders divided by tangible common equity. We believe that return on average tangible common equity is useful as a tool to help measure and assess a company's use of common equity.
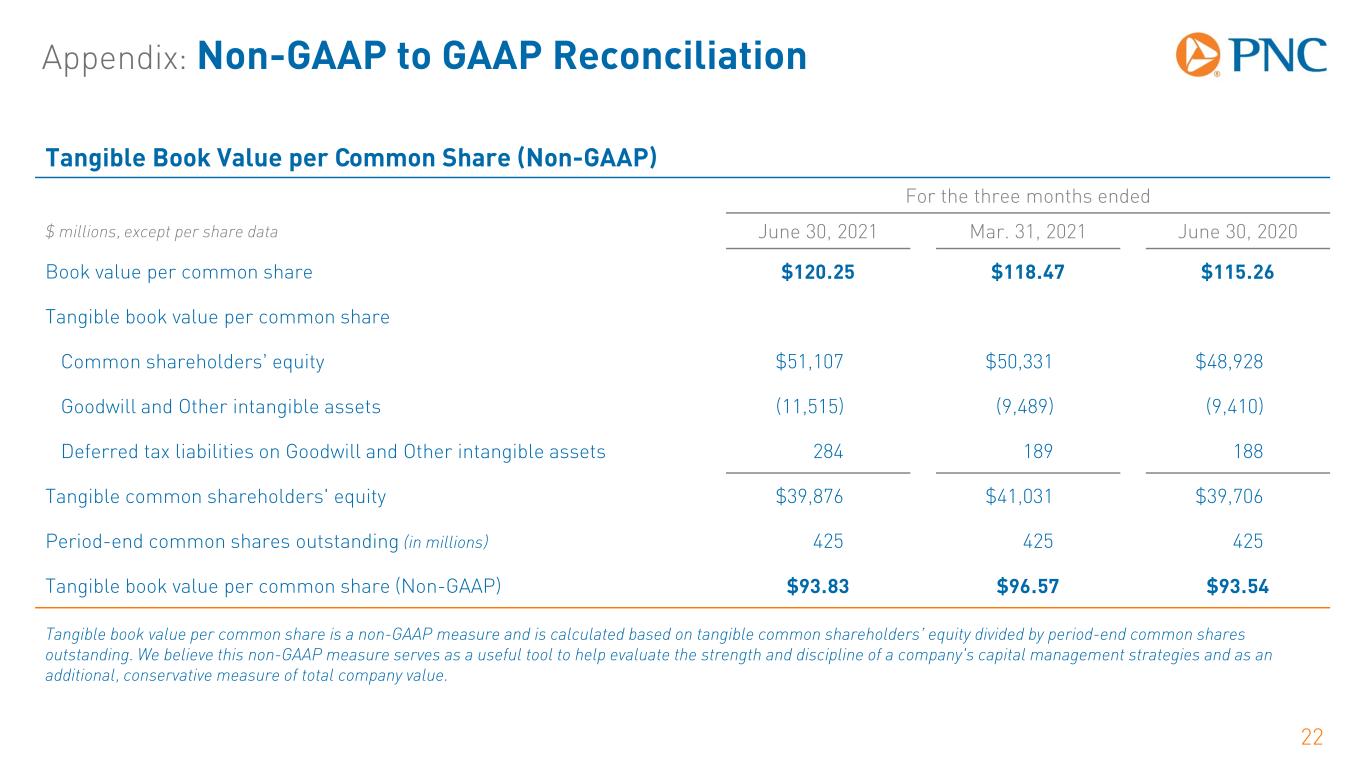
Appendix: Non-GAAP to GAAP Reconciliation 22 Tangible Book Value per Common Share (Non-GAAP) For the three months ended $ millions, except per share data June 30, 2021 Mar. 31, 2021 June 30, 2020 Book value per common share $120.25 $118.47 $115.26 Tangible book value per common share Common shareholders’ equity $51,107 $50,331 $48,928 Goodwill and Other intangible assets (11,515) (9,489) (9,410) Deferred tax liabilities on Goodwill and Other intangible assets 284 189 188 Tangible common shareholders' equity $39,876 $41,031 $39,706 Period-end common shares outstanding (in millions) 425 425 425 Tangible book value per common share (Non-GAAP) $93.83 $96.57 $93.54 Tangible book value per common share is a non-GAAP measure and is calculated based on tangible common shareholders’ equity divided by period-end common shares outstanding. We believe this non-GAAP measure serves as a useful tool to help evaluate the strength and discipline of a company's capital management strategies and as an additional, conservative measure of total company value.
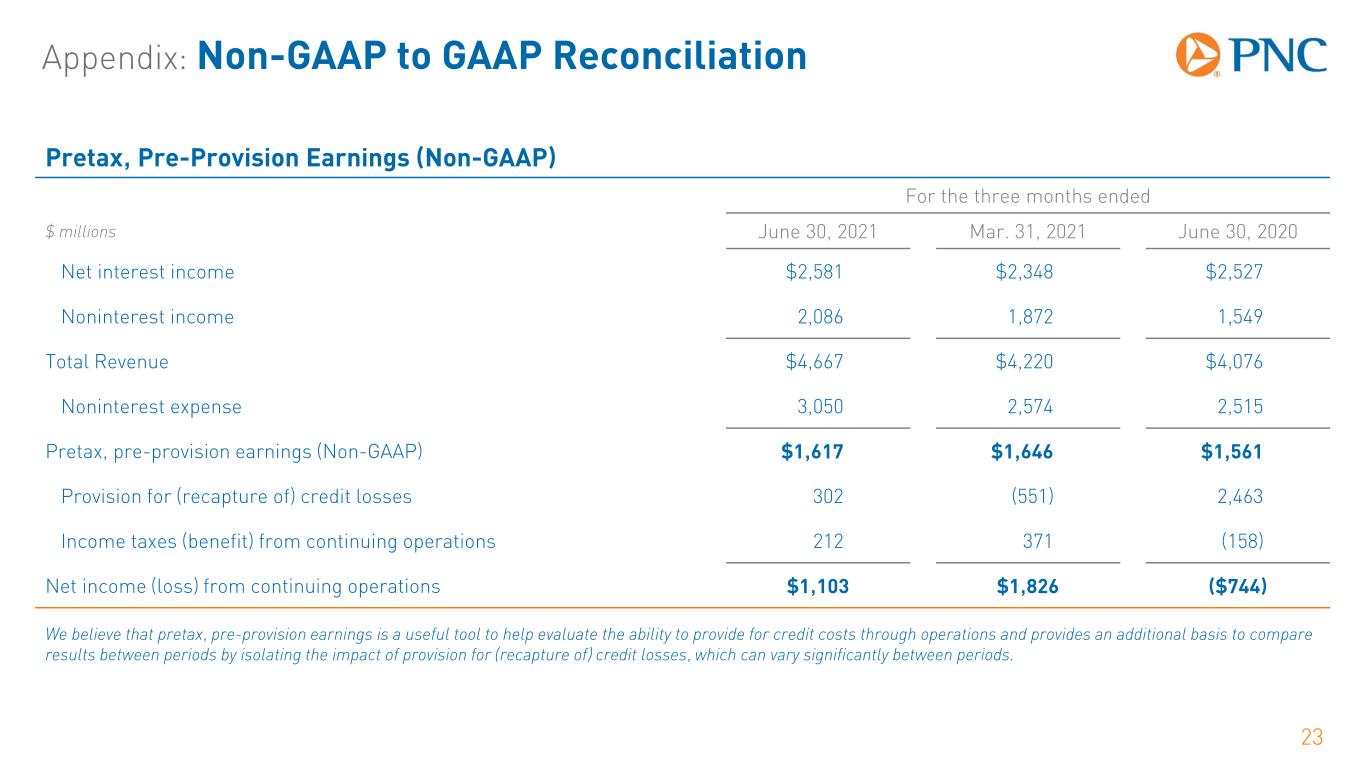
Appendix: Non-GAAP to GAAP Reconciliation 23 Pretax, Pre-Provision Earnings (Non-GAAP) For the three months ended $ millions June 30, 2021 Mar. 31, 2021 June 30, 2020 Net interest income $2,581 $2,348 $2,527 Noninterest income 2,086 1,872 1,549 Total Revenue $4,667 $4,220 $4,076 Noninterest expense 3,050 2,574 2,515 Pretax, pre-provision earnings (Non-GAAP) $1,617 $1,646 $1,561 Provision for (recapture of) credit losses 302 (551) 2,463 Income taxes (benefit) from continuing operations 212 371 (158) Net income (loss) from continuing operations $1,103 $1,826 ($744) We believe that pretax, pre-provision earnings is a useful tool to help evaluate the ability to provide for credit costs through operations and provides an additional basis to compare results between periods by isolating the impact of provision for (recapture of) credit losses, which can vary significantly between periods.
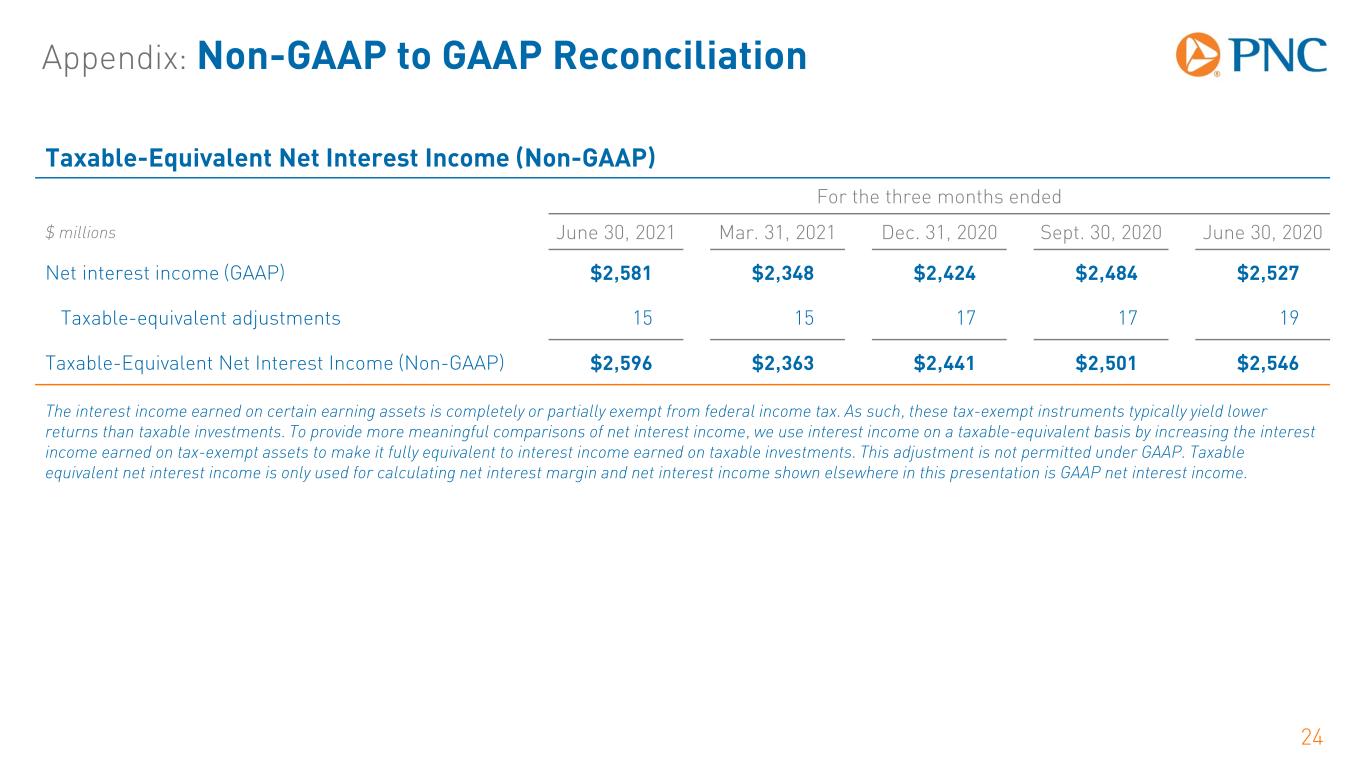
Appendix: Non-GAAP to GAAP Reconciliation 24 Taxable-Equivalent Net Interest Income (Non-GAAP) For the three months ended $ millions June 30, 2021 Mar. 31, 2021 Dec. 31, 2020 Sept. 30, 2020 June 30, 2020 Net interest income (GAAP) $2,581 $2,348 $2,424 $2,484 $2,527 Taxable-equivalent adjustments 15 15 17 17 19 Taxable-Equivalent Net Interest Income (Non-GAAP) $2,596 $2,363 $2,441 $2,501 $2,546 The interest income earned on certain earning assets is completely or partially exempt from federal income tax. As such, these tax-exempt instruments typically yield lower returns than taxable investments. To provide more meaningful comparisons of net interest income, we use interest income on a taxable-equivalent basis by increasing the interest income earned on tax-exempt assets to make it fully equivalent to interest income earned on taxable investments. This adjustment is not permitted under GAAP. Taxable equivalent net interest income is only used for calculating net interest margin and net interest income shown elsewhere in this presentation is GAAP net interest income.
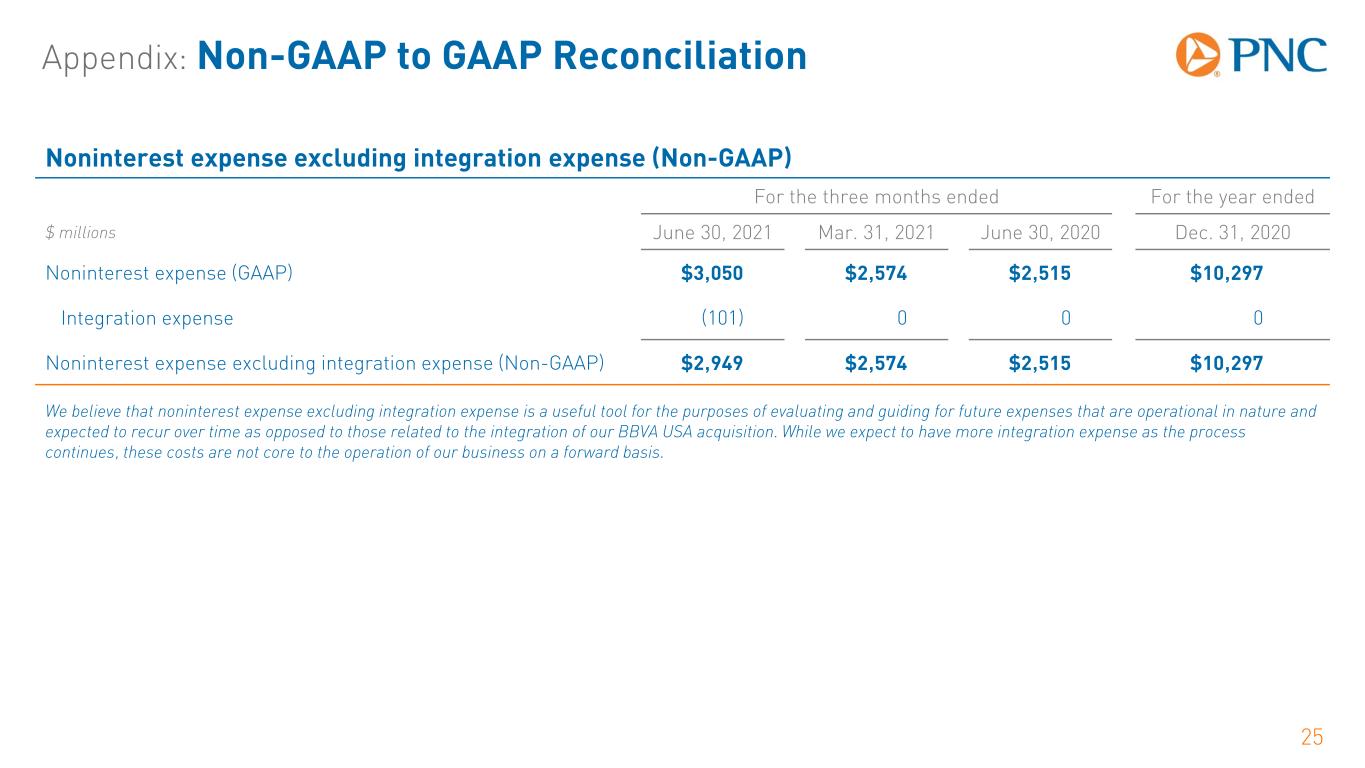
Appendix: Non-GAAP to GAAP Reconciliation 25 Noninterest expense excluding integration expense (Non-GAAP) For the three months ended For the year ended $ millions June 30, 2021 Mar. 31, 2021 June 30, 2020 Dec. 31, 2020 Noninterest expense (GAAP) $3,050 $2,574 $2,515 $10,297 Integration expense (101) 0 0 0 Noninterest expense excluding integration expense (Non-GAAP) $2,949 $2,574 $2,515 $10,297 We believe that noninterest expense excluding integration expense is a useful tool for the purposes of evaluating and guiding for future expenses that are operational in nature and expected to recur over time as opposed to those related to the integration of our BBVA USA acquisition. While we expect to have more integration expense as the process continues, these costs are not core to the operation of our business on a forward basis.
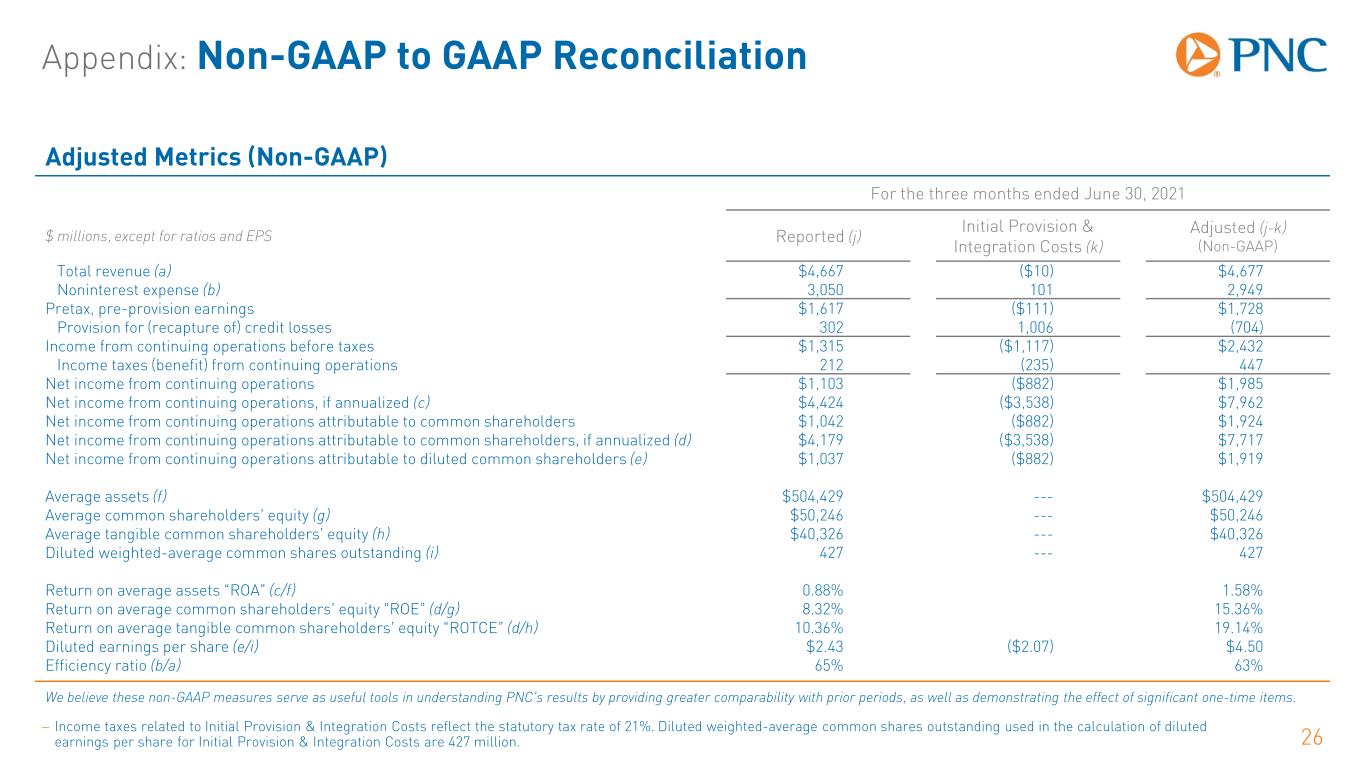
Appendix: Non-GAAP to GAAP Reconciliation 26 Adjusted Metrics (Non-GAAP) For the three months ended June 30, 2021 $ millions, except for ratios and EPS Reported (j) Initial Provision & Integration Costs (k) Adjusted (j-k) (Non-GAAP) Total revenue (a) $4,667 ($10) $4,677 Noninterest expense (b) 3,050 101 2,949 Pretax, pre-provision earnings $1,617 ($111) $1,728 Provision for (recapture of) credit losses 302 1,006 (704) Income from continuing operations before taxes $1,315 ($1,117) $2,432 Income taxes (benefit) from continuing operations 212 (235) 447 Net income from continuing operations $1,103 ($882) $1,985 Net income from continuing operations, if annualized (c) $4,424 ($3,538) $7,962 Net income from continuing operations attributable to common shareholders $1,042 ($882) $1,924 Net income from continuing operations attributable to common shareholders, if annualized (d) $4,179 ($3,538) $7,717 Net income from continuing operations attributable to diluted common shareholders (e) $1,037 ($882) $1,919 Average assets (f) $504,429 --- $504,429 Average common shareholders’ equity (g) $50,246 --- $50,246 Average tangible common shareholders’ equity (h) $40,326 --- $40,326 Diluted weighted-average common shares outstanding (i) 427 --- 427 Return on average assets “ROA” (c/f) 0.88% 1.58% Return on average common shareholders’ equity “ROE” (d/g) 8.32% 15.36% Return on average tangible common shareholders’ equity “ROTCE” (d/h) 10.36% 19.14% Diluted earnings per share (e/i) $2.43 ($2.07) $4.50 Efficiency ratio (b/a) 65% 63% We believe these non-GAAP measures serve as useful tools in understanding PNC's results by providing greater comparability with prior periods, as well as demonstrating the effect of significant one-time items. − Income taxes related to Initial Provision & Integration Costs reflect the statutory tax rate of 21%. Diluted weighted-average common shares outstanding used in the calculation of diluted earnings per share for Initial Provision & Integration Costs are 427 million.