EX-99.1
Published on February 26, 2021
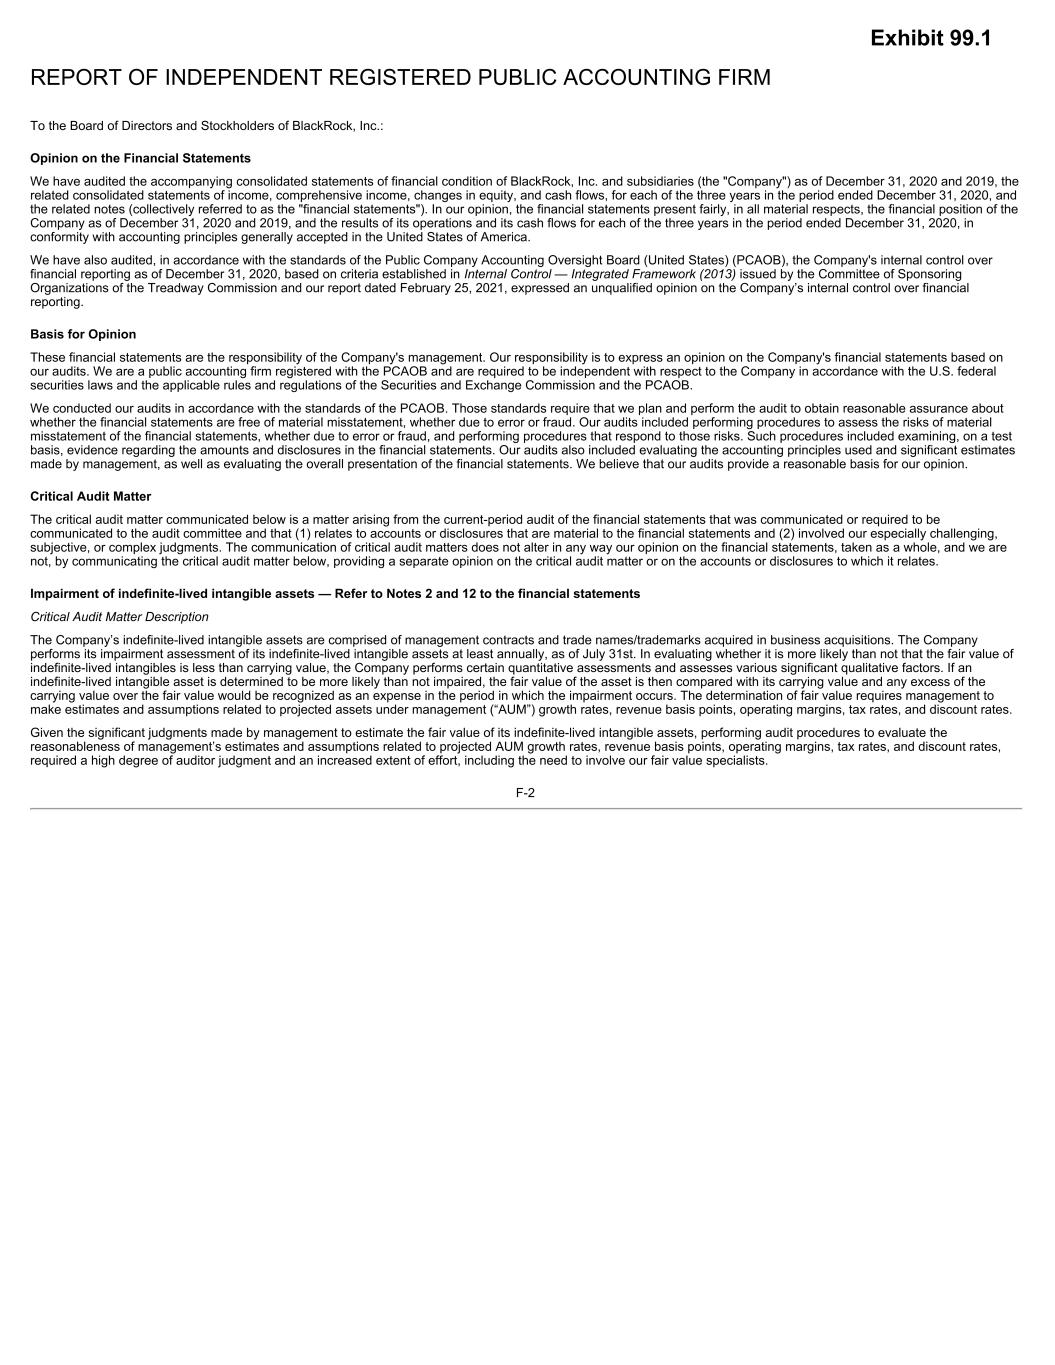
REPORT OF INDEPENDENT REGISTERED PUBLIC ACCOUNTING FIRM To the Board of Directors and Stockholders of BlackRock, Inc.: Opinion on the Financial Statements We have audited the accompanying consolidated statements of financial condition of BlackRock, Inc. and subsidiaries (the "Company") as of December 31, 2020 and 2019, the related consolidated statements of income, comprehensive income, changes in equity, and cash flows, for each of the three years in the period ended December 31, 2020, and the related notes (collectively referred to as the "financial statements"). In our opinion, the financial statements present fairly, in all material respects, the financial position of the Company as of December 31, 2020 and 2019, and the results of its operations and its cash flows for each of the three years in the period ended December 31, 2020, in conformity with accounting principles generally accepted in the United States of America. We have also audited, in accordance with the standards of the Public Company Accounting Oversight Board (United States) (PCAOB), the Company's internal control over financial reporting as of December 31, 2020, based on criteria established in Internal Control — Integrated Framework (2013) issued by the Committee of Sponsoring Organizations of the Treadway Commission and our report dated February 25, 2021, expressed an unqualified opinion on the Company’s internal control over financial reporting. Basis for Opinion These financial statements are the responsibility of the Company's management. Our responsibility is to express an opinion on the Company's financial statements based on our audits. We are a public accounting firm registered with the PCAOB and are required to be independent with respect to the Company in accordance with the U.S. federal securities laws and the applicable rules and regulations of the Securities and Exchange Commission and the PCAOB. We conducted our audits in accordance with the standards of the PCAOB. Those standards require that we plan and perform the audit to obtain reasonable assurance about whether the financial statements are free of material misstatement, whether due to error or fraud. Our audits included performing procedures to assess the risks of material misstatement of the financial statements, whether due to error or fraud, and performing procedures that respond to those risks. Such procedures included examining, on a test basis, evidence regarding the amounts and disclosures in the financial statements. Our audits also included evaluating the accounting principles used and significant estimates made by management, as well as evaluating the overall presentation of the financial statements. We believe that our audits provide a reasonable basis for our opinion. Critical Audit Matter The critical audit matter communicated below is a matter arising from the current-period audit of the financial statements that was communicated or required to be communicated to the audit committee and that (1) relates to accounts or disclosures that are material to the financial statements and (2) involved our especially challenging, subjective, or complex judgments. The communication of critical audit matters does not alter in any way our opinion on the financial statements, taken as a whole, and we are not, by communicating the critical audit matter below, providing a separate opinion on the critical audit matter or on the accounts or disclosures to which it relates. Impairment of indefinite-lived intangible assets — Refer to Notes 2 and 12 to the financial statements Critical Audit Matter Description The Company’s indefinite-lived intangible assets are comprised of management contracts and trade names/trademarks acquired in business acquisitions. The Company performs its impairment assessment of its indefinite-lived intangible assets at least annually, as of July 31st. In evaluating whether it is more likely than not that the fair value of indefinite-lived intangibles is less than carrying value, the Company performs certain quantitative assessments and assesses various significant qualitative factors. If an indefinite-lived intangible asset is determined to be more likely than not impaired, the fair value of the asset is then compared with its carrying value and any excess of the carrying value over the fair value would be recognized as an expense in the period in which the impairment occurs. The determination of fair value requires management to make estimates and assumptions related to projected assets under management (“AUM”) growth rates, revenue basis points, operating margins, tax rates, and discount rates. Given the significant judgments made by management to estimate the fair value of its indefinite-lived intangible assets, performing audit procedures to evaluate the reasonableness of management’s estimates and assumptions related to projected AUM growth rates, revenue basis points, operating margins, tax rates, and discount rates, required a high degree of auditor judgment and an increased extent of effort, including the need to involve our fair value specialists. F-2 Exhibit 99.1
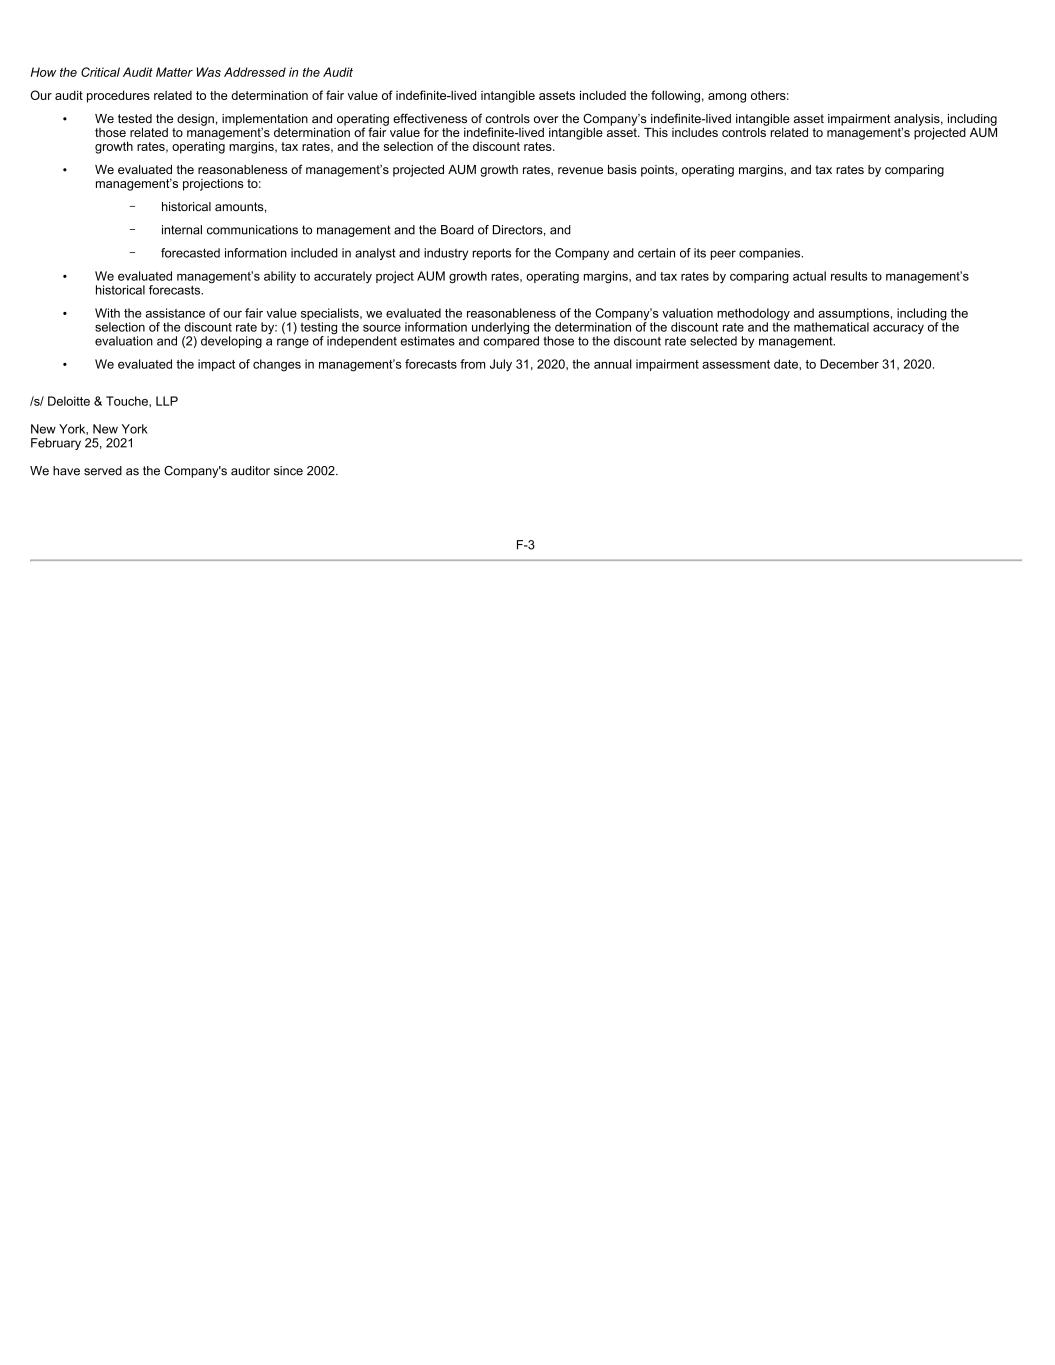
How the Critical Audit Matter Was Addressed in the Audit Our audit procedures related to the determination of fair value of indefinite-lived intangible assets included the following, among others: • We tested the design, implementation and operating effectiveness of controls over the Company’s indefinite-lived intangible asset impairment analysis, including those related to management’s determination of fair value for the indefinite-lived intangible asset. This includes controls related to management’s projected AUM growth rates, operating margins, tax rates, and the selection of the discount rates. • We evaluated the reasonableness of management’s projected AUM growth rates, revenue basis points, operating margins, and tax rates by comparing management’s projections to: - historical amounts, - internal communications to management and the Board of Directors, and - forecasted information included in analyst and industry reports for the Company and certain of its peer companies. • We evaluated management’s ability to accurately project AUM growth rates, operating margins, and tax rates by comparing actual results to management’s historical forecasts. • With the assistance of our fair value specialists, we evaluated the reasonableness of the Company’s valuation methodology and assumptions, including the selection of the discount rate by: (1) testing the source information underlying the determination of the discount rate and the mathematical accuracy of the evaluation and (2) developing a range of independent estimates and compared those to the discount rate selected by management. • We evaluated the impact of changes in management’s forecasts from July 31, 2020, the annual impairment assessment date, to December 31, 2020. /s/ Deloitte & Touche, LLP New York, New York February 25, 2021 We have served as the Company's auditor since 2002. F-3
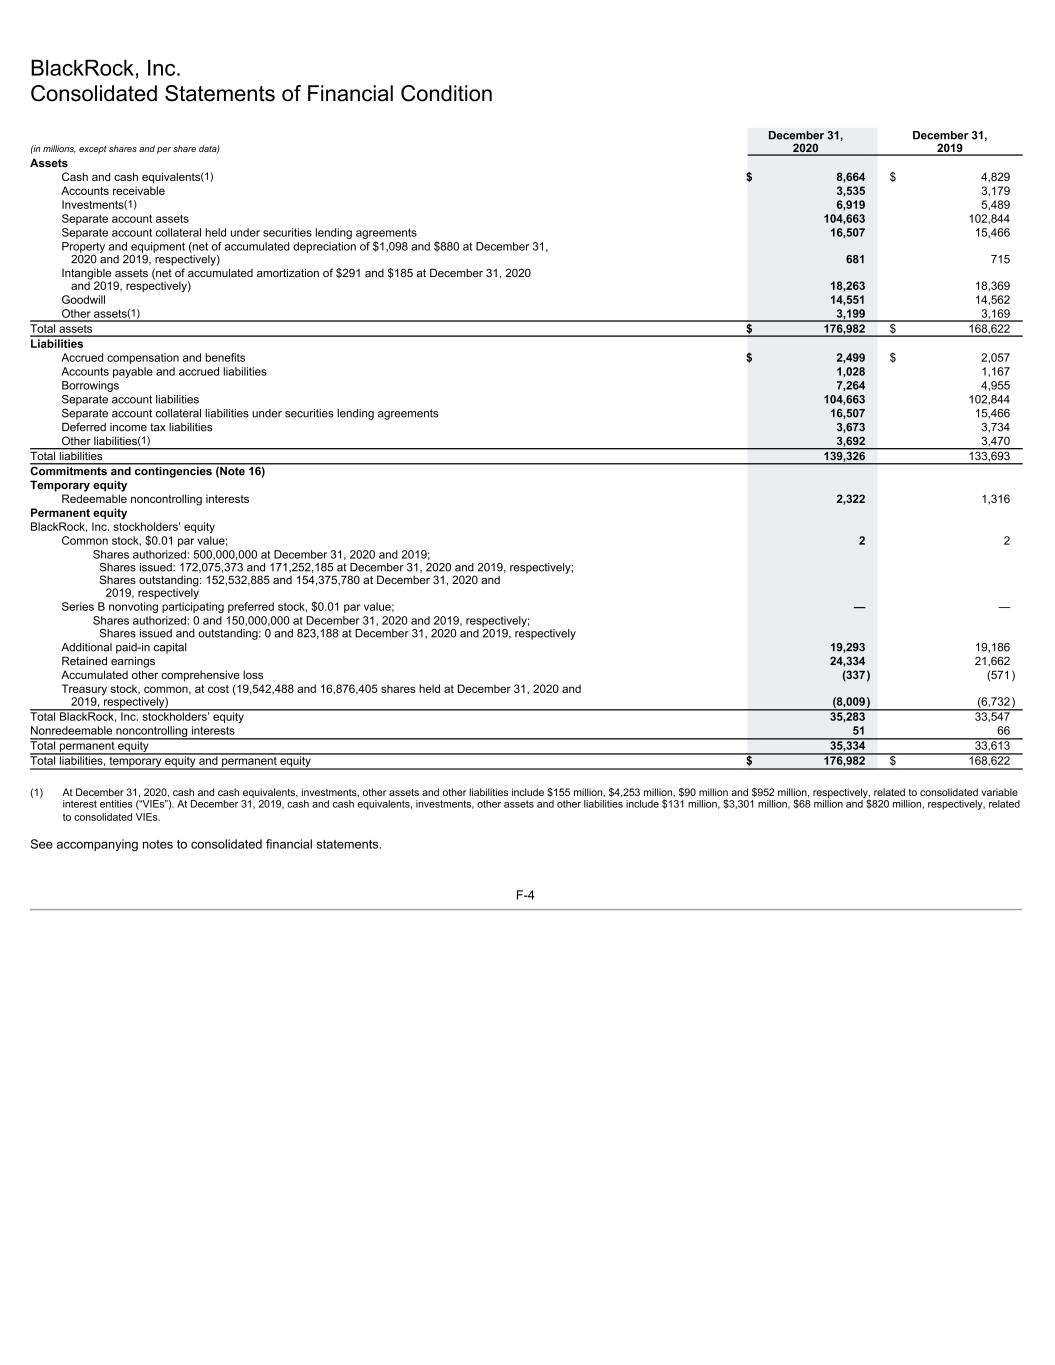
BlackRock, Inc. Consolidated Statements of Financial Condition (in millions, except shares and per share data) December 31, 2020 December 31, 2019 Assets Cash and cash equivalents(1) $ 8,664 $ 4,829 Accounts receivable 3,535 3,179 Investments(1) 6,919 5,489 Separate account assets 104,663 102,844 Separate account collateral held under securities lending agreements 16,507 15,466 Property and equipment (net of accumulated depreciation of $1,098 and $880 at December 31, 2020 and 2019, respectively) 681 715 Intangible assets (net of accumulated amortization of $291 and $185 at December 31, 2020 and 2019, respectively) 18,263 18,369 Goodwill 14,551 14,562 Other assets(1) 3,199 3,169 Total assets $ 176,982 $ 168,622 Liabilities Accrued compensation and benefits $ 2,499 $ 2,057 Accounts payable and accrued liabilities 1,028 1,167 Borrowings 7,264 4,955 Separate account liabilities 104,663 102,844 Separate account collateral liabilities under securities lending agreements 16,507 15,466 Deferred income tax liabilities 3,673 3,734 Other liabilities(1) 3,692 3,470 Total liabilities 139,326 133,693 Commitments and contingencies (Note 16) Temporary equity Redeemable noncontrolling interests 2,322 1,316 Permanent equity BlackRock, Inc. stockholders’ equity Common stock, $0.01 par value; 2 2 Shares authorized: 500,000,000 at December 31, 2020 and 2019; Shares issued: 172,075,373 and 171,252,185 at December 31, 2020 and 2019, respectively; Shares outstanding: 152,532,885 and 154,375,780 at December 31, 2020 and 2019, respectively Series B nonvoting participating preferred stock, $0.01 par value; — — Shares authorized: 0 and 150,000,000 at December 31, 2020 and 2019, respectively; Shares issued and outstanding: 0 and 823,188 at December 31, 2020 and 2019, respectively Additional paid-in capital 19,293 19,186 Retained earnings 24,334 21,662 Accumulated other comprehensive loss (337) (571) Treasury stock, common, at cost (19,542,488 and 16,876,405 shares held at December 31, 2020 and 2019, respectively) (8,009) (6,732) Total BlackRock, Inc. stockholders’ equity 35,283 33,547 Nonredeemable noncontrolling interests 51 66 Total permanent equity 35,334 33,613 Total liabilities, temporary equity and permanent equity $ 176,982 $ 168,622 (1) At December 31, 2020, cash and cash equivalents, investments, other assets and other liabilities include $155 million, $4,253 million, $90 million and $952 million, respectively, related to consolidated variable interest entities (“VIEs”). At December 31, 2019, cash and cash equivalents, investments, other assets and other liabilities include $131 million, $3,301 million, $68 million and $820 million, respectively, related to consolidated VIEs. See accompanying notes to consolidated financial statements. F-4
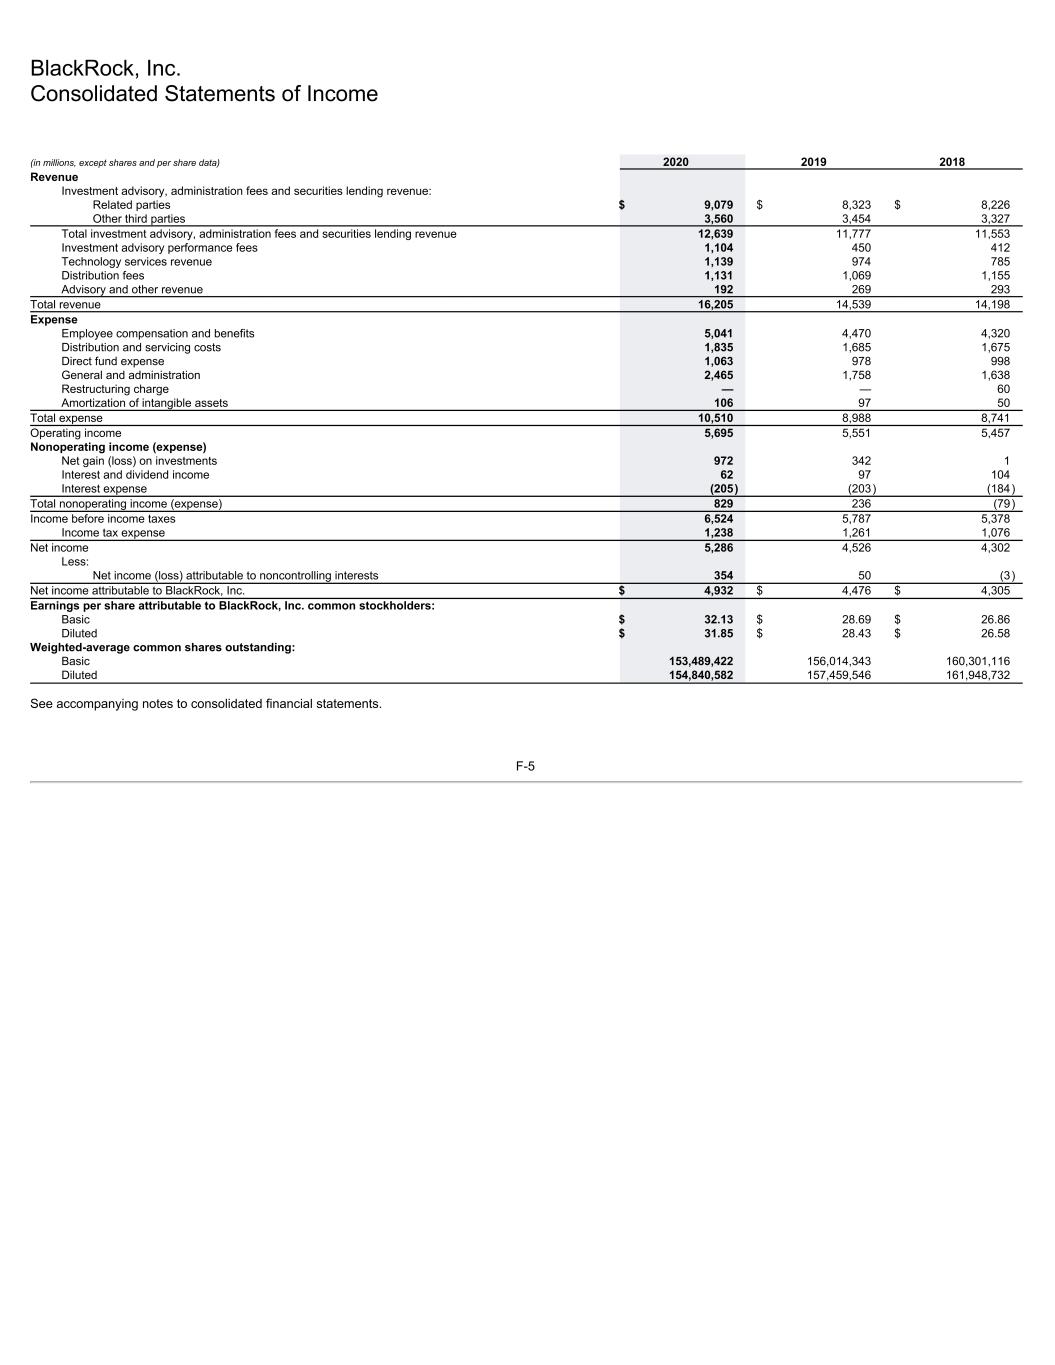
BlackRock, Inc. Consolidated Statements of Income (in millions, except shares and per share data) 2020 2019 2018 Revenue Investment advisory, administration fees and securities lending revenue: Related parties $ 9,079 $ 8,323 $ 8,226 Other third parties 3,560 3,454 3,327 Total investment advisory, administration fees and securities lending revenue 12,639 11,777 11,553 Investment advisory performance fees 1,104 450 412 Technology services revenue 1,139 974 785 Distribution fees 1,131 1,069 1,155 Advisory and other revenue 192 269 293 Total revenue 16,205 14,539 14,198 Expense Employee compensation and benefits 5,041 4,470 4,320 Distribution and servicing costs 1,835 1,685 1,675 Direct fund expense 1,063 978 998 General and administration 2,465 1,758 1,638 Restructuring charge — — 60 Amortization of intangible assets 106 97 50 Total expense 10,510 8,988 8,741 Operating income 5,695 5,551 5,457 Nonoperating income (expense) Net gain (loss) on investments 972 342 1 Interest and dividend income 62 97 104 Interest expense (205) (203) (184) Total nonoperating income (expense) 829 236 (79) Income before income taxes 6,524 5,787 5,378 Income tax expense 1,238 1,261 1,076 Net income 5,286 4,526 4,302 Less: Net income (loss) attributable to noncontrolling interests 354 50 (3) Net income attributable to BlackRock, Inc. $ 4,932 $ 4,476 $ 4,305 Earnings per share attributable to BlackRock, Inc. common stockholders: Basic $ 32.13 $ 28.69 $ 26.86 Diluted $ 31.85 $ 28.43 $ 26.58 Weighted-average common shares outstanding: Basic 153,489,422 156,014,343 160,301,116 Diluted 154,840,582 157,459,546 161,948,732 See accompanying notes to consolidated financial statements. F-5

BlackRock, Inc. Consolidated Statements of Comprehensive Income (in millions) 2020 2019 2018 Net income $ 5,286 $ 4,526 $ 4,302 Other comprehensive income (loss): Foreign currency translation adjustments(1) 234 120 (253) Other comprehensive income (loss) 234 120 (253) Comprehensive income 5,520 4,646 4,049 Less: Comprehensive income (loss) attributable to noncontrolling interests 354 50 (3) Comprehensive income attributable to BlackRock, Inc. $ 5,166 $ 4,596 $ 4,052 (1) Amount for 2020 includes a loss from a net investment hedge of $54 million (net of tax benefit of $17 million). Amounts for 2019 and 2018 include gains from a net investment hedge of $11 million (net of tax expense of $3 million) and $30 million (net of tax expense of $10 million), respectively. See accompanying notes to consolidated financial statements. F-6
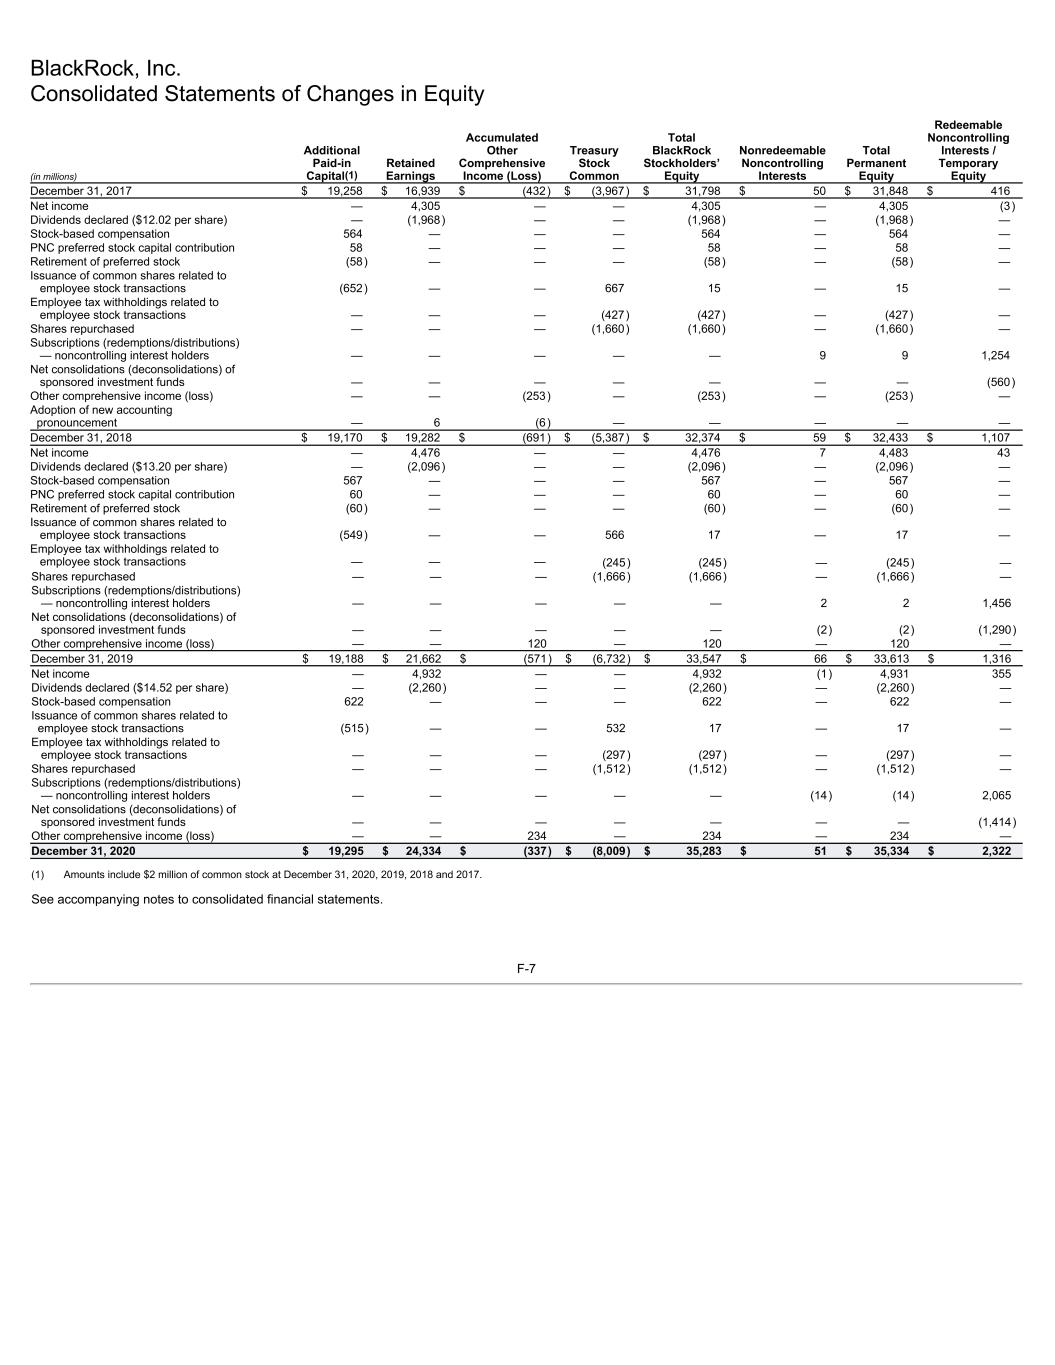
BlackRock, Inc. Consolidated Statements of Changes in Equity (in millions) Additional Paid-in Capital(1) Retained Earnings Accumulated Other Comprehensive Income (Loss) Treasury Stock Common Total BlackRock Stockholders’ Equity Nonredeemable Noncontrolling Interests Total Permanent Equity Redeemable Noncontrolling Interests / Temporary Equity December 31, 2017 $ 19,258 $ 16,939 $ (432) $ (3,967) $ 31,798 $ 50 $ 31,848 $ 416 Net income — 4,305 — — 4,305 — 4,305 (3) Dividends declared ($12.02 per share) — (1,968) — — (1,968) — (1,968) — Stock-based compensation 564 — — — 564 — 564 — PNC preferred stock capital contribution 58 — — — 58 — 58 — Retirement of preferred stock (58) — — — (58) — (58) — Issuance of common shares related to employee stock transactions (652) — — 667 15 — 15 — Employee tax withholdings related to employee stock transactions — — — (427) (427) — (427) — Shares repurchased — — — (1,660) (1,660) — (1,660) — Subscriptions (redemptions/distributions) — noncontrolling interest holders — — — — — 9 9 1,254 Net consolidations (deconsolidations) of sponsored investment funds — — — — — — — (560) Other comprehensive income (loss) — — (253) — (253) — (253) — Adoption of new accounting pronouncement — 6 (6) — — — — — December 31, 2018 $ 19,170 $ 19,282 $ (691) $ (5,387) $ 32,374 $ 59 $ 32,433 $ 1,107 Net income — 4,476 — — 4,476 7 4,483 43 Dividends declared ($13.20 per share) — (2,096) — — (2,096) — (2,096) — Stock-based compensation 567 — — — 567 — 567 — PNC preferred stock capital contribution 60 — — — 60 — 60 — Retirement of preferred stock (60) — — — (60) — (60) — Issuance of common shares related to employee stock transactions (549) — — 566 17 — 17 — Employee tax withholdings related to employee stock transactions — — — (245) (245) — (245) — Shares repurchased — — — (1,666) (1,666) — (1,666) — Subscriptions (redemptions/distributions) — noncontrolling interest holders — — — — — 2 2 1,456 Net consolidations (deconsolidations) of sponsored investment funds — — — — — (2) (2) (1,290) Other comprehensive income (loss) — — 120 — 120 — 120 — December 31, 2019 $ 19,188 $ 21,662 $ (571) $ (6,732) $ 33,547 $ 66 $ 33,613 $ 1,316 Net income — 4,932 — — 4,932 (1) 4,931 355 Dividends declared ($14.52 per share) — (2,260) — — (2,260) — (2,260) — Stock-based compensation 622 — — — 622 — 622 — Issuance of common shares related to employee stock transactions (515) — — 532 17 — 17 — Employee tax withholdings related to employee stock transactions — — — (297) (297) — (297) — Shares repurchased — — — (1,512) (1,512) — (1,512) — Subscriptions (redemptions/distributions) — noncontrolling interest holders — — — — — (14) (14) 2,065 Net consolidations (deconsolidations) of sponsored investment funds — — — — — — — (1,414) Other comprehensive income (loss) — — 234 — 234 — 234 — December 31, 2020 $ 19,295 $ 24,334 $ (337) $ (8,009) $ 35,283 $ 51 $ 35,334 $ 2,322 (1) Amounts include $2 million of common stock at December 31, 2020, 2019, 2018 and 2017. See accompanying notes to consolidated financial statements. F-7
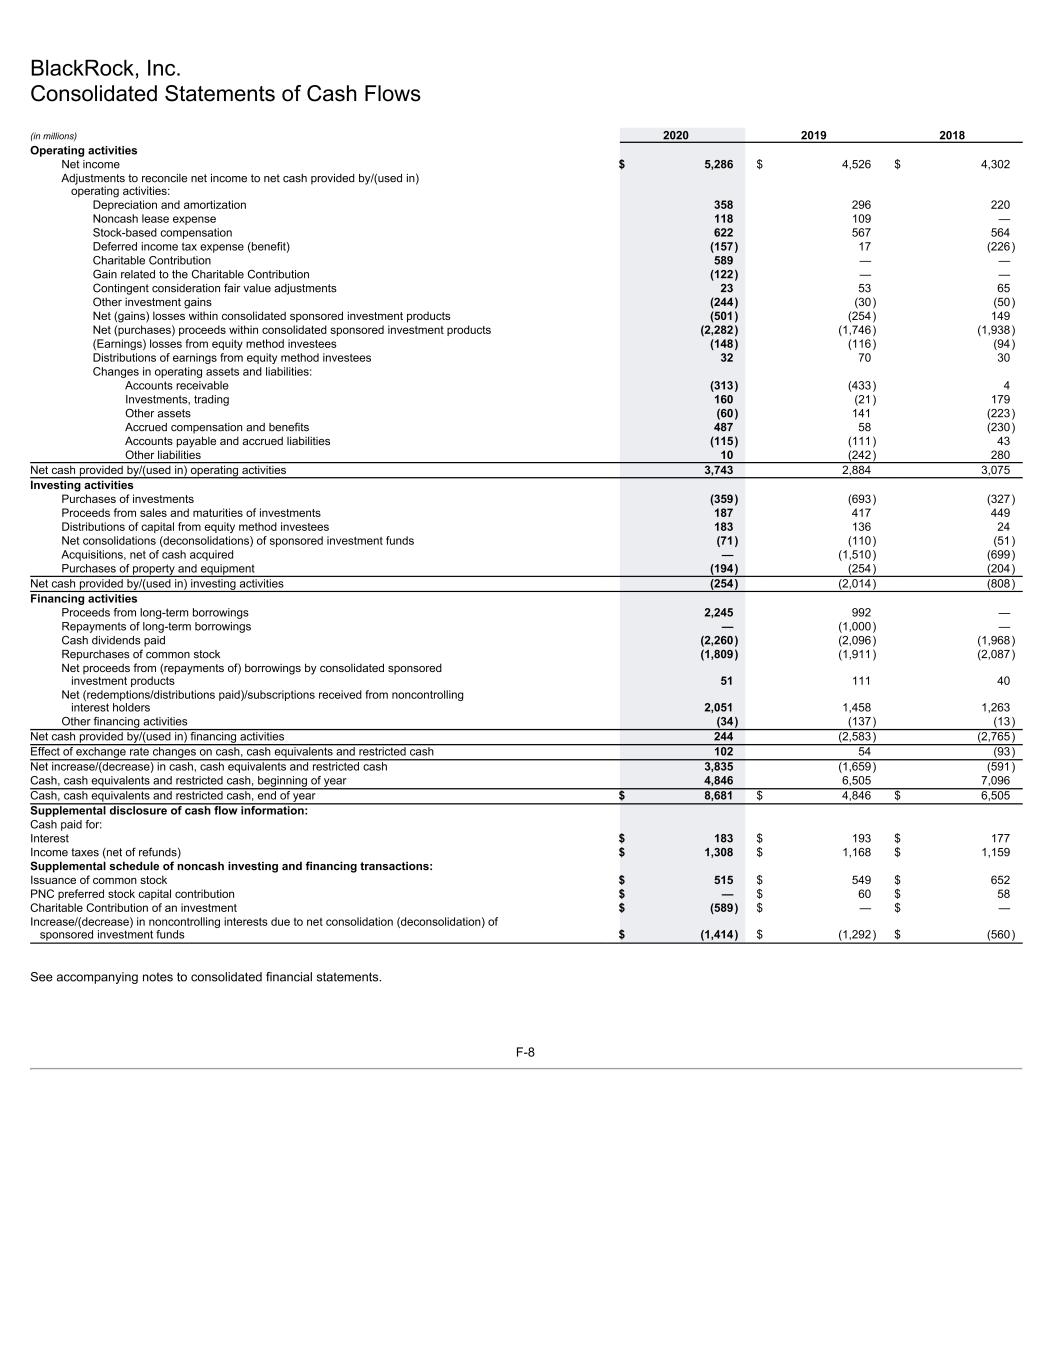
BlackRock, Inc. Consolidated Statements of Cash Flows (in millions) 2020 2019 2018 Operating activities Net income $ 5,286 $ 4,526 $ 4,302 Adjustments to reconcile net income to net cash provided by/(used in) operating activities: Depreciation and amortization 358 296 220 Noncash lease expense 118 109 — Stock-based compensation 622 567 564 Deferred income tax expense (benefit) (157) 17 (226) Charitable Contribution 589 — — Gain related to the Charitable Contribution (122) — — Contingent consideration fair value adjustments 23 53 65 Other investment gains (244) (30) (50) Net (gains) losses within consolidated sponsored investment products (501) (254) 149 Net (purchases) proceeds within consolidated sponsored investment products (2,282) (1,746) (1,938) (Earnings) losses from equity method investees (148) (116) (94) Distributions of earnings from equity method investees 32 70 30 Changes in operating assets and liabilities: Accounts receivable (313) (433) 4 Investments, trading 160 (21) 179 Other assets (60) 141 (223) Accrued compensation and benefits 487 58 (230) Accounts payable and accrued liabilities (115) (111) 43 Other liabilities 10 (242) 280 Net cash provided by/(used in) operating activities 3,743 2,884 3,075 Investing activities Purchases of investments (359) (693) (327) Proceeds from sales and maturities of investments 187 417 449 Distributions of capital from equity method investees 183 136 24 Net consolidations (deconsolidations) of sponsored investment funds (71) (110) (51) Acquisitions, net of cash acquired — (1,510) (699) Purchases of property and equipment (194) (254) (204) Net cash provided by/(used in) investing activities (254) (2,014) (808) Financing activities Proceeds from long-term borrowings 2,245 992 — Repayments of long-term borrowings — (1,000) — Cash dividends paid (2,260) (2,096) (1,968) Repurchases of common stock (1,809) (1,911) (2,087) Net proceeds from (repayments of) borrowings by consolidated sponsored investment products 51 111 40 Net (redemptions/distributions paid)/subscriptions received from noncontrolling interest holders 2,051 1,458 1,263 Other financing activities (34) (137) (13) Net cash provided by/(used in) financing activities 244 (2,583) (2,765) Effect of exchange rate changes on cash, cash equivalents and restricted cash 102 54 (93) Net increase/(decrease) in cash, cash equivalents and restricted cash 3,835 (1,659) (591) Cash, cash equivalents and restricted cash, beginning of year 4,846 6,505 7,096 Cash, cash equivalents and restricted cash, end of year $ 8,681 $ 4,846 $ 6,505 Supplemental disclosure of cash flow information: Cash paid for: Interest $ 183 $ 193 $ 177 Income taxes (net of refunds) $ 1,308 $ 1,168 $ 1,159 Supplemental schedule of noncash investing and financing transactions: Issuance of common stock $ 515 $ 549 $ 652 PNC preferred stock capital contribution $ — $ 60 $ 58 Charitable Contribution of an investment $ (589) $ — $ — Increase/(decrease) in noncontrolling interests due to net consolidation (deconsolidation) of sponsored investment funds $ (1,414) $ (1,292) $ (560) See accompanying notes to consolidated financial statements. F-8
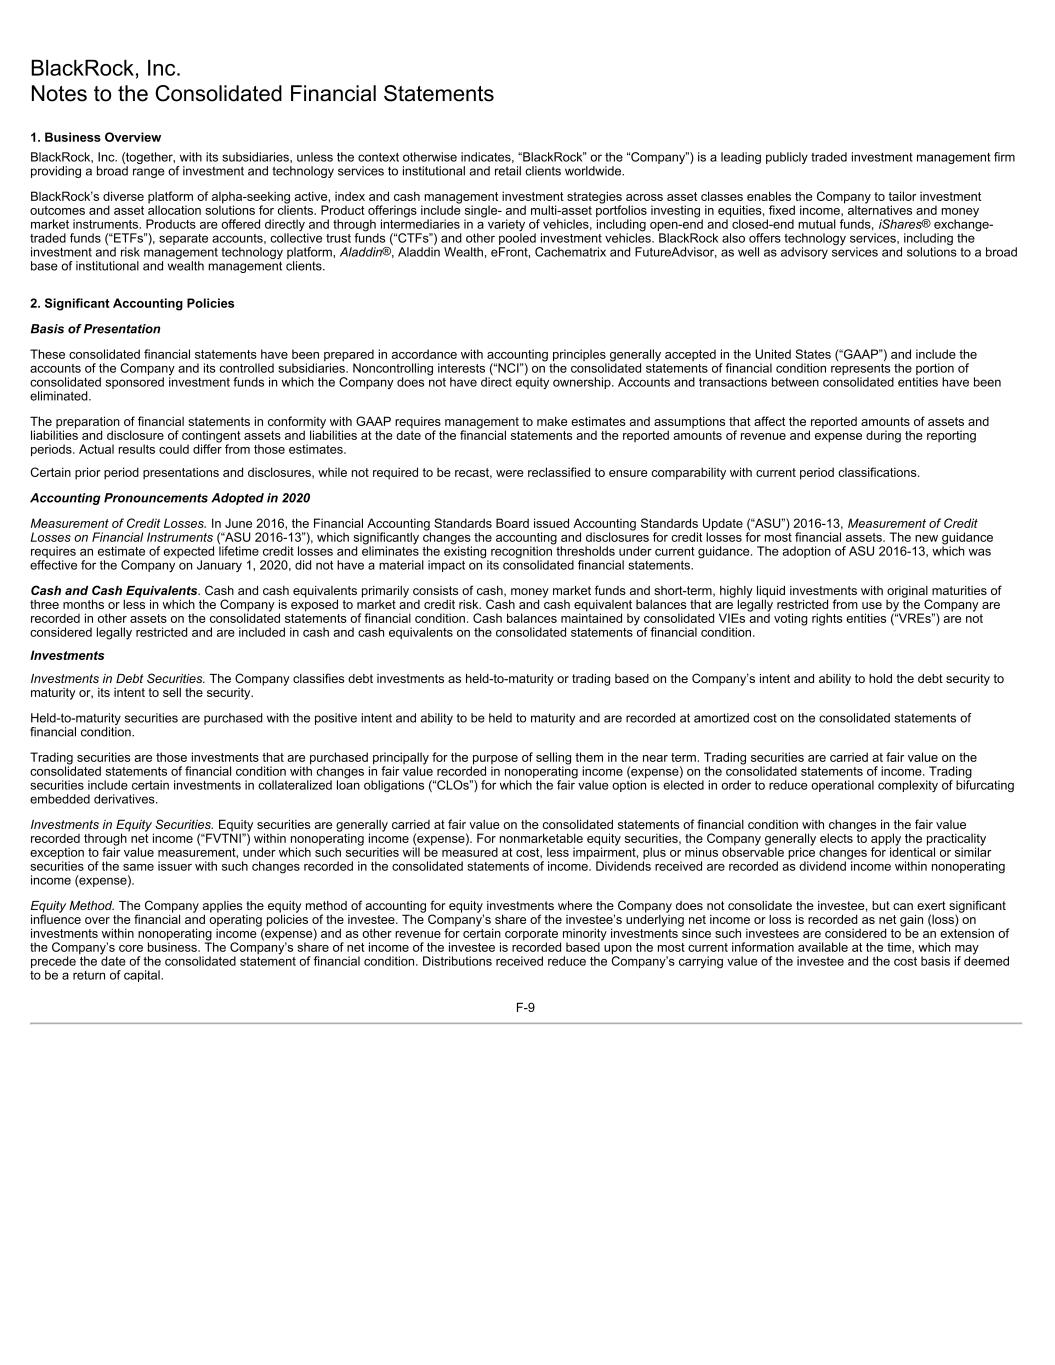
BlackRock, Inc. Notes to the Consolidated Financial Statements 1. Business Overview BlackRock, Inc. (together, with its subsidiaries, unless the context otherwise indicates, “BlackRock” or the “Company”) is a leading publicly traded investment management firm providing a broad range of investment and technology services to institutional and retail clients worldwide. BlackRock’s diverse platform of alpha-seeking active, index and cash management investment strategies across asset classes enables the Company to tailor investment outcomes and asset allocation solutions for clients. Product offerings include single- and multi-asset portfolios investing in equities, fixed income, alternatives and money market instruments. Products are offered directly and through intermediaries in a variety of vehicles, including open-end and closed-end mutual funds, iShares® exchange- traded funds (“ETFs”), separate accounts, collective trust funds (“CTFs”) and other pooled investment vehicles. BlackRock also offers technology services, including the investment and risk management technology platform, Aladdin®, Aladdin Wealth, eFront, Cachematrix and FutureAdvisor, as well as advisory services and solutions to a broad base of institutional and wealth management clients. 2. Significant Accounting Policies Basis of Presentation These consolidated financial statements have been prepared in accordance with accounting principles generally accepted in the United States (“GAAP”) and include the accounts of the Company and its controlled subsidiaries. Noncontrolling interests (“NCI”) on the consolidated statements of financial condition represents the portion of consolidated sponsored investment funds in which the Company does not have direct equity ownership. Accounts and transactions between consolidated entities have been eliminated. The preparation of financial statements in conformity with GAAP requires management to make estimates and assumptions that affect the reported amounts of assets and liabilities and disclosure of contingent assets and liabilities at the date of the financial statements and the reported amounts of revenue and expense during the reporting periods. Actual results could differ from those estimates. Certain prior period presentations and disclosures, while not required to be recast, were reclassified to ensure comparability with current period classifications. Accounting Pronouncements Adopted in 2020 Measurement of Credit Losses. In June 2016, the Financial Accounting Standards Board issued Accounting Standards Update (“ASU”) 2016-13, Measurement of Credit Losses on Financial Instruments (“ASU 2016-13”), which significantly changes the accounting and disclosures for credit losses for most financial assets. The new guidance requires an estimate of expected lifetime credit losses and eliminates the existing recognition thresholds under current guidance. The adoption of ASU 2016-13, which was effective for the Company on January 1, 2020, did not have a material impact on its consolidated financial statements. Cash and Cash Equivalents. Cash and cash equivalents primarily consists of cash, money market funds and short-term, highly liquid investments with original maturities of three months or less in which the Company is exposed to market and credit risk. Cash and cash equivalent balances that are legally restricted from use by the Company are recorded in other assets on the consolidated statements of financial condition. Cash balances maintained by consolidated VIEs and voting rights entities (“VREs”) are not considered legally restricted and are included in cash and cash equivalents on the consolidated statements of financial condition. Investments Investments in Debt Securities. The Company classifies debt investments as held-to-maturity or trading based on the Company’s intent and ability to hold the debt security to maturity or, its intent to sell the security. Held-to-maturity securities are purchased with the positive intent and ability to be held to maturity and are recorded at amortized cost on the consolidated statements of financial condition. Trading securities are those investments that are purchased principally for the purpose of selling them in the near term. Trading securities are carried at fair value on the consolidated statements of financial condition with changes in fair value recorded in nonoperating income (expense) on the consolidated statements of income. Trading securities include certain investments in collateralized loan obligations (“CLOs”) for which the fair value option is elected in order to reduce operational complexity of bifurcating embedded derivatives. Investments in Equity Securities. Equity securities are generally carried at fair value on the consolidated statements of financial condition with changes in the fair value recorded through net income (“FVTNI”) within nonoperating income (expense). For nonmarketable equity securities, the Company generally elects to apply the practicality exception to fair value measurement, under which such securities will be measured at cost, less impairment, plus or minus observable price changes for identical or similar securities of the same issuer with such changes recorded in the consolidated statements of income. Dividends received are recorded as dividend income within nonoperating income (expense). Equity Method. The Company applies the equity method of accounting for equity investments where the Company does not consolidate the investee, but can exert significant influence over the financial and operating policies of the investee. The Company’s share of the investee’s underlying net income or loss is recorded as net gain (loss) on investments within nonoperating income (expense) and as other revenue for certain corporate minority investments since such investees are considered to be an extension of the Company’s core business. The Company’s share of net income of the investee is recorded based upon the most current information available at the time, which may precede the date of the consolidated statement of financial condition. Distributions received reduce the Company’s carrying value of the investee and the cost basis if deemed to be a return of capital. F-9

Impairments of Investments. Management periodically assesses equity method and held-to-maturity investments for other-than-temporary impairment (“OTTI”). If an OTTI exists, an impairment charge would be recorded for the excess of the carrying amount of the investment over its estimated fair value in the consolidated statements of income. For equity method investments and held-to-maturity investments, if circumstances indicate that an OTTI may exist, the investments are evaluated using market values, where available, or the expected future cash flows of the investment. For the Company’s investments in CLOs, the Company reviews cash flow estimates over the life of each CLO investment. On a quarterly basis, if the present value of the estimated future cash flows is lower than the carrying value of the investment and there is an adverse change in estimated cash flows, an impairment is considered to be other- than-temporary. In addition, for nonmarketable equity securities that are accounted for under the measurement alternative to fair value, the Company applies the impairment model that does not require the Company to consider whether the impairment is other-than-temporary. Consolidation. The Company performs an analysis for investment products to determine if the product is a VIE or a VRE. Assessing whether an entity is a VIE or a VRE involves judgment and analysis. Factors considered in this assessment include the entity’s legal organization, the entity’s capital structure and equity ownership, and any related party or de facto agent implications of the Company’s involvement with the entity. Investments that are determined to be VIEs are consolidated if the Company is the primary beneficiary (“PB”) of the entity. VREs are typically consolidated if the Company holds the majority voting interest. Upon the occurrence of certain events (such as contributions and redemptions, either by the Company, or third parties, or amendments to the governing documents of the Company’s investment products), management reviews and reconsiders its previous conclusion regarding the status of an entity as a VIE or a VRE. Additionally, management continually reconsiders whether the Company is deemed to be a VIE’s PB that consolidates such entity. Consolidation of Variable Interest Entities. Certain investment products for which a controlling financial interest is achieved through arrangements that do not involve or are not directly linked to voting interests are deemed VIEs. BlackRock reviews factors, including whether or not i) the entity has equity at risk that is sufficient to permit the entity to finance its activities without additional subordinated support from other parties and ii) the equity holders at risk have the obligation to absorb losses, the right to receive residual returns, and the right to direct the activities of the entity that most significantly impact the entity’s economic performance, to determine if the investment product is a VIE. BlackRock re-evaluates such factors as facts and circumstances change. The PB of a VIE is defined as the variable interest holder that has a controlling financial interest in the VIE. A controlling financial interest is defined as (i) the power to direct the activities of the VIE that most significantly impact its economic performance and (ii) the obligation to absorb losses of the entity or the right to receive benefits from the entity that potentially could be significant to the VIE. The Company generally consolidates VIEs in which it holds an economic interest of 10% or greater and deconsolidates such VIEs once equity ownership falls below 10%. Consolidation of Voting Rights Entities. BlackRock is required to consolidate an investee to the extent that BlackRock can exert control over the financial and operating policies of the investee, which generally exists if there is a greater than 50% voting equity interest. Retention of Specialized Investment Company Accounting Principles. Upon consolidation of sponsored investment funds, the Company retains the specialized investment company accounting principles of the underlying funds. All of the underlying investments held by such consolidated sponsored investment funds are carried at fair value with corresponding changes in the investments’ fair values reflected in nonoperating income (expense) on the consolidated statements of income. When the Company no longer controls these funds due to reduced ownership percentage or other reasons, the funds are deconsolidated and accounted for as an equity method investment or equity securities FVTNI if the Company still maintains an investment. Separate Account Assets and Liabilities. Separate account assets are maintained by BlackRock Life Limited, a wholly owned subsidiary of the Company, which is a registered life insurance company in the United Kingdom, and represent segregated assets held for purposes of funding individual and group pension contracts. The life insurance company does not underwrite any insurance contracts that involve any insurance risk transfer from the insured to the life insurance company. The separate account assets primarily include equity securities, debt securities, money market funds and derivatives. The separate account assets are not subject to general claims of the creditors of BlackRock. These separate account assets and the related equal and offsetting liabilities are recorded as separate account assets and separate account liabilities on the consolidated statements of financial condition. The net investment income attributable to separate account assets supporting individual and group pension contracts accrues directly to the contract owner and is not reported on the consolidated statements of income. While BlackRock has no economic interest in these separate account assets and liabilities, BlackRock earns policy administration and management fees associated with these products, which are included in investment advisory, administration fees and securities lending revenue on the consolidated statements of income. Separate Account Collateral Assets Held and Liabilities Under Securities Lending Agreements. The Company facilitates securities lending arrangements whereby securities held by separate accounts maintained by BlackRock Life Limited are lent to third parties under global master securities lending agreements. In exchange, the Company receives legal title to the collateral with minimum values generally ranging from approximately 102% to 112% of the value of the securities lent in order to reduce counterparty risk. The required collateral value is calculated on a daily basis. The global master securities lending agreements provide the Company the right to request additional collateral or, in the event of borrower default, the right to liquidate collateral. The securities lending transactions entered into by the Company are accompanied by an agreement that entitles the Company to request the borrower to return the securities at any time; therefore, these transactions are not reported as sales. The Company records on the consolidated statements of financial condition the cash and noncash collateral received under these BlackRock Life Limited securities lending arrangements as its own asset in addition to an equal and offsetting collateral liability for the obligation to return the collateral. The securities lending revenue earned from lending securities held by the separate accounts is included in investment advisory, administration fees and securities lending revenue on the consolidated statements of income. During 2020 and 2019, the Company had not resold or repledged any of the collateral received under these arrangements. At December 31, 2020 and 2019, the fair value of loaned F-10

securities held by separate accounts was approximately $15.2 billion and $14.4 billion, respectively, and the fair value of the collateral held under these securities lending agreements was approximately $16.5 billion and $15.5 billion, respectively. Property and Equipment. Property and equipment are recorded at cost less accumulated depreciation. Depreciation is generally determined by cost less any estimated residual value using the straight-line method over the estimated useful lives of the various classes of property and equipment. Leasehold improvements are amortized using the straight-line method over the shorter of the estimated useful life or the remaining lease term. The Company capitalizes certain costs incurred in connection with developing or obtaining software within property and equipment. Capitalized software costs are amortized, beginning when the software product is ready for its intended use, over the estimated useful life of the software of approximately three years. Goodwill and Intangible Assets. Goodwill represents the cost of a business acquisition in excess of the fair value of the net assets acquired. The Company has determined that it has one reporting unit for goodwill impairment testing purposes, the consolidated BlackRock single operating segment, which is consistent with internal management reporting and management's oversight of operations. In its assessment of goodwill for impairment, the Company considers such factors as the book value and market capitalization of the Company. On a quarterly basis, the Company considers if triggering events have occurred that may indicate a potential goodwill impairment. If a triggering event has occurred, the Company performs assessments, which may include reviews of significant valuation assumptions, to determine if goodwill may be impaired. The Company performs an impairment assessment of its goodwill at least annually, as of July 31st. Intangible assets are comprised of indefinite-lived intangible assets and finite-lived intangible assets acquired in a business acquisition. The value of contracts to manage assets in proprietary open-end funds and collective trust funds and certain other commingled products without a specified termination date is generally classified as indefinite- lived intangible assets. The assignment of indefinite lives to such contracts primarily is based upon the following: (i) the assumption that there is no foreseeable limit on the contract period to manage these products; (ii) the Company expects to, and has the ability to, continue to operate these products indefinitely; (iii) the products have multiple investors and are not reliant on a single investor or small group of investors for their continued operation; (iv) current competitive factors and economic conditions do not indicate a finite life; and (v) there is a high likelihood of continued renewal based on historical experience. In addition, trade names/trademarks are considered indefinite-lived intangible assets when they are expected to generate cash flows indefinitely. Indefinite-lived intangible assets and goodwill are not amortized. Finite-lived management contracts, which relate to acquired separate accounts and funds and investor/customer relationships, and technology-related assets that are expected to contribute to the future cash flows of the Company for a specified period of time, are amortized over their remaining useful lives. The Company performs assessments to determine if any intangible assets are potentially impaired and whether the indefinite-lived and finite-lived classifications are still appropriate at least annually, as of July 31st. The carrying value of finite-lived assets and their remaining useful lives are reviewed at least annually to determine if circumstances exist which may indicate a potential impairment or revisions to the amortization period. In evaluating whether it is more likely than not that the fair value of indefinite-lived intangibles is less than its carrying value, BlackRock assesses various significant qualitative factors, including assets under management (“AUM”), revenue basis points, projected AUM growth rates, operating margins, tax rates and discount rates. In addition, the Company considers other factors, including (i) macroeconomic conditions such as a deterioration in general economic conditions, limitations on accessing capital, fluctuations in foreign exchange rates, or other developments in equity and credit markets; (ii) industry and market considerations such as a deterioration in the environment in which the entity operates, an increased competitive environment, a decline in market-dependent multiples or metrics, a change in the market for an entity’s services, or regulatory, legal or political developments; and (iii) entity-specific events, such as a change in management or key personnel, overall financial performance and litigation that could affect significant inputs used to determine the fair value of the indefinite-lived intangible asset. If an indefinite-lived intangible is determined to be more likely than not impaired, then the fair value of the asset is compared with its carrying value and any excess of the carrying value over the fair value would be recognized as an expense in the period in which the impairment occurs. For finite-lived intangible assets, if potential impairment circumstances are considered to exist, the Company will perform a recoverability test using an undiscounted cash flow analysis. Actual results could differ from these cash flow estimates, which could materially impact the impairment conclusion. If the carrying value of the asset is determined not to be recoverable based on the undiscounted cash flow test, the difference between the carrying value of the asset and its current fair value would be recognized as an expense in the period in which the impairment occurs. Noncontrolling Interests. The Company reports noncontrolling interests as equity, separate from the parent’s equity, on the consolidated statements of financial condition. In addition, the Company’s consolidated net income on the consolidated statements of income includes the income (loss) attributable to noncontrolling interest holders of the Company’s consolidated sponsored investment products. Income (loss) attributable to noncontrolling interests is not adjusted for income taxes for consolidated sponsored investment products that are treated as pass-through entities for tax purposes. Classification and Measurement of Redeemable Securities. The Company includes redeemable noncontrolling interests related to certain consolidated sponsored investment products in temporary equity on the consolidated statements of financial condition. Treasury Stock. The Company records common stock purchased for treasury at cost. At the date of subsequent reissuance, the treasury stock account is reduced by the cost of such stock using the average cost method. Revenue Recognition. Revenue is recognized upon transfer of control of promised services to customers in an amount to which the Company expects to be entitled in exchange for those services. The Company enters into contracts that can include multiple services, which are accounted for separately if they are determined to be distinct. Consideration for the Company’s services is generally in the form of variable consideration because the amount of fees is subject to market conditions that are outside of the Company’s influence. The Company includes F-11
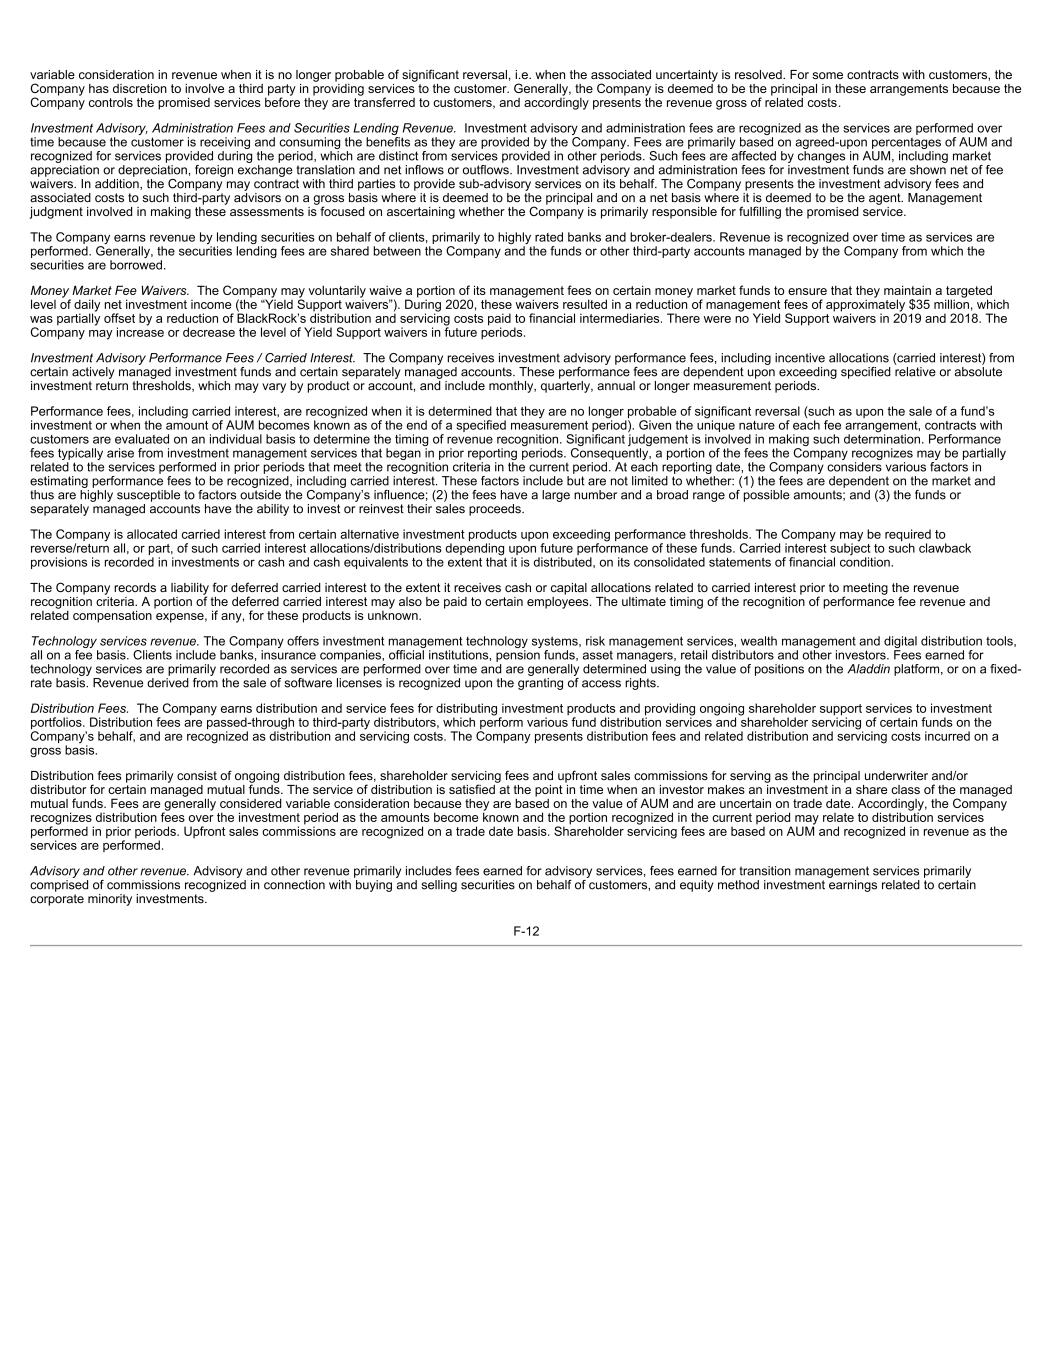
variable consideration in revenue when it is no longer probable of significant reversal, i.e. when the associated uncertainty is resolved. For some contracts with customers, the Company has discretion to involve a third party in providing services to the customer. Generally, the Company is deemed to be the principal in these arrangements because the Company controls the promised services before they are transferred to customers, and accordingly presents the revenue gross of related costs. Investment Advisory, Administration Fees and Securities Lending Revenue. Investment advisory and administration fees are recognized as the services are performed over time because the customer is receiving and consuming the benefits as they are provided by the Company. Fees are primarily based on agreed-upon percentages of AUM and recognized for services provided during the period, which are distinct from services provided in other periods. Such fees are affected by changes in AUM, including market appreciation or depreciation, foreign exchange translation and net inflows or outflows. Investment advisory and administration fees for investment funds are shown net of fee waivers. In addition, the Company may contract with third parties to provide sub-advisory services on its behalf. The Company presents the investment advisory fees and associated costs to such third-party advisors on a gross basis where it is deemed to be the principal and on a net basis where it is deemed to be the agent. Management judgment involved in making these assessments is focused on ascertaining whether the Company is primarily responsible for fulfilling the promised service. The Company earns revenue by lending securities on behalf of clients, primarily to highly rated banks and broker-dealers. Revenue is recognized over time as services are performed. Generally, the securities lending fees are shared between the Company and the funds or other third-party accounts managed by the Company from which the securities are borrowed. Money Market Fee Waivers. The Company may voluntarily waive a portion of its management fees on certain money market funds to ensure that they maintain a targeted level of daily net investment income (the “Yield Support waivers”). During 2020, these waivers resulted in a reduction of management fees of approximately $35 million, which was partially offset by a reduction of BlackRock’s distribution and servicing costs paid to financial intermediaries. There were no Yield Support waivers in 2019 and 2018. The Company may increase or decrease the level of Yield Support waivers in future periods. Investment Advisory Performance Fees / Carried Interest. The Company receives investment advisory performance fees, including incentive allocations (carried interest) from certain actively managed investment funds and certain separately managed accounts. These performance fees are dependent upon exceeding specified relative or absolute investment return thresholds, which may vary by product or account, and include monthly, quarterly, annual or longer measurement periods. Performance fees, including carried interest, are recognized when it is determined that they are no longer probable of significant reversal (such as upon the sale of a fund’s investment or when the amount of AUM becomes known as of the end of a specified measurement period). Given the unique nature of each fee arrangement, contracts with customers are evaluated on an individual basis to determine the timing of revenue recognition. Significant judgement is involved in making such determination. Performance fees typically arise from investment management services that began in prior reporting periods. Consequently, a portion of the fees the Company recognizes may be partially related to the services performed in prior periods that meet the recognition criteria in the current period. At each reporting date, the Company considers various factors in estimating performance fees to be recognized, including carried interest. These factors include but are not limited to whether: (1) the fees are dependent on the market and thus are highly susceptible to factors outside the Company’s influence; (2) the fees have a large number and a broad range of possible amounts; and (3) the funds or separately managed accounts have the ability to invest or reinvest their sales proceeds. The Company is allocated carried interest from certain alternative investment products upon exceeding performance thresholds. The Company may be required to reverse/return all, or part, of such carried interest allocations/distributions depending upon future performance of these funds. Carried interest subject to such clawback provisions is recorded in investments or cash and cash equivalents to the extent that it is distributed, on its consolidated statements of financial condition. The Company records a liability for deferred carried interest to the extent it receives cash or capital allocations related to carried interest prior to meeting the revenue recognition criteria. A portion of the deferred carried interest may also be paid to certain employees. The ultimate timing of the recognition of performance fee revenue and related compensation expense, if any, for these products is unknown. Technology services revenue. The Company offers investment management technology systems, risk management services, wealth management and digital distribution tools, all on a fee basis. Clients include banks, insurance companies, official institutions, pension funds, asset managers, retail distributors and other investors. Fees earned for technology services are primarily recorded as services are performed over time and are generally determined using the value of positions on the Aladdin platform, or on a fixed- rate basis. Revenue derived from the sale of software licenses is recognized upon the granting of access rights. Distribution Fees. The Company earns distribution and service fees for distributing investment products and providing ongoing shareholder support services to investment portfolios. Distribution fees are passed-through to third-party distributors, which perform various fund distribution services and shareholder servicing of certain funds on the Company’s behalf, and are recognized as distribution and servicing costs. The Company presents distribution fees and related distribution and servicing costs incurred on a gross basis. Distribution fees primarily consist of ongoing distribution fees, shareholder servicing fees and upfront sales commissions for serving as the principal underwriter and/or distributor for certain managed mutual funds. The service of distribution is satisfied at the point in time when an investor makes an investment in a share class of the managed mutual funds. Fees are generally considered variable consideration because they are based on the value of AUM and are uncertain on trade date. Accordingly, the Company recognizes distribution fees over the investment period as the amounts become known and the portion recognized in the current period may relate to distribution services performed in prior periods. Upfront sales commissions are recognized on a trade date basis. Shareholder servicing fees are based on AUM and recognized in revenue as the services are performed. Advisory and other revenue. Advisory and other revenue primarily includes fees earned for advisory services, fees earned for transition management services primarily comprised of commissions recognized in connection with buying and selling securities on behalf of customers, and equity method investment earnings related to certain corporate minority investments. F-12
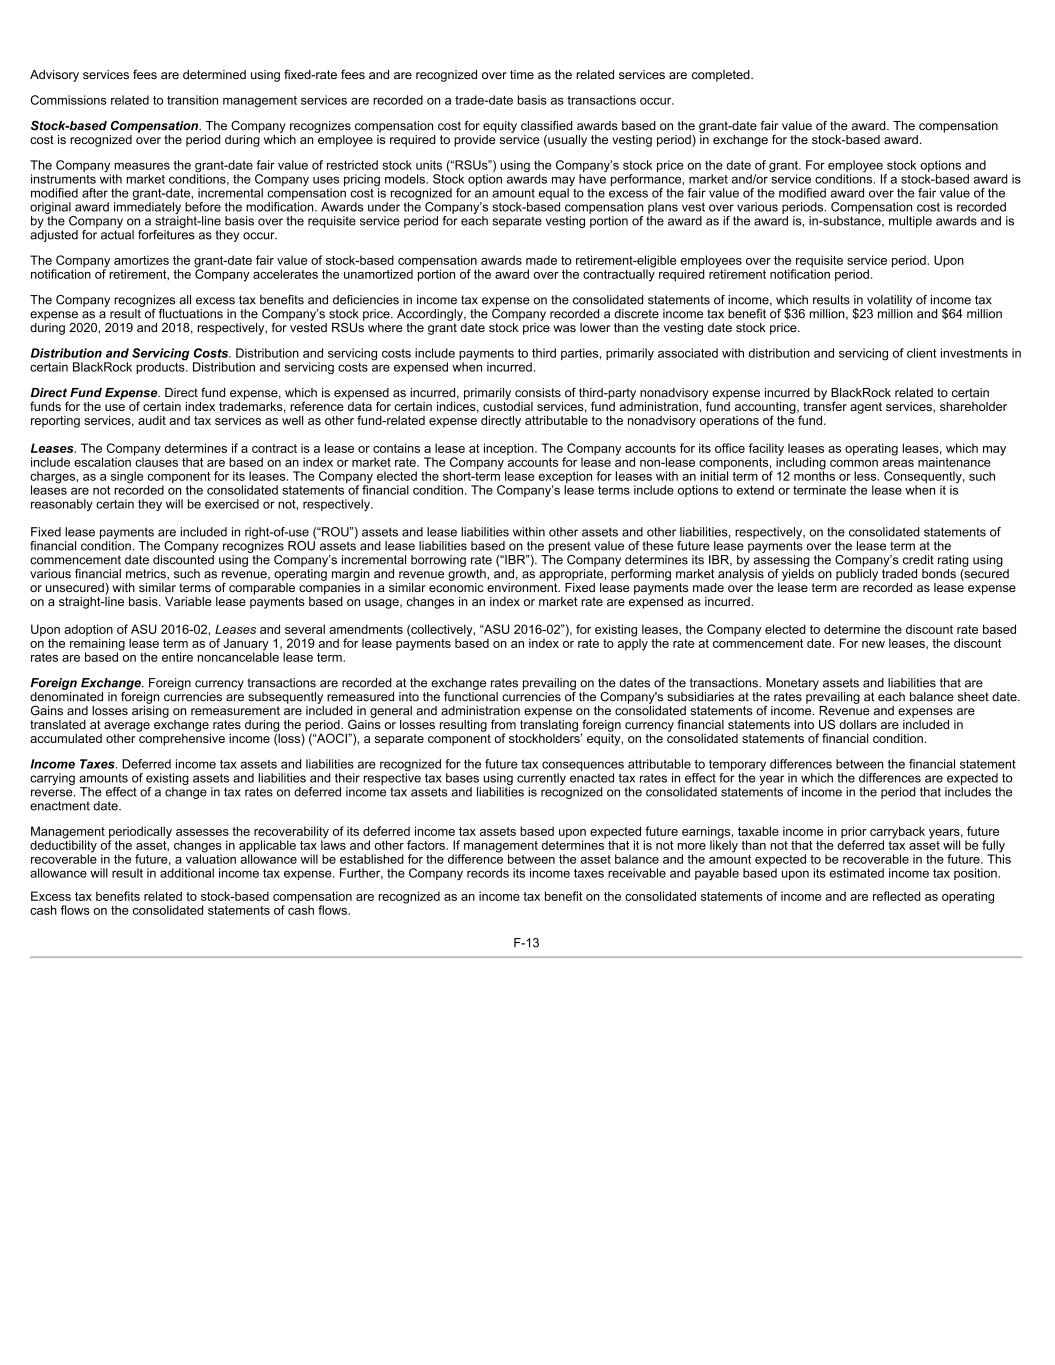
Advisory services fees are determined using fixed-rate fees and are recognized over time as the related services are completed. Commissions related to transition management services are recorded on a trade-date basis as transactions occur. Stock-based Compensation. The Company recognizes compensation cost for equity classified awards based on the grant-date fair value of the award. The compensation cost is recognized over the period during which an employee is required to provide service (usually the vesting period) in exchange for the stock-based award. The Company measures the grant-date fair value of restricted stock units (“RSUs”) using the Company’s stock price on the date of grant. For employee stock options and instruments with market conditions, the Company uses pricing models. Stock option awards may have performance, market and/or service conditions. If a stock-based award is modified after the grant-date, incremental compensation cost is recognized for an amount equal to the excess of the fair value of the modified award over the fair value of the original award immediately before the modification. Awards under the Company’s stock-based compensation plans vest over various periods. Compensation cost is recorded by the Company on a straight-line basis over the requisite service period for each separate vesting portion of the award as if the award is, in-substance, multiple awards and is adjusted for actual forfeitures as they occur. The Company amortizes the grant-date fair value of stock-based compensation awards made to retirement-eligible employees over the requisite service period. Upon notification of retirement, the Company accelerates the unamortized portion of the award over the contractually required retirement notification period. The Company recognizes all excess tax benefits and deficiencies in income tax expense on the consolidated statements of income, which results in volatility of income tax expense as a result of fluctuations in the Company’s stock price. Accordingly, the Company recorded a discrete income tax benefit of $36 million, $23 million and $64 million during 2020, 2019 and 2018, respectively, for vested RSUs where the grant date stock price was lower than the vesting date stock price. Distribution and Servicing Costs. Distribution and servicing costs include payments to third parties, primarily associated with distribution and servicing of client investments in certain BlackRock products. Distribution and servicing costs are expensed when incurred. Direct Fund Expense. Direct fund expense, which is expensed as incurred, primarily consists of third-party nonadvisory expense incurred by BlackRock related to certain funds for the use of certain index trademarks, reference data for certain indices, custodial services, fund administration, fund accounting, transfer agent services, shareholder reporting services, audit and tax services as well as other fund-related expense directly attributable to the nonadvisory operations of the fund. Leases. The Company determines if a contract is a lease or contains a lease at inception. The Company accounts for its office facility leases as operating leases, which may include escalation clauses that are based on an index or market rate. The Company accounts for lease and non-lease components, including common areas maintenance charges, as a single component for its leases. The Company elected the short-term lease exception for leases with an initial term of 12 months or less. Consequently, such leases are not recorded on the consolidated statements of financial condition. The Company’s lease terms include options to extend or terminate the lease when it is reasonably certain they will be exercised or not, respectively. Fixed lease payments are included in right-of-use (“ROU”) assets and lease liabilities within other assets and other liabilities, respectively, on the consolidated statements of financial condition. The Company recognizes ROU assets and lease liabilities based on the present value of these future lease payments over the lease term at the commencement date discounted using the Company’s incremental borrowing rate (“IBR”). The Company determines its IBR, by assessing the Company’s credit rating using various financial metrics, such as revenue, operating margin and revenue growth, and, as appropriate, performing market analysis of yields on publicly traded bonds (secured or unsecured) with similar terms of comparable companies in a similar economic environment. Fixed lease payments made over the lease term are recorded as lease expense on a straight-line basis. Variable lease payments based on usage, changes in an index or market rate are expensed as incurred. Upon adoption of ASU 2016-02, Leases and several amendments (collectively, “ASU 2016-02”), for existing leases, the Company elected to determine the discount rate based on the remaining lease term as of January 1, 2019 and for lease payments based on an index or rate to apply the rate at commencement date. For new leases, the discount rates are based on the entire noncancelable lease term. Foreign Exchange. Foreign currency transactions are recorded at the exchange rates prevailing on the dates of the transactions. Monetary assets and liabilities that are denominated in foreign currencies are subsequently remeasured into the functional currencies of the Company's subsidiaries at the rates prevailing at each balance sheet date. Gains and losses arising on remeasurement are included in general and administration expense on the consolidated statements of income. Revenue and expenses are translated at average exchange rates during the period. Gains or losses resulting from translating foreign currency financial statements into US dollars are included in accumulated other comprehensive income (loss) (“AOCI”), a separate component of stockholders’ equity, on the consolidated statements of financial condition. Income Taxes. Deferred income tax assets and liabilities are recognized for the future tax consequences attributable to temporary differences between the financial statement carrying amounts of existing assets and liabilities and their respective tax bases using currently enacted tax rates in effect for the year in which the differences are expected to reverse. The effect of a change in tax rates on deferred income tax assets and liabilities is recognized on the consolidated statements of income in the period that includes the enactment date. Management periodically assesses the recoverability of its deferred income tax assets based upon expected future earnings, taxable income in prior carryback years, future deductibility of the asset, changes in applicable tax laws and other factors. If management determines that it is not more likely than not that the deferred tax asset will be fully recoverable in the future, a valuation allowance will be established for the difference between the asset balance and the amount expected to be recoverable in the future. This allowance will result in additional income tax expense. Further, the Company records its income taxes receivable and payable based upon its estimated income tax position. Excess tax benefits related to stock-based compensation are recognized as an income tax benefit on the consolidated statements of income and are reflected as operating cash flows on the consolidated statements of cash flows. F-13
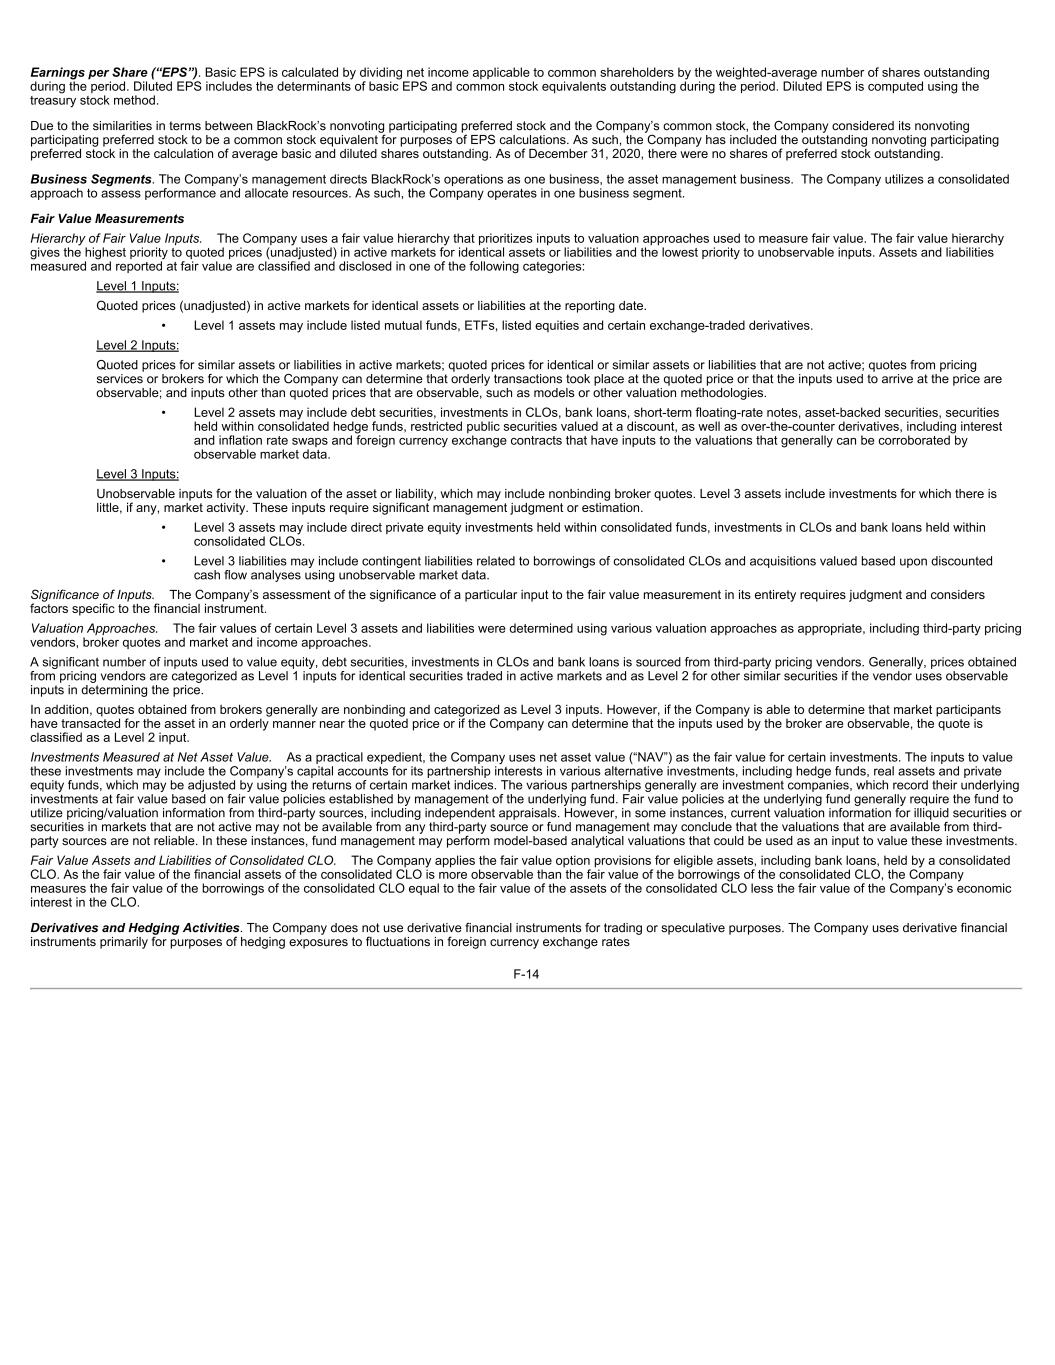
Earnings per Share (“EPS”). Basic EPS is calculated by dividing net income applicable to common shareholders by the weighted-average number of shares outstanding during the period. Diluted EPS includes the determinants of basic EPS and common stock equivalents outstanding during the period. Diluted EPS is computed using the treasury stock method. Due to the similarities in terms between BlackRock’s nonvoting participating preferred stock and the Company’s common stock, the Company considered its nonvoting participating preferred stock to be a common stock equivalent for purposes of EPS calculations. As such, the Company has included the outstanding nonvoting participating preferred stock in the calculation of average basic and diluted shares outstanding. As of December 31, 2020, there were no shares of preferred stock outstanding. Business Segments. The Company’s management directs BlackRock’s operations as one business, the asset management business. The Company utilizes a consolidated approach to assess performance and allocate resources. As such, the Company operates in one business segment. Fair Value Measurements Hierarchy of Fair Value Inputs. The Company uses a fair value hierarchy that prioritizes inputs to valuation approaches used to measure fair value. The fair value hierarchy gives the highest priority to quoted prices (unadjusted) in active markets for identical assets or liabilities and the lowest priority to unobservable inputs. Assets and liabilities measured and reported at fair value are classified and disclosed in one of the following categories: Level 1 Inputs: Quoted prices (unadjusted) in active markets for identical assets or liabilities at the reporting date. • Level 1 assets may include listed mutual funds, ETFs, listed equities and certain exchange-traded derivatives. Level 2 Inputs: Quoted prices for similar assets or liabilities in active markets; quoted prices for identical or similar assets or liabilities that are not active; quotes from pricing services or brokers for which the Company can determine that orderly transactions took place at the quoted price or that the inputs used to arrive at the price are observable; and inputs other than quoted prices that are observable, such as models or other valuation methodologies. • Level 2 assets may include debt securities, investments in CLOs, bank loans, short-term floating-rate notes, asset-backed securities, securities held within consolidated hedge funds, restricted public securities valued at a discount, as well as over-the-counter derivatives, including interest and inflation rate swaps and foreign currency exchange contracts that have inputs to the valuations that generally can be corroborated by observable market data. Level 3 Inputs: Unobservable inputs for the valuation of the asset or liability, which may include nonbinding broker quotes. Level 3 assets include investments for which there is little, if any, market activity. These inputs require significant management judgment or estimation. • Level 3 assets may include direct private equity investments held within consolidated funds, investments in CLOs and bank loans held within consolidated CLOs. • Level 3 liabilities may include contingent liabilities related to borrowings of consolidated CLOs and acquisitions valued based upon discounted cash flow analyses using unobservable market data. Significance of Inputs. The Company’s assessment of the significance of a particular input to the fair value measurement in its entirety requires judgment and considers factors specific to the financial instrument. Valuation Approaches. The fair values of certain Level 3 assets and liabilities were determined using various valuation approaches as appropriate, including third-party pricing vendors, broker quotes and market and income approaches. A significant number of inputs used to value equity, debt securities, investments in CLOs and bank loans is sourced from third-party pricing vendors. Generally, prices obtained from pricing vendors are categorized as Level 1 inputs for identical securities traded in active markets and as Level 2 for other similar securities if the vendor uses observable inputs in determining the price. In addition, quotes obtained from brokers generally are nonbinding and categorized as Level 3 inputs. However, if the Company is able to determine that market participants have transacted for the asset in an orderly manner near the quoted price or if the Company can determine that the inputs used by the broker are observable, the quote is classified as a Level 2 input. Investments Measured at Net Asset Value. As a practical expedient, the Company uses net asset value (“NAV”) as the fair value for certain investments. The inputs to value these investments may include the Company’s capital accounts for its partnership interests in various alternative investments, including hedge funds, real assets and private equity funds, which may be adjusted by using the returns of certain market indices. The various partnerships generally are investment companies, which record their underlying investments at fair value based on fair value policies established by management of the underlying fund. Fair value policies at the underlying fund generally require the fund to utilize pricing/valuation information from third-party sources, including independent appraisals. However, in some instances, current valuation information for illiquid securities or securities in markets that are not active may not be available from any third-party source or fund management may conclude that the valuations that are available from third- party sources are not reliable. In these instances, fund management may perform model-based analytical valuations that could be used as an input to value these investments. Fair Value Assets and Liabilities of Consolidated CLO. The Company applies the fair value option provisions for eligible assets, including bank loans, held by a consolidated CLO. As the fair value of the financial assets of the consolidated CLO is more observable than the fair value of the borrowings of the consolidated CLO, the Company measures the fair value of the borrowings of the consolidated CLO equal to the fair value of the assets of the consolidated CLO less the fair value of the Company’s economic interest in the CLO. Derivatives and Hedging Activities. The Company does not use derivative financial instruments for trading or speculative purposes. The Company uses derivative financial instruments primarily for purposes of hedging exposures to fluctuations in foreign currency exchange rates F-14

of certain assets and liabilities, and market exposures for certain seed investments. However, certain consolidated sponsored investment funds may also utilize derivatives as a part of their investment strategy. The Company records all derivative financial instruments as either assets or liabilities at fair value on a gross basis in the consolidated statements of financial condition. Credit risks are managed through master netting and collateral support agreements. The amounts related to the right to reclaim or the obligation to return cash collateral may not be used to offset amounts due under the derivative instruments in the normal course of settlement. Therefore, such amounts are not offset against fair value amounts recognized for derivative instruments with the same counterparty and are included in other assets and other liabilities. Changes in the fair value of the Company’s derivative financial instruments are recognized in earnings and, where applicable, are offset by the corresponding gain or loss on the related foreign-denominated assets or liabilities or hedged investments, on the consolidated statements of income. The Company may also use financial instruments designated as net investment hedges for accounting purposes to hedge net investments in international subsidiaries whose functional currency is not US dollars. The gain or loss from revaluing net investment hedges at the spot rate is deferred and reported within AOCI on the consolidated statements of financial condition. Amounts excluded from the effectiveness assessment are reported in the consolidated statements of income using a systematic and rational method. The Company reassesses the effectiveness of its net investment hedge at least quarterly. 3. Acquisition On May 10, 2019, the Company acquired 100% of the equity interests of eFront Holding SAS (“eFront Transaction” or “eFront”), a leading alternative investment management software and solutions provider for approximately $1.3 billion, excluding the settlement of eFront’s outstanding debt. The acquisition of eFront expanded Aladdin’s illiquid alternative capabilities and enables BlackRock to provide individual alternative or whole-portfolio technology solutions to clients. The purchase price was funded through a combination of existing cash and issuance of commercial paper (subsequently repaid with existing cash) and long-term notes in April 2019. See Note 15, Borrowings, for information on the debt issuance in April 2019. A summary of the fair values of the assets acquired and liabilities assumed in this acquisition is as follows: (in millions) Fair Value Accounts receivable $ 61 Finite-lived intangible assets: Customer relationships 400 Technology-related 203 Trade name 14 Goodwill 1,044 Other assets 49 Deferred income tax liabilities (146) Other liabilities assumed (125) Total consideration, net of cash acquired $ 1,500 Summary of consideration, net of cash acquired: Cash paid including settlement of outstanding debt of approximately $0.2 billion $ 1,555 Cash acquired (55) Total consideration, net of cash acquired $ 1,500 F-15
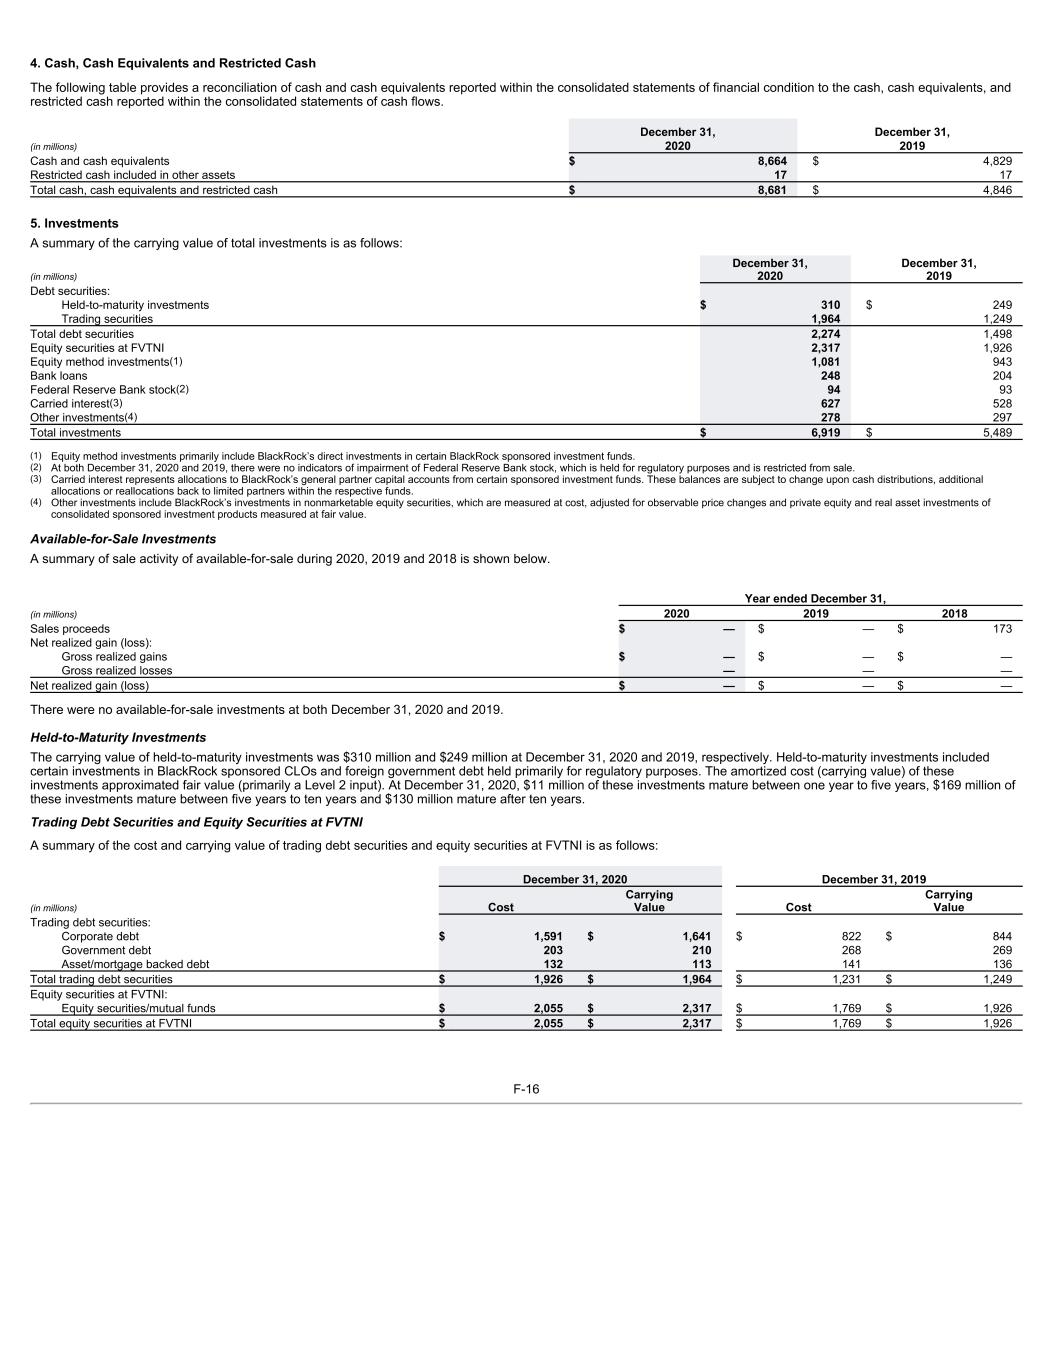
4. Cash, Cash Equivalents and Restricted Cash The following table provides a reconciliation of cash and cash equivalents reported within the consolidated statements of financial condition to the cash, cash equivalents, and restricted cash reported within the consolidated statements of cash flows. December 31, December 31, (in millions) 2020 2019 Cash and cash equivalents $ 8,664 $ 4,829 Restricted cash included in other assets 17 17 Total cash, cash equivalents and restricted cash $ 8,681 $ 4,846 5. Investments A summary of the carrying value of total investments is as follows: (in millions) December 31, 2020 December 31, 2019 Debt securities: Held-to-maturity investments $ 310 $ 249 Trading securities 1,964 1,249 Total debt securities 2,274 1,498 Equity securities at FVTNI 2,317 1,926 Equity method investments(1) 1,081 943 Bank loans 248 204 Federal Reserve Bank stock(2) 94 93 Carried interest(3) 627 528 Other investments(4) 278 297 Total investments $ 6,919 $ 5,489 (1) Equity method investments primarily include BlackRock’s direct investments in certain BlackRock sponsored investment funds. (2) At both December 31, 2020 and 2019, there were no indicators of impairment of Federal Reserve Bank stock, which is held for regulatory purposes and is restricted from sale. (3) Carried interest represents allocations to BlackRock’s general partner capital accounts from certain sponsored investment funds. These balances are subject to change upon cash distributions, additional allocations or reallocations back to limited partners within the respective funds. (4) Other investments include BlackRock’s investments in nonmarketable equity securities, which are measured at cost, adjusted for observable price changes and private equity and real asset investments of consolidated sponsored investment products measured at fair value. Available-for-Sale Investments A summary of sale activity of available-for-sale during 2020, 2019 and 2018 is shown below. Year ended December 31, (in millions) 2020 2019 2018 Sales proceeds $ — $ — $ 173 Net realized gain (loss): Gross realized gains $ — $ — $ — Gross realized losses — — — Net realized gain (loss) $ — $ — $ — There were no available-for-sale investments at both December 31, 2020 and 2019. Held-to-Maturity Investments The carrying value of held-to-maturity investments was $310 million and $249 million at December 31, 2020 and 2019, respectively. Held-to-maturity investments included certain investments in BlackRock sponsored CLOs and foreign government debt held primarily for regulatory purposes. The amortized cost (carrying value) of these investments approximated fair value (primarily a Level 2 input). At December 31, 2020, $11 million of these investments mature between one year to five years, $169 million of these investments mature between five years to ten years and $130 million mature after ten years. Trading Debt Securities and Equity Securities at FVTNI A summary of the cost and carrying value of trading debt securities and equity securities at FVTNI is as follows: December 31, 2020 December 31, 2019 (in millions) Cost Carrying Value Cost Carrying Value Trading debt securities: Corporate debt $ 1,591 $ 1,641 $ 822 $ 844 Government debt 203 210 268 269 Asset/mortgage backed debt 132 113 141 136 Total trading debt securities $ 1,926 $ 1,964 $ 1,231 $ 1,249 Equity securities at FVTNI: Equity securities/mutual funds $ 2,055 $ 2,317 $ 1,769 $ 1,926 Total equity securities at FVTNI $ 2,055 $ 2,317 $ 1,769 $ 1,926 F-16
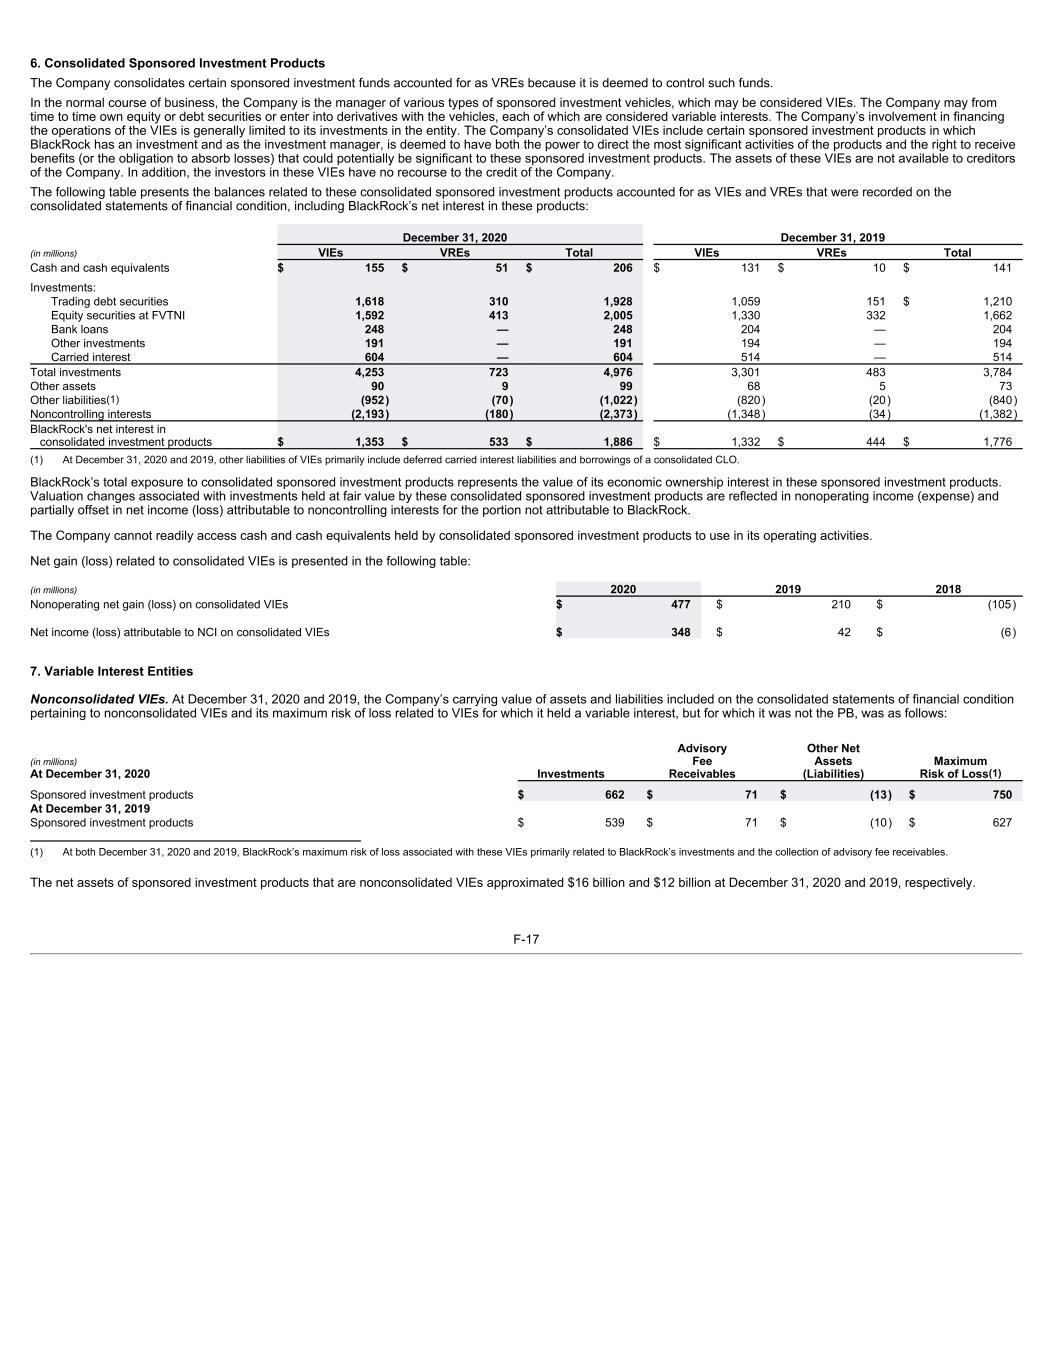
6. Consolidated Sponsored Investment Products The Company consolidates certain sponsored investment funds accounted for as VREs because it is deemed to control such funds. In the normal course of business, the Company is the manager of various types of sponsored investment vehicles, which may be considered VIEs. The Company may from time to time own equity or debt securities or enter into derivatives with the vehicles, each of which are considered variable interests. The Company’s involvement in financing the operations of the VIEs is generally limited to its investments in the entity. The Company’s consolidated VIEs include certain sponsored investment products in which BlackRock has an investment and as the investment manager, is deemed to have both the power to direct the most significant activities of the products and the right to receive benefits (or the obligation to absorb losses) that could potentially be significant to these sponsored investment products. The assets of these VIEs are not available to creditors of the Company. In addition, the investors in these VIEs have no recourse to the credit of the Company. The following table presents the balances related to these consolidated sponsored investment products accounted for as VIEs and VREs that were recorded on the consolidated statements of financial condition, including BlackRock’s net interest in these products: December 31, 2020 December 31, 2019 (in millions) VIEs VREs Total VIEs VREs Total Cash and cash equivalents $ 155 $ 51 $ 206 $ 131 $ 10 $ 141 Investments: Trading debt securities 1,618 310 1,928 1,059 151 $ 1,210 Equity securities at FVTNI 1,592 413 2,005 1,330 332 1,662 Bank loans 248 — 248 204 — 204 Other investments 191 — 191 194 — 194 Carried interest 604 — 604 514 — 514 Total investments 4,253 723 4,976 3,301 483 3,784 Other assets 90 9 99 68 5 73 Other liabilities(1) (952) (70) (1,022) (820) (20) (840) Noncontrolling interests (2,193) (180) (2,373) (1,348) (34) (1,382) BlackRock's net interest in consolidated investment products $ 1,353 $ 533 $ 1,886 $ 1,332 $ 444 $ 1,776 (1) At December 31, 2020 and 2019, other liabilities of VIEs primarily include deferred carried interest liabilities and borrowings of a consolidated CLO. BlackRock’s total exposure to consolidated sponsored investment products represents the value of its economic ownership interest in these sponsored investment products. Valuation changes associated with investments held at fair value by these consolidated sponsored investment products are reflected in nonoperating income (expense) and partially offset in net income (loss) attributable to noncontrolling interests for the portion not attributable to BlackRock. The Company cannot readily access cash and cash equivalents held by consolidated sponsored investment products to use in its operating activities. Net gain (loss) related to consolidated VIEs is presented in the following table: (in millions) 2020 2019 2018 Nonoperating net gain (loss) on consolidated VIEs $ 477 $ 210 $ (105) Net income (loss) attributable to NCI on consolidated VIEs $ 348 $ 42 $ (6) 7. Variable Interest Entities Nonconsolidated VIEs. At December 31, 2020 and 2019, the Company’s carrying value of assets and liabilities included on the consolidated statements of financial condition pertaining to nonconsolidated VIEs and its maximum risk of loss related to VIEs for which it held a variable interest, but for which it was not the PB, was as follows: (in millions) At December 31, 2020 Investments Advisory Fee Receivables Other Net Assets (Liabilities) Maximum Risk of Loss(1) Sponsored investment products $ 662 $ 71 $ (13) $ 750 At December 31, 2019 Sponsored investment products $ 539 $ 71 $ (10) $ 627 (1) At both December 31, 2020 and 2019, BlackRock’s maximum risk of loss associated with these VIEs primarily related to BlackRock’s investments and the collection of advisory fee receivables. The net assets of sponsored investment products that are nonconsolidated VIEs approximated $16 billion and $12 billion at December 31, 2020 and 2019, respectively. F-17
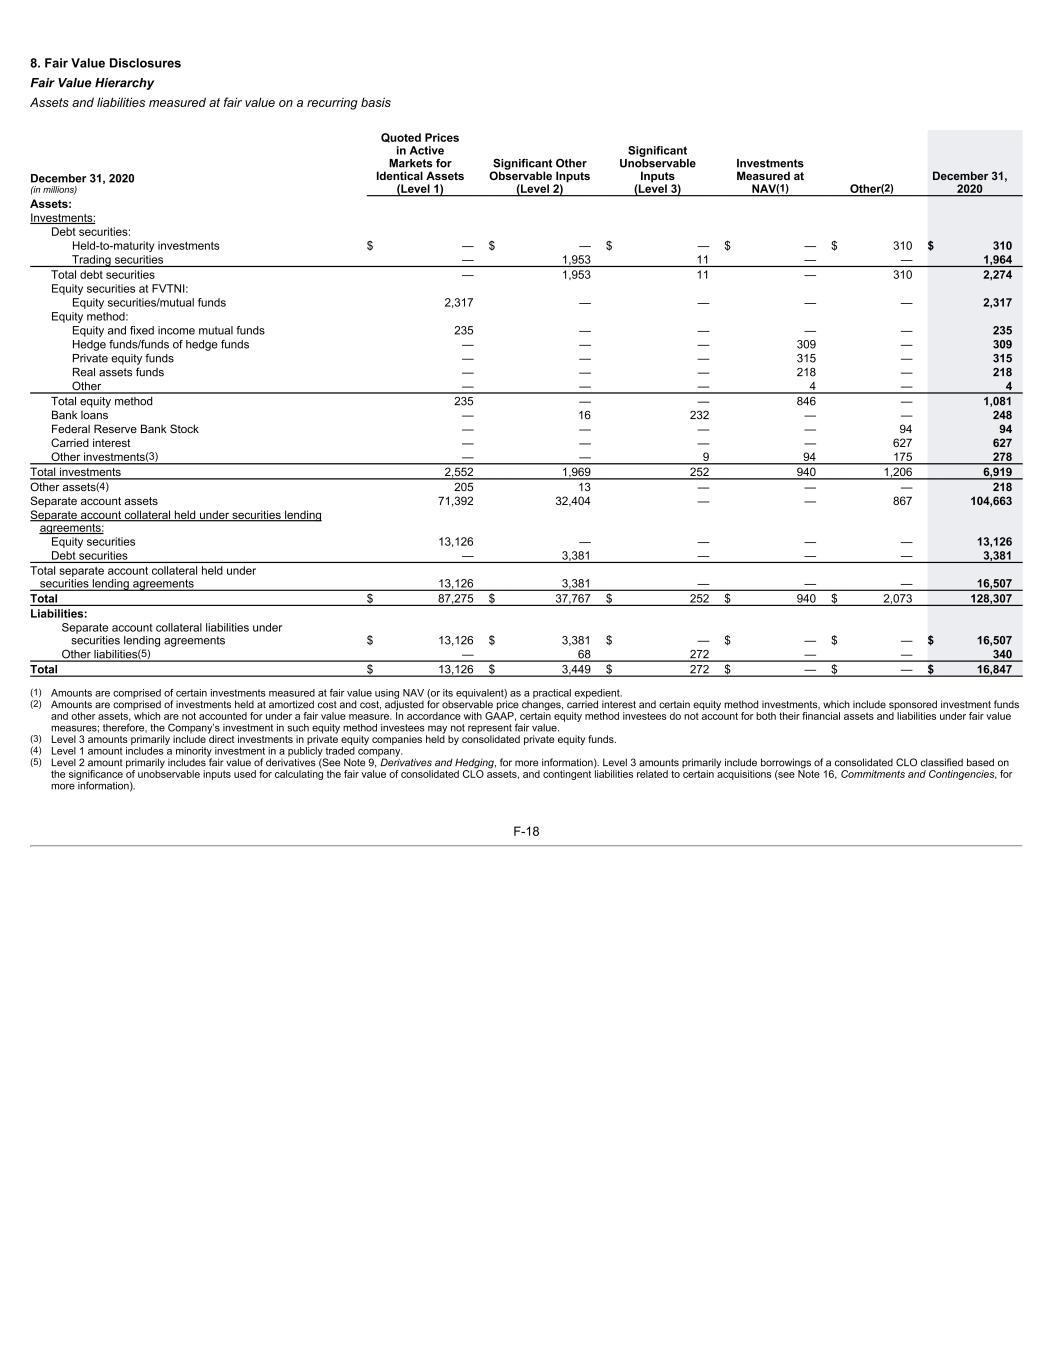
8. Fair Value Disclosures Fair Value Hierarchy Assets and liabilities measured at fair value on a recurring basis December 31, 2020 (in millions) Quoted Prices in Active Markets for Identical Assets (Level 1) Significant Other Observable Inputs (Level 2) Significant Unobservable Inputs (Level 3) Investments Measured at NAV(1) Other(2) December 31, 2020 Assets: Investments: Debt securities: Held-to-maturity investments $ — $ — $ — $ — $ 310 $ 310 Trading securities — 1,953 11 — — 1,964 Total debt securities — 1,953 11 — 310 2,274 Equity securities at FVTNI: Equity securities/mutual funds 2,317 — — — — 2,317 Equity method: Equity and fixed income mutual funds 235 — — — — 235 Hedge funds/funds of hedge funds — — — 309 — 309 Private equity funds — — — 315 — 315 Real assets funds — — — 218 — 218 Other — — — 4 — 4 Total equity method 235 — — 846 — 1,081 Bank loans — 16 232 — — 248 Federal Reserve Bank Stock — — — — 94 94 Carried interest — — — — 627 627 Other investments(3) — — 9 94 175 278 Total investments 2,552 1,969 252 940 1,206 6,919 Other assets(4) 205 13 — — — 218 Separate account assets 71,392 32,404 — — 867 104,663 Separate account collateral held under securities lending agreements: Equity securities 13,126 — — — — 13,126 Debt securities — 3,381 — — — 3,381 Total separate account collateral held under securities lending agreements 13,126 3,381 — — — 16,507 Total $ 87,275 $ 37,767 $ 252 $ 940 $ 2,073 128,307 Liabilities: Separate account collateral liabilities under securities lending agreements $ 13,126 $ 3,381 $ — $ — $ — $ 16,507 Other liabilities(5) — 68 272 — — 340 Total $ 13,126 $ 3,449 $ 272 $ — $ — $ 16,847 (1) Amounts are comprised of certain investments measured at fair value using NAV (or its equivalent) as a practical expedient. (2) Amounts are comprised of investments held at amortized cost and cost, adjusted for observable price changes, carried interest and certain equity method investments, which include sponsored investment funds and other assets, which are not accounted for under a fair value measure. In accordance with GAAP, certain equity method investees do not account for both their financial assets and liabilities under fair value measures; therefore, the Company’s investment in such equity method investees may not represent fair value. (3) Level 3 amounts primarily include direct investments in private equity companies held by consolidated private equity funds. (4) Level 1 amount includes a minority investment in a publicly traded company. (5) Level 2 amount primarily includes fair value of derivatives (See Note 9, Derivatives and Hedging, for more information). Level 3 amounts primarily include borrowings of a consolidated CLO classified based on the significance of unobservable inputs used for calculating the fair value of consolidated CLO assets, and contingent liabilities related to certain acquisitions (see Note 16, Commitments and Contingencies, for more information). F-18
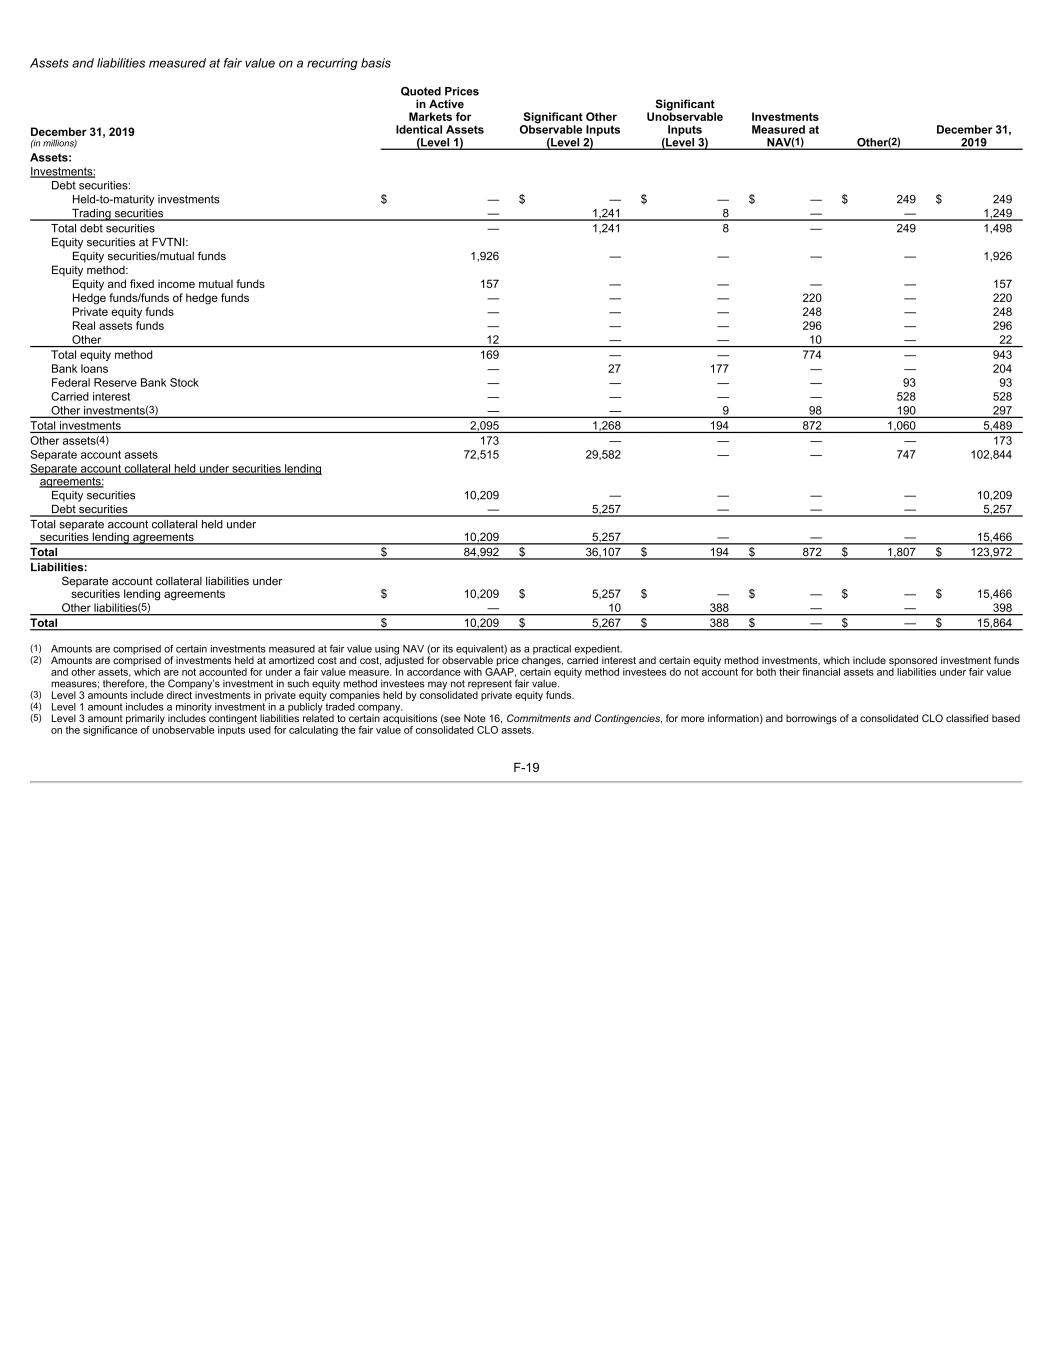
Assets and liabilities measured at fair value on a recurring basis December 31, 2019 (in millions) Quoted Prices in Active Markets for Identical Assets (Level 1) Significant Other Observable Inputs (Level 2) Significant Unobservable Inputs (Level 3) Investments Measured at NAV(1) Other(2) December 31, 2019 Assets: Investments: Debt securities: Held-to-maturity investments $ — $ — $ — $ — $ 249 $ 249 Trading securities — 1,241 8 — — 1,249 Total debt securities — 1,241 8 — 249 1,498 Equity securities at FVTNI: Equity securities/mutual funds 1,926 — — — — 1,926 Equity method: Equity and fixed income mutual funds 157 — — — — 157 Hedge funds/funds of hedge funds — — — 220 — 220 Private equity funds — — — 248 — 248 Real assets funds — — — 296 — 296 Other 12 — — 10 — 22 Total equity method 169 — — 774 — 943 Bank loans — 27 177 — — 204 Federal Reserve Bank Stock — — — — 93 93 Carried interest — — — — 528 528 Other investments(3) — — 9 98 190 297 Total investments 2,095 1,268 194 872 1,060 5,489 Other assets(4) 173 — — — — 173 Separate account assets 72,515 29,582 — — 747 102,844 Separate account collateral held under securities lending agreements: Equity securities 10,209 — — — — 10,209 Debt securities — 5,257 — — — 5,257 Total separate account collateral held under securities lending agreements 10,209 5,257 — — — 15,466 Total $ 84,992 $ 36,107 $ 194 $ 872 $ 1,807 $ 123,972 Liabilities: Separate account collateral liabilities under securities lending agreements $ 10,209 $ 5,257 $ — $ — $ — $ 15,466 Other liabilities(5) — 10 388 — — 398 Total $ 10,209 $ 5,267 $ 388 $ — $ — $ 15,864 (1) Amounts are comprised of certain investments measured at fair value using NAV (or its equivalent) as a practical expedient. (2) Amounts are comprised of investments held at amortized cost and cost, adjusted for observable price changes, carried interest and certain equity method investments, which include sponsored investment funds and other assets, which are not accounted for under a fair value measure. In accordance with GAAP, certain equity method investees do not account for both their financial assets and liabilities under fair value measures; therefore, the Company’s investment in such equity method investees may not represent fair value. (3) Level 3 amounts include direct investments in private equity companies held by consolidated private equity funds. (4) Level 1 amount includes a minority investment in a publicly traded company. (5) Level 3 amount primarily includes contingent liabilities related to certain acquisitions (see Note 16, Commitments and Contingencies, for more information) and borrowings of a consolidated CLO classified based on the significance of unobservable inputs used for calculating the fair value of consolidated CLO assets. F-19

Level 3 Assets. Level 3 assets may include investments in CLOs and bank loans of consolidated CLOs, which were valued based on single-broker nonbinding quotes and direct private equity investments, which were valued using the market or income approach. Level 3 investments of $252 million and $194 million at December 31, 2020 and 2019, respectively, primarily included bank loans of a consolidated CLO. Level 3 Liabilities. Level 3 liabilities primarily include borrowings of a consolidated CLO, which were valued based on the fair value of the assets of the consolidated CLO less the fair value of the Company’s economic interest in the CLO, and contingent liabilities related to certain acquisitions, which were valued based upon discounted cash flow analyses using unobservable market data inputs. F-20
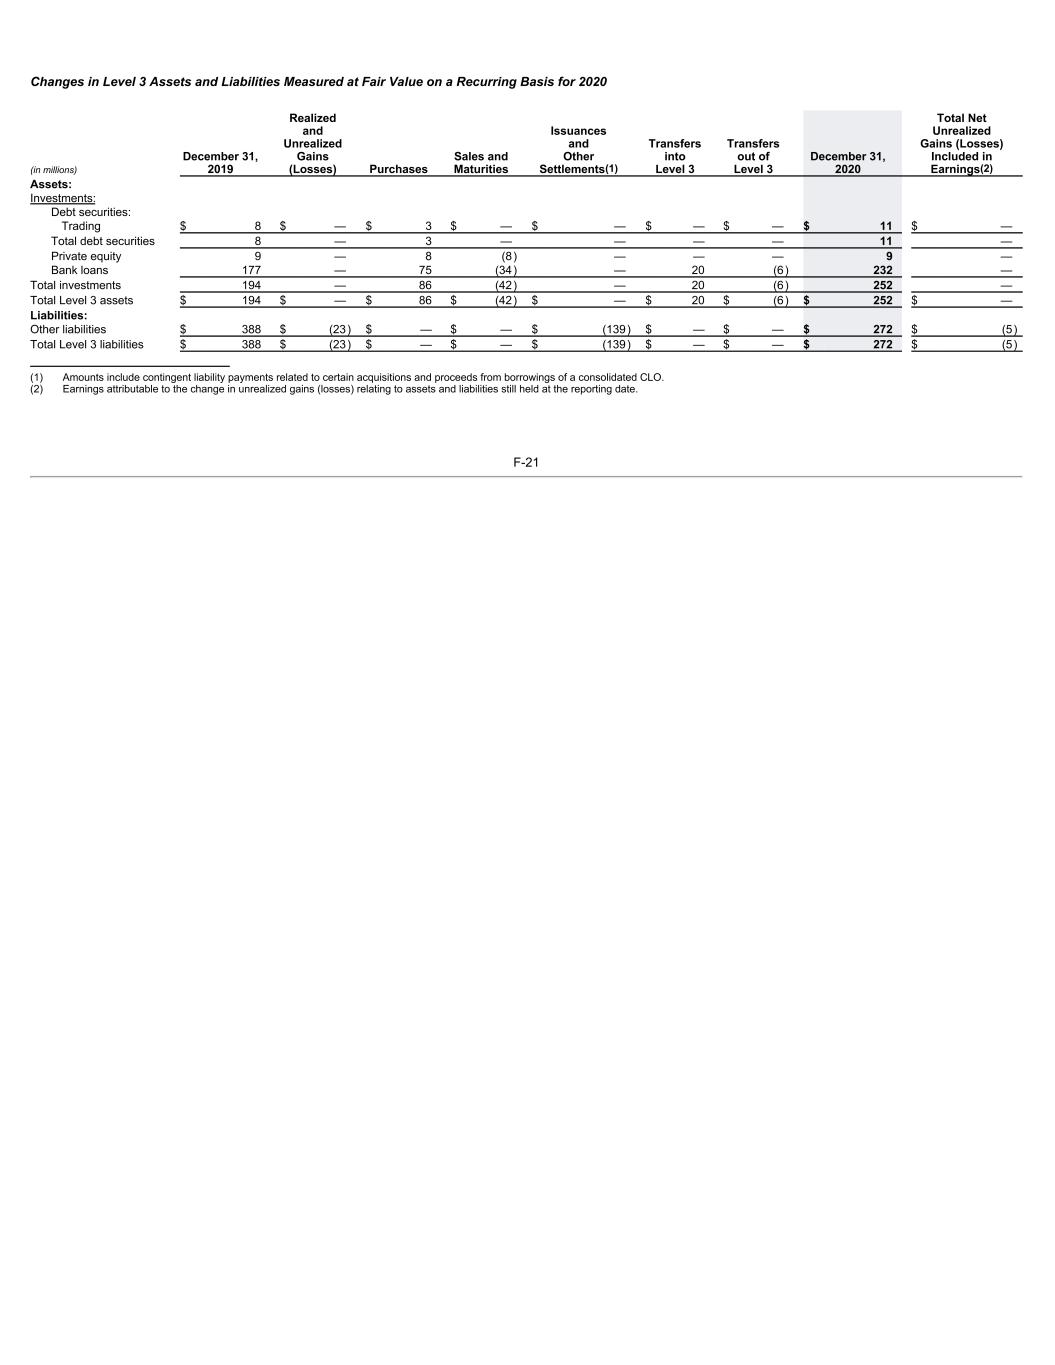
Changes in Level 3 Assets and Liabilities Measured at Fair Value on a Recurring Basis for 2020 (in millions) December 31, 2019 Realized and Unrealized Gains (Losses) Purchases Sales and Maturities Issuances and Other Settlements(1) Transfers into Level 3 Transfers out of Level 3 December 31, 2020 Total Net Unrealized Gains (Losses) Included in Earnings(2) Assets: Investments: Debt securities: Trading $ 8 $ — $ 3 $ — $ — $ — $ — $ 11 $ — Total debt securities 8 — 3 — — — — 11 — Private equity 9 — 8 (8) — — — 9 — Bank loans 177 — 75 (34) — 20 (6) 232 — Total investments 194 — 86 (42) — 20 (6) 252 — Total Level 3 assets $ 194 $ — $ 86 $ (42) $ — $ 20 $ (6) $ 252 $ — Liabilities: Other liabilities $ 388 $ (23) $ — $ — $ (139) $ — $ — $ 272 $ (5) Total Level 3 liabilities $ 388 $ (23) $ — $ — $ (139) $ — $ — $ 272 $ (5) (1) Amounts include contingent liability payments related to certain acquisitions and proceeds from borrowings of a consolidated CLO. (2) Earnings attributable to the change in unrealized gains (losses) relating to assets and liabilities still held at the reporting date. F-21
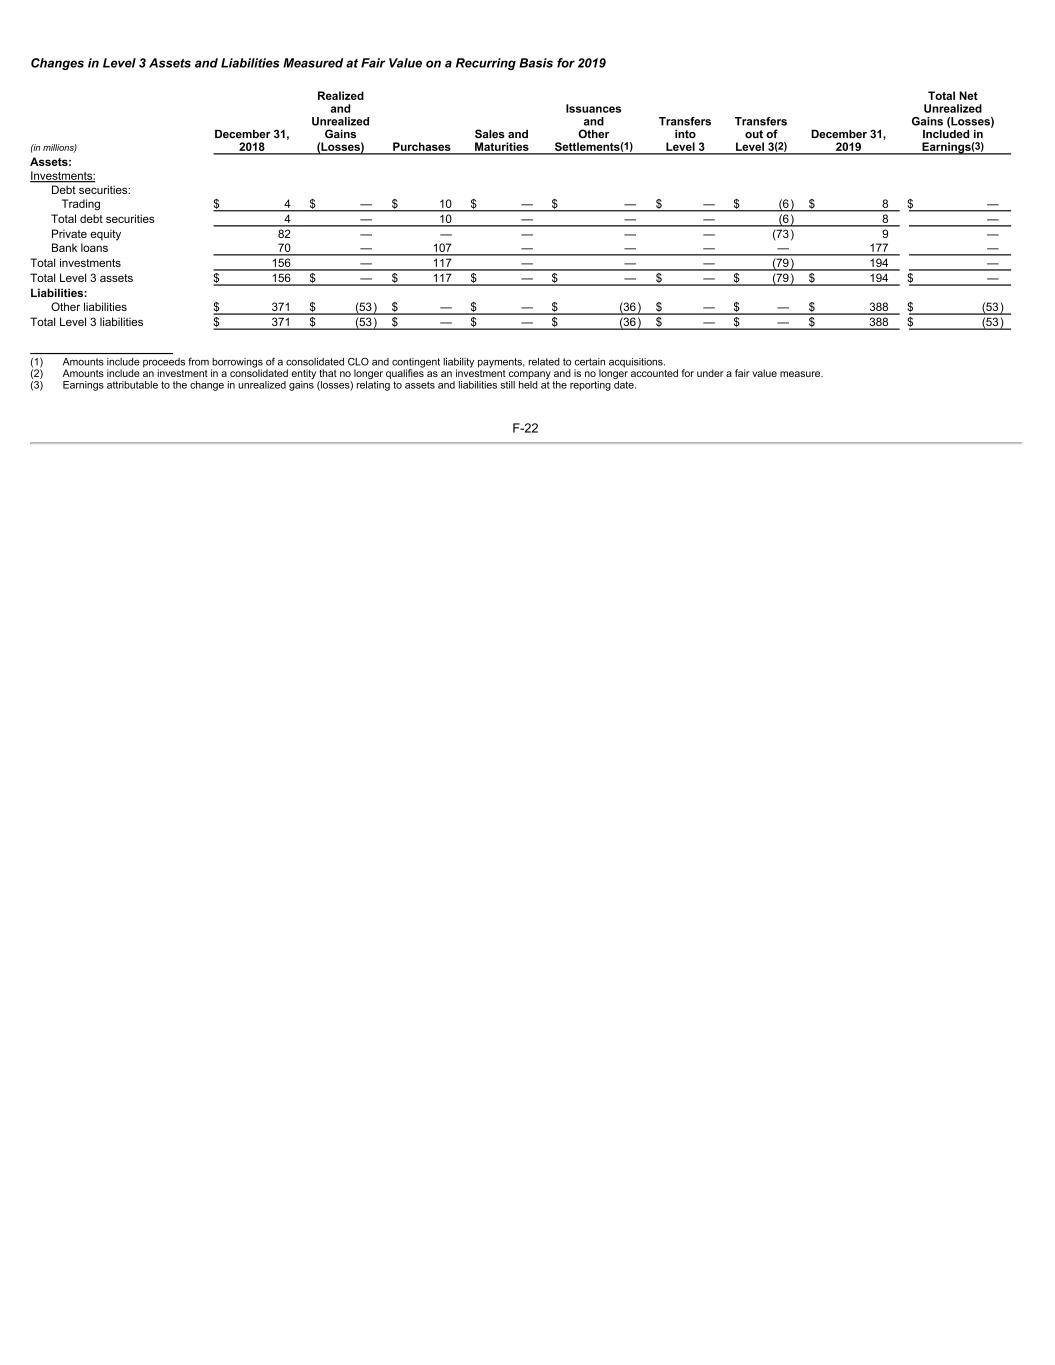
Changes in Level 3 Assets and Liabilities Measured at Fair Value on a Recurring Basis for 2019 (in millions) December 31, 2018 Realized and Unrealized Gains (Losses) Purchases Sales and Maturities Issuances and Other Settlements(1) Transfers into Level 3 Transfers out of Level 3(2) December 31, 2019 Total Net Unrealized Gains (Losses) Included in Earnings(3) Assets: Investments: Debt securities: Trading $ 4 $ — $ 10 $ — $ — $ — $ (6) $ 8 $ — Total debt securities 4 — 10 — — — (6) 8 — Private equity 82 — — — — — (73) 9 — Bank loans 70 — 107 — — — — 177 — Total investments 156 — 117 — — — (79) 194 — Total Level 3 assets $ 156 $ — $ 117 $ — $ — $ — $ (79) $ 194 $ — Liabilities: Other liabilities $ 371 $ (53) $ — $ — $ (36) $ — $ — $ 388 $ (53) Total Level 3 liabilities $ 371 $ (53) $ — $ — $ (36) $ — $ — $ 388 $ (53) (1) Amounts include proceeds from borrowings of a consolidated CLO and contingent liability payments, related to certain acquisitions. (2) Amounts include an investment in a consolidated entity that no longer qualifies as an investment company and is no longer accounted for under a fair value measure. (3) Earnings attributable to the change in unrealized gains (losses) relating to assets and liabilities still held at the reporting date. F-22

Realized and Unrealized Gains (Losses) for Level 3 Assets and Liabilities. Realized and unrealized gains (losses) recorded for Level 3 assets and liabilities are reported in nonoperating income (expense) on the consolidated statements of income. A portion of net income (loss) for consolidated sponsored investment funds are allocated to noncontrolling interests to reflect net income (loss) not attributable to the Company. Transfers in and/or out of Levels. Transfers in and/or out of levels are reflected when significant inputs, including market inputs or performance attributes, used for the fair value measurement become observable/unobservable, or when the carrying value of certain equity method investments no longer represents fair value as determined under valuation methodologies. Disclosures of Fair Value for Financial Instruments Not Held at Fair Value. At December 31, 2020 and 2019, the fair value of the Company’s financial instruments not held at fair value are categorized in the table below. December 31, 2020 December 31, 2019 (in millions) Carrying Amount Estimated Fair Value Carrying Amount Estimated Fair Value Fair Value Hierarchy Financial Assets(1): Cash and cash equivalents $ 8,664 $ 8,664 $ 4,829 $ 4,829 Level 1 (2) (3) Other assets 69 69 68 68 Level 1 (2) (4) Financial Liabilities: Long-term borrowings 7,264 7,883 4,955 5,254 Level 2 (5) (1) See Note 5, Investments, for further information on investments not held at fair value. (2) Cash and cash equivalents are carried at either cost or amortized cost, which approximates fair value due to their short-term maturities. (3) At December 31, 2020 and 2019, approximately $1,249 million and $674 million of money market funds were recorded within cash and cash equivalents on the consolidated statements of financial condition. Money market funds are valued based on quoted market prices, or $1.00 per share, which generally is the NAV of the fund. (4) Other assets include restricted cash and cash collateral deposited with certain derivative counterparties. The carrying values of these assets approximate fair value due to their short-term maturities. (5) Long-term borrowings are recorded at amortized cost, net of debt issuance costs. The fair value of the long-term borrowings, including the current portion of long-term borrowings, is determined using market prices at the end of December 2020 and 2019, respectively. See Note 15, Borrowings, for the fair value of each of the Company’s long-term borrowings. F-23
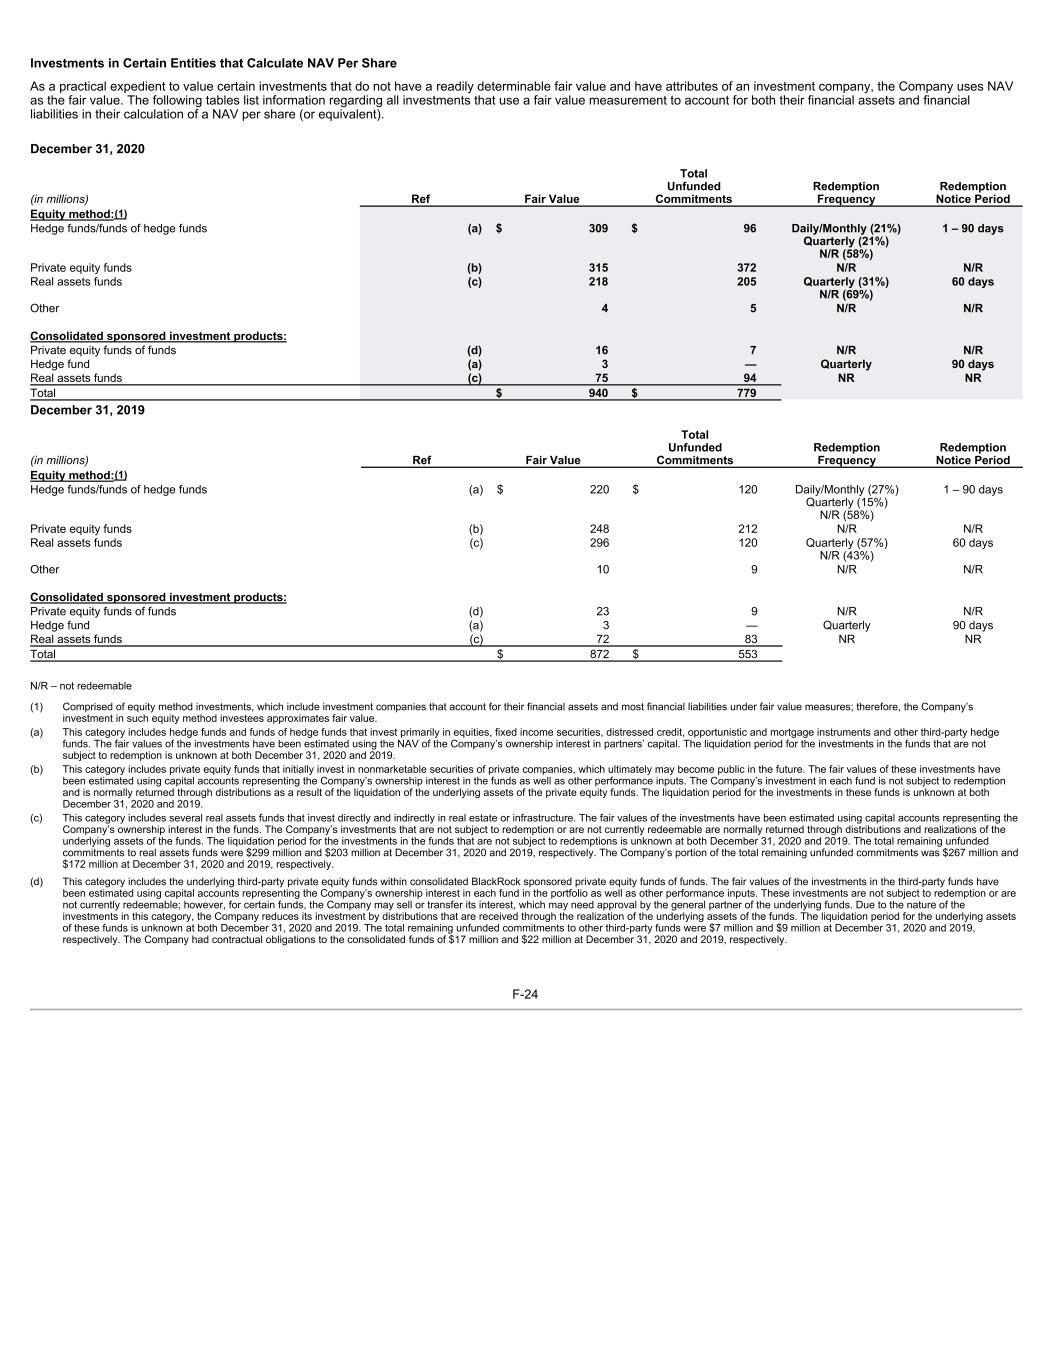
Investments in Certain Entities that Calculate NAV Per Share As a practical expedient to value certain investments that do not have a readily determinable fair value and have attributes of an investment company, the Company uses NAV as the fair value. The following tables list information regarding all investments that use a fair value measurement to account for both their financial assets and financial liabilities in their calculation of a NAV per share (or equivalent). December 31, 2020 (in millions) Ref Fair Value Total Unfunded Commitments Redemption Frequency Redemption Notice Period Equity method:(1) Hedge funds/funds of hedge funds (a) $ 309 $ 96 Daily/Monthly (21%) Quarterly (21%) N/R (58%) 1 – 90 days Private equity funds (b) 315 372 N/R N/R Real assets funds (c) 218 205 Quarterly (31%) N/R (69%) 60 days Other 4 5 N/R N/R Consolidated sponsored investment products: Private equity funds of funds (d) 16 7 N/R N/R Hedge fund (a) 3 — Quarterly 90 days Real assets funds (c) 75 94 NR NR Total $ 940 $ 779 December 31, 2019 (in millions) Ref Fair Value Total Unfunded Commitments Redemption Frequency Redemption Notice Period Equity method:(1) Hedge funds/funds of hedge funds (a) $ 220 $ 120 Daily/Monthly (27%) Quarterly (15%) N/R (58%) 1 – 90 days Private equity funds (b) 248 212 N/R N/R Real assets funds (c) 296 120 Quarterly (57%) N/R (43%) 60 days Other 10 9 N/R N/R Consolidated sponsored investment products: Private equity funds of funds (d) 23 9 N/R N/R Hedge fund (a) 3 — Quarterly 90 days Real assets funds (c) 72 83 NR NR Total $ 872 $ 553 N/R – not redeemable (1) Comprised of equity method investments, which include investment companies that account for their financial assets and most financial liabilities under fair value measures; therefore, the Company’s investment in such equity method investees approximates fair value. (a) This category includes hedge funds and funds of hedge funds that invest primarily in equities, fixed income securities, distressed credit, opportunistic and mortgage instruments and other third-party hedge funds. The fair values of the investments have been estimated using the NAV of the Company’s ownership interest in partners’ capital. The liquidation period for the investments in the funds that are not subject to redemption is unknown at both December 31, 2020 and 2019. (b) This category includes private equity funds that initially invest in nonmarketable securities of private companies, which ultimately may become public in the future. The fair values of these investments have been estimated using capital accounts representing the Company’s ownership interest in the funds as well as other performance inputs. The Company’s investment in each fund is not subject to redemption and is normally returned through distributions as a result of the liquidation of the underlying assets of the private equity funds. The liquidation period for the investments in these funds is unknown at both December 31, 2020 and 2019. (c) This category includes several real assets funds that invest directly and indirectly in real estate or infrastructure. The fair values of the investments have been estimated using capital accounts representing the Company’s ownership interest in the funds. The Company’s investments that are not subject to redemption or are not currently redeemable are normally returned through distributions and realizations of the underlying assets of the funds. The liquidation period for the investments in the funds that are not subject to redemptions is unknown at both December 31, 2020 and 2019. The total remaining unfunded commitments to real assets funds were $299 million and $203 million at December 31, 2020 and 2019, respectively. The Company’s portion of the total remaining unfunded commitments was $267 million and $172 million at December 31, 2020 and 2019, respectively. (d) This category includes the underlying third-party private equity funds within consolidated BlackRock sponsored private equity funds of funds. The fair values of the investments in the third-party funds have been estimated using capital accounts representing the Company’s ownership interest in each fund in the portfolio as well as other performance inputs. These investments are not subject to redemption or are not currently redeemable; however, for certain funds, the Company may sell or transfer its interest, which may need approval by the general partner of the underlying funds. Due to the nature of the investments in this category, the Company reduces its investment by distributions that are received through the realization of the underlying assets of the funds. The liquidation period for the underlying assets of these funds is unknown at both December 31, 2020 and 2019. The total remaining unfunded commitments to other third-party funds were $7 million and $9 million at December 31, 2020 and 2019, respectively. The Company had contractual obligations to the consolidated funds of $17 million and $22 million at December 31, 2020 and 2019, respectively. F-24

Fair Value Option At December 31, 2020 and 2019, the Company elected the fair value option for certain investments in CLOs of approximately $35 million and $37 million, respectively, reported within investments. In addition, the Company elected the fair value option for bank loans and borrowings of a consolidated CLO, recorded within investments and other liabilities, respectively. The following table summarizes the information related to these bank loans and borrowings at December 31, 2020 and 2019: December 31, December 31, (in millions) 2020 2019 CLO Bank loans: Aggregate principal amounts outstanding $ 250 $ 204 Fair value 248 204 Aggregate unpaid principal balance in excess of (less than) fair value $ 2 $ — CLO Borrowings: Aggregate principal amounts outstanding $ 244 $ 195 Fair value $ 246 $ 195 At December 31, 2020, the principal amounts outstanding of the borrowings issued by the CLOs mature in 2030. During the year ended December 31, 2020 and 2019, the net gains (losses) from the change in fair value of the bank loans and borrowings held by the consolidated CLO were not material and were recorded in net gain (loss) on the consolidated statements of income. The change in fair value of the assets and liabilities included interest income and expense, respectively. 9. Derivatives and Hedging The Company maintains a program to enter into swaps to hedge against market price and interest rate exposures with respect to certain seed investments in sponsored investment products. At December 31, 2020 and 2019, the Company had outstanding total return swaps with aggregate notional values of approximately $833 million and $644 million, respectively. The Company executes forward foreign currency exchange contracts to mitigate the risk of certain foreign exchange movements. At December 31, 2020 and 2019, the Company had outstanding forward foreign currency exchange contracts with aggregate notional values of approximately $2.8 billion and $3.4 billion, respectively and with expiration dates in January 2021 and January 2020, respectively. At both December 31, 2020 and 2019, the Company had a derivative providing credit protection with a notional amount of approximately $17 million to a counterparty, representing the Company’s maximum risk of loss with respect to the derivative. The Company carries the derivative at fair value based on the expected discounted future cash outflows under the arrangement. The following table presents the fair values of derivative instruments recognized in the consolidated statements of financial condition at December 31, 2020: December 31, 2020 (in millions) Assets Liabilities Derivative instruments Statement of Financial Condition Classification Fair Value Statement of Financial Condition Classification Fair Value Total return swaps Other assets $ — Other liabilities $ 50 Forward foreign currency exchange contracts Other assets 13 Other liabilities 5 Total $ 13 $ 55 The fair values of the outstanding total return swaps and forward foreign currency exchange contracts were not material to the consolidated statement of financial condition at December 31, 2019. The following table presents realized and unrealized gains (losses) recognized in the consolidated statements of income on derivative instruments: (in millions) Gains (Losses) Derivative Instruments Statement of Income Classification 2020 2019 2018 Total return swaps Nonoperating income (expense) $ (93) $ (106) $ 54 Forward foreign currency exchange contracts General and administration expense 47 55 (124) Total gain (loss) from derivative instruments $ (46) $ (51) $ (70) The Company consolidates certain sponsored investment funds, which may utilize derivative instruments as a part of the funds’ investment strategies. The change in fair value of such derivatives, which is recorded in nonoperating income (expense), was not material for 2020, 2019 and 2018. See Note 15, Borrowings, for more information on the Company’s net investment hedge. F-25
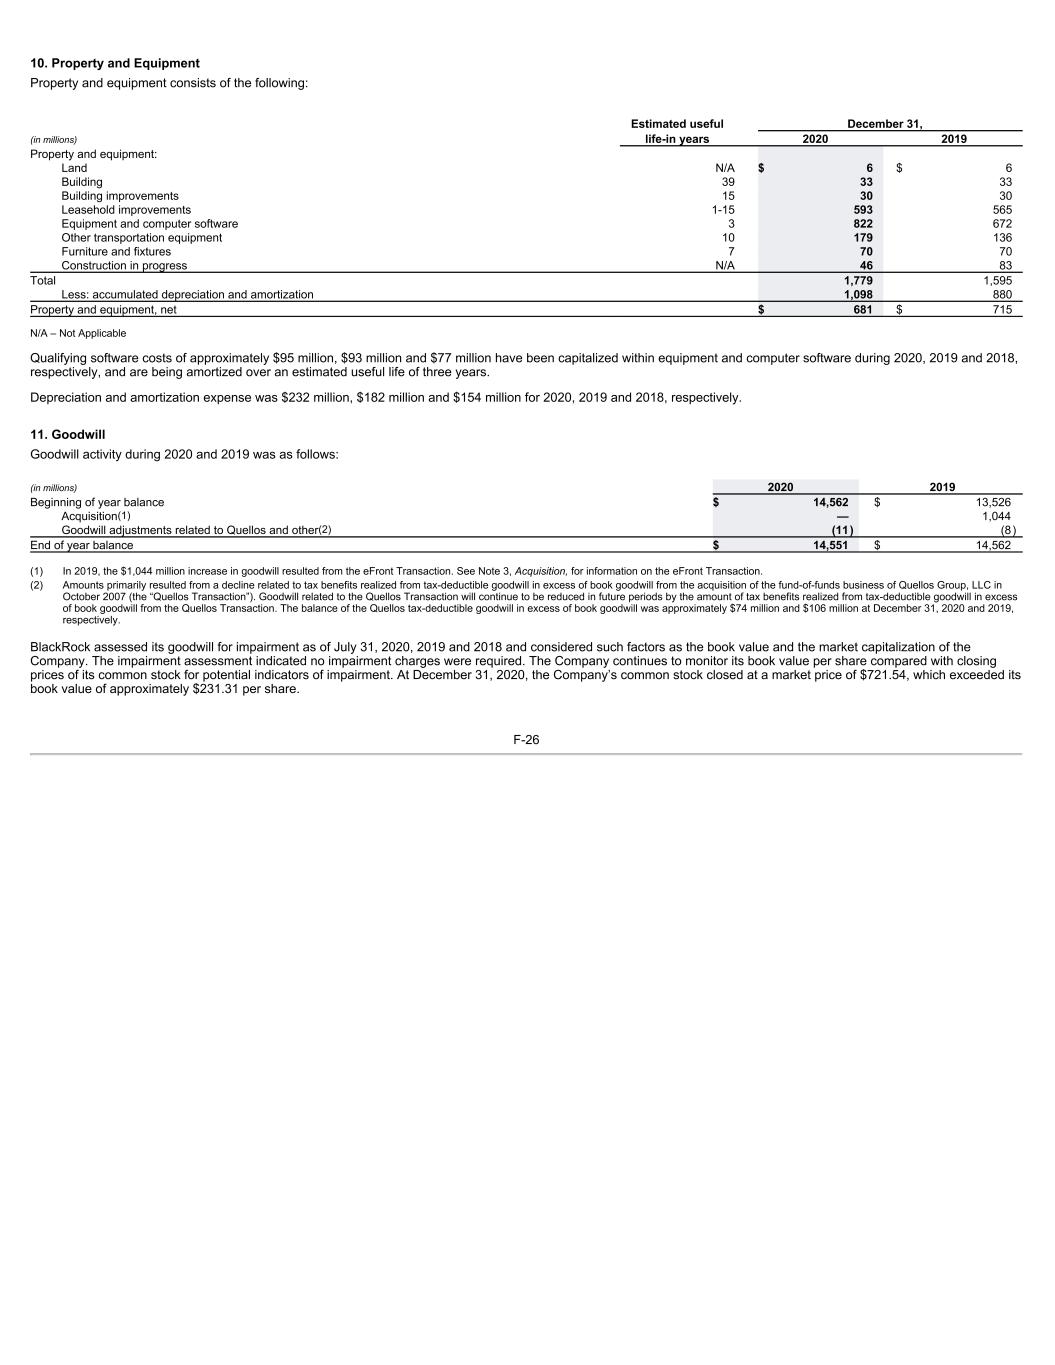
10. Property and Equipment Property and equipment consists of the following: Estimated useful December 31, (in millions) life-in years 2020 2019 Property and equipment: Land N/A $ 6 $ 6 Building 39 33 33 Building improvements 15 30 30 Leasehold improvements 1-15 593 565 Equipment and computer software 3 822 672 Other transportation equipment 10 179 136 Furniture and fixtures 7 70 70 Construction in progress N/A 46 83 Total 1,779 1,595 Less: accumulated depreciation and amortization 1,098 880 Property and equipment, net $ 681 $ 715 N/A – Not Applicable Qualifying software costs of approximately $95 million, $93 million and $77 million have been capitalized within equipment and computer software during 2020, 2019 and 2018, respectively, and are being amortized over an estimated useful life of three years. Depreciation and amortization expense was $232 million, $182 million and $154 million for 2020, 2019 and 2018, respectively. 11. Goodwill Goodwill activity during 2020 and 2019 was as follows: (in millions) 2020 2019 Beginning of year balance $ 14,562 $ 13,526 Acquisition(1) — 1,044 Goodwill adjustments related to Quellos and other(2) (11) (8) End of year balance $ 14,551 $ 14,562 (1) In 2019, the $1,044 million increase in goodwill resulted from the eFront Transaction. See Note 3, Acquisition, for information on the eFront Transaction. (2) Amounts primarily resulted from a decline related to tax benefits realized from tax-deductible goodwill in excess of book goodwill from the acquisition of the fund-of-funds business of Quellos Group, LLC in October 2007 (the “Quellos Transaction”). Goodwill related to the Quellos Transaction will continue to be reduced in future periods by the amount of tax benefits realized from tax-deductible goodwill in excess of book goodwill from the Quellos Transaction. The balance of the Quellos tax-deductible goodwill in excess of book goodwill was approximately $74 million and $106 million at December 31, 2020 and 2019, respectively. BlackRock assessed its goodwill for impairment as of July 31, 2020, 2019 and 2018 and considered such factors as the book value and the market capitalization of the Company. The impairment assessment indicated no impairment charges were required. The Company continues to monitor its book value per share compared with closing prices of its common stock for potential indicators of impairment. At December 31, 2020, the Company’s common stock closed at a market price of $721.54, which exceeded its book value of approximately $231.31 per share. F-26
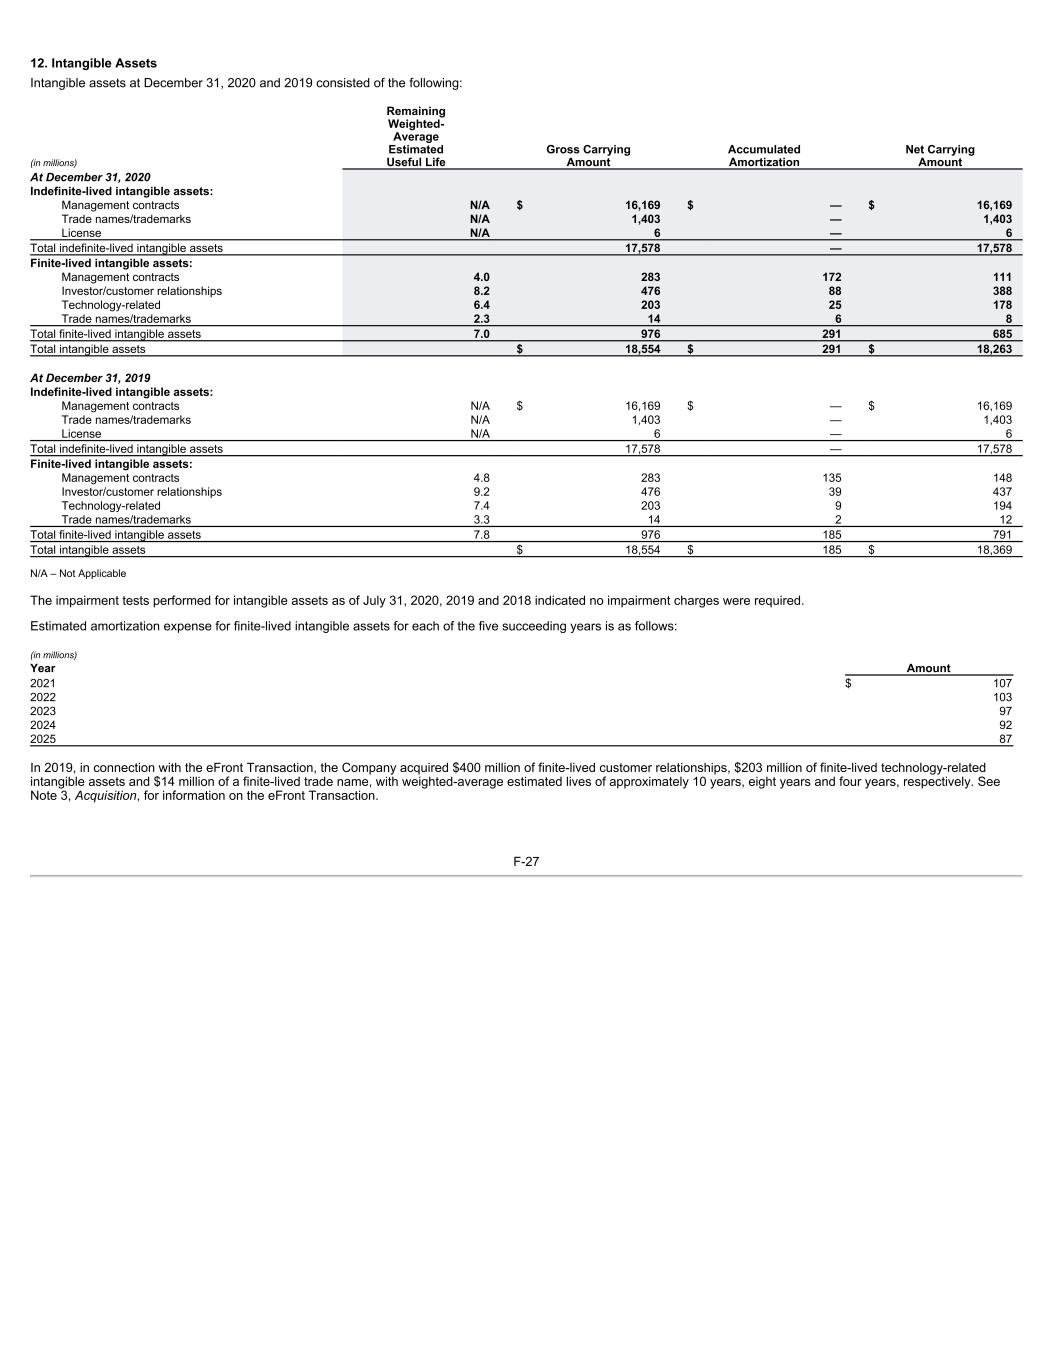
12. Intangible Assets Intangible assets at December 31, 2020 and 2019 consisted of the following: (in millions) Remaining Weighted- Average Estimated Useful Life Gross Carrying Amount Accumulated Amortization Net Carrying Amount At December 31, 2020 Indefinite-lived intangible assets: Management contracts N/A $ 16,169 $ — $ 16,169 Trade names/trademarks N/A 1,403 — 1,403 License N/A 6 — 6 Total indefinite-lived intangible assets 17,578 — 17,578 Finite-lived intangible assets: Management contracts 4.0 283 172 111 Investor/customer relationships 8.2 476 88 388 Technology-related 6.4 203 25 178 Trade names/trademarks 2.3 14 6 8 Total finite-lived intangible assets 7.0 976 291 685 Total intangible assets $ 18,554 $ 291 $ 18,263 At December 31, 2019 Indefinite-lived intangible assets: Management contracts N/A $ 16,169 $ — $ 16,169 Trade names/trademarks N/A 1,403 — 1,403 License N/A 6 — 6 Total indefinite-lived intangible assets 17,578 — 17,578 Finite-lived intangible assets: Management contracts 4.8 283 135 148 Investor/customer relationships 9.2 476 39 437 Technology-related 7.4 203 9 194 Trade names/trademarks 3.3 14 2 12 Total finite-lived intangible assets 7.8 976 185 791 Total intangible assets $ 18,554 $ 185 $ 18,369 N/A – Not Applicable The impairment tests performed for intangible assets as of July 31, 2020, 2019 and 2018 indicated no impairment charges were required. Estimated amortization expense for finite-lived intangible assets for each of the five succeeding years is as follows: (in millions) Year Amount 2021 $ 107 2022 103 2023 97 2024 92 2025 87 In 2019, in connection with the eFront Transaction, the Company acquired $400 million of finite-lived customer relationships, $203 million of finite-lived technology-related intangible assets and $14 million of a finite-lived trade name, with weighted-average estimated lives of approximately 10 years, eight years and four years, respectively. See Note 3, Acquisition, for information on the eFront Transaction. F-27
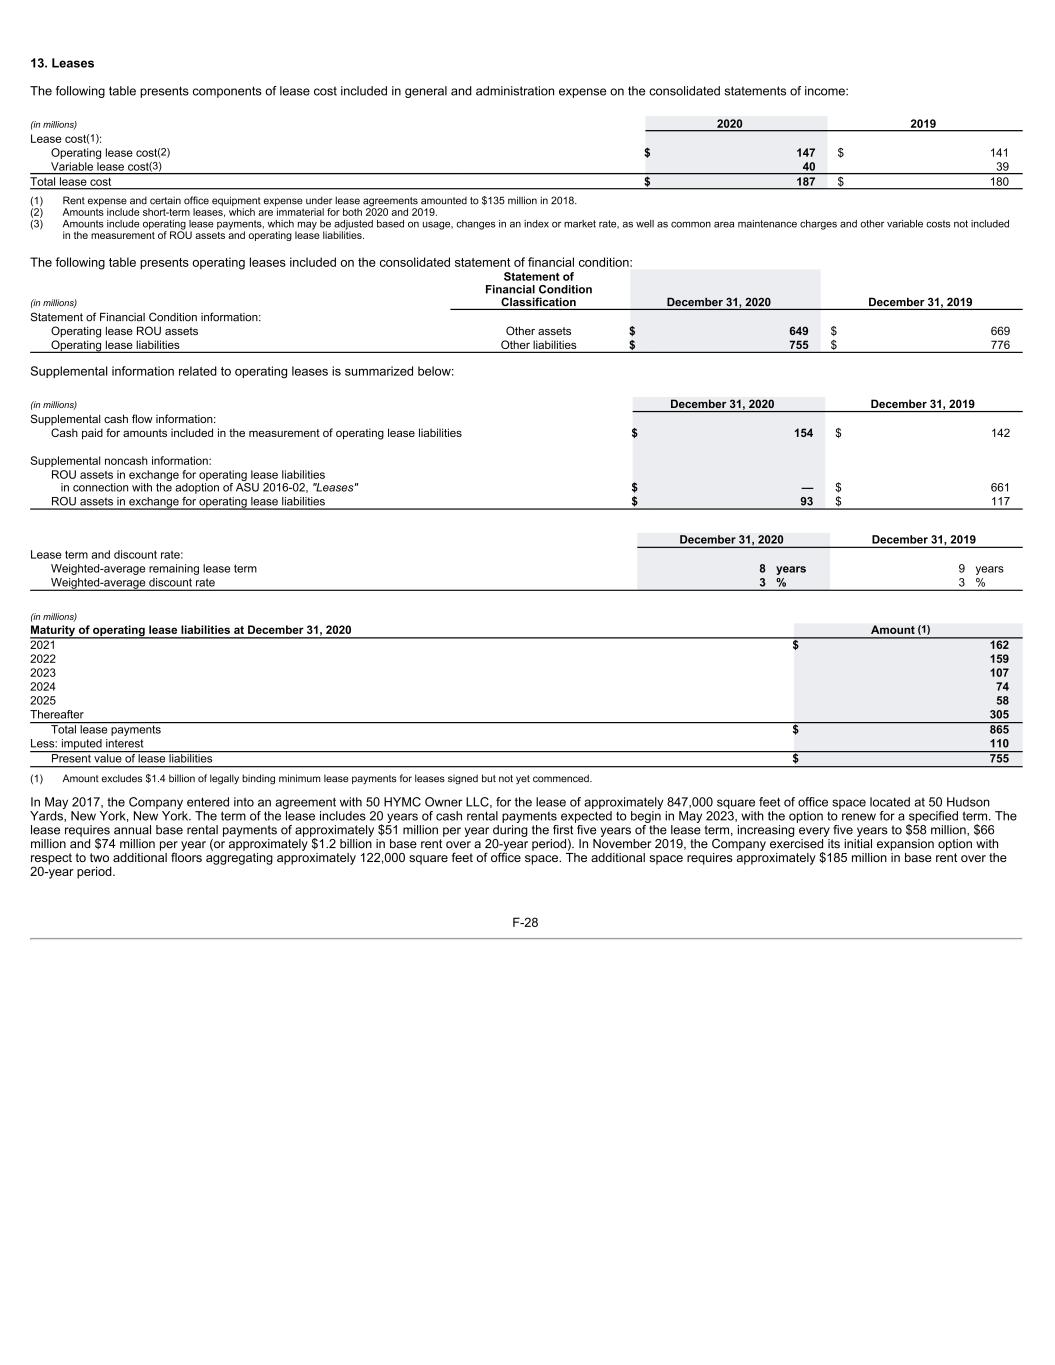
13. Leases The following table presents components of lease cost included in general and administration expense on the consolidated statements of income: (in millions) 2020 2019 Lease cost(1): Operating lease cost(2) $ 147 $ 141 Variable lease cost(3) 40 39 Total lease cost $ 187 $ 180 (1) Rent expense and certain office equipment expense under lease agreements amounted to $135 million in 2018. (2) Amounts include short-term leases, which are immaterial for both 2020 and 2019. (3) Amounts include operating lease payments, which may be adjusted based on usage, changes in an index or market rate, as well as common area maintenance charges and other variable costs not included in the measurement of ROU assets and operating lease liabilities. The following table presents operating leases included on the consolidated statement of financial condition: (in millions) Statement of Financial Condition Classification December 31, 2020 December 31, 2019 Statement of Financial Condition information: Operating lease ROU assets Other assets $ 649 $ 669 Operating lease liabilities Other liabilities $ 755 $ 776 Supplemental information related to operating leases is summarized below: (in millions) December 31, 2020 December 31, 2019 Supplemental cash flow information: Cash paid for amounts included in the measurement of operating lease liabilities $ 154 $ 142 Supplemental noncash information: ROU assets in exchange for operating lease liabilities in connection with the adoption of ASU 2016-02, "Leases" $ — $ 661 ROU assets in exchange for operating lease liabilities $ 93 $ 117 December 31, 2020 December 31, 2019 Lease term and discount rate: Weighted-average remaining lease term 8 years 9 years Weighted-average discount rate 3 % 3 % (in millions) Maturity of operating lease liabilities at December 31, 2020 Amount (1) 2021 $ 162 2022 159 2023 107 2024 74 2025 58 Thereafter 305 Total lease payments $ 865 Less: imputed interest 110 Present value of lease liabilities $ 755 (1) Amount excludes $1.4 billion of legally binding minimum lease payments for leases signed but not yet commenced. In May 2017, the Company entered into an agreement with 50 HYMC Owner LLC, for the lease of approximately 847,000 square feet of office space located at 50 Hudson Yards, New York, New York. The term of the lease includes 20 years of cash rental payments expected to begin in May 2023, with the option to renew for a specified term. The lease requires annual base rental payments of approximately $51 million per year during the first five years of the lease term, increasing every five years to $58 million, $66 million and $74 million per year (or approximately $1.2 billion in base rent over a 20-year period). In November 2019, the Company exercised its initial expansion option with respect to two additional floors aggregating approximately 122,000 square feet of office space. The additional space requires approximately $185 million in base rent over the 20-year period. F-28
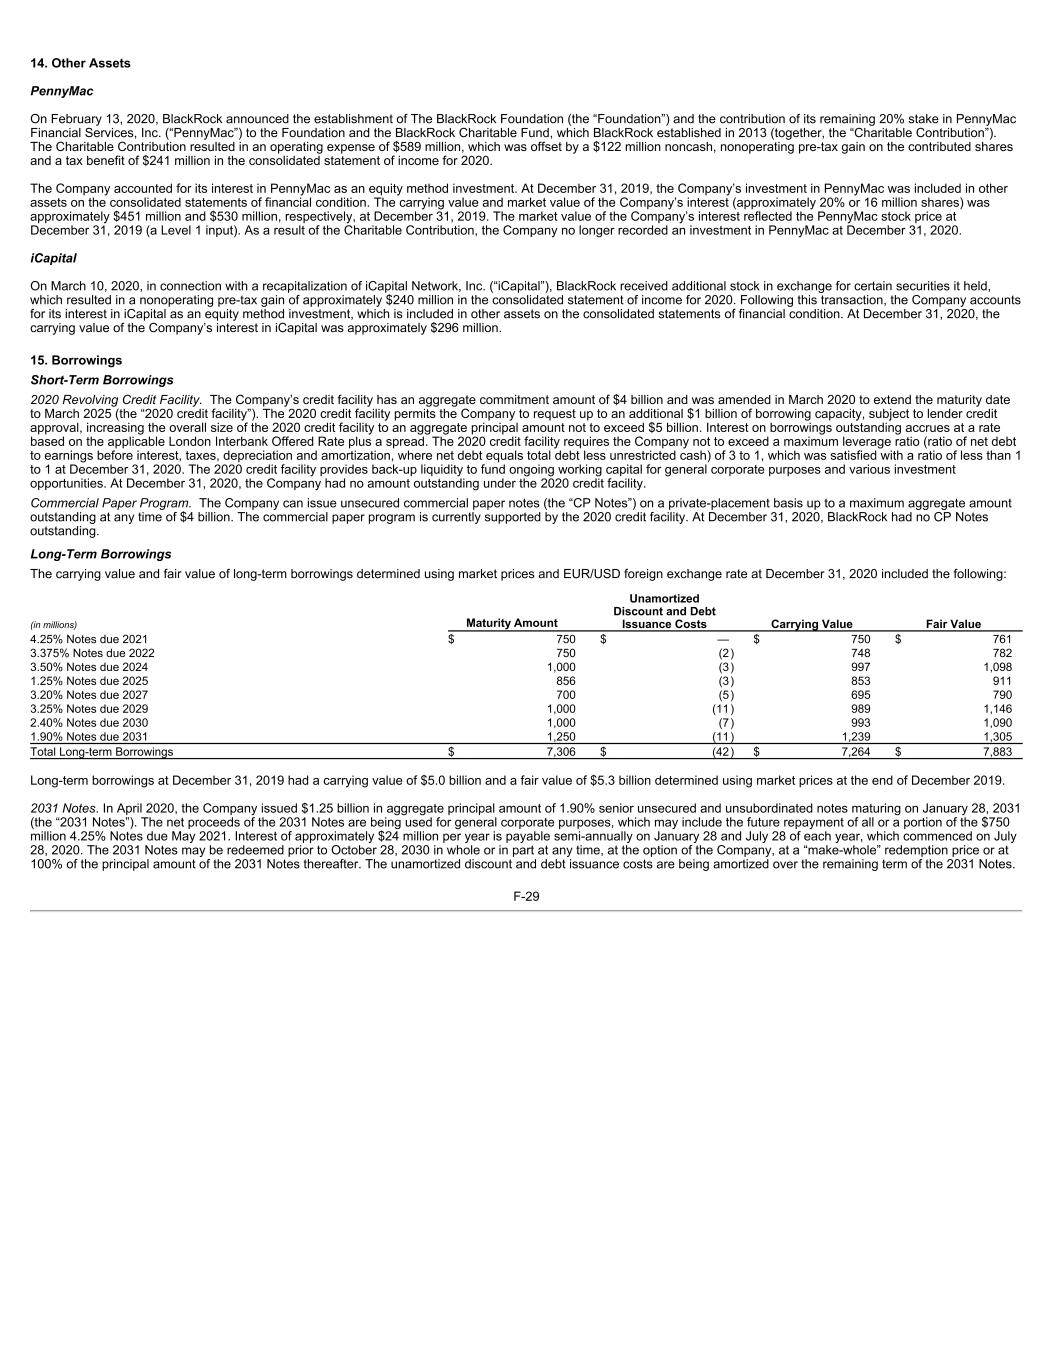
14. Other Assets PennyMac On February 13, 2020, BlackRock announced the establishment of The BlackRock Foundation (the “Foundation”) and the contribution of its remaining 20% stake in PennyMac Financial Services, Inc. (“PennyMac”) to the Foundation and the BlackRock Charitable Fund, which BlackRock established in 2013 (together, the “Charitable Contribution”). The Charitable Contribution resulted in an operating expense of $589 million, which was offset by a $122 million noncash, nonoperating pre-tax gain on the contributed shares and a tax benefit of $241 million in the consolidated statement of income for 2020. The Company accounted for its interest in PennyMac as an equity method investment. At December 31, 2019, the Company’s investment in PennyMac was included in other assets on the consolidated statements of financial condition. The carrying value and market value of the Company’s interest (approximately 20% or 16 million shares) was approximately $451 million and $530 million, respectively, at December 31, 2019. The market value of the Company’s interest reflected the PennyMac stock price at December 31, 2019 (a Level 1 input). As a result of the Charitable Contribution, the Company no longer recorded an investment in PennyMac at December 31, 2020. iCapital On March 10, 2020, in connection with a recapitalization of iCapital Network, Inc. (“iCapital”), BlackRock received additional stock in exchange for certain securities it held, which resulted in a nonoperating pre-tax gain of approximately $240 million in the consolidated statement of income for 2020. Following this transaction, the Company accounts for its interest in iCapital as an equity method investment, which is included in other assets on the consolidated statements of financial condition. At December 31, 2020, the carrying value of the Company’s interest in iCapital was approximately $296 million. 15. Borrowings Short-Term Borrowings 2020 Revolving Credit Facility. The Company’s credit facility has an aggregate commitment amount of $4 billion and was amended in March 2020 to extend the maturity date to March 2025 (the “2020 credit facility”). The 2020 credit facility permits the Company to request up to an additional $1 billion of borrowing capacity, subject to lender credit approval, increasing the overall size of the 2020 credit facility to an aggregate principal amount not to exceed $5 billion. Interest on borrowings outstanding accrues at a rate based on the applicable London Interbank Offered Rate plus a spread. The 2020 credit facility requires the Company not to exceed a maximum leverage ratio (ratio of net debt to earnings before interest, taxes, depreciation and amortization, where net debt equals total debt less unrestricted cash) of 3 to 1, which was satisfied with a ratio of less than 1 to 1 at December 31, 2020. The 2020 credit facility provides back-up liquidity to fund ongoing working capital for general corporate purposes and various investment opportunities. At December 31, 2020, the Company had no amount outstanding under the 2020 credit facility. Commercial Paper Program. The Company can issue unsecured commercial paper notes (the “CP Notes”) on a private-placement basis up to a maximum aggregate amount outstanding at any time of $4 billion. The commercial paper program is currently supported by the 2020 credit facility. At December 31, 2020, BlackRock had no CP Notes outstanding. Long-Term Borrowings The carrying value and fair value of long-term borrowings determined using market prices and EUR/USD foreign exchange rate at December 31, 2020 included the following: (in millions) Maturity Amount Unamortized Discount and Debt Issuance Costs Carrying Value Fair Value 4.25% Notes due 2021 $ 750 $ — $ 750 $ 761 3.375% Notes due 2022 750 (2) 748 782 3.50% Notes due 2024 1,000 (3) 997 1,098 1.25% Notes due 2025 856 (3) 853 911 3.20% Notes due 2027 700 (5) 695 790 3.25% Notes due 2029 1,000 (11) 989 1,146 2.40% Notes due 2030 1,000 (7) 993 1,090 1.90% Notes due 2031 1,250 (11) 1,239 1,305 Total Long-term Borrowings $ 7,306 $ (42) $ 7,264 $ 7,883 Long-term borrowings at December 31, 2019 had a carrying value of $5.0 billion and a fair value of $5.3 billion determined using market prices at the end of December 2019. 2031 Notes. In April 2020, the Company issued $1.25 billion in aggregate principal amount of 1.90% senior unsecured and unsubordinated notes maturing on January 28, 2031 (the “2031 Notes”). The net proceeds of the 2031 Notes are being used for general corporate purposes, which may include the future repayment of all or a portion of the $750 million 4.25% Notes due May 2021. Interest of approximately $24 million per year is payable semi-annually on January 28 and July 28 of each year, which commenced on July 28, 2020. The 2031 Notes may be redeemed prior to October 28, 2030 in whole or in part at any time, at the option of the Company, at a “make-whole” redemption price or at 100% of the principal amount of the 2031 Notes thereafter. The unamortized discount and debt issuance costs are being amortized over the remaining term of the 2031 Notes. F-29
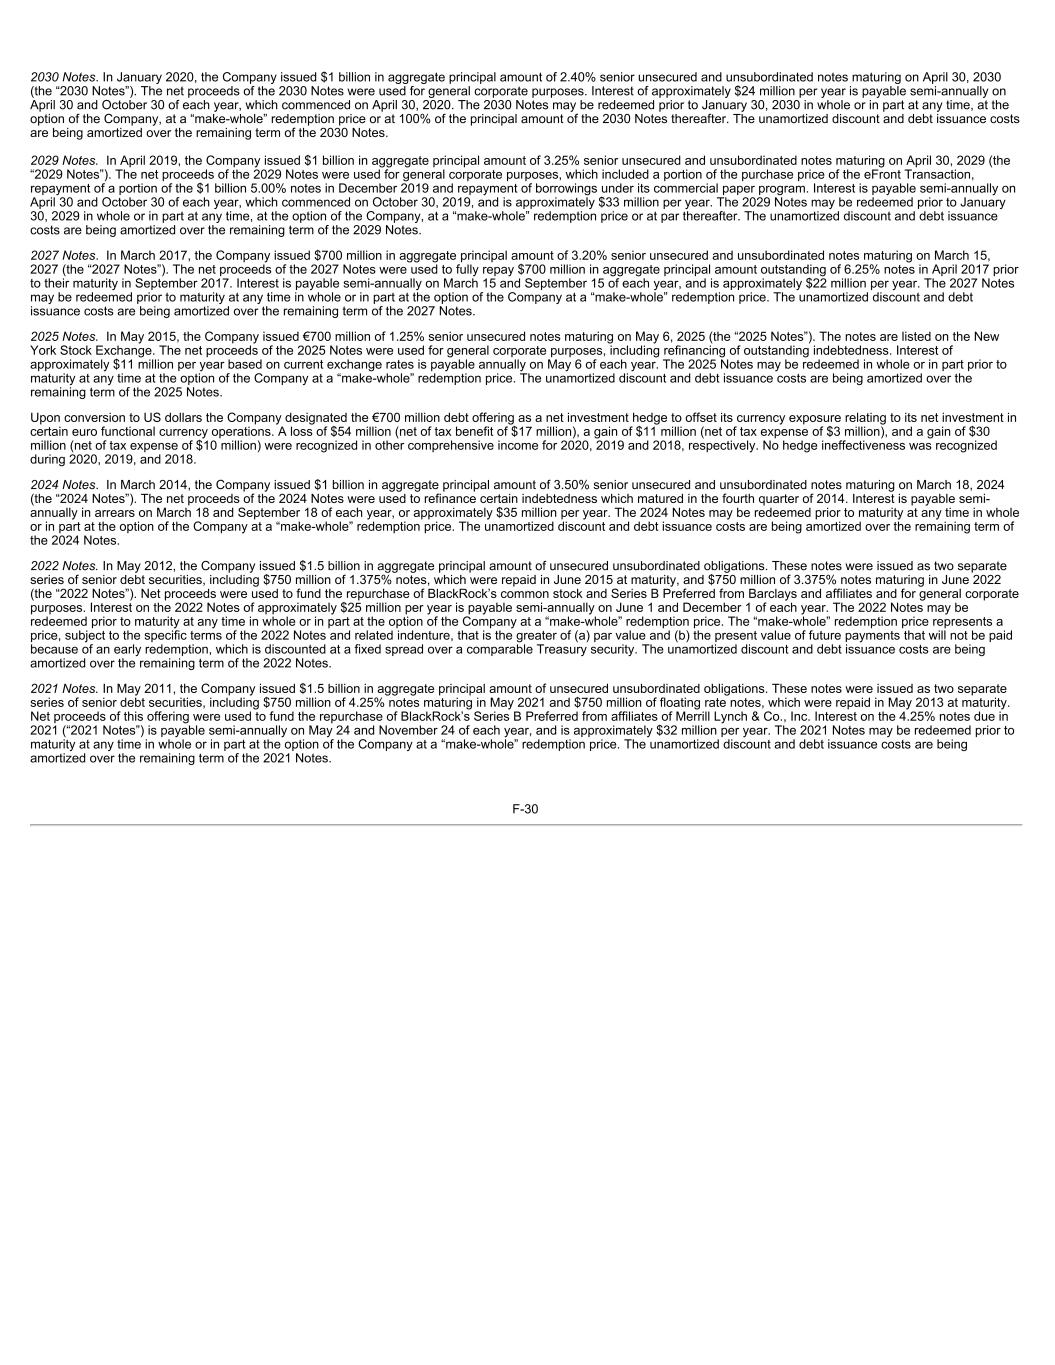
2030 Notes. In January 2020, the Company issued $1 billion in aggregate principal amount of 2.40% senior unsecured and unsubordinated notes maturing on April 30, 2030 (the “2030 Notes”). The net proceeds of the 2030 Notes were used for general corporate purposes. Interest of approximately $24 million per year is payable semi-annually on April 30 and October 30 of each year, which commenced on April 30, 2020. The 2030 Notes may be redeemed prior to January 30, 2030 in whole or in part at any time, at the option of the Company, at a “make-whole” redemption price or at 100% of the principal amount of the 2030 Notes thereafter. The unamortized discount and debt issuance costs are being amortized over the remaining term of the 2030 Notes. 2029 Notes. In April 2019, the Company issued $1 billion in aggregate principal amount of 3.25% senior unsecured and unsubordinated notes maturing on April 30, 2029 (the “2029 Notes”). The net proceeds of the 2029 Notes were used for general corporate purposes, which included a portion of the purchase price of the eFront Transaction, repayment of a portion of the $1 billion 5.00% notes in December 2019 and repayment of borrowings under its commercial paper program. Interest is payable semi-annually on April 30 and October 30 of each year, which commenced on October 30, 2019, and is approximately $33 million per year. The 2029 Notes may be redeemed prior to January 30, 2029 in whole or in part at any time, at the option of the Company, at a “make-whole” redemption price or at par thereafter. The unamortized discount and debt issuance costs are being amortized over the remaining term of the 2029 Notes. 2027 Notes. In March 2017, the Company issued $700 million in aggregate principal amount of 3.20% senior unsecured and unsubordinated notes maturing on March 15, 2027 (the “2027 Notes”). The net proceeds of the 2027 Notes were used to fully repay $700 million in aggregate principal amount outstanding of 6.25% notes in April 2017 prior to their maturity in September 2017. Interest is payable semi-annually on March 15 and September 15 of each year, and is approximately $22 million per year. The 2027 Notes may be redeemed prior to maturity at any time in whole or in part at the option of the Company at a “make-whole” redemption price. The unamortized discount and debt issuance costs are being amortized over the remaining term of the 2027 Notes. 2025 Notes. In May 2015, the Company issued €700 million of 1.25% senior unsecured notes maturing on May 6, 2025 (the “2025 Notes”). The notes are listed on the New York Stock Exchange. The net proceeds of the 2025 Notes were used for general corporate purposes, including refinancing of outstanding indebtedness. Interest of approximately $11 million per year based on current exchange rates is payable annually on May 6 of each year. The 2025 Notes may be redeemed in whole or in part prior to maturity at any time at the option of the Company at a “make-whole” redemption price. The unamortized discount and debt issuance costs are being amortized over the remaining term of the 2025 Notes. Upon conversion to US dollars the Company designated the €700 million debt offering as a net investment hedge to offset its currency exposure relating to its net investment in certain euro functional currency operations. A loss of $54 million (net of tax benefit of $17 million), a gain of $11 million (net of tax expense of $3 million), and a gain of $30 million (net of tax expense of $10 million) were recognized in other comprehensive income for 2020, 2019 and 2018, respectively. No hedge ineffectiveness was recognized during 2020, 2019, and 2018. 2024 Notes. In March 2014, the Company issued $1 billion in aggregate principal amount of 3.50% senior unsecured and unsubordinated notes maturing on March 18, 2024 (the “2024 Notes”). The net proceeds of the 2024 Notes were used to refinance certain indebtedness which matured in the fourth quarter of 2014. Interest is payable semi- annually in arrears on March 18 and September 18 of each year, or approximately $35 million per year. The 2024 Notes may be redeemed prior to maturity at any time in whole or in part at the option of the Company at a “make-whole” redemption price. The unamortized discount and debt issuance costs are being amortized over the remaining term of the 2024 Notes. 2022 Notes. In May 2012, the Company issued $1.5 billion in aggregate principal amount of unsecured unsubordinated obligations. These notes were issued as two separate series of senior debt securities, including $750 million of 1.375% notes, which were repaid in June 2015 at maturity, and $750 million of 3.375% notes maturing in June 2022 (the “2022 Notes”). Net proceeds were used to fund the repurchase of BlackRock’s common stock and Series B Preferred from Barclays and affiliates and for general corporate purposes. Interest on the 2022 Notes of approximately $25 million per year is payable semi-annually on June 1 and December 1 of each year. The 2022 Notes may be redeemed prior to maturity at any time in whole or in part at the option of the Company at a “make-whole” redemption price. The “make-whole” redemption price represents a price, subject to the specific terms of the 2022 Notes and related indenture, that is the greater of (a) par value and (b) the present value of future payments that will not be paid because of an early redemption, which is discounted at a fixed spread over a comparable Treasury security. The unamortized discount and debt issuance costs are being amortized over the remaining term of the 2022 Notes. 2021 Notes. In May 2011, the Company issued $1.5 billion in aggregate principal amount of unsecured unsubordinated obligations. These notes were issued as two separate series of senior debt securities, including $750 million of 4.25% notes maturing in May 2021 and $750 million of floating rate notes, which were repaid in May 2013 at maturity. Net proceeds of this offering were used to fund the repurchase of BlackRock’s Series B Preferred from affiliates of Merrill Lynch & Co., Inc. Interest on the 4.25% notes due in 2021 (“2021 Notes”) is payable semi-annually on May 24 and November 24 of each year, and is approximately $32 million per year. The 2021 Notes may be redeemed prior to maturity at any time in whole or in part at the option of the Company at a “make-whole” redemption price. The unamortized discount and debt issuance costs are being amortized over the remaining term of the 2021 Notes. F-30
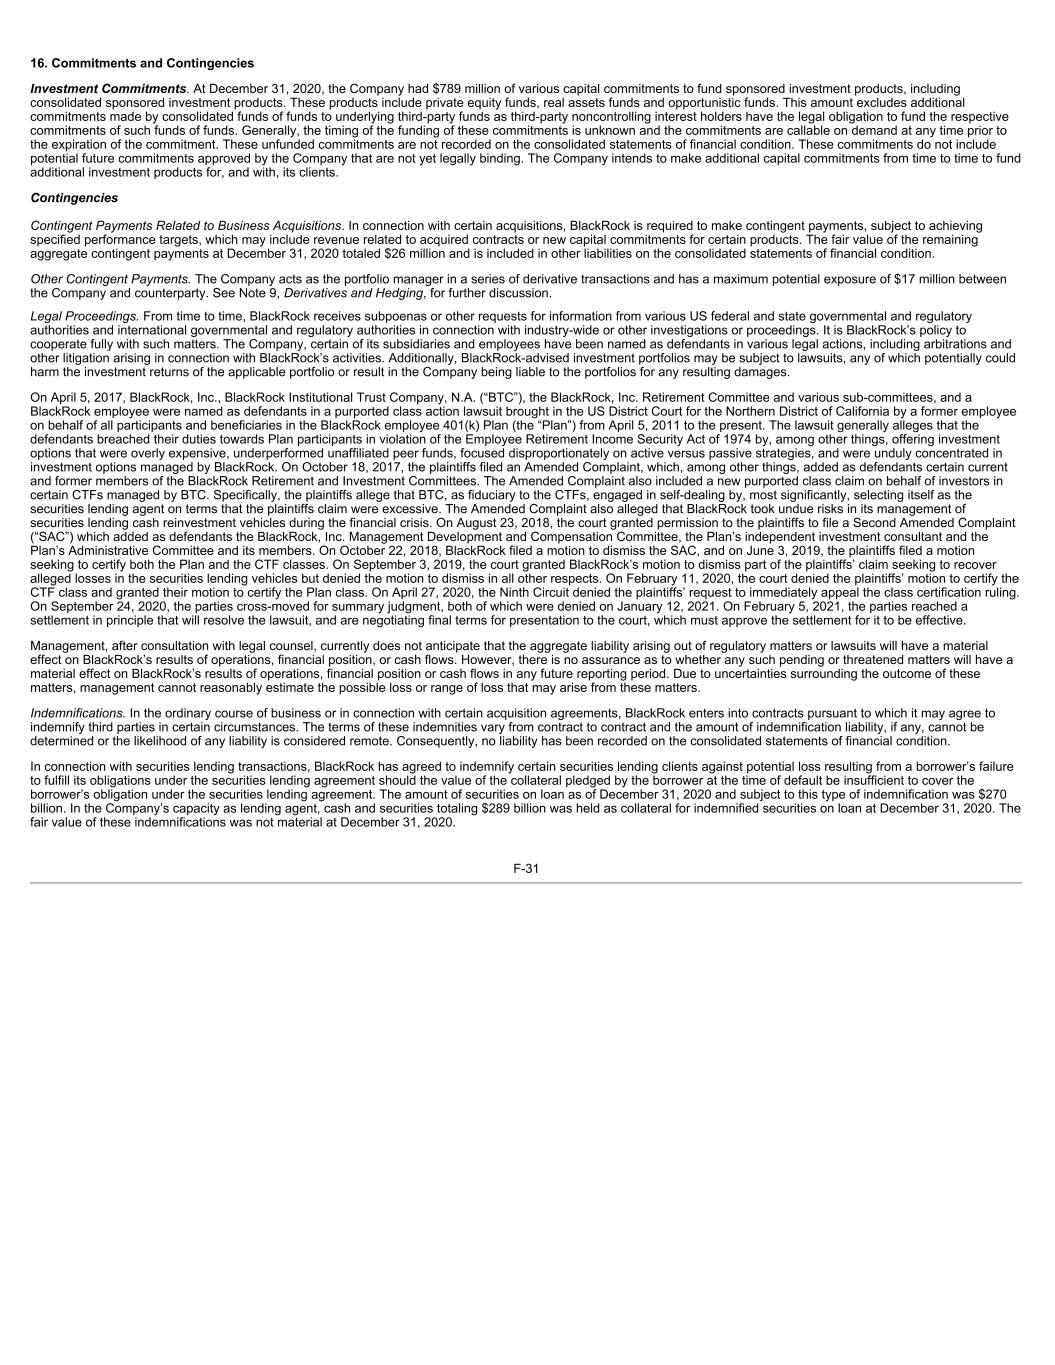
16. Commitments and Contingencies Investment Commitments. At December 31, 2020, the Company had $789 million of various capital commitments to fund sponsored investment products, including consolidated sponsored investment products. These products include private equity funds, real assets funds and opportunistic funds. This amount excludes additional commitments made by consolidated funds of funds to underlying third-party funds as third-party noncontrolling interest holders have the legal obligation to fund the respective commitments of such funds of funds. Generally, the timing of the funding of these commitments is unknown and the commitments are callable on demand at any time prior to the expiration of the commitment. These unfunded commitments are not recorded on the consolidated statements of financial condition. These commitments do not include potential future commitments approved by the Company that are not yet legally binding. The Company intends to make additional capital commitments from time to time to fund additional investment products for, and with, its clients. Contingencies Contingent Payments Related to Business Acquisitions. In connection with certain acquisitions, BlackRock is required to make contingent payments, subject to achieving specified performance targets, which may include revenue related to acquired contracts or new capital commitments for certain products. The fair value of the remaining aggregate contingent payments at December 31, 2020 totaled $26 million and is included in other liabilities on the consolidated statements of financial condition. Other Contingent Payments. The Company acts as the portfolio manager in a series of derivative transactions and has a maximum potential exposure of $17 million between the Company and counterparty. See Note 9, Derivatives and Hedging, for further discussion. Legal Proceedings. From time to time, BlackRock receives subpoenas or other requests for information from various US federal and state governmental and regulatory authorities and international governmental and regulatory authorities in connection with industry-wide or other investigations or proceedings. It is BlackRock’s policy to cooperate fully with such matters. The Company, certain of its subsidiaries and employees have been named as defendants in various legal actions, including arbitrations and other litigation arising in connection with BlackRock’s activities. Additionally, BlackRock-advised investment portfolios may be subject to lawsuits, any of which potentially could harm the investment returns of the applicable portfolio or result in the Company being liable to the portfolios for any resulting damages. On April 5, 2017, BlackRock, Inc., BlackRock Institutional Trust Company, N.A. (“BTC”), the BlackRock, Inc. Retirement Committee and various sub-committees, and a BlackRock employee were named as defendants in a purported class action lawsuit brought in the US District Court for the Northern District of California by a former employee on behalf of all participants and beneficiaries in the BlackRock employee 401(k) Plan (the “Plan”) from April 5, 2011 to the present. The lawsuit generally alleges that the defendants breached their duties towards Plan participants in violation of the Employee Retirement Income Security Act of 1974 by, among other things, offering investment options that were overly expensive, underperformed unaffiliated peer funds, focused disproportionately on active versus passive strategies, and were unduly concentrated in investment options managed by BlackRock. On October 18, 2017, the plaintiffs filed an Amended Complaint, which, among other things, added as defendants certain current and former members of the BlackRock Retirement and Investment Committees. The Amended Complaint also included a new purported class claim on behalf of investors in certain CTFs managed by BTC. Specifically, the plaintiffs allege that BTC, as fiduciary to the CTFs, engaged in self-dealing by, most significantly, selecting itself as the securities lending agent on terms that the plaintiffs claim were excessive. The Amended Complaint also alleged that BlackRock took undue risks in its management of securities lending cash reinvestment vehicles during the financial crisis. On August 23, 2018, the court granted permission to the plaintiffs to file a Second Amended Complaint (“SAC”) which added as defendants the BlackRock, Inc. Management Development and Compensation Committee, the Plan’s independent investment consultant and the Plan’s Administrative Committee and its members. On October 22, 2018, BlackRock filed a motion to dismiss the SAC, and on June 3, 2019, the plaintiffs filed a motion seeking to certify both the Plan and the CTF classes. On September 3, 2019, the court granted BlackRock’s motion to dismiss part of the plaintiffs’ claim seeking to recover alleged losses in the securities lending vehicles but denied the motion to dismiss in all other respects. On February 11, 2020, the court denied the plaintiffs’ motion to certify the CTF class and granted their motion to certify the Plan class. On April 27, 2020, the Ninth Circuit denied the plaintiffs’ request to immediately appeal the class certification ruling. On September 24, 2020, the parties cross-moved for summary judgment, both of which were denied on January 12, 2021. On February 5, 2021, the parties reached a settlement in principle that will resolve the lawsuit, and are negotiating final terms for presentation to the court, which must approve the settlement for it to be effective. Management, after consultation with legal counsel, currently does not anticipate that the aggregate liability arising out of regulatory matters or lawsuits will have a material effect on BlackRock’s results of operations, financial position, or cash flows. However, there is no assurance as to whether any such pending or threatened matters will have a material effect on BlackRock’s results of operations, financial position or cash flows in any future reporting period. Due to uncertainties surrounding the outcome of these matters, management cannot reasonably estimate the possible loss or range of loss that may arise from these matters. Indemnifications. In the ordinary course of business or in connection with certain acquisition agreements, BlackRock enters into contracts pursuant to which it may agree to indemnify third parties in certain circumstances. The terms of these indemnities vary from contract to contract and the amount of indemnification liability, if any, cannot be determined or the likelihood of any liability is considered remote. Consequently, no liability has been recorded on the consolidated statements of financial condition. In connection with securities lending transactions, BlackRock has agreed to indemnify certain securities lending clients against potential loss resulting from a borrower’s failure to fulfill its obligations under the securities lending agreement should the value of the collateral pledged by the borrower at the time of default be insufficient to cover the borrower’s obligation under the securities lending agreement. The amount of securities on loan as of December 31, 2020 and subject to this type of indemnification was $270 billion. In the Company’s capacity as lending agent, cash and securities totaling $289 billion was held as collateral for indemnified securities on loan at December 31, 2020. The fair value of these indemnifications was not material at December 31, 2020. F-31
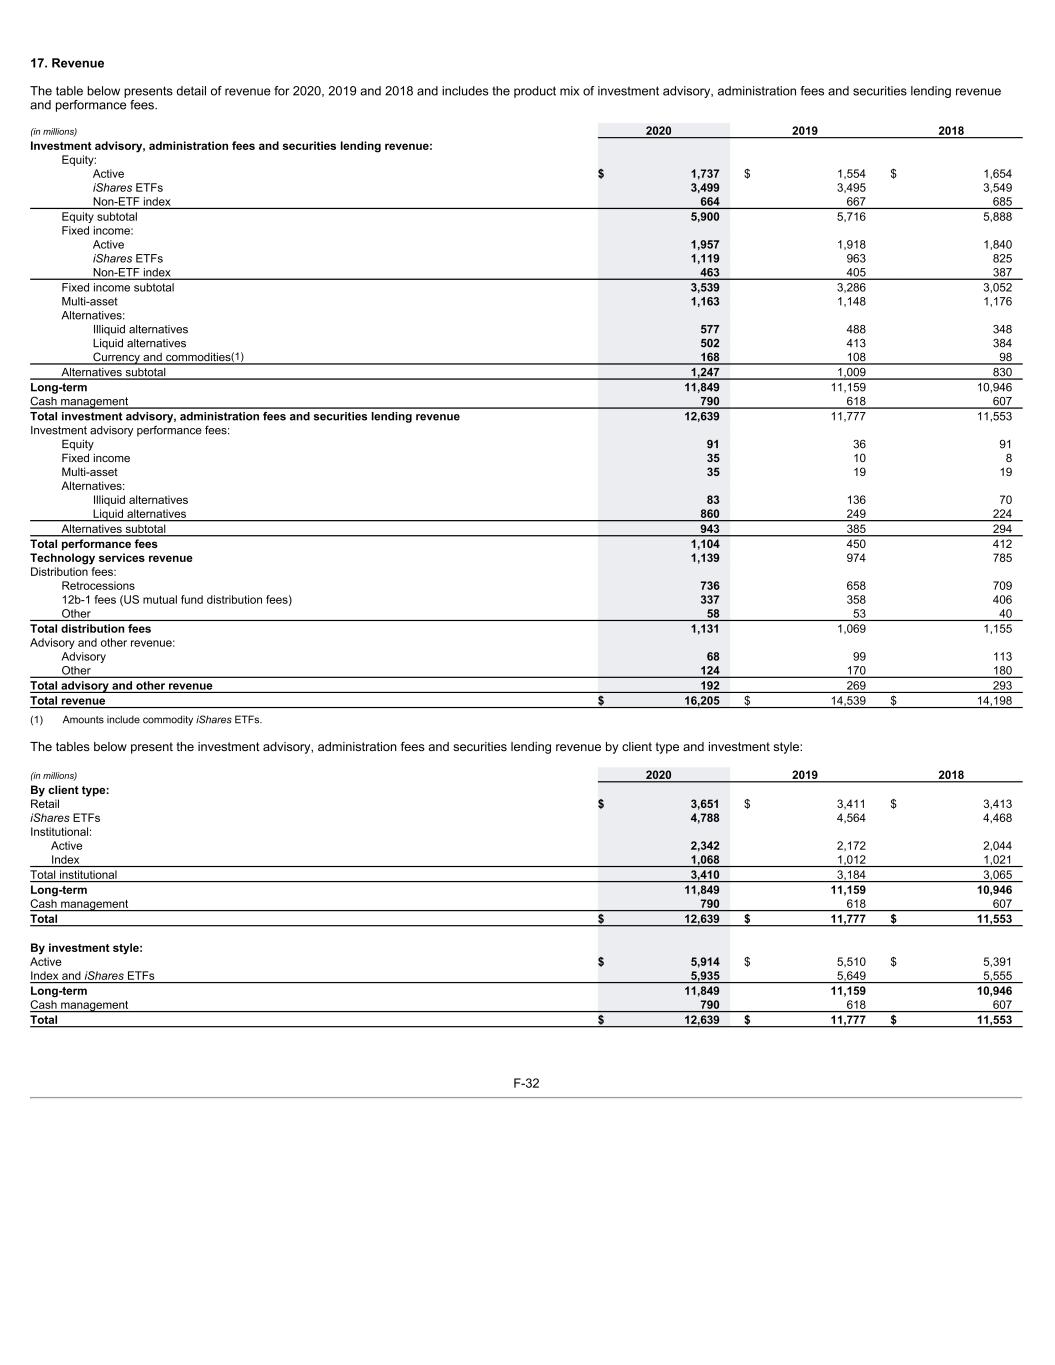
17. Revenue The table below presents detail of revenue for 2020, 2019 and 2018 and includes the product mix of investment advisory, administration fees and securities lending revenue and performance fees. (in millions) 2020 2019 2018 Investment advisory, administration fees and securities lending revenue: Equity: Active $ 1,737 $ 1,554 $ 1,654 iShares ETFs 3,499 3,495 3,549 Non-ETF index 664 667 685 Equity subtotal 5,900 5,716 5,888 Fixed income: Active 1,957 1,918 1,840 iShares ETFs 1,119 963 825 Non-ETF index 463 405 387 Fixed income subtotal 3,539 3,286 3,052 Multi-asset 1,163 1,148 1,176 Alternatives: Illiquid alternatives 577 488 348 Liquid alternatives 502 413 384 Currency and commodities(1) 168 108 98 Alternatives subtotal 1,247 1,009 830 Long-term 11,849 11,159 10,946 Cash management 790 618 607 Total investment advisory, administration fees and securities lending revenue 12,639 11,777 11,553 Investment advisory performance fees: Equity 91 36 91 Fixed income 35 10 8 Multi-asset 35 19 19 Alternatives: Illiquid alternatives 83 136 70 Liquid alternatives 860 249 224 Alternatives subtotal 943 385 294 Total performance fees 1,104 450 412 Technology services revenue 1,139 974 785 Distribution fees: Retrocessions 736 658 709 12b-1 fees (US mutual fund distribution fees) 337 358 406 Other 58 53 40 Total distribution fees 1,131 1,069 1,155 Advisory and other revenue: Advisory 68 99 113 Other 124 170 180 Total advisory and other revenue 192 269 293 Total revenue $ 16,205 $ 14,539 $ 14,198 (1) Amounts include commodity iShares ETFs. The tables below present the investment advisory, administration fees and securities lending revenue by client type and investment style: (in millions) 2020 2019 2018 By client type: Retail $ 3,651 $ 3,411 $ 3,413 iShares ETFs 4,788 4,564 4,468 Institutional: Active 2,342 2,172 2,044 Index 1,068 1,012 1,021 Total institutional 3,410 3,184 3,065 Long-term 11,849 11,159 10,946 Cash management 790 618 607 Total $ 12,639 $ 11,777 $ 11,553 By investment style: Active $ 5,914 $ 5,510 $ 5,391 Index and iShares ETFs 5,935 5,649 5,555 Long-term 11,849 11,159 10,946 Cash management 790 618 607 Total $ 12,639 $ 11,777 $ 11,553 F-32
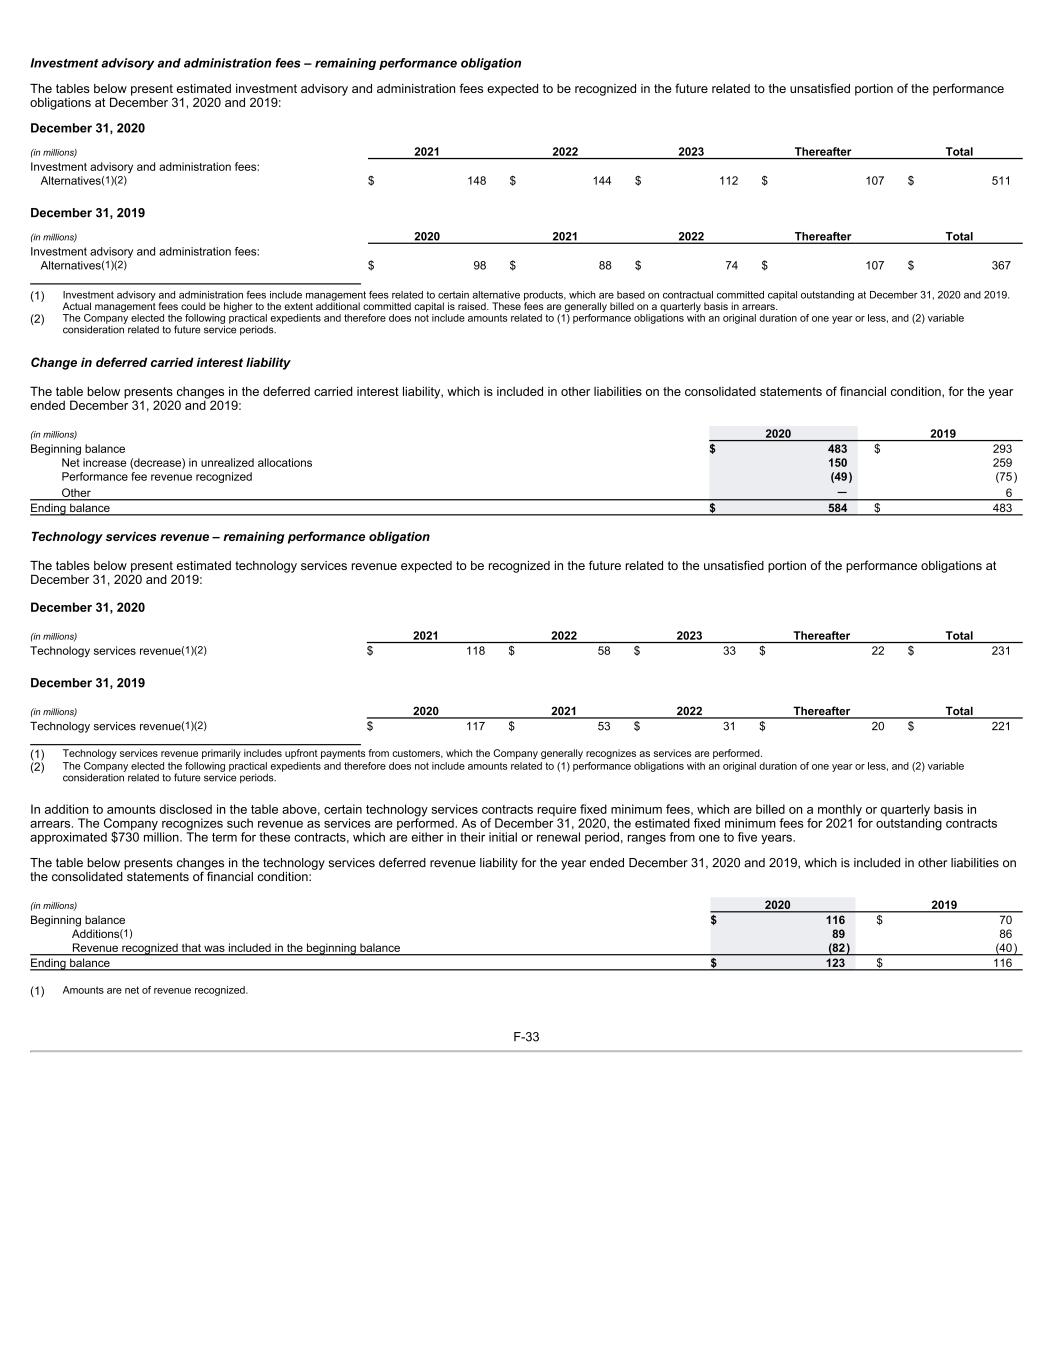
Investment advisory and administration fees – remaining performance obligation The tables below present estimated investment advisory and administration fees expected to be recognized in the future related to the unsatisfied portion of the performance obligations at December 31, 2020 and 2019: December 31, 2020 (in millions) 2021 2022 2023 Thereafter Total Investment advisory and administration fees: Alternatives(1)(2) $ 148 $ 144 $ 112 $ 107 $ 511 December 31, 2019 (in millions) 2020 2021 2022 Thereafter Total Investment advisory and administration fees: Alternatives(1)(2) $ 98 $ 88 $ 74 $ 107 $ 367 (1) Investment advisory and administration fees include management fees related to certain alternative products, which are based on contractual committed capital outstanding at December 31, 2020 and 2019. Actual management fees could be higher to the extent additional committed capital is raised. These fees are generally billed on a quarterly basis in arrears. (2) The Company elected the following practical expedients and therefore does not include amounts related to (1) performance obligations with an original duration of one year or less, and (2) variable consideration related to future service periods. Change in deferred carried interest liability The table below presents changes in the deferred carried interest liability, which is included in other liabilities on the consolidated statements of financial condition, for the year ended December 31, 2020 and 2019: (in millions) 2020 2019 Beginning balance $ 483 $ 293 Net increase (decrease) in unrealized allocations 150 259 Performance fee revenue recognized (49) (75) Other — 6 Ending balance $ 584 $ 483 Technology services revenue – remaining performance obligation The tables below present estimated technology services revenue expected to be recognized in the future related to the unsatisfied portion of the performance obligations at December 31, 2020 and 2019: December 31, 2020 (in millions) 2021 2022 2023 Thereafter Total Technology services revenue(1)(2) $ 118 $ 58 $ 33 $ 22 $ 231 December 31, 2019 (in millions) 2020 2021 2022 Thereafter Total Technology services revenue(1)(2) $ 117 $ 53 $ 31 $ 20 $ 221 (1) Technology services revenue primarily includes upfront payments from customers, which the Company generally recognizes as services are performed. (2) The Company elected the following practical expedients and therefore does not include amounts related to (1) performance obligations with an original duration of one year or less, and (2) variable consideration related to future service periods. In addition to amounts disclosed in the table above, certain technology services contracts require fixed minimum fees, which are billed on a monthly or quarterly basis in arrears. The Company recognizes such revenue as services are performed. As of December 31, 2020, the estimated fixed minimum fees for 2021 for outstanding contracts approximated $730 million. The term for these contracts, which are either in their initial or renewal period, ranges from one to five years. The table below presents changes in the technology services deferred revenue liability for the year ended December 31, 2020 and 2019, which is included in other liabilities on the consolidated statements of financial condition: (in millions) 2020 2019 Beginning balance $ 116 $ 70 Additions(1) 89 86 Revenue recognized that was included in the beginning balance (82) (40) Ending balance $ 123 $ 116 (1) Amounts are net of revenue recognized. F-33

18. Stock-Based Compensation The components of stock-based compensation expense are as follows: (in millions) 2020 2019 2018 Stock-based compensation: Restricted stock and RSUs $ 593 $ 532 $ 514 Long-term incentive plans to be funded by PNC(1) — — 14 Stock options 29 35 36 Total stock-based compensation $ 622 $ 567 $ 564 (1) The PNC Financial Services Group, Inc. (“PNC”) Stock Award and Incentive Plan. Pursuant to the BlackRock, Inc. Second Amended and Restated 1999 Stock Award and Incentive Plan (the “Award Plan”), options to purchase shares of the Company’s common stock at an exercise price not less than the market value of BlackRock’s common stock on the date of grant in the form of stock options, restricted stock or RSUs may be granted to employees and nonemployee directors. A maximum of 41,500,000 shares of common stock were authorized for issuance under the Award Plan. Of this amount, 6,068,624 shares remain available for future awards at December 31, 2020. Upon exercise of employee stock options, the issuance of restricted stock or the vesting of RSUs, the Company issues shares out of treasury to the extent available. Restricted Stock and RSUs. Pursuant to the Award Plan, restricted stock grants and RSUs may be granted to certain employees. Substantially all restricted stock and RSUs vest over periods ranging from one to three years and are expensed using the straight-line method over the requisite service period for each separately vesting portion of the award as if the award was, in-substance, multiple awards. Restricted stock and RSUs are not considered participating securities for purposes of calculating EPS as the dividend equivalents are subject to forfeiture prior to vesting of the award. Restricted stock and RSU activity for 2020 is summarized below. Outstanding at Restricted Stock and RSUs Weighted- Average Grant Date Fair Value December 31, 2019 2,236,452 $ 444.02 Granted 969,095 $ 533.31 Converted (981,385) $ 429.48 Forfeited (84,232) $ 477.29 December 31, 2020 2,139,930 $ 489.81 The Company values restricted stock and RSUs at their grant-date fair value as measured by BlackRock’s common stock price. The total fair market value of RSUs/restricted stock granted to employees during 2020, 2019 and 2018 was $517 million, $508 million and $492 million, respectively. The total grant-date fair market value of RSUs/restricted stock converted to common stock during 2020, 2019 and 2018 was $421 million, $398 million and $443 million, respectively. RSUs/restricted stock granted in connection with annual incentive compensation under the Award Plan primarily related to the following: 2020 2019 2018 Awards granted that vest ratably over three years from the date of grant 504,403 674,206 527,337 Awards granted that cliff vest 100% on: January 31, 2021 — — 209,201 January 31, 2022 — 377,291 — January 31, 2023 393,161 — — 897,564 1,051,497 736,538 In addition, the Company also granted RSUs of 71,531, 174,752 and 155,403 during 2020, 2019 and 2018, respectively, with varying vesting periods. At December 31, 2020, the intrinsic value of outstanding RSUs was $1.5 billion, reflecting a closing stock price of $721.54. At December 31, 2020, total unrecognized stock-based compensation expense related to unvested RSUs was $379 million. The unrecognized compensation cost is expected to be recognized over the remaining weighted-average period of 1.1 years. In January 2021, the Company granted under the Award Plan: • 470,253 RSUs or shares of restricted stock to employees as part of annual incentive compensation that vest ratably over three years from the date of grant; and • 247,621 RSUs or shares of restricted stock to employees that cliff vest 100% on January 31, 2024. • 55,994 RSUs or shares of restricted stock to employees with various vesting schedules. F-34

Performance-Based RSUs. Pursuant to the Award Plan, performance-based RSUs may be granted to certain employees. Each performance-based award consists of a “base” number of RSUs granted to the employee. The number of shares that an employee ultimately receives at vesting will be equal to the base number of performance-based RSUs granted, multiplied by a predetermined percentage determined in accordance with the level of attainment of Company performance measures during the performance period and could be higher or lower than the original RSU grant. Performance-based RSUs are not considered participating securities as the dividend equivalents are subject to forfeiture prior to vesting of the award. In the first quarter of 2020, 2019 and 2018, the Company granted 238,478, 283,014, and 199,068, respectively, performance-based RSUs to certain employees that cliff vest 100% on January 31, 2023, 2022, and 2021 respectively. These awards are amortized over a service period of three years. The number of shares distributed at vesting could be higher or lower than the original grant based on the level of attainment of predetermined Company performance measures. In January 2020, the Company granted 30,600 additional RSUs to certain employees based on the attainment of Company performance measures during the performance period. Performance-based RSU activity for 2020 is summarized below. Outstanding at Performance- Based RSUs Weighted- Average Grant Date Fair Value December 31, 2019 742,918 $ 436.84 Granted 238,478 $ 533.58 Additional shares granted due to attainment of performance measures 30,600 $ 375.26 Converted (311,779) $ 375.26 December 31, 2020 700,217 $ 494.51 The Company initially values performance-based RSUs at their grant-date fair value as measured by BlackRock’s common stock price. The total grant-date fair market value of performance-based RSUs granted to employees during 2020, 2019 and 2018 was $139 million, $117 million and $121 million, respectively. At December 31, 2020, the intrinsic value of outstanding performance-based RSUs was $505 million reflecting a closing stock price of $721.54. At December 31, 2020, total unrecognized stock-based compensation expense related to unvested performance-based awards was $132 million. The unrecognized compensation cost is expected to be recognized over the remaining weighted-average period of 1.2 years. In January 2021, the Company granted 162,029 performance-based RSUs to certain employees that cliff vest 100% on January 31, 2024. These awards are amortized over a service period of three years. The number of shares distributed at vesting could be higher or lower than the original grant based on the level of attainment of predetermined Company performance measures. Performance-based Stock Options. Pursuant to the Award Plan, performance-based stock options may be granted to certain employees. Vesting of the performance-based stock options is contingent upon the achievement of obtaining 125% of BlackRock’s grant-date stock price within five years from the grant date and the attainment of Company performance measures during the four-year performance period. If both hurdles are achieved, the award will vest in three equal installments at the end of years five, six and seven. Vested options can then be exercised up to nine years following the grant date. At December 31, 2020, the weighted average remaining life of the awards is approximately 5.9 years. The awards are generally forfeited if the employee leaves the Company before the respective vesting date. The expense for each tranche is amortized over the respective requisite service period. The Company assumes the performance condition will be achieved. If such condition is not met, no compensation cost is recognized and any recognized compensation cost is reversed. Stock option activity for 2020 is summarized below. Outstanding at Shares Under Option Weighted Average Exercise Price December 31, 2019 1,941,145 $ 513.50 Forfeited (25,353) $ 513.50 December 31, 2020 1,915,792 $ 513.50 The options have a strike price of $513.50, which was the closing price of the shares on the grant date. The grant-date fair value of the awards issued in 2017 was $208 million and was estimated using a Monte Carlo simulation with an embedded lattice model using the assumptions included in the following table: Grant Year Expected Term (Years) Expected Stock Volatility Expected Dividend Yield Risk-Free Interest Rate 2017 6.56 22.23% 2.16% 2.33% The expected term was derived using a Monte Carlo simulation with the embedded lattice model and represents the period of time that options granted are expected to be outstanding. The expected stock volatility was based upon an average of historical stock price fluctuations of BlackRock’s common stock and an implied volatility at the grant date. The dividend yield was calculated as the most recent quarterly dividend divided by the average three-month stock price as of the grant date. The risk-free interest rate is based on the US Treasury Constant Maturities yield curve at date of grant. At December 31, 2020, total unrecognized stock-based compensation expense related to unvested performance-based stock options was $82 million. The unrecognized compensation cost is expected to be recognized over the remaining weighted-average period of 2.9 years. F-35
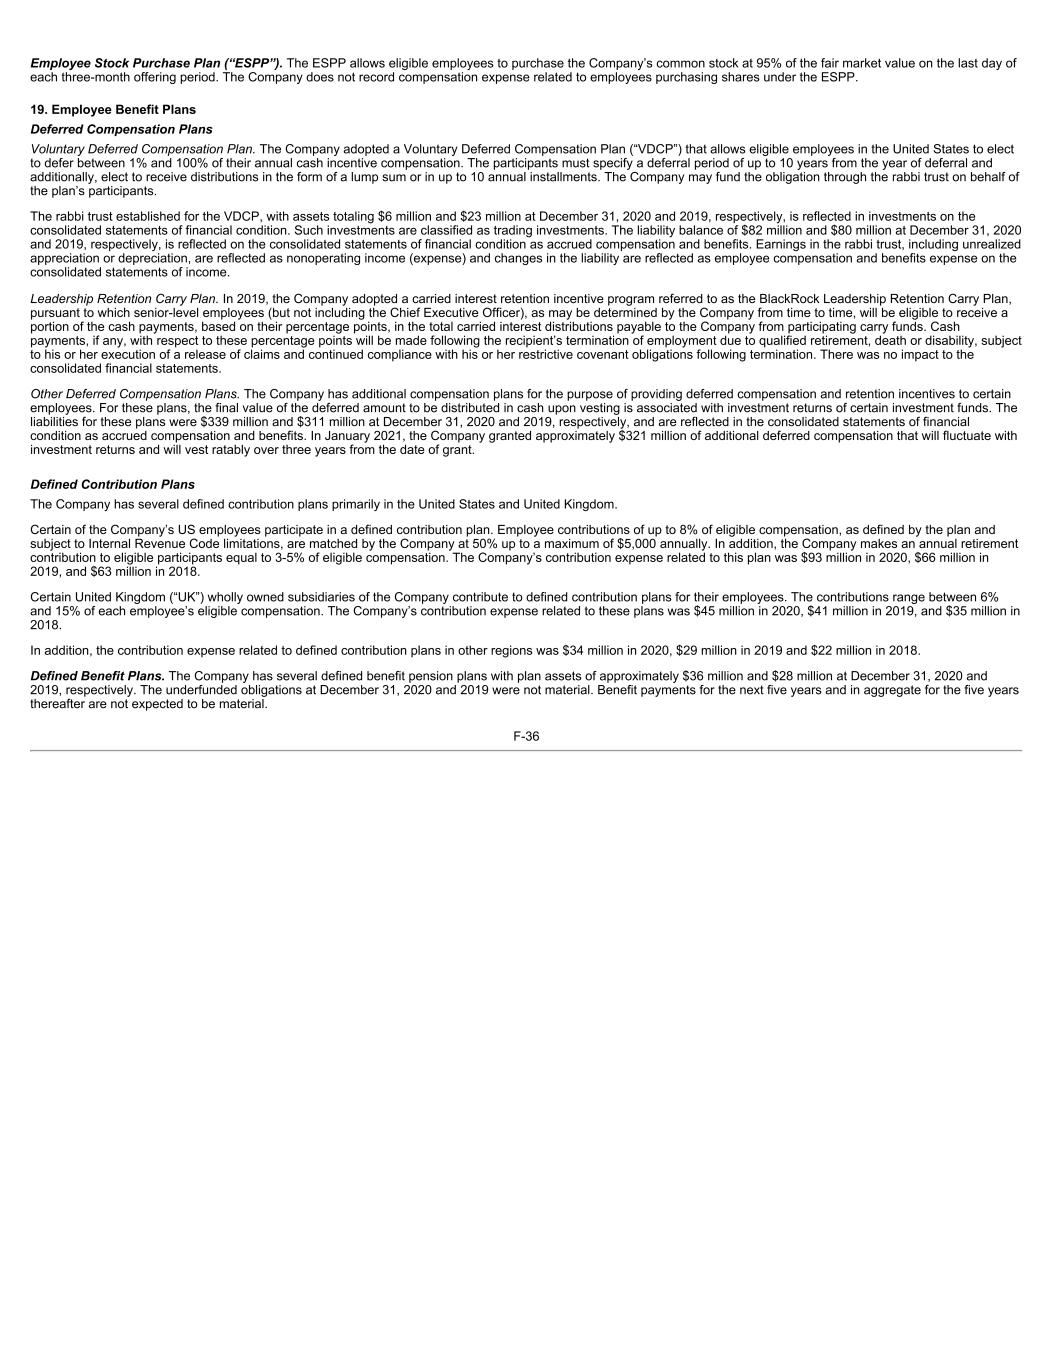
Employee Stock Purchase Plan (“ESPP”). The ESPP allows eligible employees to purchase the Company’s common stock at 95% of the fair market value on the last day of each three-month offering period. The Company does not record compensation expense related to employees purchasing shares under the ESPP. 19. Employee Benefit Plans Deferred Compensation Plans Voluntary Deferred Compensation Plan. The Company adopted a Voluntary Deferred Compensation Plan (“VDCP”) that allows eligible employees in the United States to elect to defer between 1% and 100% of their annual cash incentive compensation. The participants must specify a deferral period of up to 10 years from the year of deferral and additionally, elect to receive distributions in the form of a lump sum or in up to 10 annual installments. The Company may fund the obligation through the rabbi trust on behalf of the plan’s participants. The rabbi trust established for the VDCP, with assets totaling $6 million and $23 million at December 31, 2020 and 2019, respectively, is reflected in investments on the consolidated statements of financial condition. Such investments are classified as trading investments. The liability balance of $82 million and $80 million at December 31, 2020 and 2019, respectively, is reflected on the consolidated statements of financial condition as accrued compensation and benefits. Earnings in the rabbi trust, including unrealized appreciation or depreciation, are reflected as nonoperating income (expense) and changes in the liability are reflected as employee compensation and benefits expense on the consolidated statements of income. Leadership Retention Carry Plan. In 2019, the Company adopted a carried interest retention incentive program referred to as the BlackRock Leadership Retention Carry Plan, pursuant to which senior-level employees (but not including the Chief Executive Officer), as may be determined by the Company from time to time, will be eligible to receive a portion of the cash payments, based on their percentage points, in the total carried interest distributions payable to the Company from participating carry funds. Cash payments, if any, with respect to these percentage points will be made following the recipient’s termination of employment due to qualified retirement, death or disability, subject to his or her execution of a release of claims and continued compliance with his or her restrictive covenant obligations following termination. There was no impact to the consolidated financial statements. Other Deferred Compensation Plans. The Company has additional compensation plans for the purpose of providing deferred compensation and retention incentives to certain employees. For these plans, the final value of the deferred amount to be distributed in cash upon vesting is associated with investment returns of certain investment funds. The liabilities for these plans were $339 million and $311 million at December 31, 2020 and 2019, respectively, and are reflected in the consolidated statements of financial condition as accrued compensation and benefits. In January 2021, the Company granted approximately $321 million of additional deferred compensation that will fluctuate with investment returns and will vest ratably over three years from the date of grant. Defined Contribution Plans The Company has several defined contribution plans primarily in the United States and United Kingdom. Certain of the Company’s US employees participate in a defined contribution plan. Employee contributions of up to 8% of eligible compensation, as defined by the plan and subject to Internal Revenue Code limitations, are matched by the Company at 50% up to a maximum of $5,000 annually. In addition, the Company makes an annual retirement contribution to eligible participants equal to 3-5% of eligible compensation. The Company’s contribution expense related to this plan was $93 million in 2020, $66 million in 2019, and $63 million in 2018. Certain United Kingdom (“UK”) wholly owned subsidiaries of the Company contribute to defined contribution plans for their employees. The contributions range between 6% and 15% of each employee’s eligible compensation. The Company’s contribution expense related to these plans was $45 million in 2020, $41 million in 2019, and $35 million in 2018. In addition, the contribution expense related to defined contribution plans in other regions was $34 million in 2020, $29 million in 2019 and $22 million in 2018. Defined Benefit Plans. The Company has several defined benefit pension plans with plan assets of approximately $36 million and $28 million at December 31, 2020 and 2019, respectively. The underfunded obligations at December 31, 2020 and 2019 were not material. Benefit payments for the next five years and in aggregate for the five years thereafter are not expected to be material. F-36
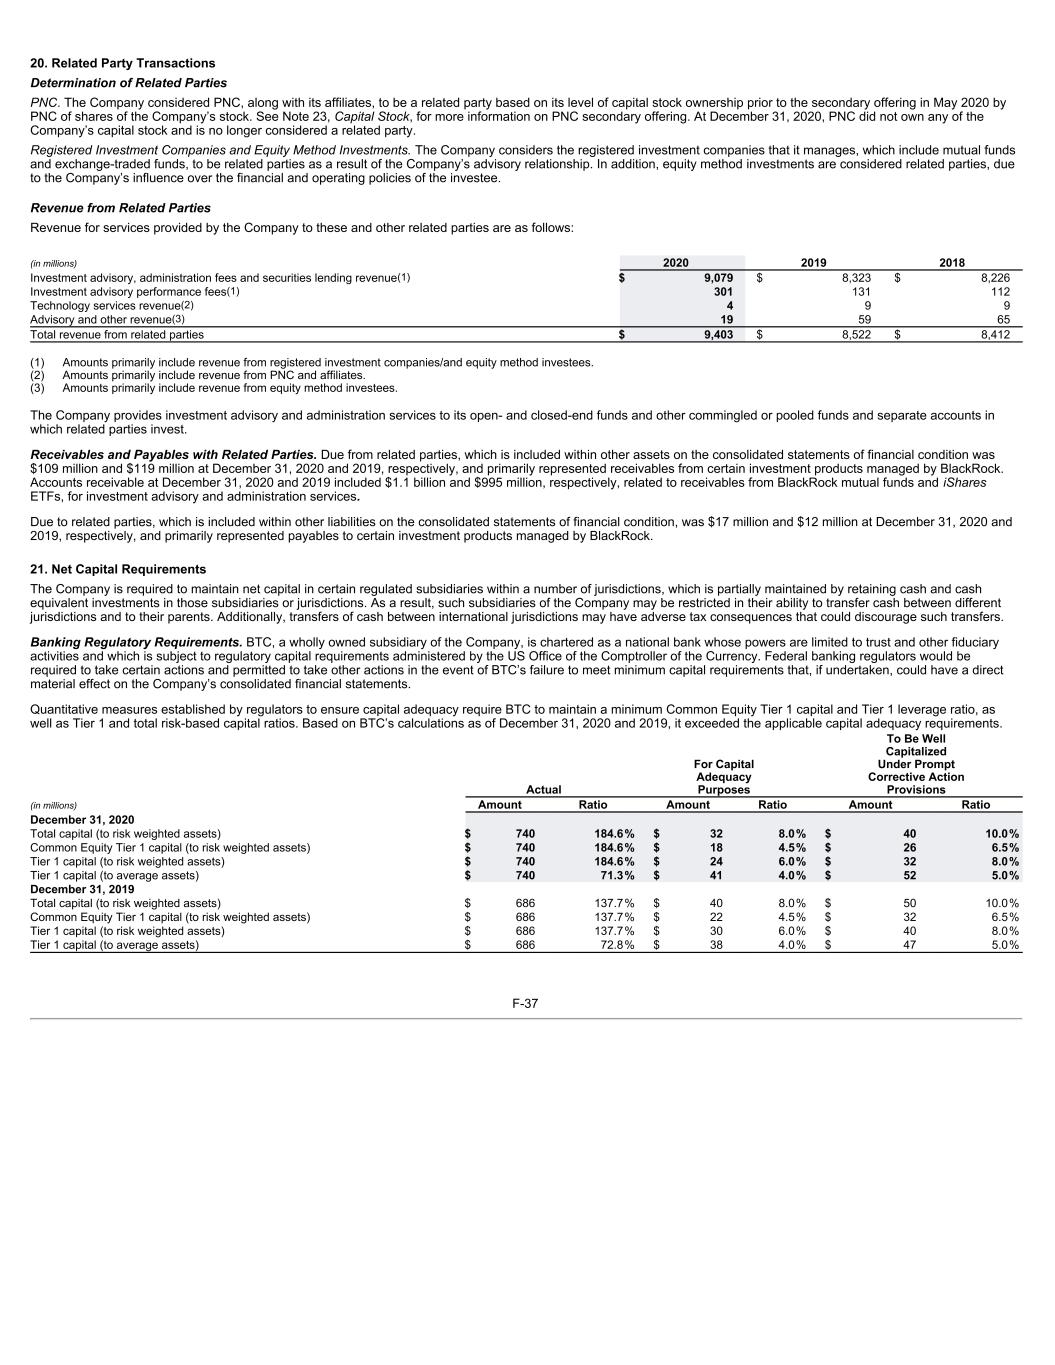
20. Related Party Transactions Determination of Related Parties PNC. The Company considered PNC, along with its affiliates, to be a related party based on its level of capital stock ownership prior to the secondary offering in May 2020 by PNC of shares of the Company’s stock. See Note 23, Capital Stock, for more information on PNC secondary offering. At December 31, 2020, PNC did not own any of the Company’s capital stock and is no longer considered a related party. Registered Investment Companies and Equity Method Investments. The Company considers the registered investment companies that it manages, which include mutual funds and exchange-traded funds, to be related parties as a result of the Company’s advisory relationship. In addition, equity method investments are considered related parties, due to the Company’s influence over the financial and operating policies of the investee. Revenue from Related Parties Revenue for services provided by the Company to these and other related parties are as follows: (in millions) 2020 2019 2018 Investment advisory, administration fees and securities lending revenue(1) $ 9,079 $ 8,323 $ 8,226 Investment advisory performance fees(1) 301 131 112 Technology services revenue(2) 4 9 9 Advisory and other revenue(3) 19 59 65 Total revenue from related parties $ 9,403 $ 8,522 $ 8,412 (1) Amounts primarily include revenue from registered investment companies/and equity method investees. (2) Amounts primarily include revenue from PNC and affiliates. (3) Amounts primarily include revenue from equity method investees. The Company provides investment advisory and administration services to its open- and closed-end funds and other commingled or pooled funds and separate accounts in which related parties invest. Receivables and Payables with Related Parties. Due from related parties, which is included within other assets on the consolidated statements of financial condition was $109 million and $119 million at December 31, 2020 and 2019, respectively, and primarily represented receivables from certain investment products managed by BlackRock. Accounts receivable at December 31, 2020 and 2019 included $1.1 billion and $995 million, respectively, related to receivables from BlackRock mutual funds and iShares ETFs, for investment advisory and administration services. Due to related parties, which is included within other liabilities on the consolidated statements of financial condition, was $17 million and $12 million at December 31, 2020 and 2019, respectively, and primarily represented payables to certain investment products managed by BlackRock. 21. Net Capital Requirements The Company is required to maintain net capital in certain regulated subsidiaries within a number of jurisdictions, which is partially maintained by retaining cash and cash equivalent investments in those subsidiaries or jurisdictions. As a result, such subsidiaries of the Company may be restricted in their ability to transfer cash between different jurisdictions and to their parents. Additionally, transfers of cash between international jurisdictions may have adverse tax consequences that could discourage such transfers. Banking Regulatory Requirements. BTC, a wholly owned subsidiary of the Company, is chartered as a national bank whose powers are limited to trust and other fiduciary activities and which is subject to regulatory capital requirements administered by the US Office of the Comptroller of the Currency. Federal banking regulators would be required to take certain actions and permitted to take other actions in the event of BTC’s failure to meet minimum capital requirements that, if undertaken, could have a direct material effect on the Company’s consolidated financial statements. Quantitative measures established by regulators to ensure capital adequacy require BTC to maintain a minimum Common Equity Tier 1 capital and Tier 1 leverage ratio, as well as Tier 1 and total risk-based capital ratios. Based on BTC’s calculations as of December 31, 2020 and 2019, it exceeded the applicable capital adequacy requirements. Actual For Capital Adequacy Purposes To Be Well Capitalized Under Prompt Corrective Action Provisions (in millions) Amount Ratio Amount Ratio Amount Ratio December 31, 2020 Total capital (to risk weighted assets) $ 740 184.6% $ 32 8.0% $ 40 10.0% Common Equity Tier 1 capital (to risk weighted assets) $ 740 184.6% $ 18 4.5% $ 26 6.5% Tier 1 capital (to risk weighted assets) $ 740 184.6% $ 24 6.0% $ 32 8.0% Tier 1 capital (to average assets) $ 740 71.3% $ 41 4.0% $ 52 5.0% December 31, 2019 Total capital (to risk weighted assets) $ 686 137.7% $ 40 8.0% $ 50 10.0% Common Equity Tier 1 capital (to risk weighted assets) $ 686 137.7% $ 22 4.5% $ 32 6.5% Tier 1 capital (to risk weighted assets) $ 686 137.7% $ 30 6.0% $ 40 8.0% Tier 1 capital (to average assets) $ 686 72.8% $ 38 4.0% $ 47 5.0% F-37
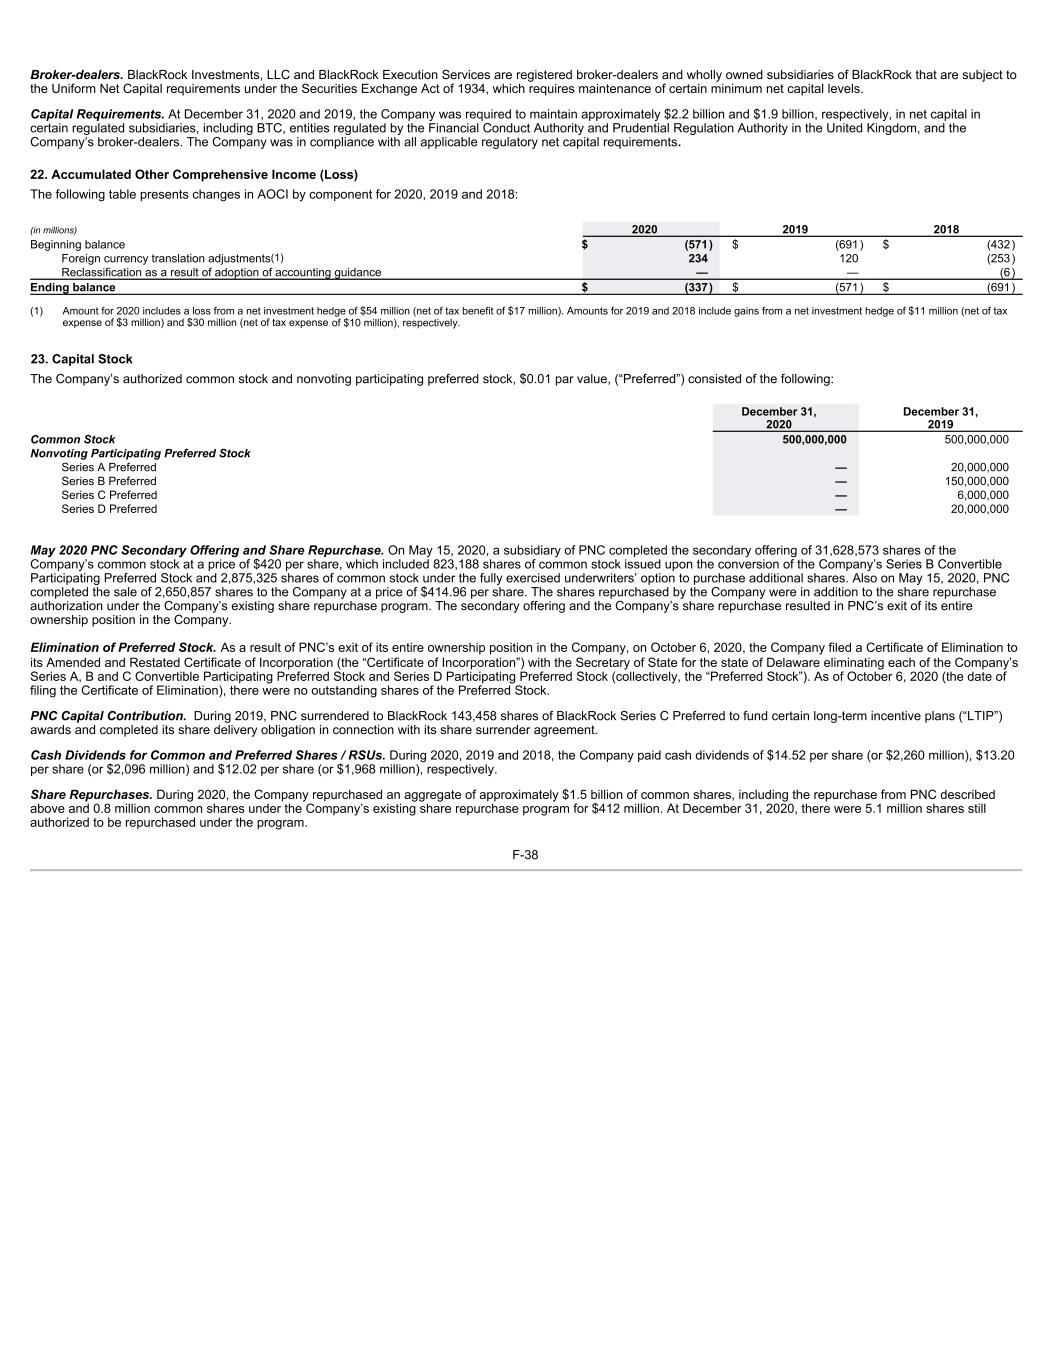
Broker-dealers. BlackRock Investments, LLC and BlackRock Execution Services are registered broker-dealers and wholly owned subsidiaries of BlackRock that are subject to the Uniform Net Capital requirements under the Securities Exchange Act of 1934, which requires maintenance of certain minimum net capital levels. Capital Requirements. At December 31, 2020 and 2019, the Company was required to maintain approximately $2.2 billion and $1.9 billion, respectively, in net capital in certain regulated subsidiaries, including BTC, entities regulated by the Financial Conduct Authority and Prudential Regulation Authority in the United Kingdom, and the Company’s broker-dealers. The Company was in compliance with all applicable regulatory net capital requirements. 22. Accumulated Other Comprehensive Income (Loss) The following table presents changes in AOCI by component for 2020, 2019 and 2018: (in millions) 2020 2019 2018 Beginning balance $ (571) $ (691) $ (432) Foreign currency translation adjustments(1) 234 120 (253) Reclassification as a result of adoption of accounting guidance — — (6) Ending balance $ (337) $ (571) $ (691) (1) Amount for 2020 includes a loss from a net investment hedge of $54 million (net of tax benefit of $17 million). Amounts for 2019 and 2018 include gains from a net investment hedge of $11 million (net of tax expense of $3 million) and $30 million (net of tax expense of $10 million), respectively. 23. Capital Stock The Company’s authorized common stock and nonvoting participating preferred stock, $0.01 par value, (“Preferred”) consisted of the following: December 31, 2020 December 31, 2019 Common Stock 500,000,000 500,000,000 Nonvoting Participating Preferred Stock Series A Preferred — 20,000,000 Series B Preferred — 150,000,000 Series C Preferred — 6,000,000 Series D Preferred — 20,000,000 May 2020 PNC Secondary Offering and Share Repurchase. On May 15, 2020, a subsidiary of PNC completed the secondary offering of 31,628,573 shares of the Company’s common stock at a price of $420 per share, which included 823,188 shares of common stock issued upon the conversion of the Company’s Series B Convertible Participating Preferred Stock and 2,875,325 shares of common stock under the fully exercised underwriters’ option to purchase additional shares. Also on May 15, 2020, PNC completed the sale of 2,650,857 shares to the Company at a price of $414.96 per share. The shares repurchased by the Company were in addition to the share repurchase authorization under the Company’s existing share repurchase program. The secondary offering and the Company’s share repurchase resulted in PNC’s exit of its entire ownership position in the Company. Elimination of Preferred Stock. As a result of PNC’s exit of its entire ownership position in the Company, on October 6, 2020, the Company filed a Certificate of Elimination to its Amended and Restated Certificate of Incorporation (the “Certificate of Incorporation”) with the Secretary of State for the state of Delaware eliminating each of the Company’s Series A, B and C Convertible Participating Preferred Stock and Series D Participating Preferred Stock (collectively, the “Preferred Stock”). As of October 6, 2020 (the date of filing the Certificate of Elimination), there were no outstanding shares of the Preferred Stock. PNC Capital Contribution. During 2019, PNC surrendered to BlackRock 143,458 shares of BlackRock Series C Preferred to fund certain long-term incentive plans (“LTIP”) awards and completed its share delivery obligation in connection with its share surrender agreement. Cash Dividends for Common and Preferred Shares / RSUs. During 2020, 2019 and 2018, the Company paid cash dividends of $14.52 per share (or $2,260 million), $13.20 per share (or $2,096 million) and $12.02 per share (or $1,968 million), respectively. Share Repurchases. During 2020, the Company repurchased an aggregate of approximately $1.5 billion of common shares, including the repurchase from PNC described above and 0.8 million common shares under the Company’s existing share repurchase program for $412 million. At December 31, 2020, there were 5.1 million shares still authorized to be repurchased under the program. F-38
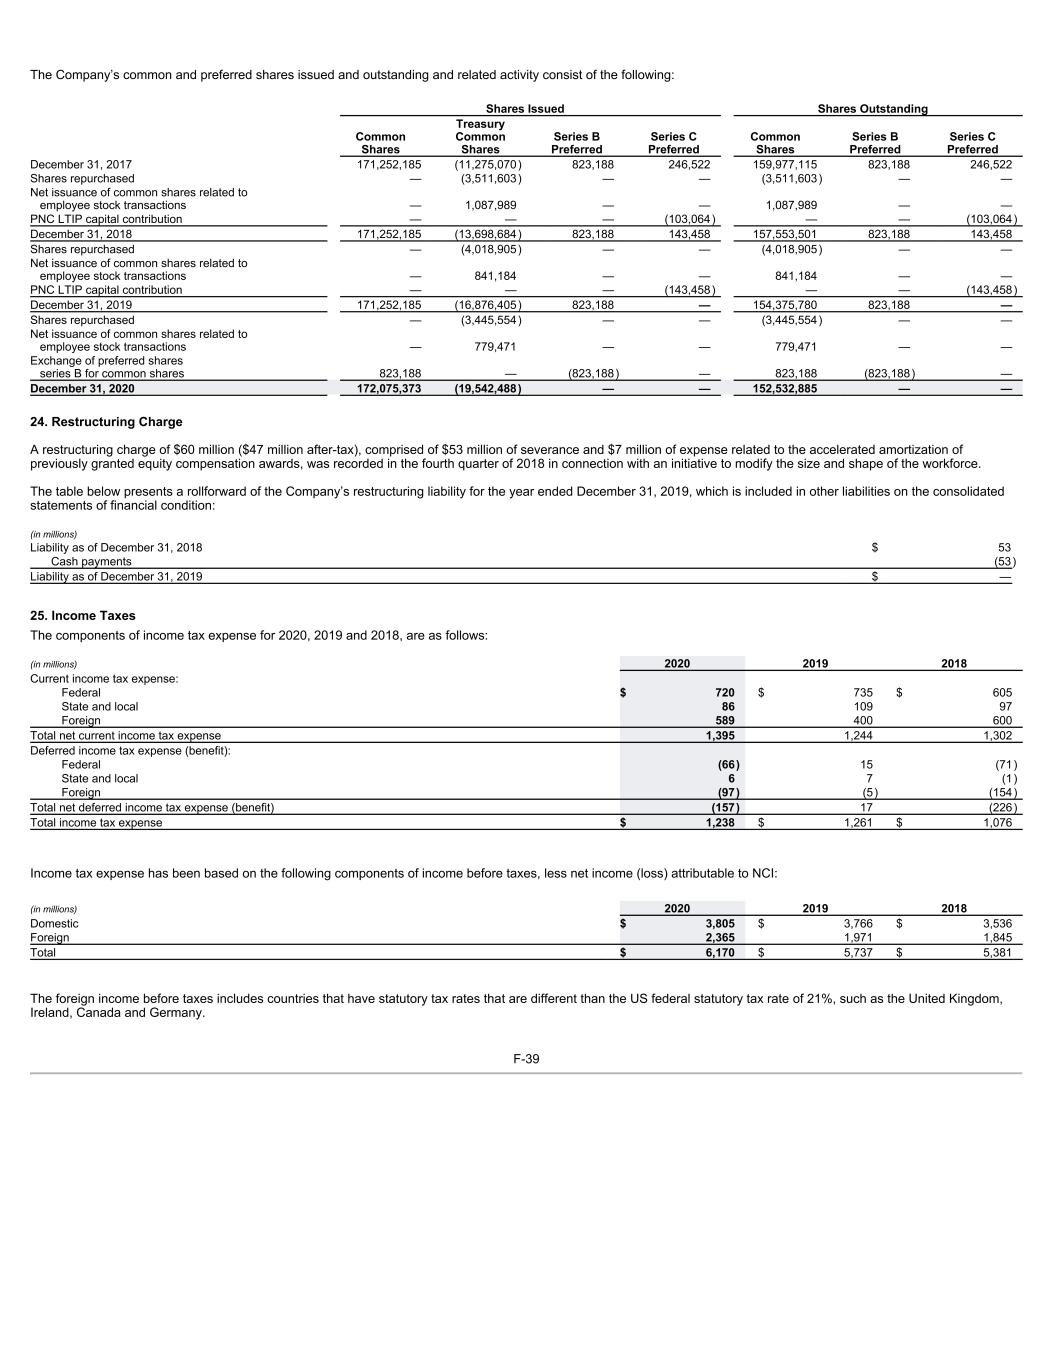
The Company’s common and preferred shares issued and outstanding and related activity consist of the following: Shares Issued Shares Outstanding Common Shares Treasury Common Shares Series B Preferred Series C Preferred Common Shares Series B Preferred Series C Preferred December 31, 2017 171,252,185 (11,275,070) 823,188 246,522 159,977,115 823,188 246,522 Shares repurchased — (3,511,603) — — (3,511,603) — — Net issuance of common shares related to employee stock transactions — 1,087,989 — — 1,087,989 — — PNC LTIP capital contribution — — — (103,064) — — (103,064) December 31, 2018 171,252,185 (13,698,684) 823,188 143,458 157,553,501 823,188 143,458 Shares repurchased — (4,018,905) — — (4,018,905) — — Net issuance of common shares related to employee stock transactions — 841,184 — — 841,184 — — PNC LTIP capital contribution — — — (143,458) — — (143,458) December 31, 2019 171,252,185 (16,876,405) 823,188 — 154,375,780 823,188 — Shares repurchased — (3,445,554) — — (3,445,554) — — Net issuance of common shares related to employee stock transactions — 779,471 — — 779,471 — — Exchange of preferred shares series B for common shares 823,188 — (823,188) — 823,188 (823,188) — December 31, 2020 172,075,373 (19,542,488) — — 152,532,885 — — 24. Restructuring Charge A restructuring charge of $60 million ($47 million after-tax), comprised of $53 million of severance and $7 million of expense related to the accelerated amortization of previously granted equity compensation awards, was recorded in the fourth quarter of 2018 in connection with an initiative to modify the size and shape of the workforce. The table below presents a rollforward of the Company’s restructuring liability for the year ended December 31, 2019, which is included in other liabilities on the consolidated statements of financial condition: (in millions) Liability as of December 31, 2018 $ 53 Cash payments (53) Liability as of December 31, 2019 $ — 25. Income Taxes The components of income tax expense for 2020, 2019 and 2018, are as follows: (in millions) 2020 2019 2018 Current income tax expense: Federal $ 720 $ 735 $ 605 State and local 86 109 97 Foreign 589 400 600 Total net current income tax expense 1,395 1,244 1,302 Deferred income tax expense (benefit): Federal (66) 15 (71) State and local 6 7 (1) Foreign (97) (5) (154) Total net deferred income tax expense (benefit) (157) 17 (226) Total income tax expense $ 1,238 $ 1,261 $ 1,076 Income tax expense has been based on the following components of income before taxes, less net income (loss) attributable to NCI: (in millions) 2020 2019 2018 Domestic $ 3,805 $ 3,766 $ 3,536 Foreign 2,365 1,971 1,845 Total $ 6,170 $ 5,737 $ 5,381 The foreign income before taxes includes countries that have statutory tax rates that are different than the US federal statutory tax rate of 21%, such as the United Kingdom, Ireland, Canada and Germany. F-39
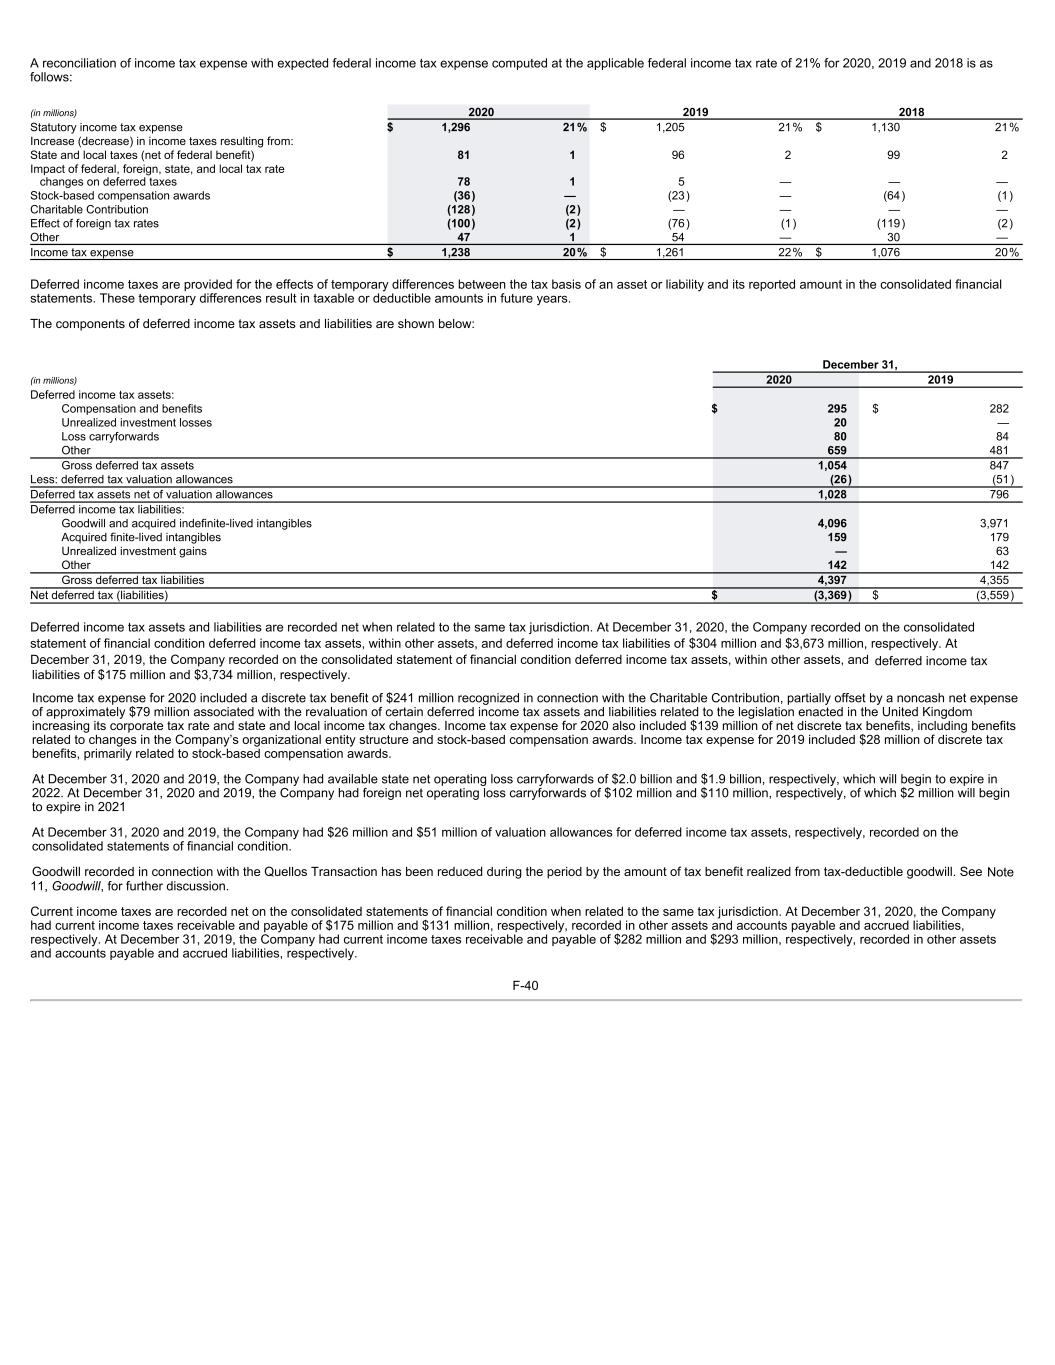
A reconciliation of income tax expense with expected federal income tax expense computed at the applicable federal income tax rate of 21% for 2020, 2019 and 2018 is as follows: (in millions) 2020 2019 2018 Statutory income tax expense $ 1,296 21% $ 1,205 21% $ 1,130 21% Increase (decrease) in income taxes resulting from: State and local taxes (net of federal benefit) 81 1 96 2 99 2 Impact of federal, foreign, state, and local tax rate changes on deferred taxes 78 1 5 — — — Stock-based compensation awards (36) — (23) — (64) (1) Charitable Contribution (128) (2) — — — — Effect of foreign tax rates (100) (2) (76) (1) (119) (2) Other 47 1 54 — 30 — Income tax expense $ 1,238 20% $ 1,261 22% $ 1,076 20% Deferred income taxes are provided for the effects of temporary differences between the tax basis of an asset or liability and its reported amount in the consolidated financial statements. These temporary differences result in taxable or deductible amounts in future years. The components of deferred income tax assets and liabilities are shown below: December 31, (in millions) 2020 2019 Deferred income tax assets: Compensation and benefits $ 295 $ 282 Unrealized investment losses 20 — Loss carryforwards 80 84 Other 659 481 Gross deferred tax assets 1,054 847 Less: deferred tax valuation allowances (26) (51) Deferred tax assets net of valuation allowances 1,028 796 Deferred income tax liabilities: Goodwill and acquired indefinite-lived intangibles 4,096 3,971 Acquired finite-lived intangibles 159 179 Unrealized investment gains — 63 Other 142 142 Gross deferred tax liabilities 4,397 4,355 Net deferred tax (liabilities) $ (3,369) $ (3,559) Deferred income tax assets and liabilities are recorded net when related to the same tax jurisdiction. At December 31, 2020, the Company recorded on the consolidated statement of financial condition deferred income tax assets, within other assets, and deferred income tax liabilities of $304 million and $3,673 million, respectively. At December 31, 2019, the Company recorded on the consolidated statement of financial condition deferred income tax assets, within other assets, and deferred income tax liabilities of $175 million and $3,734 million, respectively. Income tax expense for 2020 included a discrete tax benefit of $241 million recognized in connection with the Charitable Contribution, partially offset by a noncash net expense of approximately $79 million associated with the revaluation of certain deferred income tax assets and liabilities related to the legislation enacted in the United Kingdom increasing its corporate tax rate and state and local income tax changes. Income tax expense for 2020 also included $139 million of net discrete tax benefits, including benefits related to changes in the Company’s organizational entity structure and stock-based compensation awards. Income tax expense for 2019 included $28 million of discrete tax benefits, primarily related to stock-based compensation awards. At December 31, 2020 and 2019, the Company had available state net operating loss carryforwards of $2.0 billion and $1.9 billion, respectively, which will begin to expire in 2022. At December 31, 2020 and 2019, the Company had foreign net operating loss carryforwards of $102 million and $110 million, respectively, of which $2 million will begin to expire in 2021 . At December 31, 2020 and 2019, the Company had $26 million and $51 million of valuation allowances for deferred income tax assets, respectively, recorded on the consolidated statements of financial condition. Goodwill recorded in connection with the Quellos Transaction has been reduced during the period by the amount of tax benefit realized from tax-deductible goodwill. See Note 11, Goodwill, for further discussion. Current income taxes are recorded net on the consolidated statements of financial condition when related to the same tax jurisdiction. At December 31, 2020, the Company had current income taxes receivable and payable of $175 million and $131 million, respectively, recorded in other assets and accounts payable and accrued liabilities, respectively. At December 31, 2019, the Company had current income taxes receivable and payable of $282 million and $293 million, respectively, recorded in other assets and accounts payable and accrued liabilities, respectively. F-40
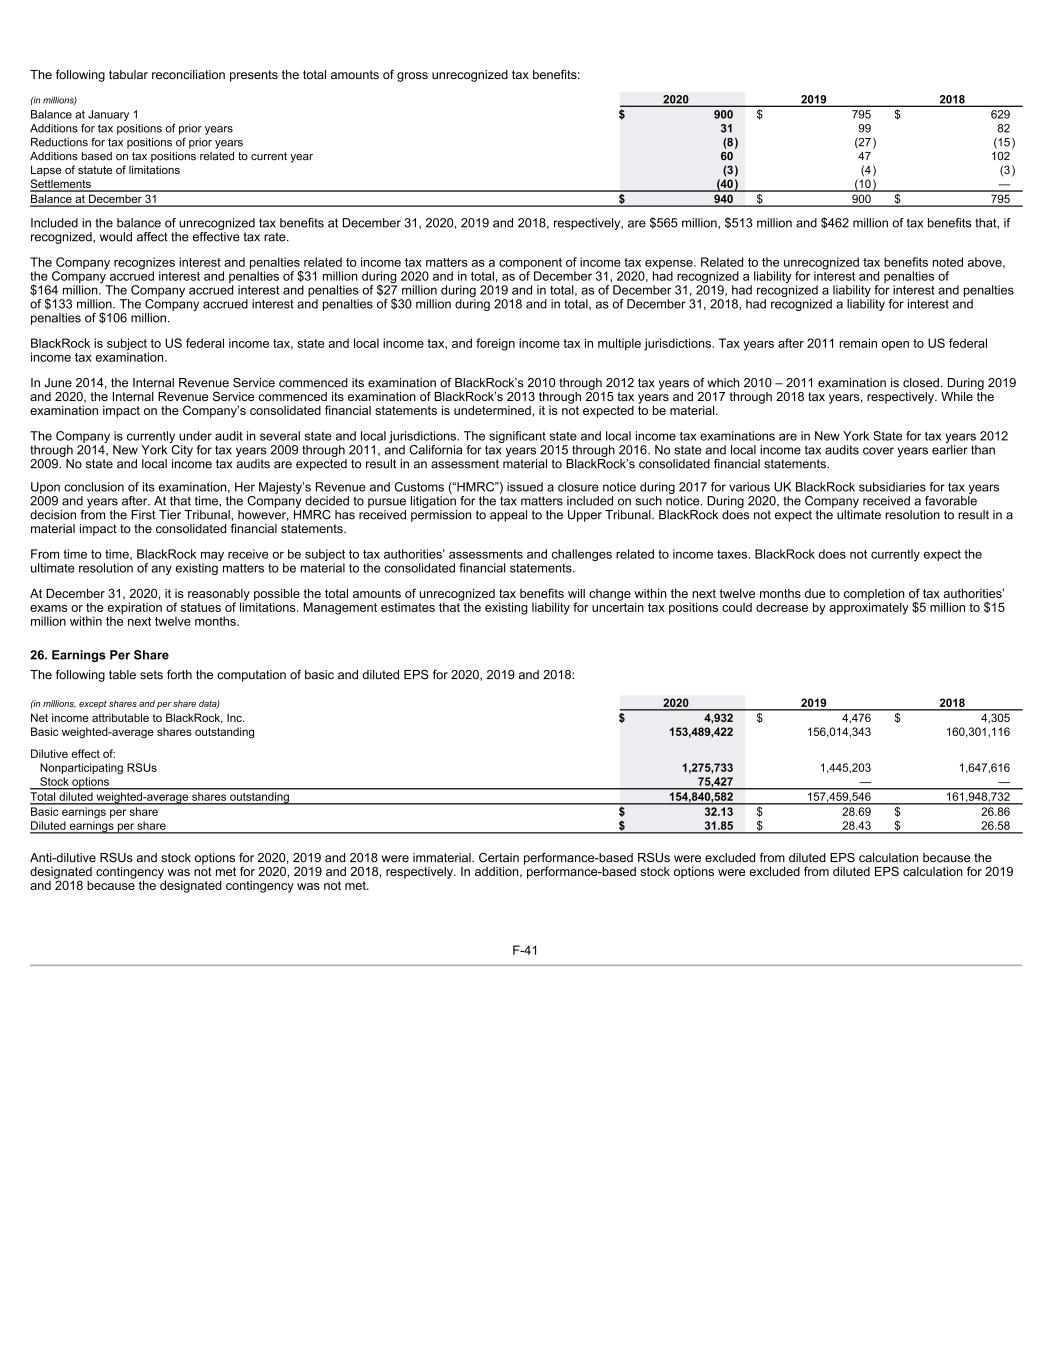
The following tabular reconciliation presents the total amounts of gross unrecognized tax benefits: (in millions) 2020 2019 2018 Balance at January 1 $ 900 $ 795 $ 629 Additions for tax positions of prior years 31 99 82 Reductions for tax positions of prior years (8) (27) (15) Additions based on tax positions related to current year 60 47 102 Lapse of statute of limitations (3) (4) (3) Settlements (40) (10) — Balance at December 31 $ 940 $ 900 $ 795 Included in the balance of unrecognized tax benefits at December 31, 2020, 2019 and 2018, respectively, are $565 million, $513 million and $462 million of tax benefits that, if recognized, would affect the effective tax rate. The Company recognizes interest and penalties related to income tax matters as a component of income tax expense. Related to the unrecognized tax benefits noted above, the Company accrued interest and penalties of $31 million during 2020 and in total, as of December 31, 2020, had recognized a liability for interest and penalties of $164 million. The Company accrued interest and penalties of $27 million during 2019 and in total, as of December 31, 2019, had recognized a liability for interest and penalties of $133 million. The Company accrued interest and penalties of $30 million during 2018 and in total, as of December 31, 2018, had recognized a liability for interest and penalties of $106 million. BlackRock is subject to US federal income tax, state and local income tax, and foreign income tax in multiple jurisdictions. Tax years after 2011 remain open to US federal income tax examination. In June 2014, the Internal Revenue Service commenced its examination of BlackRock’s 2010 through 2012 tax years of which 2010 – 2011 examination is closed. During 2019 and 2020, the Internal Revenue Service commenced its examination of BlackRock’s 2013 through 2015 tax years and 2017 through 2018 tax years, respectively. While the examination impact on the Company’s consolidated financial statements is undetermined, it is not expected to be material. The Company is currently under audit in several state and local jurisdictions. The significant state and local income tax examinations are in New York State for tax years 2012 through 2014, New York City for tax years 2009 through 2011, and California for tax years 2015 through 2016. No state and local income tax audits cover years earlier than 2009. No state and local income tax audits are expected to result in an assessment material to BlackRock’s consolidated financial statements. Upon conclusion of its examination, Her Majesty’s Revenue and Customs (“HMRC”) issued a closure notice during 2017 for various UK BlackRock subsidiaries for tax years 2009 and years after. At that time, the Company decided to pursue litigation for the tax matters included on such notice. During 2020, the Company received a favorable decision from the First Tier Tribunal, however, HMRC has received permission to appeal to the Upper Tribunal. BlackRock does not expect the ultimate resolution to result in a material impact to the consolidated financial statements. From time to time, BlackRock may receive or be subject to tax authorities’ assessments and challenges related to income taxes. BlackRock does not currently expect the ultimate resolution of any existing matters to be material to the consolidated financial statements. At December 31, 2020, it is reasonably possible the total amounts of unrecognized tax benefits will change within the next twelve months due to completion of tax authorities’ exams or the expiration of statues of limitations. Management estimates that the existing liability for uncertain tax positions could decrease by approximately $5 million to $15 million within the next twelve months. 26. Earnings Per Share The following table sets forth the computation of basic and diluted EPS for 2020, 2019 and 2018: (in millions, except shares and per share data) 2020 2019 2018 Net income attributable to BlackRock, Inc. $ 4,932 $ 4,476 $ 4,305 Basic weighted-average shares outstanding 153,489,422 156,014,343 160,301,116 Dilutive effect of: Nonparticipating RSUs 1,275,733 1,445,203 1,647,616 Stock options 75,427 — — Total diluted weighted-average shares outstanding 154,840,582 157,459,546 161,948,732 Basic earnings per share $ 32.13 $ 28.69 $ 26.86 Diluted earnings per share $ 31.85 $ 28.43 $ 26.58 Anti-dilutive RSUs and stock options for 2020, 2019 and 2018 were immaterial. Certain performance-based RSUs were excluded from diluted EPS calculation because the designated contingency was not met for 2020, 2019 and 2018, respectively. In addition, performance-based stock options were excluded from diluted EPS calculation for 2019 and 2018 because the designated contingency was not met. F-41
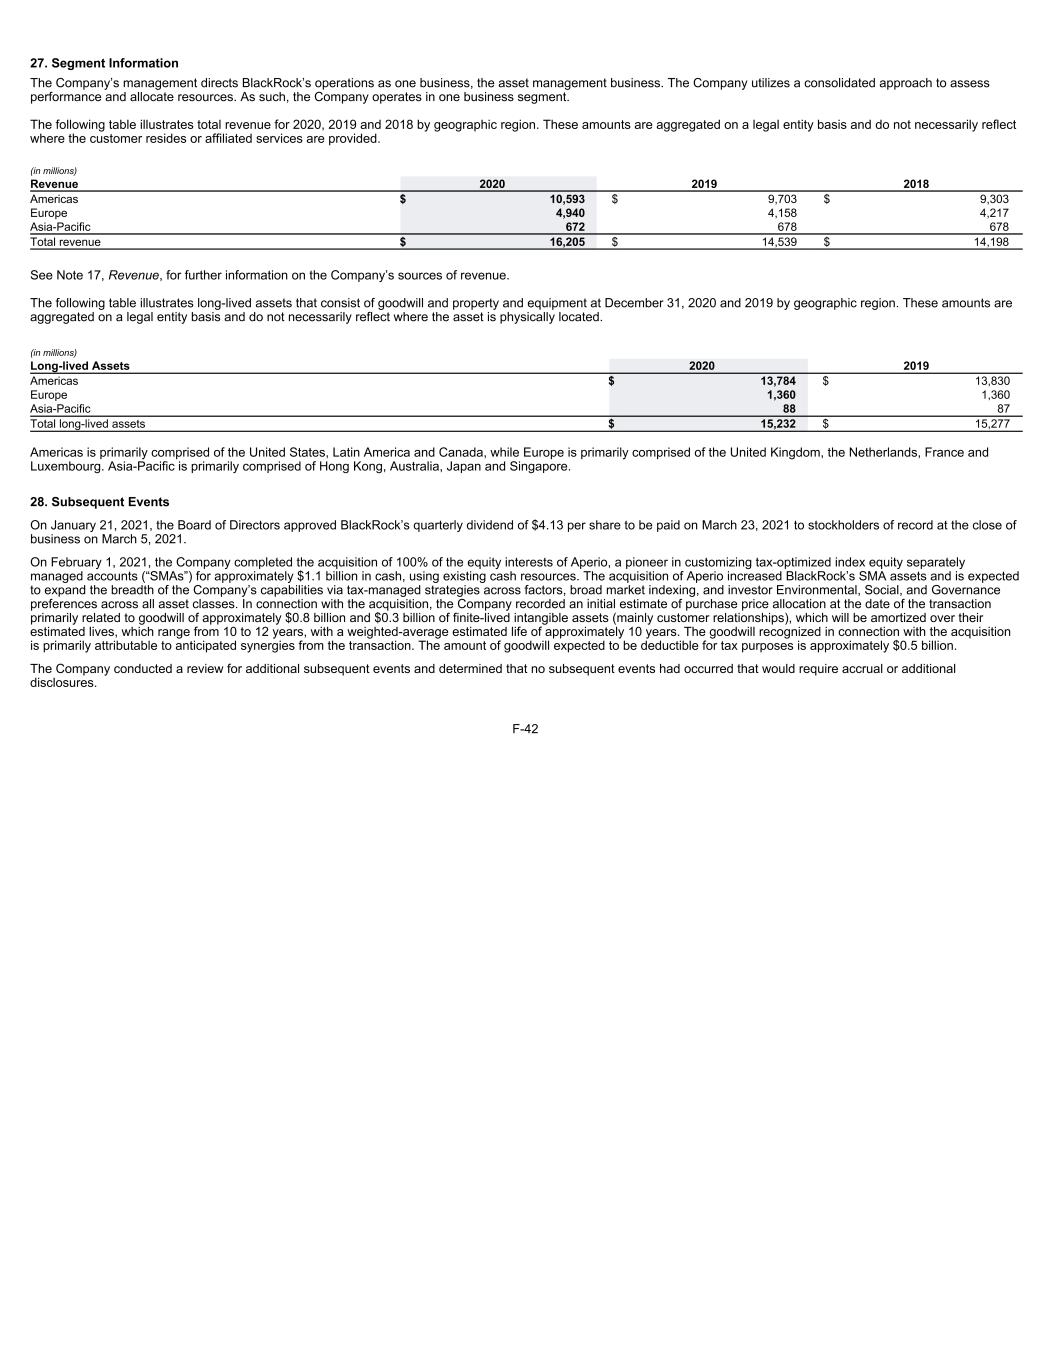
27. Segment Information The Company’s management directs BlackRock’s operations as one business, the asset management business. The Company utilizes a consolidated approach to assess performance and allocate resources. As such, the Company operates in one business segment. The following table illustrates total revenue for 2020, 2019 and 2018 by geographic region. These amounts are aggregated on a legal entity basis and do not necessarily reflect where the customer resides or affiliated services are provided. (in millions) Revenue 2020 2019 2018 Americas $ 10,593 $ 9,703 $ 9,303 Europe 4,940 4,158 4,217 Asia-Pacific 672 678 678 Total revenue $ 16,205 $ 14,539 $ 14,198 See Note 17, Revenue, for further information on the Company’s sources of revenue. The following table illustrates long-lived assets that consist of goodwill and property and equipment at December 31, 2020 and 2019 by geographic region. These amounts are aggregated on a legal entity basis and do not necessarily reflect where the asset is physically located. (in millions) Long-lived Assets 2020 2019 Americas $ 13,784 $ 13,830 Europe 1,360 1,360 Asia-Pacific 88 87 Total long-lived assets $ 15,232 $ 15,277 Americas is primarily comprised of the United States, Latin America and Canada, while Europe is primarily comprised of the United Kingdom, the Netherlands, France and Luxembourg. Asia-Pacific is primarily comprised of Hong Kong, Australia, Japan and Singapore. 28. Subsequent Events On January 21, 2021, the Board of Directors approved BlackRock’s quarterly dividend of $4.13 per share to be paid on March 23, 2021 to stockholders of record at the close of business on March 5, 2021. On February 1, 2021, the Company completed the acquisition of 100% of the equity interests of Aperio, a pioneer in customizing tax-optimized index equity separately managed accounts (“SMAs”) for approximately $1.1 billion in cash, using existing cash resources. The acquisition of Aperio increased BlackRock’s SMA assets and is expected to expand the breadth of the Company’s capabilities via tax-managed strategies across factors, broad market indexing, and investor Environmental, Social, and Governance preferences across all asset classes. In connection with the acquisition, the Company recorded an initial estimate of purchase price allocation at the date of the transaction primarily related to goodwill of approximately $0.8 billion and $0.3 billion of finite-lived intangible assets (mainly customer relationships), which will be amortized over their estimated lives, which range from 10 to 12 years, with a weighted-average estimated life of approximately 10 years. The goodwill recognized in connection with the acquisition is primarily attributable to anticipated synergies from the transaction. The amount of goodwill expected to be deductible for tax purposes is approximately $0.5 billion. The Company conducted a review for additional subsequent events and determined that no subsequent events had occurred that would require accrual or additional disclosures. F-42