EXHIBIT 99.2
Published on November 16, 2020
Exhibit 99.2 PNC Announces Agreement to Buy BBVA USA Bancshares, Inc. Accelerating PNC’s National Expansion Strategy Investor Presentation November 16, 2020 The PNC Financial Services Group
Cautionary Statement Regarding Forward-Looking and Non-GAAP Financial Information This presentation contains forward-looking statements regarding our outlook or expectations with respect to the planned acquisition of BBVA USA Bancshares, Inc., the combination of BBVA USA Bancshares, Inc. into PNC and BBVA USA into PNC Bank, and the impact of the transaction on PNC's future performance. Forward-looking statements are necessarily subject to numerous assumptions, risks and uncertainties, which change over time. Future events or circumstances may change our outlook and may also affect the nature of the assumptions, risks and uncertainties to which our forward-looking statements are subject. The forward-looking statements in this presentation speak only as of the date of this presentation, and we assume no duty, and do not undertake, to update them. Actual results or future events could differ, possibly materially, from those that we anticipated in these forward-looking statements. As a result, we caution against placing undue reliance on any forward-looking statements. Forward-looking statements in this presentation are subject to the following risks and uncertainties related both to the acquisition transaction itself and to the integration of the acquired business into PNC after closing: • The business of BBVA USA Bancshares, Inc., including its U.S. banking subsidiary, BBVA USA, may not perform as we currently project or in a manner consistent with historical performance. As a result, the anticipated benefits, including estimated cost savings, of the transaction may be significantly harder or take longer to achieve than expected or may not be achieved in their entirety as a result of unexpected factors or events, including those that are outside of our control. • The combination of BBVA USA Bancshares, Inc., including its U.S. banking subsidiary, BBVA USA, with that of PNC and PNC Bank may be more difficult to achieve than anticipated or have unanticipated adverse results relating to BBVA USA Bancshares, Inc.’s, including its U.S. banking subsidiary, BBVA USA, or our existing businesses. • Completion of the transaction is dependent on the satisfaction of customary closing conditions, which cannot be assured. The timing of completion of the transaction is dependent on various factors that cannot be predicted with precision at this point. These forward-looking statements are also subject to the principal risks and uncertainties applicable to our businesses generally that are disclosed in PNC's 2019 Form 10-K and 2020 Form 10-Qs and in PNC's subsequent SEC filings. Our SEC filings are accessible on the SEC's website at www.sec.gov and on our corporate website at www.pnc.com/secfilings. We have included these web addresses as inactive textual references only. Information on these websites is not part of this document. The forward-looking statements in this presentation are also qualified by the factors affecting forward-looking statements identified in the Cautionary Statement included in the Appendix. We include non-GAAP financial information in this presentation such as tangible book value. Reconciliations for such financial information may be found in our presentation, in these slides, including the Appendix, in other materials on our corporate website, and in our SEC filings. This information supplements our results as reported in accordance with GAAP and should not be viewed in isolation from, or as a substitute for, our GAAP results. We believe that this information and the related reconciliations may be useful to investors, analysts, regulators and others to help understand and evaluate our financial results, and with respect to adjusted metrics, because we believe they better reflect the ongoing financial results and trends of our businesses and increase comparability of period-to-period results. We may also use annualized, pro forma, estimated or third party numbers for illustrative or comparative purposes only. These may not reflect actual results. 2
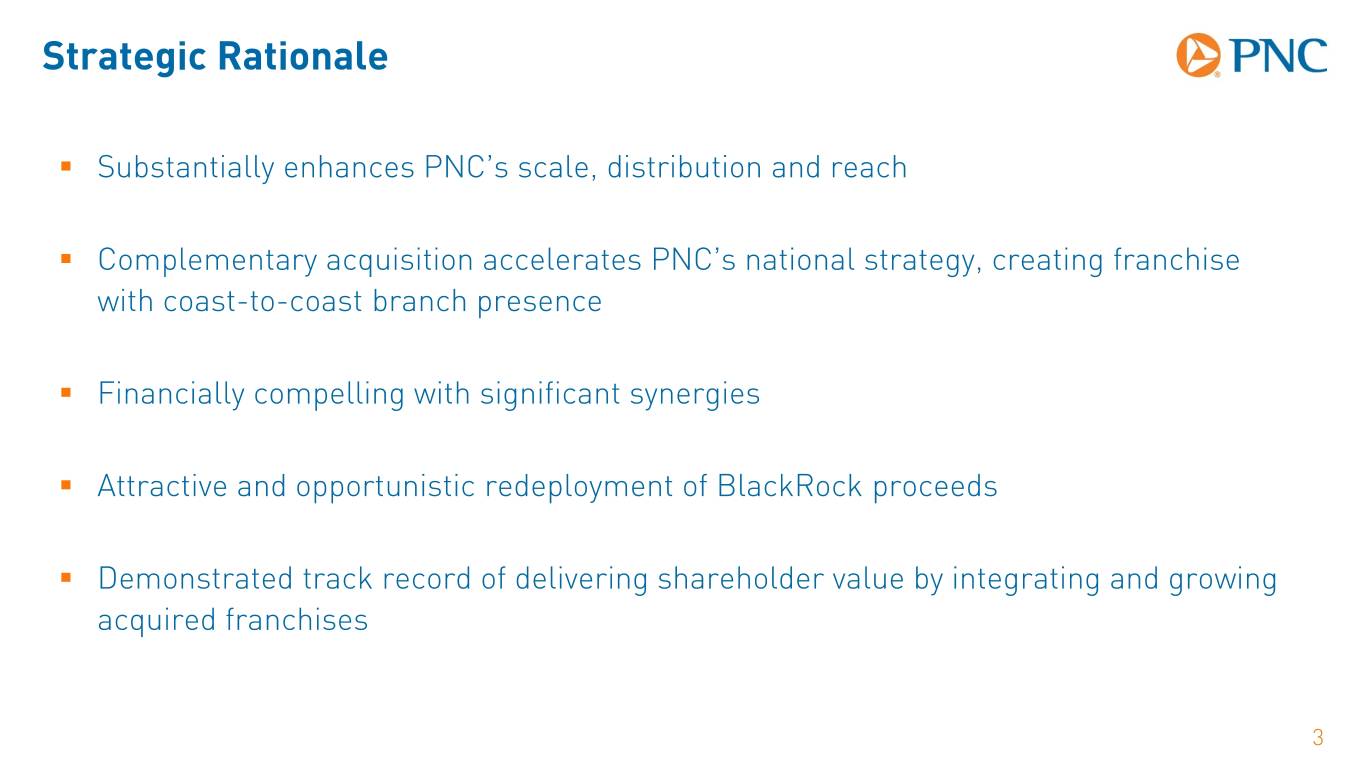
Strategic Rationale . Substantially enhances PNC’s scale, distribution and reach . Complementary acquisition accelerates PNC’s national strategy, creating franchise with coast-to-coast branch presence . Financially compelling with significant synergies . Attractive and opportunistic redeployment of BlackRock proceeds . Demonstrated track record of delivering shareholder value by integrating and growing acquired franchises 3
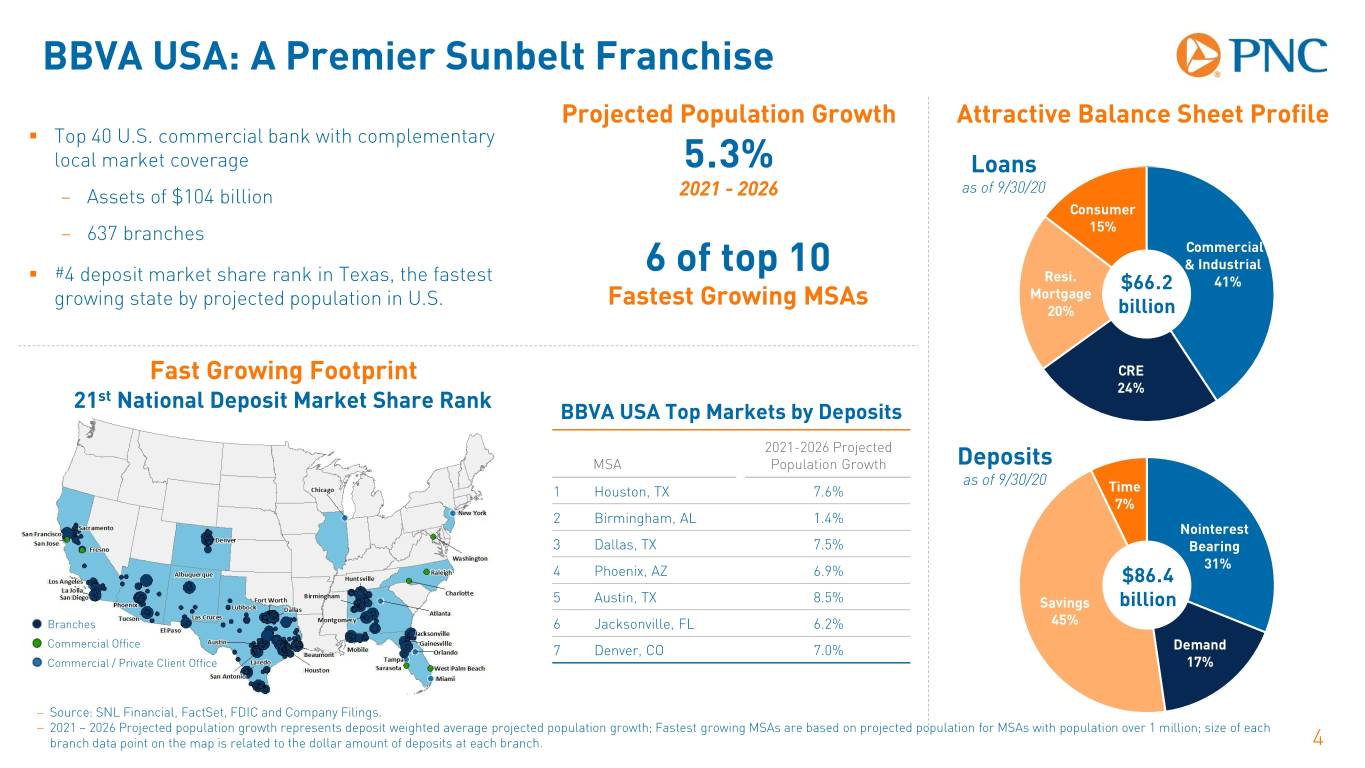
BBVA USA: A Premier Sunbelt Franchise Projected Population Growth Attractive Balance Sheet Profile . Top 40 U.S. commercial bank with complementary local market coverage 5.3% Loans – Assets of $104 billion 2021 - 2026 as of 9/30/20 Consumer – 637 branches 15% Commercial 6 of top 10 & Industrial . #4 deposit market share rank in Texas, the fastest Resi. $66.2 41% growing state by projected population in U.S. Fastest Growing MSAs Mortgage 20% billion Fast Growing Footprint CRE 24% 21st National Deposit Market Share Rank BBVA USA Top Markets by Deposits 2021-2026 Projected MSA Population Growth Deposits as of 9/30/20 1 Houston, TX 7.6% Time 7% 2 Birmingham, AL 1.4% Nointerest 3 Dallas, TX 7.5% Bearing 31% 4 Phoenix, AZ 6.9% $86.4 5 Austin, TX 8.5% Savings billion Branches 6 Jacksonville, FL 6.2% 45% Commercial Office 7 Denver, CO 7.0% Demand Commercial / Private Client Office 17% − Source: SNL Financial, FactSet, FDIC and Company Filings. − 2021 – 2026 Projected population growth represents deposit weighted average projected population growth; Fastest growing MSAs are based on projected population for MSAs with population over 1 million; size of each branch data point on the map is related to the dollar amount of deposits at each branch. 4
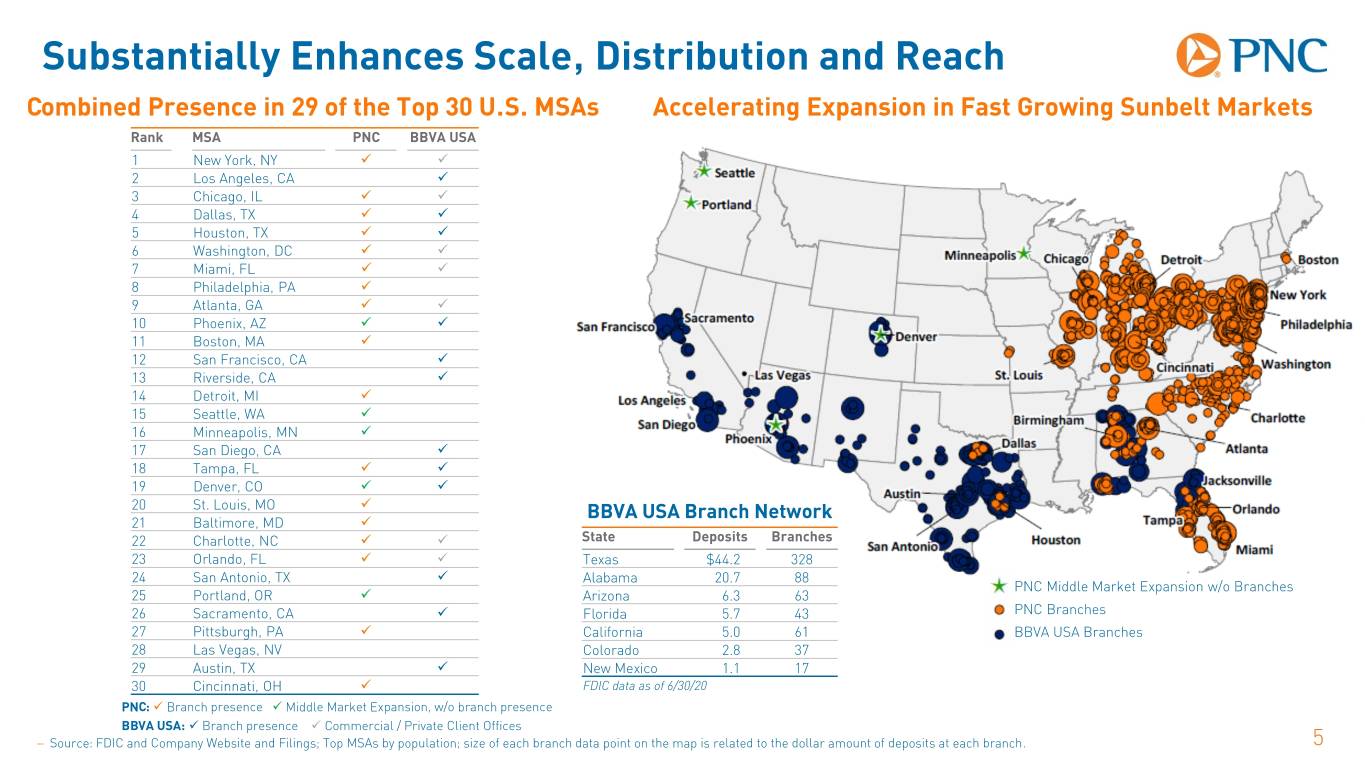
Substantially Enhances Scale, Distribution and Reach Combined Presence in 29 of the Top 30 U.S. MSAs Accelerating Expansion in Fast Growing Sunbelt Markets Rank MSA PNC BBVA USA 1 New York, NY 2 Los Angeles, CA 3 Chicago, IL 4 Dallas, TX 5 Houston, TX 6 Washington, DC 7 Miami, FL 8 Philadelphia, PA 9 Atlanta, GA 10 Phoenix, AZ 11 Boston, MA 12 San Francisco, CA 13 Riverside, CA 14 Detroit, MI 15 Seattle, WA 16 Minneapolis, MN 17 San Diego, CA 18 Tampa, FL 19 Denver, CO 20 St. Louis, MO BBVA USA Branch Network 21 Baltimore, MD 22 Charlotte, NC State Deposits Branches 23 Orlando, FL Texas $44.2 328 24 San Antonio, TX Alabama 20.7 88 PNC Middle Market Expansion w/o Branches 25 Portland, OR Arizona 6.3 63 26 Sacramento, CA Florida 5.7 43 PNC Branches 27 Pittsburgh, PA California 5.0 61 BBVA USA Branches 28 Las Vegas, NV Colorado 2.8 37 29 Austin, TX New Mexico 1.1 17 30 Cincinnati, OH FDIC data as of 6/30/20 PNC: Branch presence Middle Market Expansion, w/o branch presence BBVA USA: Branch presence Commercial / Private Client Offices − Source: FDIC and Company Website and Filings; Top MSAs by population; size of each branch data point on the map is related to the dollar amount of deposits at each branch. 5
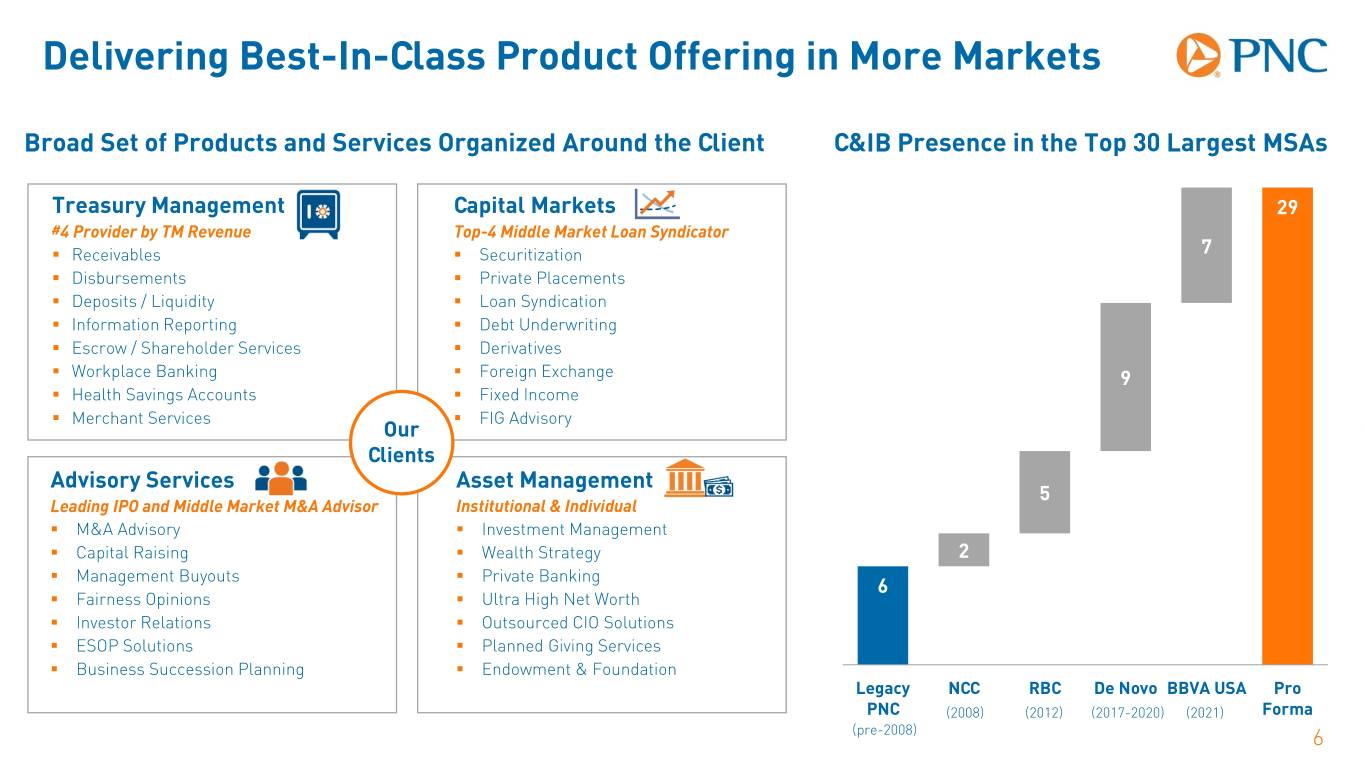
Delivering Best-In-Class Product Offering in More Markets Broad Set of Products and Services Organized Around the Client C&IB Presence in the Top 30 Largest MSAs Treasury Management Capital Markets 29 #4 Provider by TM Revenue Top-4 Middle Market Loan Syndicator . Receivables . Securitization 7 . Disbursements . Private Placements . Deposits / Liquidity . Loan Syndication . Information Reporting . Debt Underwriting . Escrow / Shareholder Services . Derivatives . Workplace Banking . Foreign Exchange 9 . Health Savings Accounts . Fixed Income . Merchant Services . FIG Advisory Our Clients Advisory Services Asset Management 5 Leading IPO and Middle Market M&A Advisor Institutional & Individual . M&A Advisory . Investment Management . Capital Raising . Wealth Strategy 2 . Management Buyouts . Private Banking 6 . Fairness Opinions . Ultra High Net Worth . Investor Relations . Outsourced CIO Solutions . ESOP Solutions . Planned Giving Services . Business Succession Planning . Endowment & Foundation Legacy NCC RBC De Novo BBVA USA Pro PNC (2008) (2012) (2017-2020) (2021) Forma (pre-2008) 6
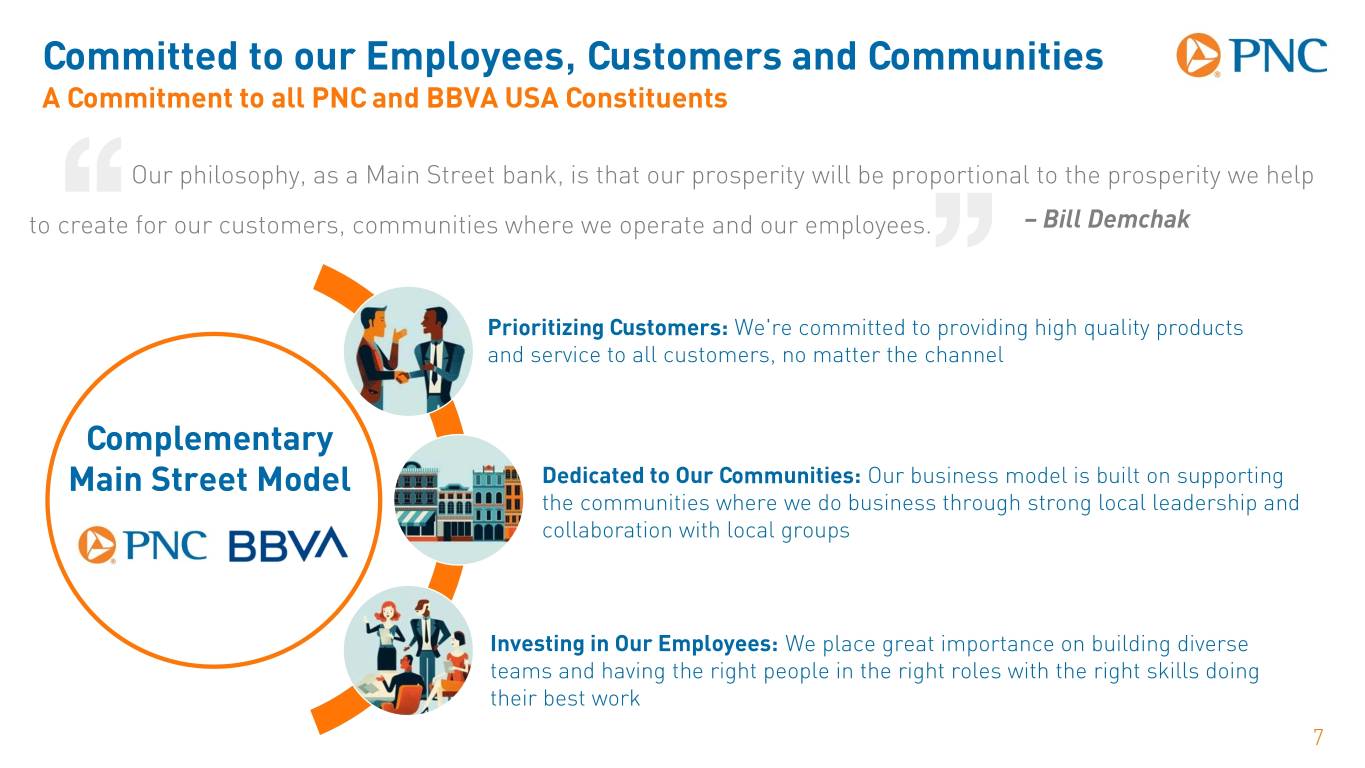
Committed to our Employees, Customers and Communities A Commitment to all PNC and BBVA USA Constituents Our philosophy, as a Main Street bank, is that our prosperity will be proportional to the prosperity we help to create for our customers, communities where we operate and our employees. – Bill Demchak Prioritizing Customers: We're committed to providing high quality products and service to all customers, no matter the channel Complementary Main Street Model Dedicated to Our Communities: Our business model is built on supporting the communities where we do business through strong local leadership and collaboration with local groups Investing in Our Employees: We place great importance on building diverse teams and having the right people in the right roles with the right skills doing their best work 7
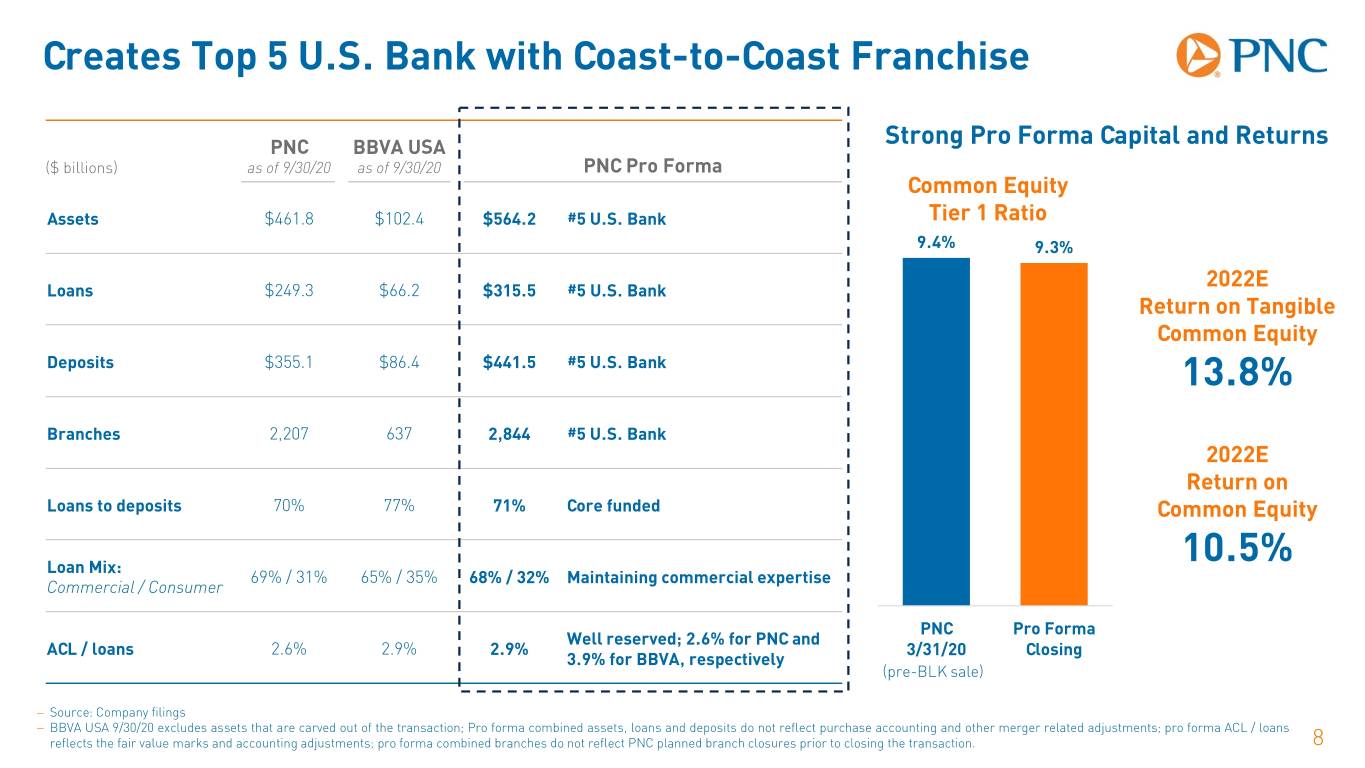
Creates Top 5 U.S. Bank with Coast-to-Coast Franchise PNC BBVA USA Strong Pro Forma Capital and Returns ($ billions) as of 9/30/20 as of 9/30/20 PNC Pro Forma Common Equity Assets $461.8 $102.4 $564.2 #5 U.S. Bank Tier 1 Ratio 9.4% 9.3% 2022E Loans $249.3 $66.2 $315.5 #5 U.S. Bank Return on Tangible Common Equity Deposits $355.1 $86.4 $441.5 #5 U.S. Bank 13.8% Branches 2,207 637 2,844 #5 U.S. Bank 2022E Return on Loans to deposits 70% 77% 71% Core funded Common Equity Loan Mix: 10.5% 69% / 31% 65% / 35% 68% / 32% Maintaining commercial expertise Commercial / Consumer PNC Pro Forma Well reserved; 2.6% for PNC and ACL / loans 2.6% 2.9% 2.9% 3/31/20 Closing 3.9% for BBVA, respectively (pre-BLK sale) − Source: Company filings − BBVA USA 9/30/20 excludes assets that are carved out of the transaction; Pro forma combined assets, loans and deposits do not reflect purchase accounting and other merger related adjustments; pro forma ACL / loans reflects the fair value marks and accounting adjustments; pro forma combined branches do not reflect PNC planned branch closures prior to closing the transaction. 8
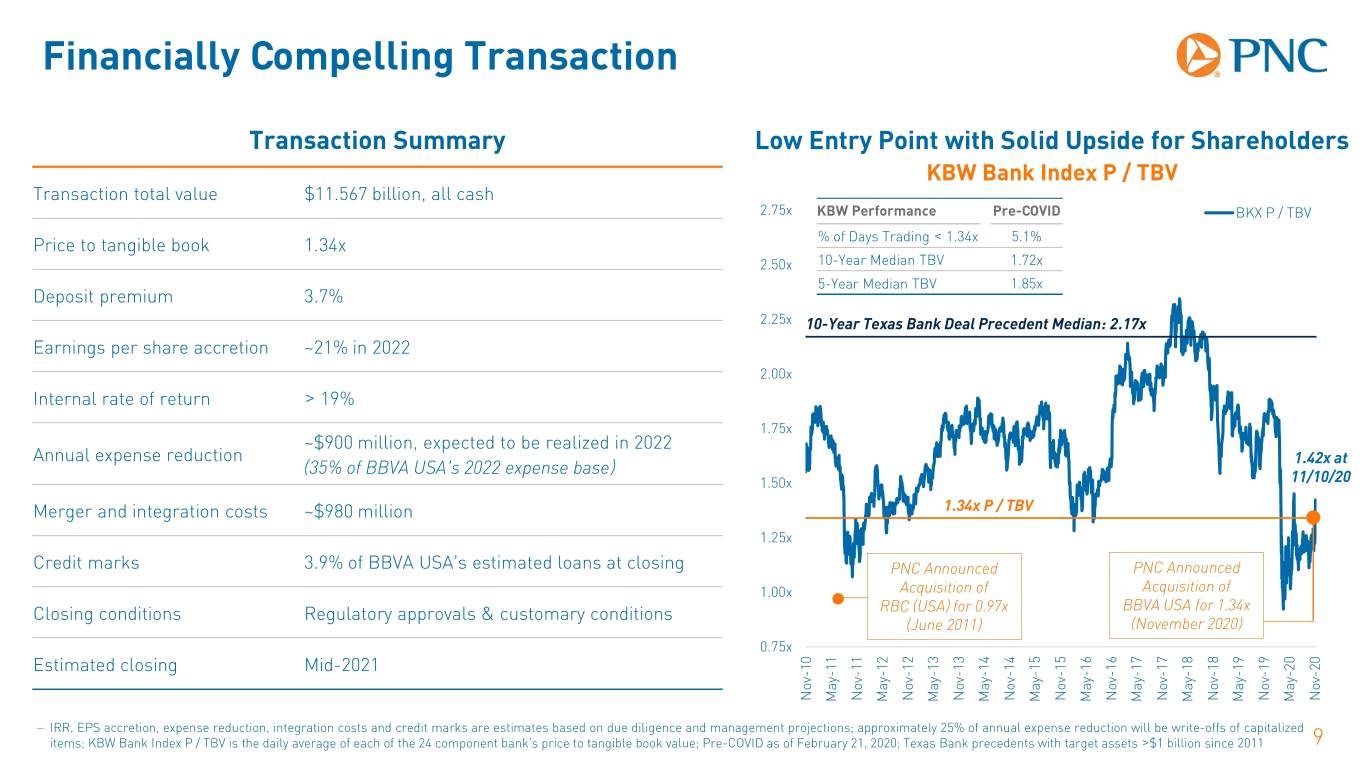
Financially Compelling Transaction Transaction Summary Low Entry Point with Solid Upside for Shareholders KBW Bank Index P / TBV Transaction total value $11.567 billion, all cash 2.75x KBW Performance Pre-COVID BKX P / TBV Price to tangible book 1.34x % of Days Trading < 1.34x 5.1% 2.50x 10-Year Median TBV 1.72x 5-Year Median TBV 1.85x Deposit premium 3.7% 2.25x 10-Year Texas Bank Deal Precedent Median: 2.17x Earnings per share accretion ~21% in 2022 2.00x Internal rate of return > 19% 1.75x ~$900 million, expected to be realized in 2022 Annual expense reduction 1.42x at (35% of BBVA USA’s 2022 expense base) 1.50x 11/10/20 Merger and integration costs ~$980 million 1.34x P / TBV 1.25x Credit marks 3.9% of BBVA USA’s estimated loans at closing PNC Announced PNC Announced 1.00x Acquisition of Acquisition of Closing conditions Regulatory approvals & customary conditions RBC (USA) for 0.97x BBVA USA for 1.34x (June 2011) (November 2020) 0.75x Estimated closing Mid-2021 Nov-10 Nov-11 Nov-12 Nov-13 Nov-14 Nov-15 Nov-16 Nov-17 Nov-18 Nov-19 Nov-20 May-11 May-12 May-13 May-14 May-15 May-16 May-17 May-18 May-19 May-20 − IRR, EPS accretion, expense reduction, integration costs and credit marks are estimates based on due diligence and management projections; approximately 25% of annual expense reduction will be write-offs of capitalized items; KBW Bank Index P / TBV is the daily average of each of the 24 component bank’s price to tangible book value; Pre-COVID as of February 21, 2020; Texas Bank precedents with target assets >$1 billion since 2011 9
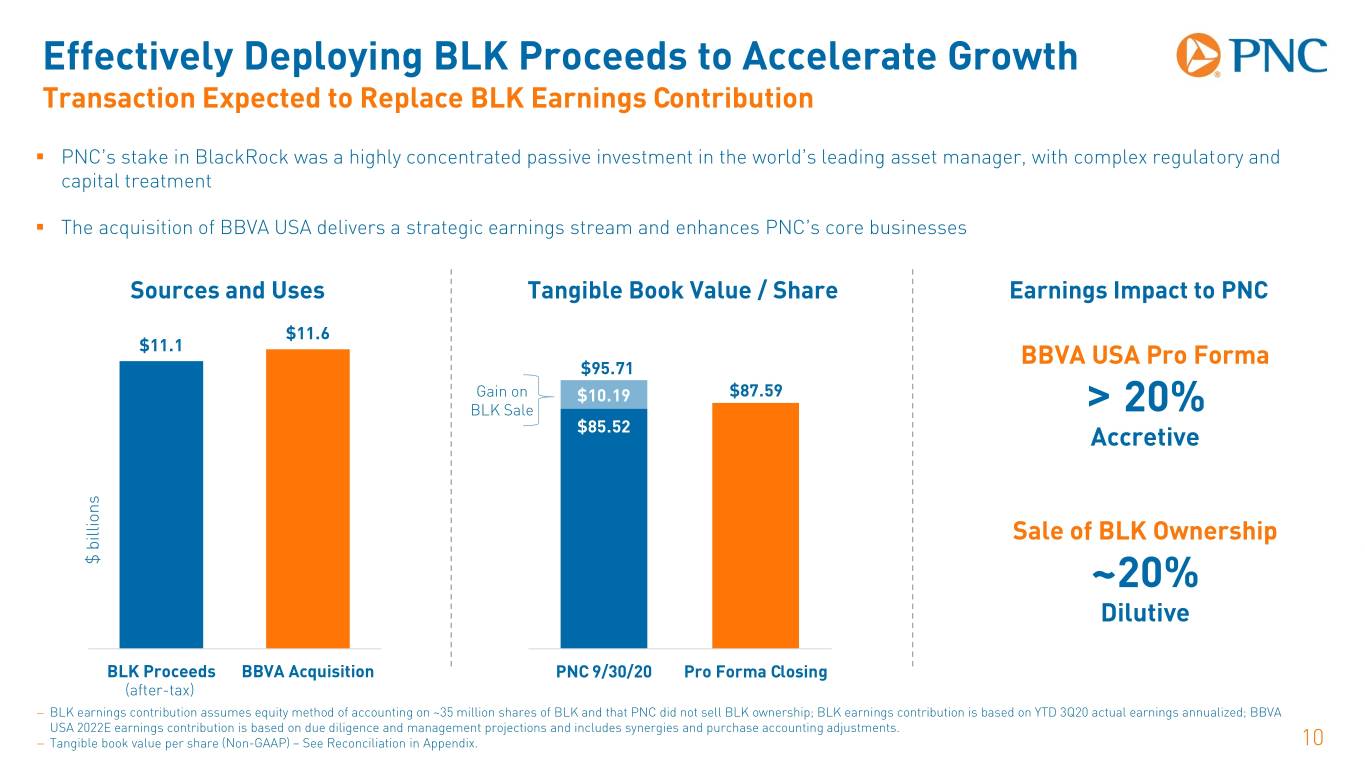
Effectively Deploying BLK Proceeds to Accelerate Growth Transaction Expected to Replace BLK Earnings Contribution . PNC’s stake in BlackRock was a highly concentrated passive investment in the world’s leading asset manager, with complex regulatory and capital treatment . The acquisition of BBVA USA delivers a strategic earnings stream and enhances PNC’s core businesses Sources and Uses Tangible Book Value / Share Earnings Impact to PNC $11.6 $11.1 $95.71 BBVA USA Pro Forma Gain on $10.19 $87.59 BLK Sale > 20% $85.52 Accretive Sale of BLK Ownership $ billions ~20% Dilutive BLK Proceeds BBVA Acquisition PNC 9/30/20 Pro Forma Closing (after-tax) − BLK earnings contribution assumes equity method of accounting on ~35 million shares of BLK and that PNC did not sell BLK ownership; BLK earnings contribution is based on YTD 3Q20 actual earnings annualized; BBVA USA 2022E earnings contribution is based on due diligence and management projections and includes synergies and purchase accounting adjustments. − Tangible book value per share (Non-GAAP) – See Reconciliation in Appendix. 10
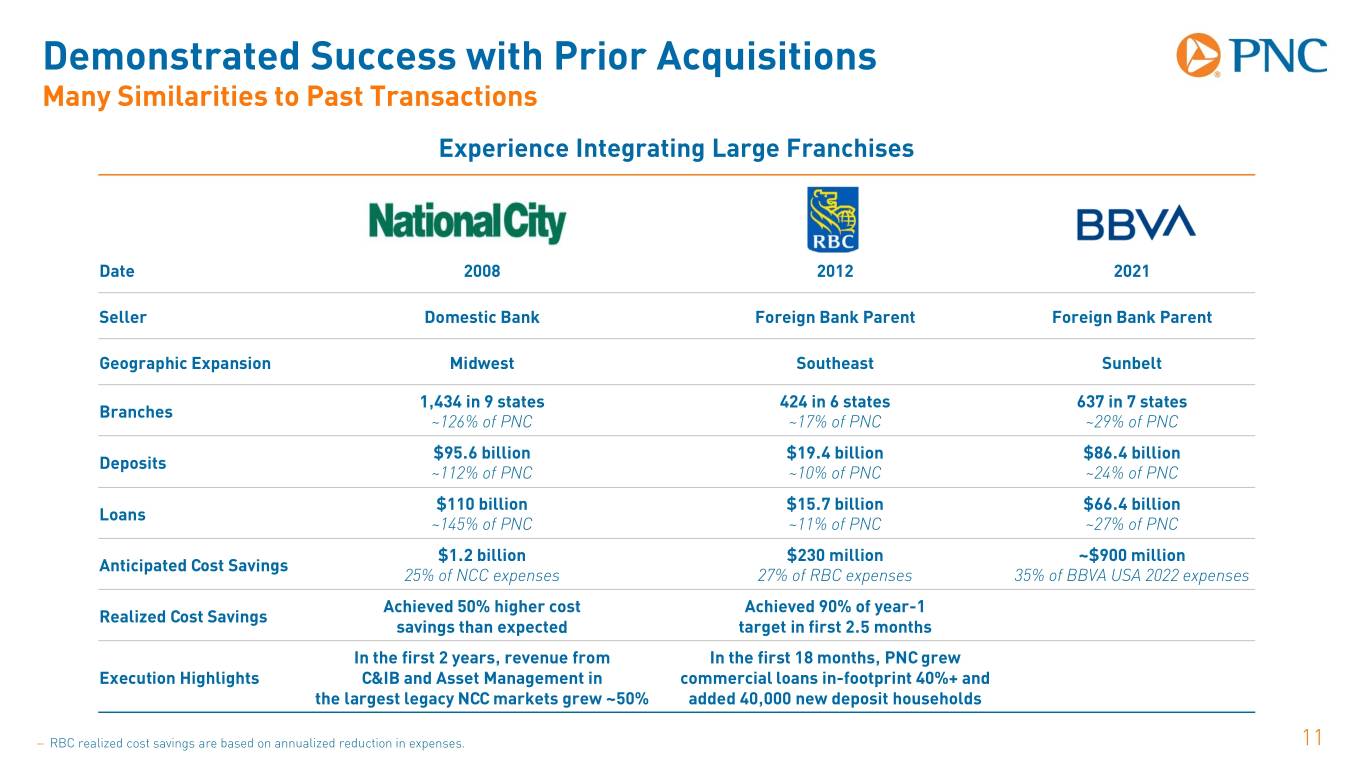
Demonstrated Success with Prior Acquisitions Many Similarities to Past Transactions Experience Integrating Large Franchises Date 2008 2012 2021 Seller Domestic Bank Foreign Bank Parent Foreign Bank Parent Geographic Expansion Midwest Southeast Sunbelt 1,434 in 9 states 424 in 6 states 637 in 7 states Branches ~126% of PNC ~17% of PNC ~29% of PNC $95.6 billion $19.4 billion $86.4 billion Deposits ~112% of PNC ~10% of PNC ~24% of PNC $110 billion $15.7 billion $66.4 billion Loans ~145% of PNC ~11% of PNC ~27% of PNC $1.2 billion $230 million ~$900 million Anticipated Cost Savings 25% of NCC expenses 27% of RBC expenses 35% of BBVA USA 2022 expenses Achieved 50% higher cost Achieved 90% of year-1 Realized Cost Savings savings than expected target in first 2.5 months In the first 2 years, revenue from In the first 18 months, PNC grew Execution Highlights C&IB and Asset Management in commercial loans in-footprint 40%+ and the largest legacy NCC markets grew ~50% added 40,000 new deposit households − RBC realized cost savings are based on annualized reduction in expenses. 11
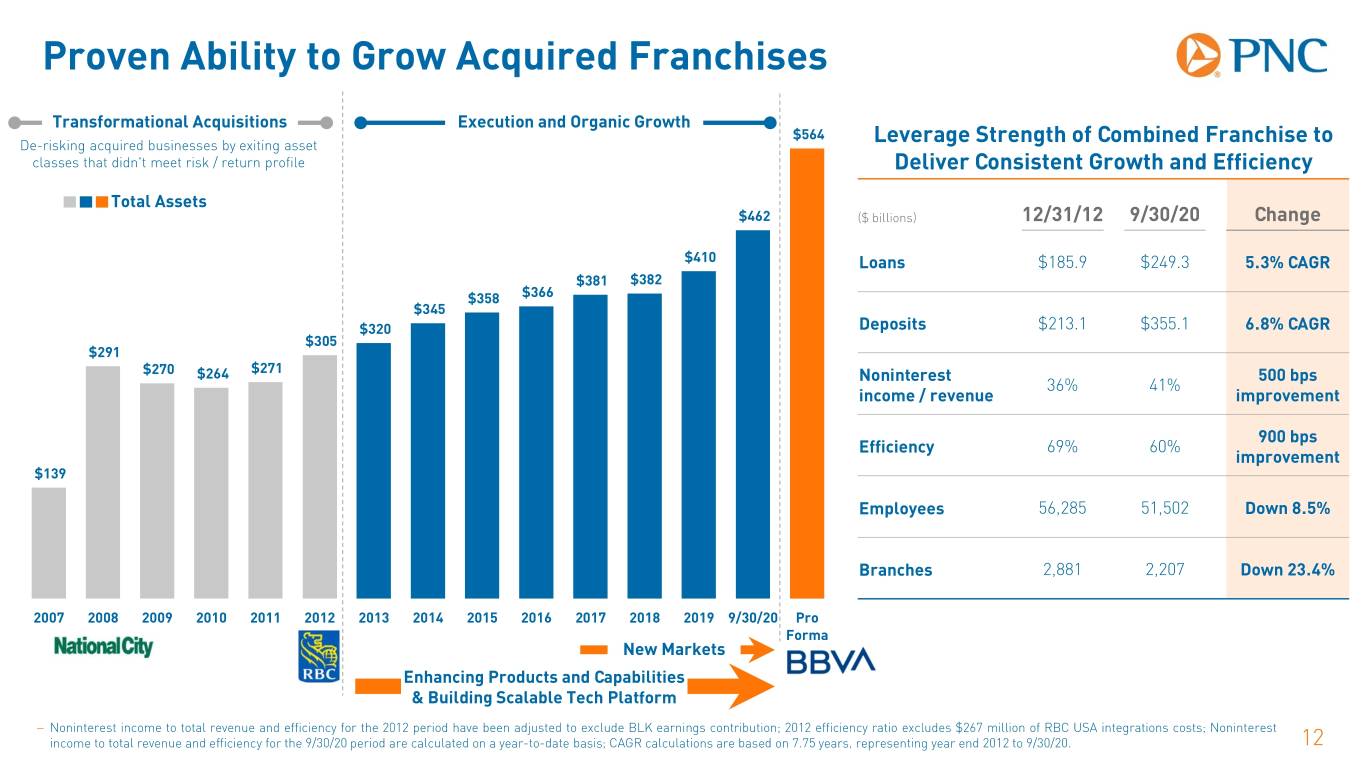
Proven Ability to Grow Acquired Franchises Transformational Acquisitions Execution and Organic Growth $564 De-risking acquired businesses by exiting asset Leverage Strength of Combined Franchise to classes that didn't meet risk / return profile Deliver Consistent Growth and Efficiency Total Assets $462 ($ billions) 12/31/12 9/30/20 Change $410 Loans $185.9 $249.3 5.3% CAGR $381 $382 $358 $366 $345 $320 Deposits $213.1 $355.1 6.8% CAGR $305 $291 $270 $264 $271 Noninterest 500 bps 36% 41% income / revenue improvement 900 bps Efficiency 69% 60% improvement $139 Employees 56,285 51,502 Down 8.5% Branches 2,881 2,207 Down 23.4% 2007 2008 2009 2010 2011 2012 2013 2014 2015 2016 2017 2018 2019 9/30/20 Pro Forma New Markets Enhancing Products and Capabilities & Building Scalable Tech Platform − Noninterest income to total revenue and efficiency for the 2012 period have been adjusted to exclude BLK earnings contribution; 2012 efficiency ratio excludes $267 million of RBC USA integrations costs; Noninterest income to total revenue and efficiency for the 9/30/20 period are calculated on a year-to-date basis; CAGR calculations are based on 7.75 years, representing year end 2012 to 9/30/20. 12
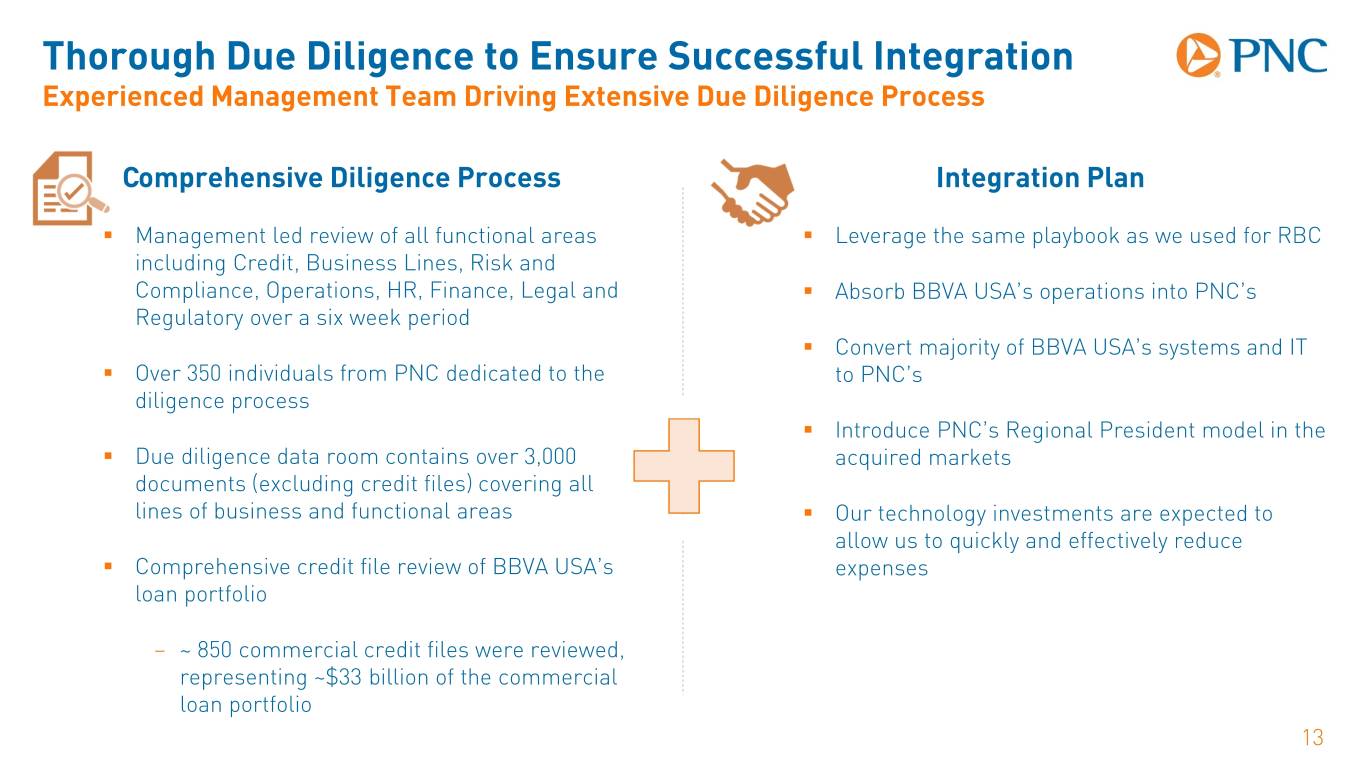
Thorough Due Diligence to Ensure Successful Integration Experienced Management Team Driving Extensive Due Diligence Process Comprehensive Diligence Process Integration Plan . Management led review of all functional areas . Leverage the same playbook as we used for RBC including Credit, Business Lines, Risk and Compliance, Operations, HR, Finance, Legal and . Absorb BBVA USA’s operations into PNC’s Regulatory over a six week period . Convert majority of BBVA USA’s systems and IT . Over 350 individuals from PNC dedicated to the to PNC’s diligence process . Introduce PNC’s Regional President model in the . Due diligence data room contains over 3,000 acquired markets documents (excluding credit files) covering all lines of business and functional areas . Our technology investments are expected to allow us to quickly and effectively reduce . Comprehensive credit file review of BBVA USA’s expenses loan portfolio – ~ 850 commercial credit files were reviewed, representing ~$33 billion of the commercial loan portfolio 13
Summary Value Added Acquisition Positions PNC Well for the Future . Substantially enhances PNC’s scale, distribution and reach . Complementary acquisition accelerates PNC’s national strategy, creating franchise with coast-to-coast branch presence . Financially compelling with significant synergies . Attractive and opportunistic redeployment of BlackRock proceeds . Demonstrated track record of delivering shareholder value by integrating and growing acquired franchises 14
Appendix: Cautionary Statement Regarding Forward-Looking Information This presentation includes “snapshot” information about PNC used by way of illustration and is not intended as a full business or financial review. It should not be viewed in isolation but rather in the context of all of the information made available by PNC in its SEC filings. We also make statements in this presentation, and we may from time to time make other statements, regarding our outlook for earnings, revenues, expenses, tax rates, capital and liquidity levels and ratios, asset levels, asset quality, financial position, and other matters regarding or affecting PNC and its future business and operations that are forward-looking statements within the meaning of the Private Securities Litigation Reform Act. Forward-looking statements are typically identified by words such as “believe,” “plan,” “expect,” “anticipate,” “see,” “look,” “intend,” “outlook,” “project,” “forecast,” “estimate,” “goal,” “will,” “should” and other similar words and expressions. Forward-looking statements are necessarily subject to numerous assumptions, risks and uncertainties, which change over time. Future events or circumstances may change our outlook and may also affect the nature of the assumptions, risks and uncertainties to which our forward-looking statements are subject. Forward-looking statements speak only as of the date made. We do not assume any duty and do not undertake to update forward-looking statements. Actual results or future events could differ, possibly materially, from those anticipated in forward-looking statements, as well as from historical performance. As a result, we caution against placing undue reliance on any forward-looking statements. Our forward-looking statements are subject to the following principal risks and uncertainties. . Our businesses, financial results and balance sheet values are affected by business and economic conditions, including the following: − Changes in interest rates and valuations in debt, equity and other financial markets. − Disruptions in the U.S. and global financial markets. − Actions by the Federal Reserve Board, U.S. Treasury and other government agencies, including those that impact money supply and market interest rates. − Changes in customer behavior due to changing business and economic conditions or legislative or regulatory initiatives. − Changes in customers’, suppliers’ and other counterparties’ performance and creditworthiness. − Impacts of tariffs and other trade policies of the U.S. and its global trading partners. − The length and extent of economic contraction as a result of the COVID-19 pandemic. − The impact of the results of the recent U.S. elections on the regulatory landscape, capital markets, and the response to and management of the COVID-19 pandemic. − Commodity price volatility. . Our forward-looking financial statements are subject to the risk that economic and financial market conditions will be substantially different than those we are currently expecting and do not take into account potential legal and regulatory contingencies. These statements are based on our view that: − The U.S. economy is in a nascent economic recovery in the second half of 2020, following a very severe but very short economic contraction in the first half of the year due to the COVID-19 pandemic and public health measures to contain it. Real GDP declined significantly in the first and second quarters of 2020, as many firms closed, at least temporarily, and consumers stayed at home. Since the late spring/early summer economic activity has picked up due to loosening restrictions on businesses, massive federal stimulus, and extremely low interest rates. Between May and September the economy added back slightly more than half of the 22 million jobs lost in March and April. 15
Appendix: Cautionary Statement Regarding Forward-Looking Information − Despite the improvement in the economy in recent months, economic activity remains far below its pre-pandemic level and unemployment remains elevated. Real GDP growth in the third quarter was extremely strong, at an annual rate of 33.1%, but will slow in the fourth quarter and through 2021. PNC does not expect real GDP to return to its pre-pandemic level until late 2021, and does not expect employment to return to its pre-pandemic level until 2023. Risks to this outlook are weighted to the downside; they include a further resurgence in the spread of the coronavirus and a lack of additional stimulus from the federal government. − Monetary policy remains extremely supportive of economic growth. PNC expects the Federal Open Market Committee to keep the federal funds rate in its current range of 0.00% to 0.25% through at least mid- 2024. . Given the many unknowns and risks being heavily weighted to the downside, our forward-looking statements are subject to the risk that conditions will be substantially different than we are currently expecting. If efforts to contain COVID-19 are unsuccessful and restrictions on businesses and activities are not further lifted or are reimposed, the recovery would be much weaker. There is even the potential that the economy could fall back into recession. PNC's baseline scenario assumes additional fiscal stimulus; continued inaction on stimulus is another major downside risk. The longer it takes to combat the pandemic, the more permanent damage it will cause to business and consumer fundamentals and sentiment; this could make the recovery weaker and result in permanently lower long-run economic growth. An extended global recession due to COVID-19 would weaken the U.S. recovery. As a result, the outbreak and its consequences, including responsive measures to manage it, have had and are likely to continue to have an adverse effect, possibly materially, on our business and financial performance by adversely affecting the demand and profitability of our products and services, the valuation of assets and our ability to meet the needs of our customers. . PNC's ability to take certain capital actions, including returning capital to shareholders is subject to PNC meeting or exceeding a stress capital buffer established by the Federal Reserve Board in connection with the Federal Reserve Board's Comprehensive Capital Analysis and Review (CCAR) process. The Federal Reserve also has imposed additional limitations on capital distributions through the fourth quarter of 2020 by CCAR-participating bank holding companies and may extend these limitations, potentially in modified form. . PNC’s regulatory capital ratios in the future will depend on, among other things, the company’s financial performance, the scope and terms of final capital regulations then in effect and management actions affecting the composition of PNC’s balance sheet. In addition, PNC’s ability to determine, evaluate and forecast regulatory capital ratios, and to take actions (such as capital distributions) based on actual or forecasted capital ratios, will be dependent at least in part on the development, validation and regulatory review of related models. . Legal and regulatory developments could have an impact on our ability to operate our businesses, financial condition, results of operations, competitive position, reputation, or pursuit of attractive acquisition opportunities. Reputational impacts could affect matters such as business generation and retention, liquidity, funding, and ability to attract and retain management. These developments could include: − Changes to laws and regulations, including changes affecting oversight of the financial services industry, consumer protection, bank capital and liquidity standards, pension, bankruptcy and other industry aspects, and changes in accounting policies and principles. − Unfavorable resolution of legal proceedings or other claims and regulatory and other governmental investigations or other inquiries. These matters may result in monetary judgments or settlements or other remedies, including fines, penalties, restitution or alterations in our business practices, and in additional expenses and collateral costs, and may cause reputational harm to PNC. − Results of the regulatory examination and supervision process, including our failure to satisfy requirements of agreements with governmental agencies. − Impact on business and operating results of any costs associated with obtaining rights in intellectual property claimed by others and of adequacy of our intellectual property protection in general. . Business and operating results are affected by our ability to identify and effectively manage risks inherent in our businesses, including, where appropriate, through effective use of systems and controls, third-party insurance, derivatives, and capital management techniques, and to meet evolving regulatory capital and liquidity standards. 16
Appendix: Cautionary Statement Regarding Forward-Looking Information . We grow our business in part through acquisitions and new strategic initiatives. Risks and uncertainties include those presented by the nature of the business acquired and strategic initiative, including in some cases those associated with our entry into new businesses or new geographic or other markets and risks resulting from our inexperience in those new areas, as well as risks and uncertainties related to the acquisition transactions themselves, regulatory issues, and the integration of the acquired businesses into PNC after closing. . Competition can have an impact on customer acquisition, growth and retention and on credit spreads and product pricing, which can affect market share, deposits and revenues. Our ability to anticipate and respond to technological changes can also impact our ability to respond to customer needs and meet competitive demands. . Business and operating results can also be affected by widespread natural and other disasters, pandemics, dislocations, terrorist activities, system failures, security breaches, cyber attacks or international hostilities through impacts on the economy and financial markets generally or on us or our counterparties specifically. We provide greater detail regarding these as well as other factors in our 2019 Form 10-K and subsequent Form 10-Qs, including in the Risk Factors and Risk Management sections and the Legal Proceedings and Commitments Notes of the Notes To Consolidated Financial Statements in those reports, and in our other subsequent SEC filings. In particular, our forward-looking statements are subject to risks and uncertainties related to the COVID-19 pandemic and the resulting governmental and societal responses. Our forward-looking statements may also be subject to other risks and uncertainties, including those we may discuss elsewhere in this news release or in our SEC filings, accessible on the SEC’s website at www.sec.gov and on our corporate website at www.pnc.com/secfilings. We have included these web addresses as inactive textual references only. Information on these websites is not part of this document. Any annualized, pro forma, estimated, third party or consensus numbers in this presentation are used for illustrative or comparative purposes only and may not reflect actual results. Any consensus earnings estimates are calculated based on the earnings projections made by analysts who cover that company. The analysts’ opinions, estimates or forecasts (and therefore the consensus earnings estimates) are theirs alone, are not those of PNC or its management, and may not reflect PNC’s or other company’s actual or anticipated results. 17
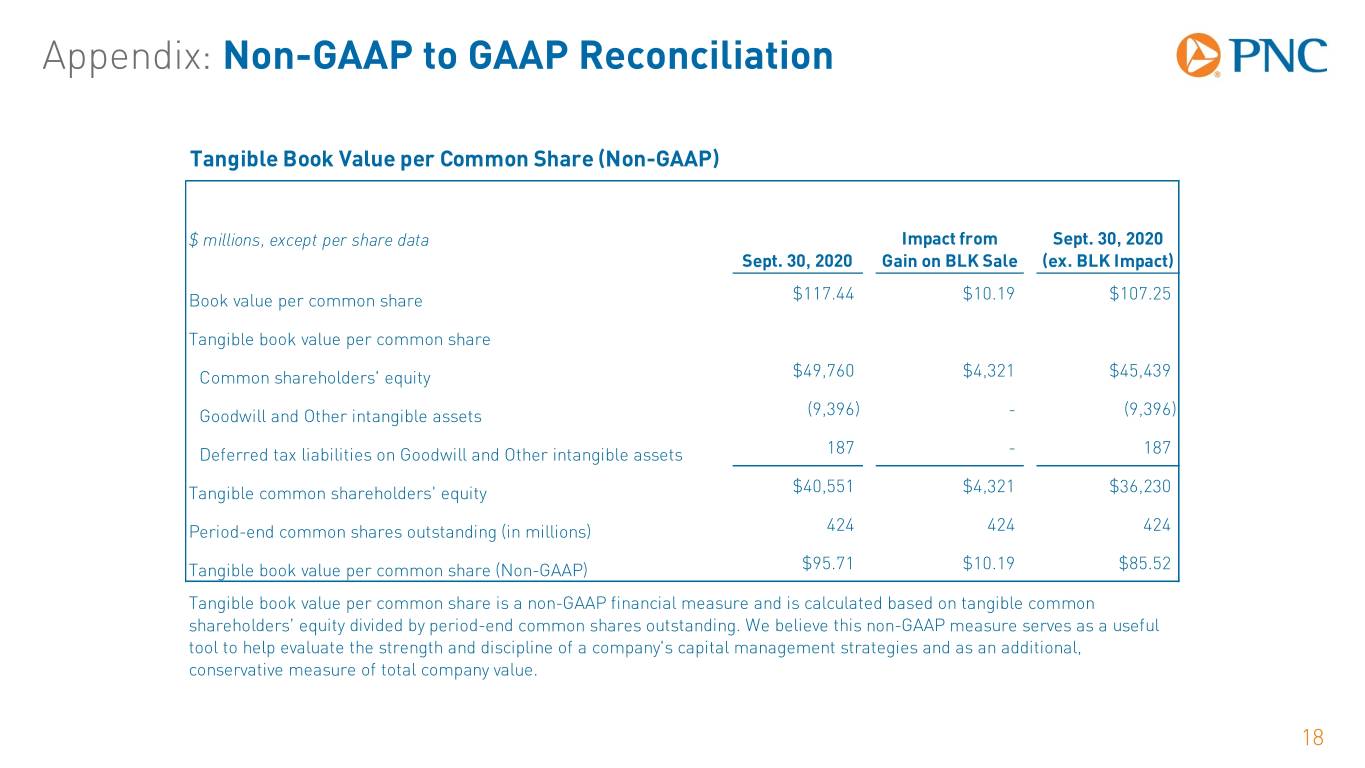
Appendix: Non-GAAP to GAAP Reconciliation Tangible Book Value per Common Share (Non-GAAP) $ millions, except per share data Impact from Sept. 30, 2020 Sept. 30, 2020 Gain on BLK Sale (ex. BLK Impact) Book value per common share $117.44 $10.19 $107.25 Tangible book value per common share Common shareholders' equity $49,760 $4,321 $45,439 Goodwill and Other intangible assets (9,396) - (9,396) Deferred tax liabilities on Goodwill and Other intangible assets 187 - 187 Tangible common shareholders' equity $40,551 $4,321 $36,230 Period-end common shares outstanding (in millions) 424 424 424 Tangible book value per common share (Non-GAAP) $95.71 $10.19 $85.52 Tangible book value per common share is a non-GAAP financial measure and is calculated based on tangible common shareholders’ equity divided by period-end common shares outstanding. We believe this non-GAAP measure serves as a useful tool to help evaluate the strength and discipline of a company's capital management strategies and as an additional, conservative measure of total company value. 18
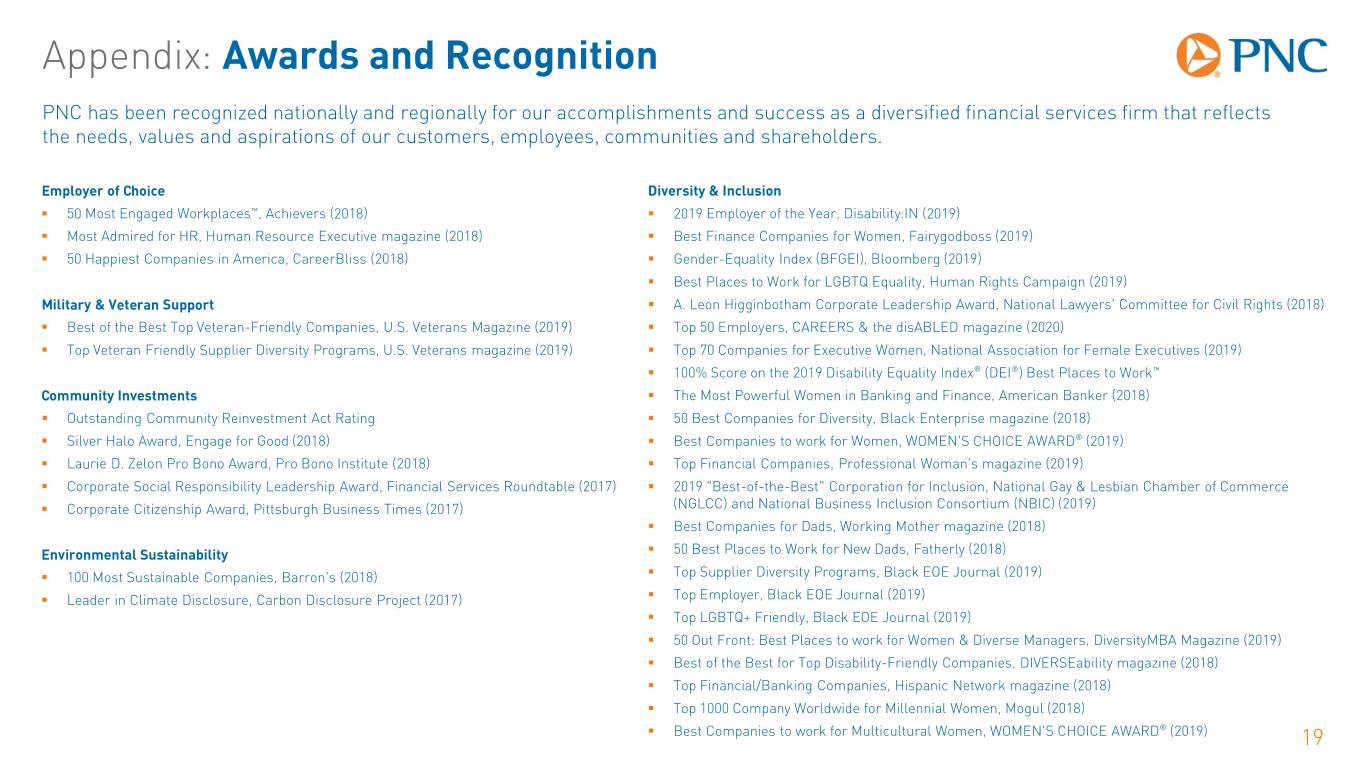
Appendix: Awards and Recognition PNC has been recognized nationally and regionally for our accomplishments and success as a diversified financial services firm that reflects the needs, values and aspirations of our customers, employees, communities and shareholders. Employer of Choice Diversity & Inclusion . 50 Most Engaged Workplaces™, Achievers (2018) . 2019 Employer of the Year, Disability:IN (2019) . Most Admired for HR, Human Resource Executive magazine (2018) . Best Finance Companies for Women, Fairygodboss (2019) . 50 Happiest Companies in America, CareerBliss (2018) . Gender-Equality Index (BFGEI), Bloomberg (2019) . Best Places to Work for LGBTQ Equality, Human Rights Campaign (2019) Military & Veteran Support . A. Leon Higginbotham Corporate Leadership Award, National Lawyers' Committee for Civil Rights (2018) . Best of the Best Top Veteran-Friendly Companies, U.S. Veterans Magazine (2019) . Top 50 Employers, CAREERS & the disABLED magazine (2020) . Top Veteran Friendly Supplier Diversity Programs, U.S. Veterans magazine (2019) . Top 70 Companies for Executive Women, National Association for Female Executives (2019) . 100% Score on the 2019 Disability Equality Index® (DEI®) Best Places to Work™ Community Investments . The Most Powerful Women in Banking and Finance, American Banker (2018) . Outstanding Community Reinvestment Act Rating . 50 Best Companies for Diversity, Black Enterprise magazine (2018) . Silver Halo Award, Engage for Good (2018) . Best Companies to work for Women, WOMEN'S CHOICE AWARD® (2019) . Laurie D. Zelon Pro Bono Award, Pro Bono Institute (2018) . Top Financial Companies, Professional Woman’s magazine (2019) . Corporate Social Responsibility Leadership Award, Financial Services Roundtable (2017) . 2019 "Best-of-the-Best" Corporation for Inclusion, National Gay & Lesbian Chamber of Commerce . Corporate Citizenship Award, Pittsburgh Business Times (2017) (NGLCC) and National Business Inclusion Consortium (NBIC) (2019) . Best Companies for Dads, Working Mother magazine (2018) Environmental Sustainability . 50 Best Places to Work for New Dads, Fatherly (2018) . 100 Most Sustainable Companies, Barron’s (2018) . Top Supplier Diversity Programs, Black EOE Journal (2019) . Leader in Climate Disclosure, Carbon Disclosure Project (2017) . Top Employer, Black EOE Journal (2019) . Top LGBTQ+ Friendly, Black EOE Journal (2019) . 50 Out Front: Best Places to work for Women & Diverse Managers, DiversityMBA Magazine (2019) . Best of the Best for Top Disability-Friendly Companies, DIVERSEability magazine (2018) . Top Financial/Banking Companies, Hispanic Network magazine (2018) . Top 1000 Company Worldwide for Millennial Women, Mogul (2018) . Best Companies to work for Multicultural Women, WOMEN'S CHOICE AWARD® (2019) 19