EXHIBIT 99.1
Published on November 8, 2018
Exhibit 99.1 BancAnalysts Association of Boston Conference November 8, 2018 The PNC Financial Services Group
Cautionary Statement Regarding Forward-Looking and Non-GAAP Financial Information This presentation is not intended as a full business or financial review and should be viewed in the context of all of the information made available by PNC in its SEC filings and on its corporate website. The presentation contains forward-looking statements regarding our outlook for earnings, revenues, expenses, tax rates, capital and liquidity levels and ratios, asset levels, asset quality, financial position, and other matters regarding or affecting PNC and its future business and operations. Forward-looking statements are necessarily subject to numerous assumptions, risks and uncertainties, which change over time. The forward-looking statements in this presentation are qualified by the factors affecting forward-looking statements identified in the more detailed Cautionary Statement included in the Appendix. We provide greater detail regarding these as well as other factors in our 2017 Form 10-K and our 2018 Form 10-Qs, and in our subsequent SEC filings. Our forward-looking statements may also be subject to other risks and uncertainties, including those we may discuss in this presentation or in our SEC filings. Future events or circumstances may change our outlook and may also affect the nature of the assumptions, risks and uncertainties to which our forward-looking statements are subject. Forward-looking statements in this presentation speak only as of the date of this presentation. We do not assume any duty and do not undertake to update those statements. Actual results or future events could differ, possibly materially, from those anticipated in forward-looking statements, as well as from historical performance. We include non-GAAP financial information in this presentation. Non-GAAP financial information includes financial metrics such as fee income, tangible book value, pretax, pre-provision earnings and return on tangible common equity. Reconciliations for such financial information may be found in our presentation, in these slides, including the Appendix, in other materials on our corporate website, and in our SEC filings. This information supplements our results as reported in accordance with GAAP and should not be viewed in isolation from, or as a substitute for, our GAAP results. We believe that this information and the related reconciliations may be useful to investors, analysts, regulators and others to help understand and evaluate our financial results, and with respect to adjusted metrics, because we believe they better reflect the ongoing financial results and trends of our businesses and increase comparability of period-to- period results. We may also use annualized, pro forma, estimated or third party numbers for illustrative or comparative purposes only. These may not reflect actual results. References to our corporate website are to www.pnc.com under “About Us – Investor Relations.” Our SEC filings are available both on our corporate website and on the SEC’s website at www.sec.gov. We include web addresses here as inactive textual references only. Information on these websites is not part of this presentation. 2
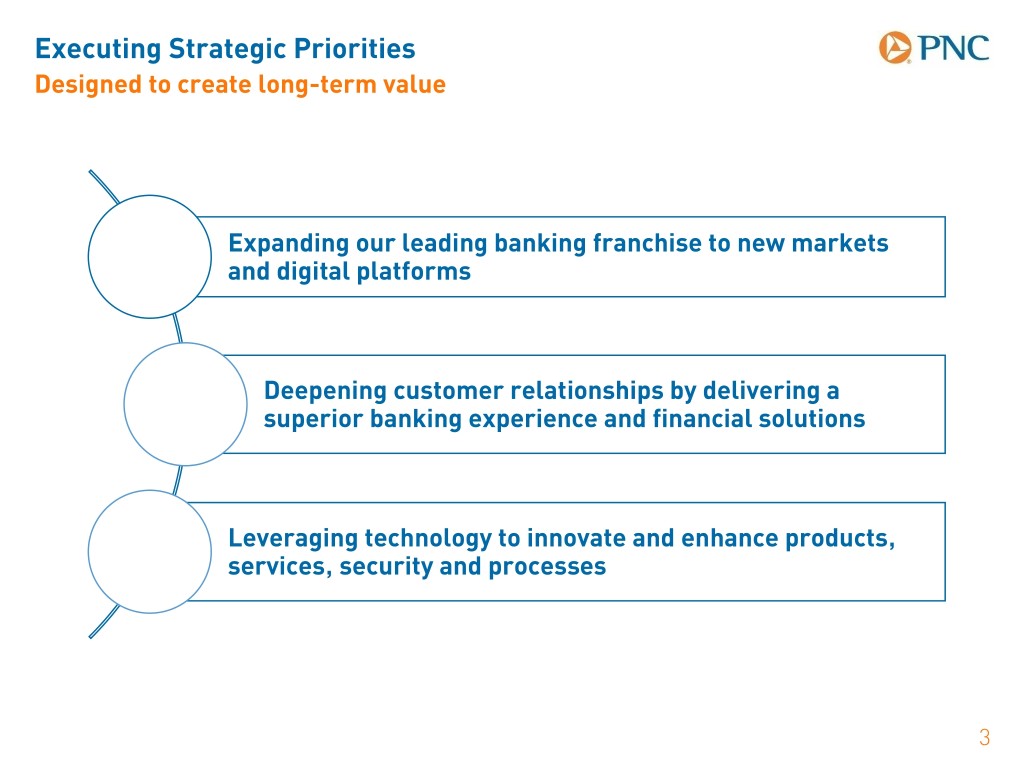
Executing Strategic Priorities Designed to create long-term value Expanding our leading banking franchise to new markets and digital platforms Deepening customer relationships by delivering a superior banking experience and financial solutions Leveraging technology to innovate and enhance products, services, security and processes 3
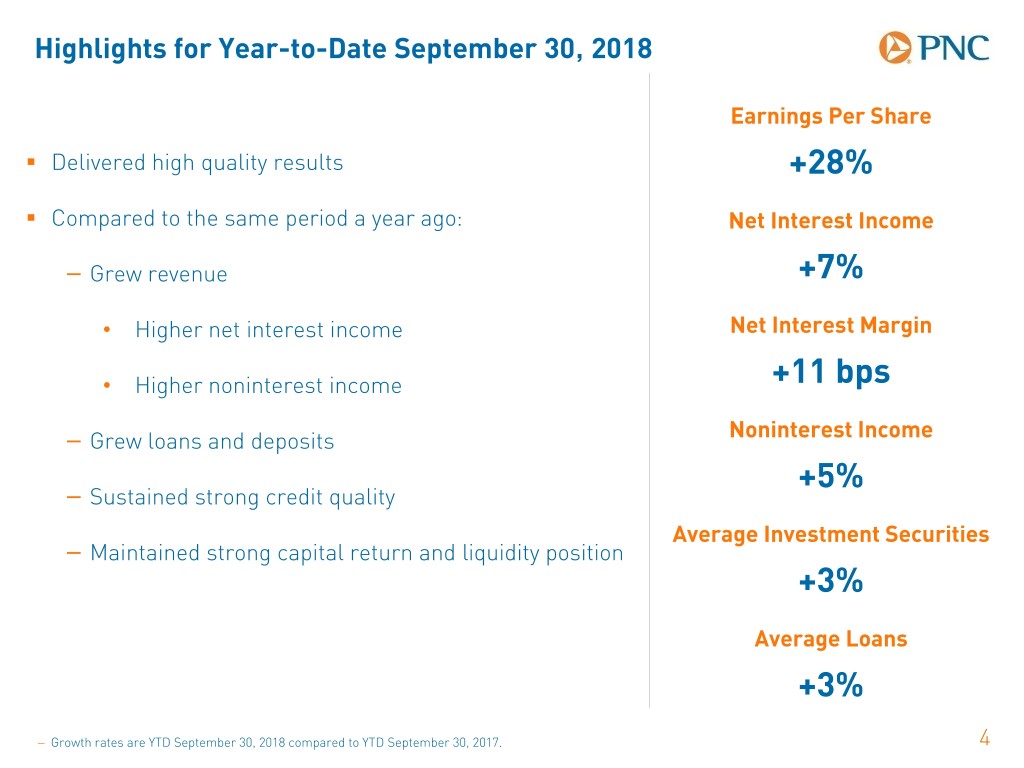
Highlights for Year-to-Date September 30, 2018 Earnings Per Share . Delivered high quality results +28% . Compared to the same period a year ago: Net Interest Income − Grew revenue +7% • Higher net interest income Net Interest Margin • Higher noninterest income +11 bps Noninterest Income − Grew loans and deposits +5% − Sustained strong credit quality Average Investment Securities − Maintained strong capital return and liquidity position +3% Average Loans +3% − Growth rates are YTD September 30, 2018 compared to YTD September 30, 2017. 4
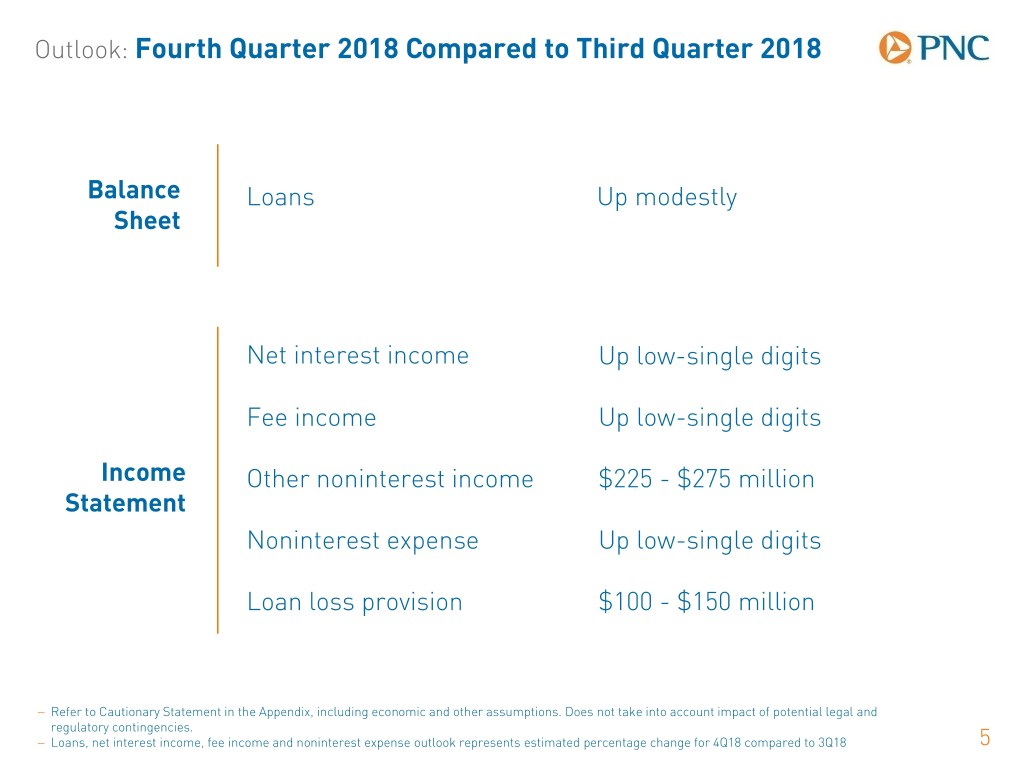
Outlook: Fourth Quarter 2018 Compared to Third Quarter 2018 Balance Loans Up modestly Sheet Net interest income Up low-single digits Fee income Up low-single digits Income Other noninterest income $225 - $275 million Statement Noninterest expense Up low-single digits Loan loss provision $100 - $150 million − Refer to Cautionary Statement in the Appendix, including economic and other assumptions. Does not take into account impact of potential legal and regulatory contingencies. − Loans, net interest income, fee income and noninterest expense outlook represents estimated percentage change for 4Q18 compared to 3Q18 5
National Retail Digital Strategy Kevin McCann The PNC Financial Services Group
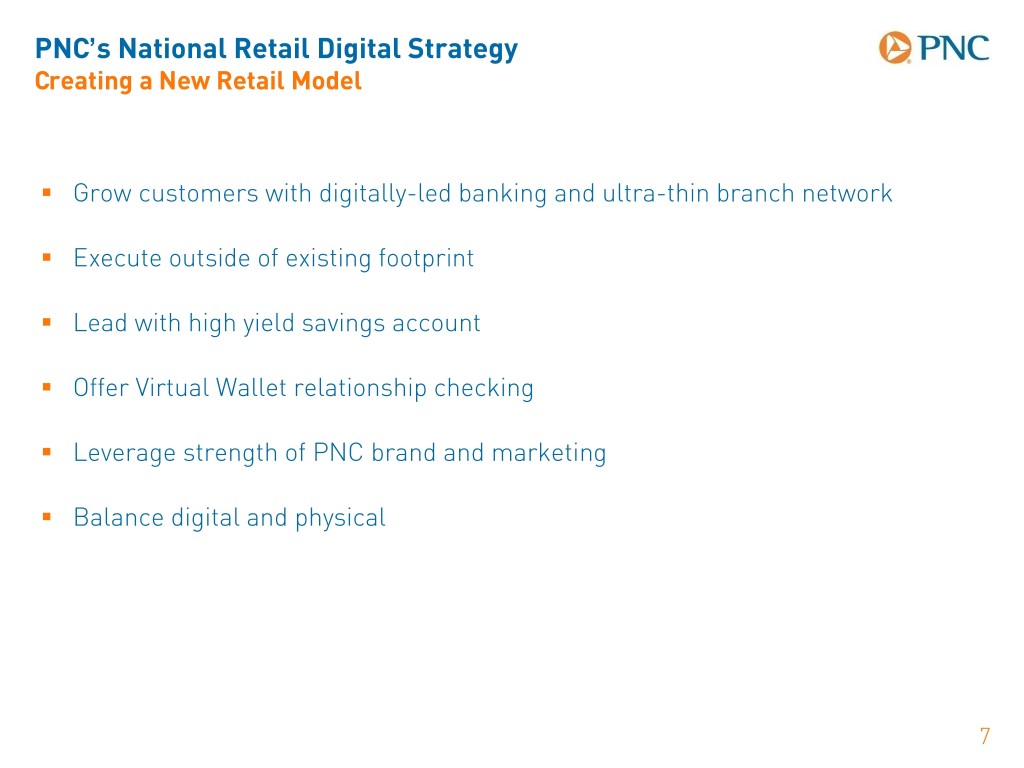
PNC’s National Retail Digital Strategy Creating a New Retail Model . Grow customers with digitally-led banking and ultra-thin branch network . Execute outside of existing footprint . Lead with high yield savings account . Offer Virtual Wallet relationship checking . Leverage strength of PNC brand and marketing . Balance digital and physical 7
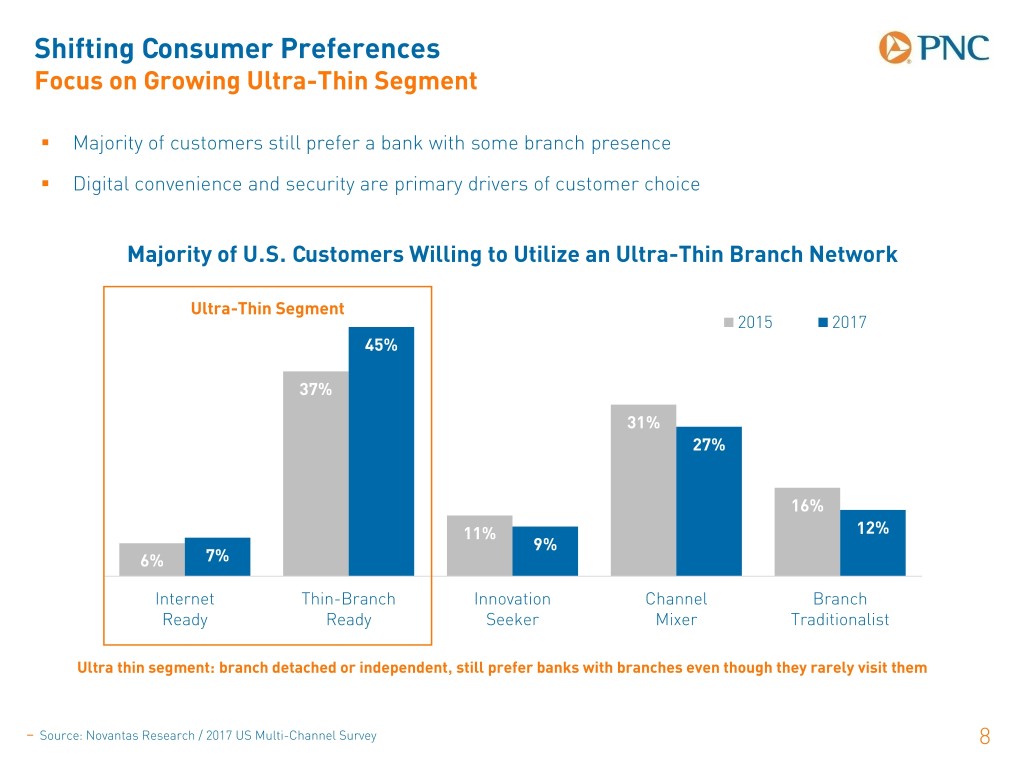
Shifting Consumer Preferences Focus on Growing Ultra-Thin Segment . Majority of customers still prefer a bank with some branch presence . Digital convenience and security are primary drivers of customer choice Majority of U.S. Customers Willing to Utilize an Ultra-Thin Branch Network Ultra-Thin Segment 2015 2017 45% 37% 31% 27% 16% 11% 12% 9% 6% 7% Internet Thin-Branch Innovation Channel Branch Ready Ready Seeker Mixer Traditionalist Ultra thin segment: branch detached or independent, still prefer banks with branches even though they rarely visit them − Source: Novantas Research / 2017 US Multi-Channel Survey 8
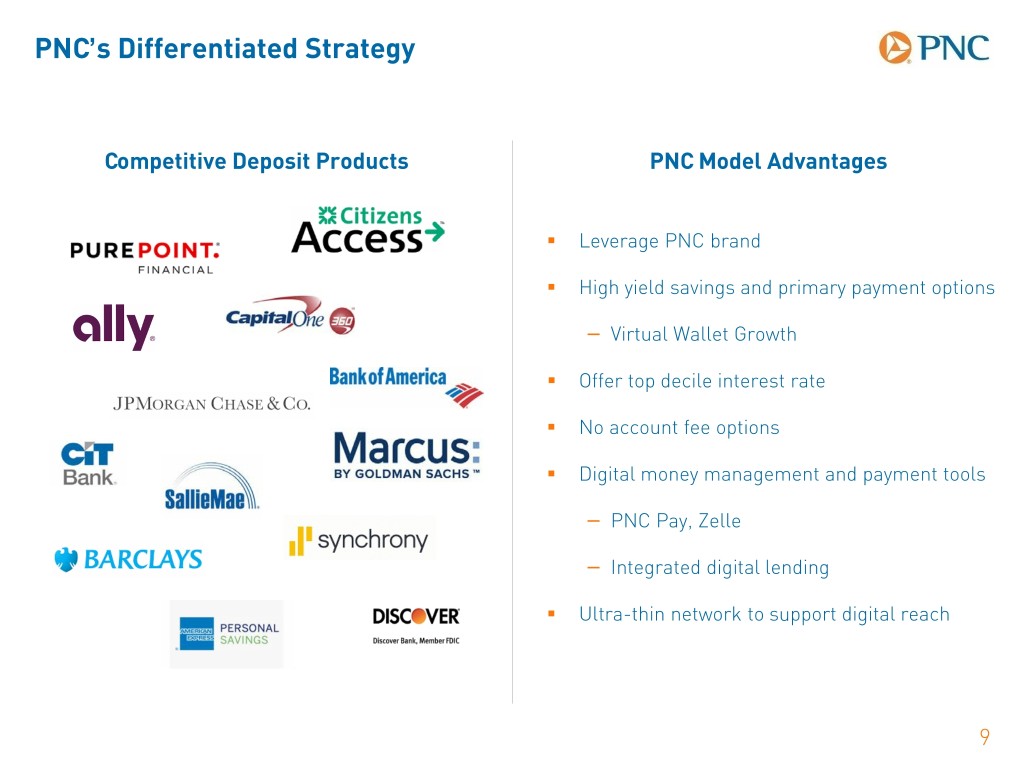
PNC’s Differentiated Strategy Competitive Deposit Products PNC Model Advantages . Leverage PNC brand . High yield savings and primary payment options − Virtual Wallet Growth . Offer top decile interest rate . No account fee options . Digital money management and payment tools − PNC Pay, Zelle − Integrated digital lending . Ultra-thin network to support digital reach 9
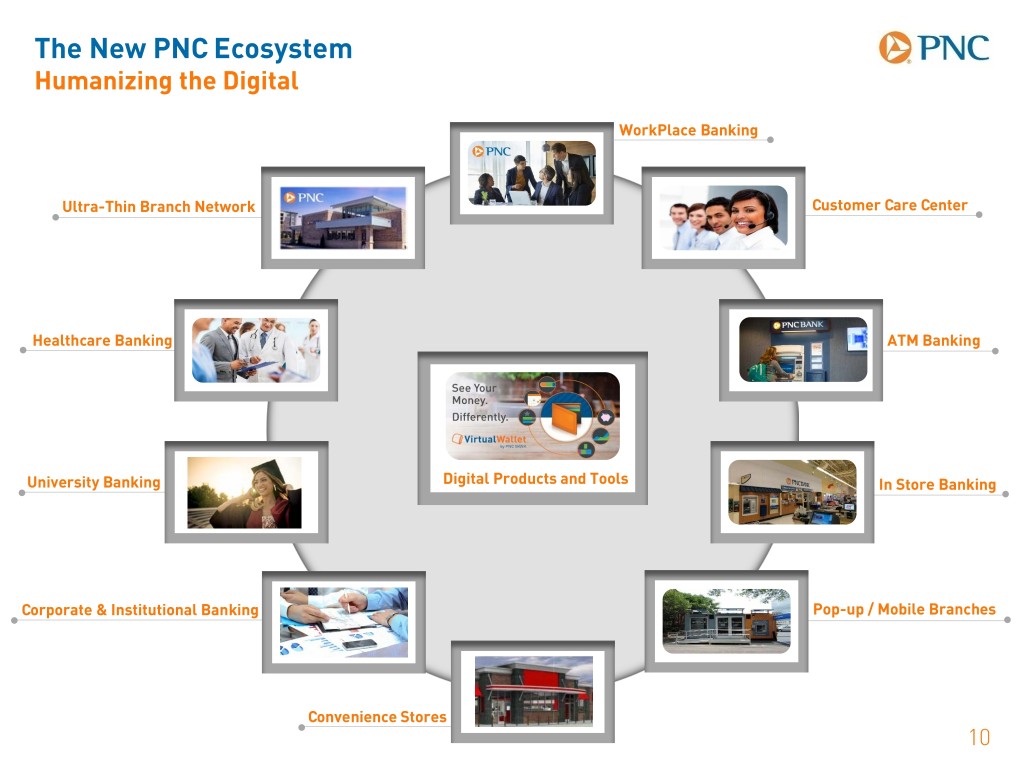
The New PNC Ecosystem Humanizing the Digital WorkPlace Banking Ultra-Thin Branch Network Customer Care Center Healthcare Banking ATM Banking University Banking Digital Products and Tools In Store Banking Corporate & Institutional Banking Pop-up / Mobile Branches Convenience Stores 10
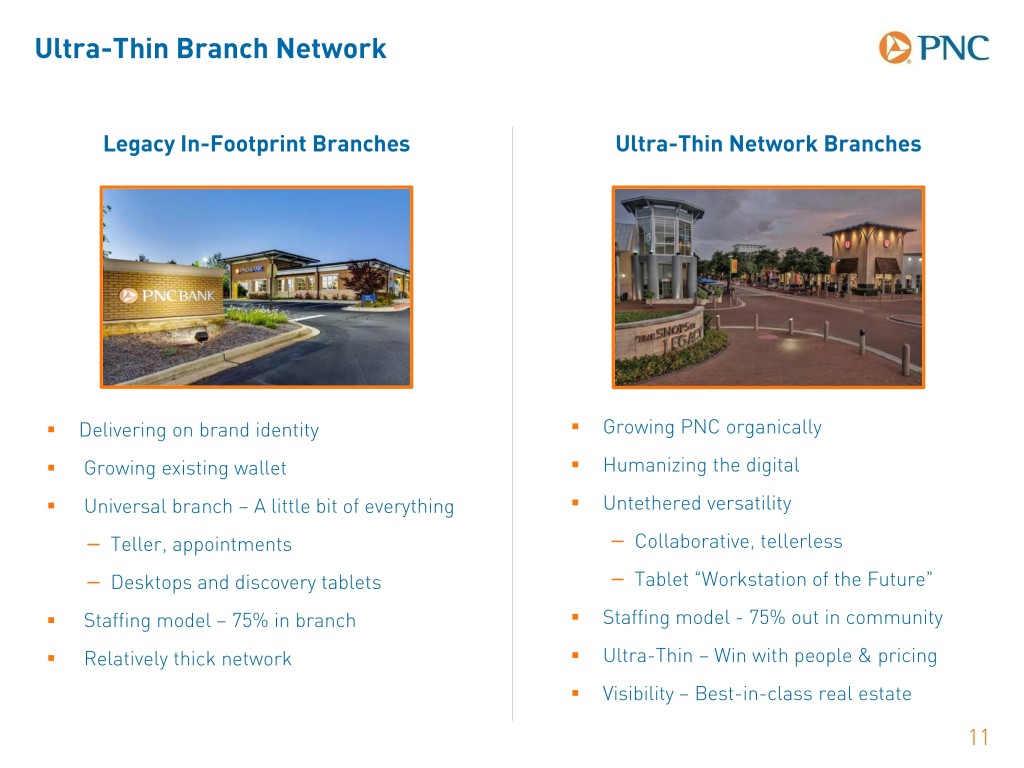
Ultra-Thin Branch Network Legacy In-Footprint Branches Ultra-Thin Network Branches . Delivering on brand identity . Growing PNC organically . Growing existing wallet . Humanizing the digital . Universal branch – A little bit of everything . Untethered versatility − Teller, appointments − Collaborative, tellerless − Desktops and discovery tablets − Tablet “Workstation of the Future” . Staffing model – 75% in branch . Staffing model - 75% out in community . Relatively thick network . Ultra-Thin – Win with people & pricing . Visibility – Best-in-class real estate 11
PNC’s National Retail Digital Strategy Progress to Date; Rapid Test and Learn . Launched high yield savings in select national markets, including Virtual Wallet growth rates . Kicked off marketing campaign in October − National paid search − Targeted marketing in Kansas City and Dallas . Opened Kansas City solution center October 9 − Dallas solution center to open in 2019 − Leveraging C&IB middle market expansion cities . National Retail Digital Strategy early learnings 12
Appendix: Cautionary Statement Regarding Forward-Looking Information This presentation includes “snapshot” information about PNC used by way of illustration and is not intended as a full business or financial review. It should not be viewed in isolation but rather in the context of all of the information made available by PNC in its SEC filings. We also make statements in this presentation, and we may from time to time make other statements, regarding our outlook for earnings, revenues, expenses, tax rates, capital and liquidity levels and ratios, asset levels, asset quality, financial position, and other matters regarding or affecting PNC and its future business and operations that are forward-looking statements within the meaning of the Private Securities Litigation Reform Act. Forward- looking statements are typically identified by words such as “believe,” “plan,” “expect,” “anticipate,” “see,” “look,” “intend,” “outlook,” “project,” “forecast,” “estimate,” “goal,” “will,” “should” and other similar words and expressions. Forward-looking statements are subject to numerous assumptions, risks and uncertainties, which change over time. Forward-looking statements speak only as of the date made. We do not assume any duty to update forward-looking statements. Actual results or future events could differ, possibly materially, from those anticipated in forward-looking statements, as well as from historical performance. Our forward-looking statements are subject to the following principal risks and uncertainties. . Our businesses, financial results and balance sheet values are affected by business and economic conditions, including the following: − Changes in interest rates and valuations in debt, equity and other financial markets. − Disruptions in the U.S. and global financial markets. − Actions by the Federal Reserve Board, U.S. Treasury and other government agencies, including those that impact money supply and market interest rates. − Changes in customer behavior due to recently enacted tax legislation, changing business and economic conditions or legislative or regulatory initiatives. − Changes in customers’, suppliers’ and other counterparties’ performance and creditworthiness. − Impacts of tariffs and other trade policies of the U.S. and its global trading partners. − Slowing or reversal of the current U.S. economic expansion. − Commodity price volatility. 13
Appendix: Cautionary Statement Regarding Forward-Looking Information . Our forward-looking financial statements are subject to the risk that economic and financial market conditions will be substantially different than those we are currently expecting and do not take into account potential legal and regulatory contingencies. These statements are based on our view that U.S. economic growth has accelerated over the past two years and will remain above its long-run trend for the remainder of 2018 and into 2019, in light of stimulus from corporate and personal income tax cuts passed in late 2017 that are expected to support business investment and consumer spending, respectively. We expect an increase in federal government spending will also support economic growth for the remainder of 2018 and into 2019. Further gradual improvement in the labor market this year and next, including job gains and rising wages, is another positive for consumer spending. Trade restrictions are a growing downside risk to the forecast. Inflation has accelerated to close to the Federal Open Market Committee’s 2 percent objective. Short-term interest rates and bond yields are expected to rise throughout the remainder of 2018 and into 2019; after the Federal Open Market Committee raised the federal funds rate in September, our baseline forecast is for one additional rate hike in December 2018, pushing the rate to a range of 2.25 to 2.50 percent by the end of the year. PNC expects two 25 basis point increases in the fed funds rate in 2019 (in June and September); this would take the fed funds rate to a range of 2.75 to 3.00 percent by the end of next year. . PNC’s ability to take certain capital actions, including returning capital to shareholders, is subject to review by the Federal Reserve Board as part of PNC’s comprehensive capital plan for the applicable period in connection with the Federal Reserve Board’s Comprehensive Capital Analysis and Review (CCAR) process and to the acceptance of such capital plan and non-objection to such capital actions by the Federal Reserve Board. . PNC’s regulatory capital ratios in the future will depend on, among other things, the company’s financial performance, the scope and terms of final capital regulations then in effect (particularly those implementing the international regulatory capital framework developed by the Basel Committee on Banking Supervision (Basel Committee)), and management actions affecting the composition of PNC’s balance sheet. In addition, PNC’s ability to determine, evaluate and forecast regulatory capital ratios, and to take actions (such as capital distributions) based on actual or forecasted capital ratios, will be dependent at least in part on the development, validation and regulatory approval of related models. . Legal and regulatory developments could have an impact on our ability to operate our businesses, financial condition, results of operations, competitive position, reputation, or pursuit of attractive acquisition opportunities. Reputational impacts could affect matters such as business generation and retention, liquidity, funding, and ability to attract and retain management. These developments could include: − Changes to regulations governing bank capital and liquidity standards. − Unfavorable resolution of legal proceedings or other claims and regulatory and other governmental investigations or other inquiries. These matters may result in monetary judgments or settlements or other remedies, including fines, penalties, restitution or alterations in our business practices, and in additional expenses and collateral costs, and may cause reputational harm to PNC. − Results of the regulatory examination and supervision process, including our failure to satisfy requirements of agreements with governmental agencies. − Impact on business and operating results of any costs associated with obtaining rights in intellectual property claimed by others and of adequacy of our intellectual property protection in general. 14
Appendix: Cautionary Statement Regarding Forward-Looking Information . Business and operating results are affected by our ability to identify and effectively manage risks inherent in our businesses, including, where appropriate, through effective use of systems and controls, third-party insurance, derivatives, and capital management techniques, and to meet evolving regulatory capital and liquidity standards. . Business and operating results also include impacts relating to our equity interest in BlackRock, Inc. and rely to a significant extent on information provided to us by BlackRock. Risks and uncertainties that could affect BlackRock are discussed in more detail by BlackRock in its SEC filings. . We grow our business in part through acquisitions and new strategic initiatives. Risks and uncertainties include those presented by the nature of the business acquired and strategic initiative, including in some cases those associated with our entry into new businesses or new geographic or other markets and risks resulting from our inexperience in those new areas, as well as risks and uncertainties related to the acquisition transactions themselves, regulatory issues, and the integration of the acquired businesses into PNC after closing. . Competition can have an impact on customer acquisition, growth and retention and on credit spreads and product pricing, which can affect market share, deposits and revenues. Our ability to anticipate and respond to technological changes can also impact our ability to respond to customer needs and meet competitive demands. . Business and operating results can also be affected by widespread natural and other disasters, pandemics, dislocations, terrorist activities, system failures, security breaches, cyberattacks or international hostilities through impacts on the economy and financial markets generally or on us or our counterparties specifically. We provide greater detail regarding these as well as other factors in our 2017 Form 10-K and our 2018 Form 10-Qs, including in the Risk Factors and Risk Management sections and the Legal Proceedings and Commitments Notes of the Notes To Consolidated Financial Statements in those reports, and in our subsequent SEC filings. Our forward-looking statements may also be subject to other risks and uncertainties, including those we may discuss elsewhere in this presentation or in our SEC filings, accessible on the SEC’s website at www.sec.gov and on our corporate website at www.pnc.com/secfilings. We have included these web addresses as inactive textual references only. Information on these websites is not part of this document. Any annualized, pro forma, estimated, third party or consensus numbers in this presentation are used for illustrative or comparative purposes only and may not reflect actual results. Any consensus earnings estimates are calculated based on the earnings projections made by analysts who cover that company. The analysts’ opinions, estimates or forecasts (and therefore the consensus earnings estimates) are theirs alone, are not those of PNC or its management, and may not reflect PNC’s or other company’s actual or anticipated results. 15
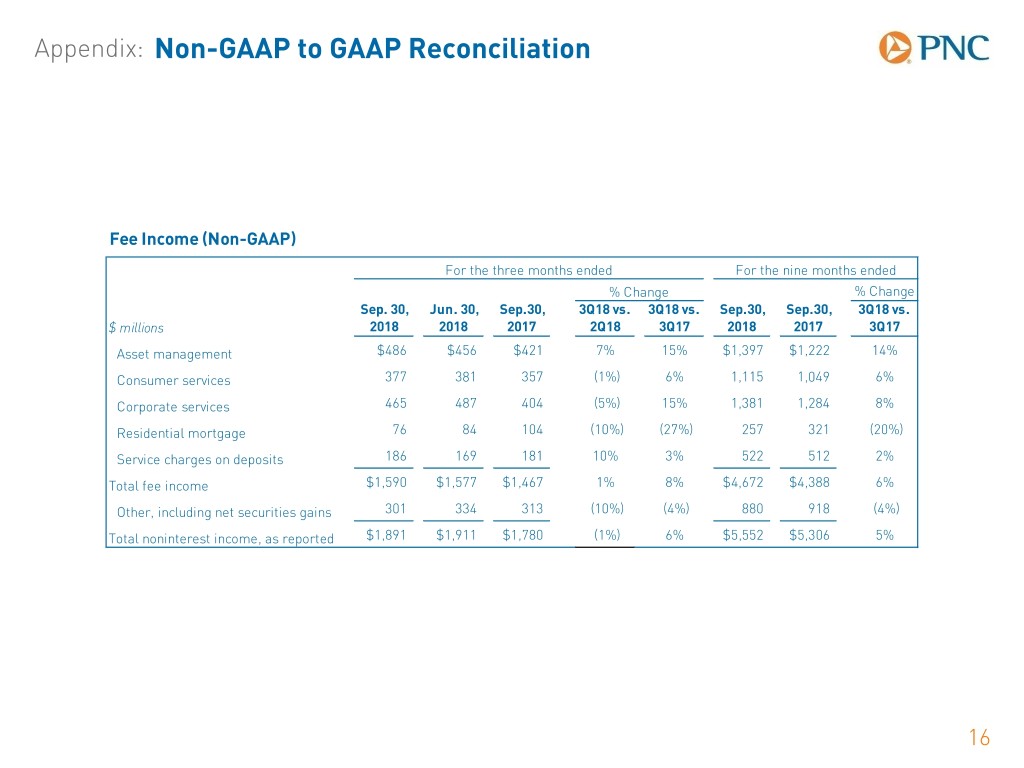
Appendix: Non-GAAP to GAAP Reconciliation Fee Income (Non-GAAP) For the three months ended For the nine months ended % Change % Change Sep. 30, Jun. 30, Sep.30, 3Q18 vs. 3Q18 vs. Sep.30, Sep.30, 3Q18 vs. $ millions 2018 2018 2017 2Q18 3Q17 2018 2017 3Q17 Asset management $486 $456 $421 7% 15% $1,397 $1,222 14% Consumer services 377 381 357 (1%) 6% 1,115 1,049 6% Corporate services 465 487 404 (5%) 15% 1,381 1,284 8% Residential mortgage 76 84 104 (10%) (27%) 257 321 (20%) Service charges on deposits 186 169 181 10% 3% 522 512 2% Total fee income $1,590 $1,577 $1,467 1% 8% $4,672 $4,388 6% Other, including net securities gains 301 334 313 (10%) (4%) 880 918 (4%) Total noninterest income, as reported $1,891 $1,911 $1,780 (1%) 6% $5,552 $5,306 5% 16