FWP: Filing under Securities Act Rules 163/433 of free writing prospectuses
Published on September 16, 2009

The PNC Financial
Services Group, Inc. Barclays Capital Global Financial Services Conference September 15, 2009 Pursuant to Rule 433 Registration Nos. 333-139912 333-139912-01 September 16, 2009 |

2 PNC Funding Corp and The PNC Financial Services Group, Inc. have filed a registration statement (including a prospectus and preliminary prospectus supplement) with the SEC for the offering to which this communication relates. Before you invest, you should read each of these documents and the other documents filed with the SEC and incorporated by reference in such documents for more complete information about PNC Funding Corp, The PNC Financial Services Group, Inc. and this offering. You may get these documents for free by visiting EDGAR on the SEC Web site at www.sec.gov. Alternatively, you may obtain a copy of these documents by calling Goldman, Sachs & Co. collect at 1- 866-471-2526 or J.P. Morgan Securities Inc. collect at 1-212-834-4533 |

3 Cautionary Statement Regarding Forward-Looking Information and Adjusted Information This presentation includes snapshot information about PNC used by way
of illustration. It is not intended as a full business or financial review and should be viewed in the context of all of the information made available by PNC
in its SEC filings. The presentation also contains forward-looking statements regarding our outlook or expectations relating to PNCs future
business, operations, financial condition, financial performance, capital and liquidity levels, and asset quality. Forward-looking statements are
necessarily subject to numerous assumptions, risks and uncertainties, which change over time. The forward-looking statements in this presentation are qualified by the
factors affecting forward-looking statements identified in the more detailed Cautionary Statement included in the Appendix, which is included in the version
of the presentation materials posted on our corporate website at www.pnc.com/investorevents. We provide greater detail regarding some of
these factors in our 2008 Form 10-K and 2009 Form 10-Qs, including in the Risk Factors and Risk Management sections of those reports, and in our other
SEC filings (accessible on the SECs website at www.sec.gov and on or through our corporate website at www.pnc.com/secfilings). We have
included web addresses here and elsewhere in this presentation as inactive textual references only. Information on these websites is not part of this
document. Future events or circumstances may change our outlook or expectations and may
also affect the nature of the assumptions, risks and uncertainties to which our forward-looking statements are subject. The
forward-looking statements in this presentation speak only as of the date of this presentation. We do not assume any duty and do not undertake to update those statements.
In this presentation, we may refer to adjusted results to help illustrate the
impact of certain types of items. This information supplements our results as reported in accordance with GAAP and should not be viewed in isolation from,
or a substitute for, our GAAP results. We believe that this additional information and the reconciliations we provide may be useful to investors,
analysts, regulators and others as they evaluate the impact of these items on our results for the periods presented. In certain discussions, we may also provide information on yields and margins for
all interest-earning assets calculated using net interest income on a taxable-equivalent basis by increasing the interest income earned on
tax-exempt assets to make it fully equivalent to interest income earned on taxable investments. We believe this adjustment may be useful when
comparing yields and margins for all earning assets. This presentation may also include a discussion of other non-GAAP financial
measures, which, to the extent not so qualified therein or in the Appendix, is qualified by GAAP reconciliation information available on our corporate
website at www.pnc.com under About PNCInvestor Relations.
|

4 Key Messages The environment remains challenging but there are positive signs emerging Executing PNCs proven business model is delivering solid results PNC has realistic opportunities for growth |

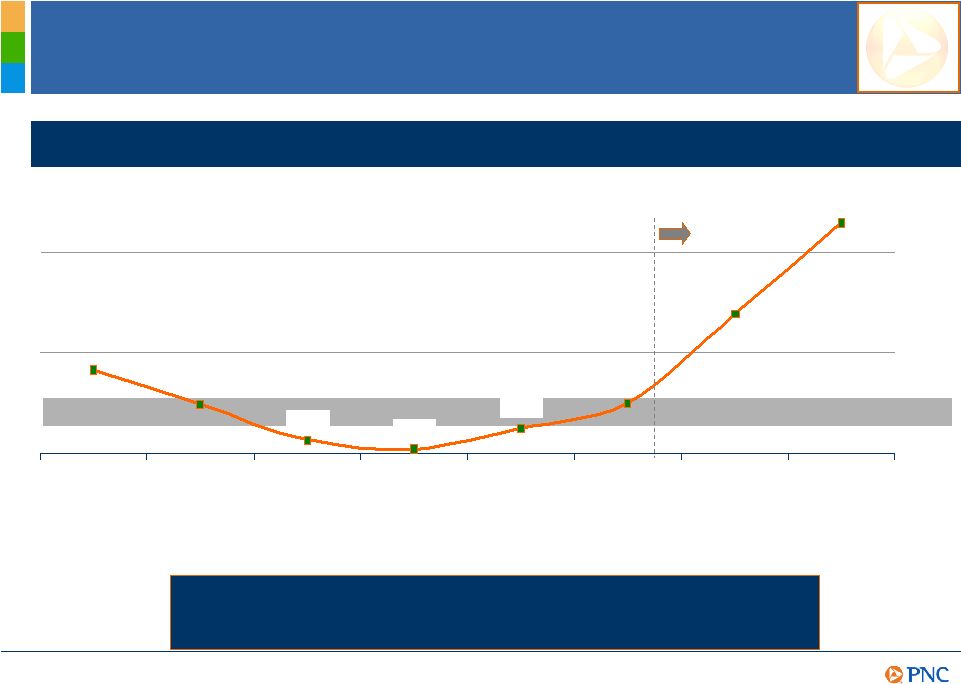
5 Operating Environment Summary Unemployment rate and overall market volatility remain elevated Housing prices appear to be stabilizing Sales of new and existing homes slightly improved Regulatory changes are on the horizon Uncertainty remains but there are reasons to be cautiously optimistic Despite the Environment, PNC Is Focused on Delivering Value. Despite the Environment, PNC Is Focused on Delivering Value. |

6 PNCs Framework for Success Execute on and deliver the PNC business model Capitalize on integration opportunities Emphasize continuous improvement culture Reduce dependence on credit leverage Focus on cross selling PNCs deep product offerings Focus front door on risk- adjusted returns Leverage back door credit liquidation capabilities Maximize credit portfolio value Reposition deposit gathering strategies Action Plans 0.53% $500 million 43% 2.3% 87% PNC - six months ended June 30, 2009 1.30%+ $1.2 billion >50% 0.3%-0.5% 80%-90% Target 0.25% Return on average assets Key Metrics Peers 1 Loan to deposit ratio 100% Provision to average loans (annualized) 3.4% Noninterest income/total revenue 49% Integration cost savings (annualized) N/A Executing our strategies PNC Business Model Staying core funded Returning to a moderate risk profile Growing high quality, diverse revenue streams Creating positive operating leverage (1) Peers represents average of BBT, BAC, COF, CMA, FITB, JPM, KEY, MTB, RF, STI, USB and WFC as of
or for the six months ended. Source: SNL DataSource. Executing Our Business Model |
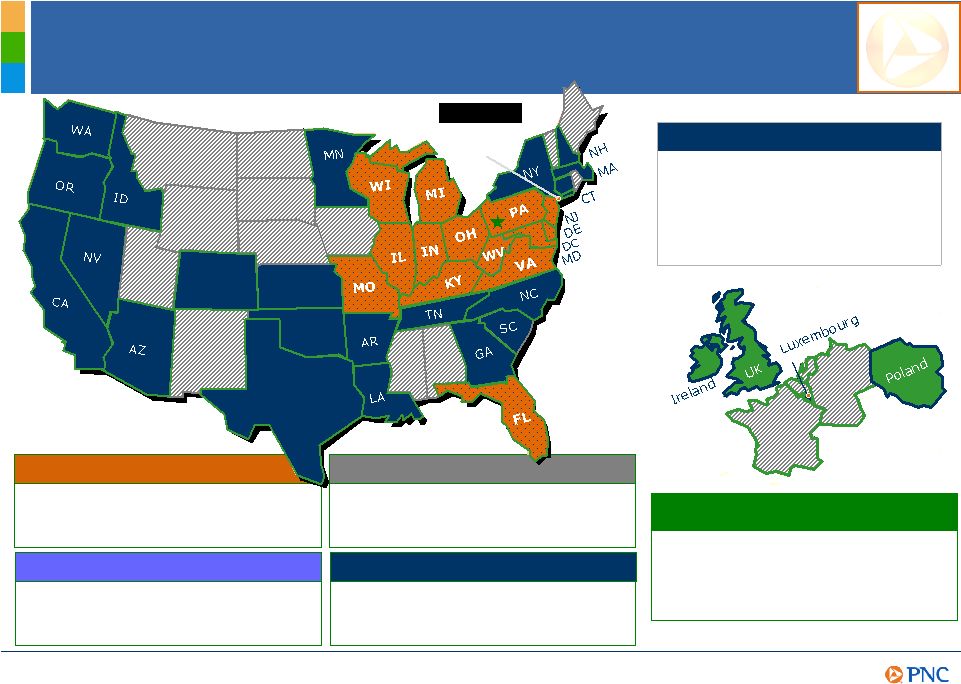
7 Residential Mortgage Footprint covering nearly 1/3 of the U.S. population Retail A Powerful Franchise 5 Largest in the U.S. Based on Deposits (offices in 22 countries) BlackRock CO TX KS OK Global Investment Servicing (international offices) A leading provider of processing, technology and business solutions to the global investment industry Corporate & Institutional A leader in serving middle- market customers and government entities Asset Management One of the largest bank-held asset managers in the U.S. One of the nations largest mortgage platforms 7 th $280 billion Assets U.S. Rank 2Q09 6,474 2,606 $190 billion 5 th ATMs 5 th Branches 5 th Deposits (1) Source: SNL DataSource. Executing Our Business Model th 1 |

8 Building a High Quality, Differentiated Balance Sheet ($11.3) $279.8 Total liabilities and equity ($7.6) $44.7 Borrowed funds (10.4) 7.0 Other time .6 6.7 Savings ($2.4) $190.4 Total deposits (3.2) 17.4 Other (1.9) 56.4 Retail CDs $9.3 $120.3 Transaction deposits 1.9 27.3 Shareholders equity (7.3) 64.8 Other assets (10.5) 165.0 Total loans ($11.3) $279.8 Total assets $50.0 June 30, 2009 $6.5 Change from Dec. 31, 2008 Investment securities Category (billions)
(1) Peers represents average of BBT, BAC, COF, CMA, FITB, JPM, KEY, MTB, RF, STI, USB and
WFC. Source: SNL DataSource. PNC Is Transitioning Our Balance Sheet to Reflect
Our Business PNC Is Transitioning Our Balance Sheet to Reflect Our Business
Model. Model. Executing Our Business Model June 30, 2009 Key Ratios Loans/Assets PNC Peers 59% 63% Loans/Deposits PNC Peers 87% 100% 1 |
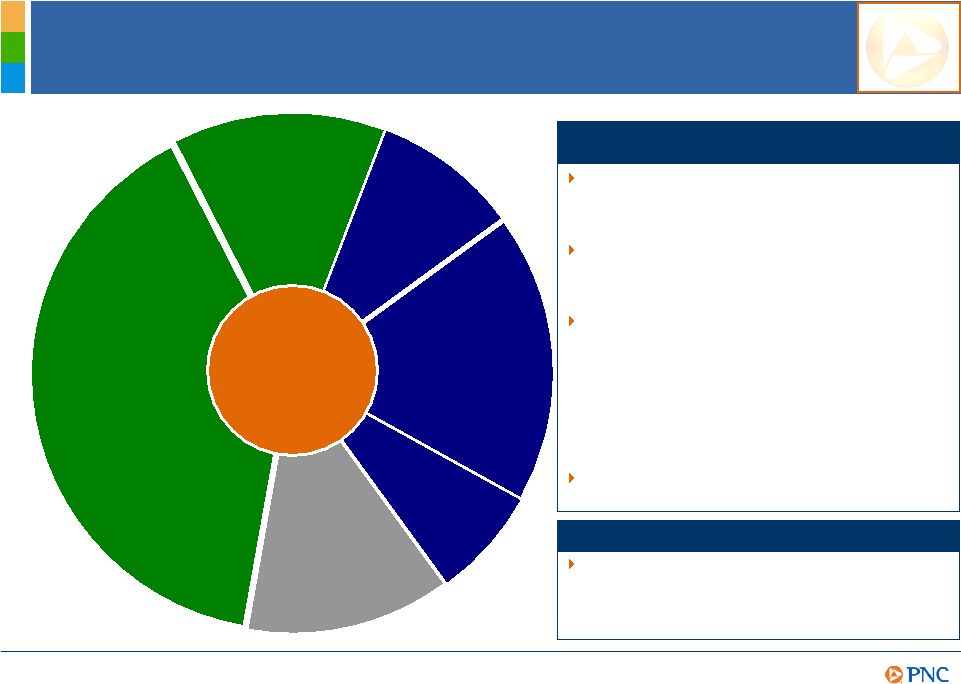
9 Loan Portfolio Commercial and equipment leasing Commercial real estate 2Q09 Total loans $165 billion Home equity Residential real estate Distressed Other consumer 13% 40% 13% 7% 18% 9% Residential real estate is 10% construction and 90% mortgage - Weighted avg: FICO 706, loan to value 75% Home equity portfolio is high quality and performing well - Weighted avg: FICO 728, loan to value 75% Commercial portfolio well-balanced across sectors - <$100 million to U.S. auto makers - <$1 billion to auto suppliers most of which is collateralized - <$2 billion to suppliers in the real estate sector Commercial real estate is 67% project related and 33% mortgage Overall portfolio highlights Executing Our Business Model As of June 30, 2009. (1) Includes commercial, equipment leasing, commercial real estate, home
equity, and residential real estate loans assigned to the Distressed Assets Portfolio
segment totaling approximately $21 billion. Further information regarding the categories of loans in the Distressed Assets Portfolio segment and in the overall loan portfolio is provided in
the Appendix. $21 billion as of June 30, 2009 - 49% residential real estate - 32% brokered home equity - 19% commercial lending Distressed Assets Portfolio 1 |
10 Commercial Real Estate (CRE) Executing Our Business Model +58% CRE NPL change 4Q08 to 1Q09 +37% CRE NPL change 1Q09 to 2Q09 NPLs as a % of type NPLs (millions) CRE type PNC 2Q09 CRE nonperforming loans 6.7% $1,656 Total 2.9% 129 Office 3.9% 58 Industrial/Warehousing 4.2% 174 Multifamily 5.2% 364 Other 5.8% 49 Lodging 7.5% 307 Retail 20.3% $575 Residential development Multifamily Office Other Industrial/ Warehousing Retail Residential development Lodging 17% 18% 28% 6% 17% 11% 30% 20% 16% 14% 13% 13% 13% 11% 9% 9% 9% 3% 3% 3% PNC 2Q09 total CRE loans $24.9B JPM BAC PNC COF FITB WFC BBT USB KEY STI CMA RF MTB PNCs Commercial Real Estate Portfolio Is Granular, Diversified and Manageable. CRE outstanding as a % of assets 1 As of June 30, 2009. Peer source: company reports. (1) Other includes healthcare,
mobile home parks, self storage, golf courses, senior housing, mixed
use properties, special purpose, churches, raw land and other miscellaneous property types.
|
11 Managing Overall Credit Quality Executing Our Business Model Balances as of quarter end. (1) Accruing loans past due do not include loans acquired in the
National City acquisition that were impaired per FASB ASC 310-30 and exclude loans
that are government insured/guaranteed, primarily residential mortgages. Further information is provided in the Appendix. Proactive management Isolated loans of $21 billion, or 13% of total loans at June 30, 2009, into our Distressed Assets Portfolio segment 180+ people dedicated to distressed assets; substantial number of workout strategies in place Leveraging existing best-in-class technology capabilities for collateral management Continuing to reduce open exposure in brokered home equity lines, construction and commercial residential development Nearly 1,500 people dedicated to loss mitigation and loan modifications +36% +78% Change from prior quarter $4.03 $2.96 Nonperforming loans 2Q09 1Q09 (billions) Growth rate in nonperforming loans declined Delinquencies stable to improved from year end Accruing loans past due $.68 $.81 90 days or more $2.19 $2.18 30-89 days 2Q09 4Q08 (billions) 1 |
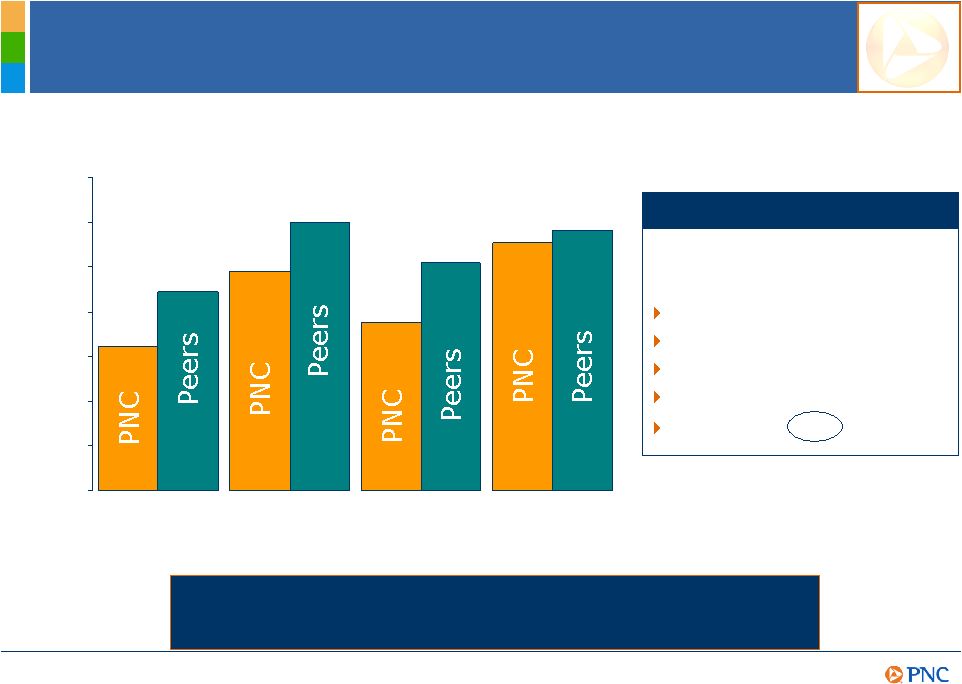
12 Relative Credit Risk Profile 0.00% 0.50% 1.00% 1.50% 2.00% 2.50% 3.00% 3.50% Nonperforming loans to total loans Nonperforming assets to total assets Net charge- offs to average loans Allowance for loan and lease losses to loans 2.44% 2.98% 1.62% 2.22% 1.89% 2.53% 2.77% 2.90% Key 2Q09 metrics PNCs Commitment to Prudent Risk Management Is Reflected in Our Credit Metrics. Reserves plus fair value mark as a % of outstanding : Commercial real estate 11% Commercial 5% Residential real estate 12% Consumer 6% Total loans 7% PNC June 30, 2009 Executing Our Business Model 1 2 Peers represents average of BBT, BAC, COF, CMA, FITB, JPM, KEY, MTB, RF, STI, USB and WFC.
Sources: SNL DataSource, company reports. (1) As of or for the three months ended
June 30, 2009. Net charge-offs percentage is annualized. (2) Further information is provided in the Appendix. |
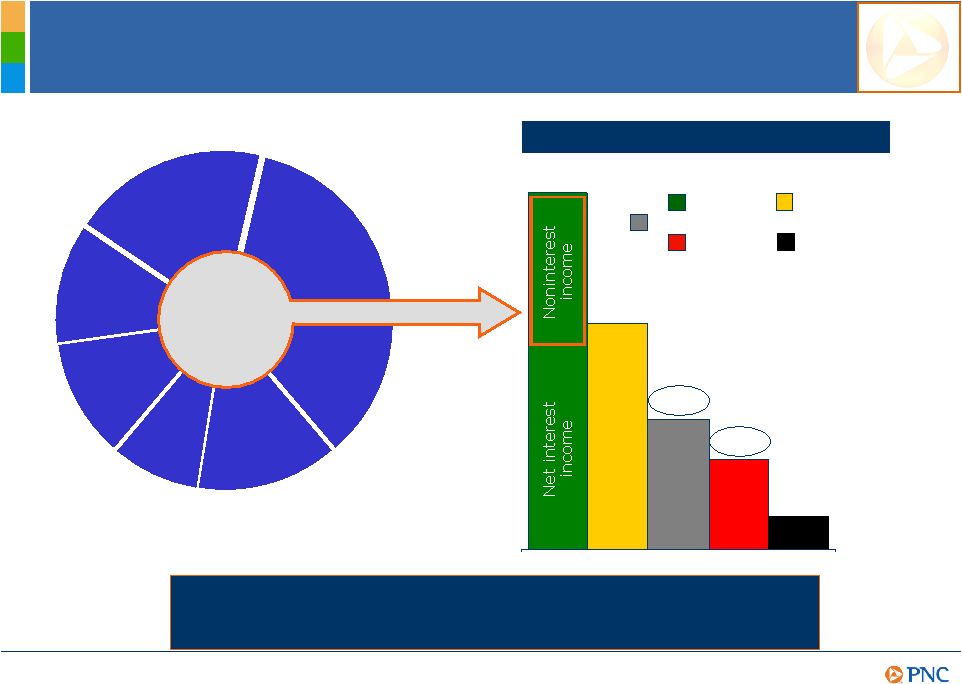
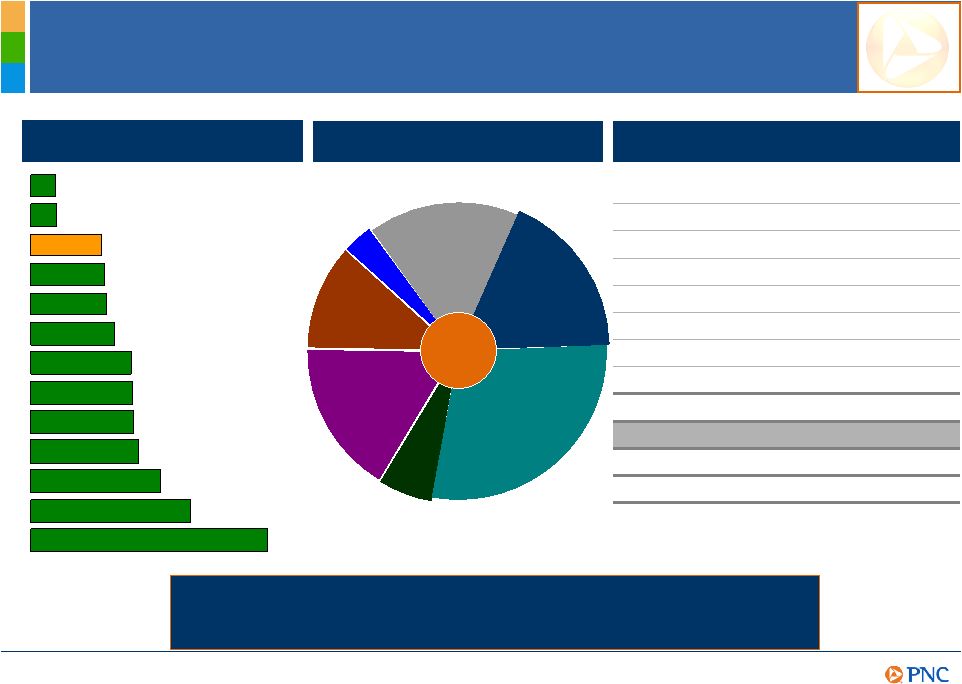
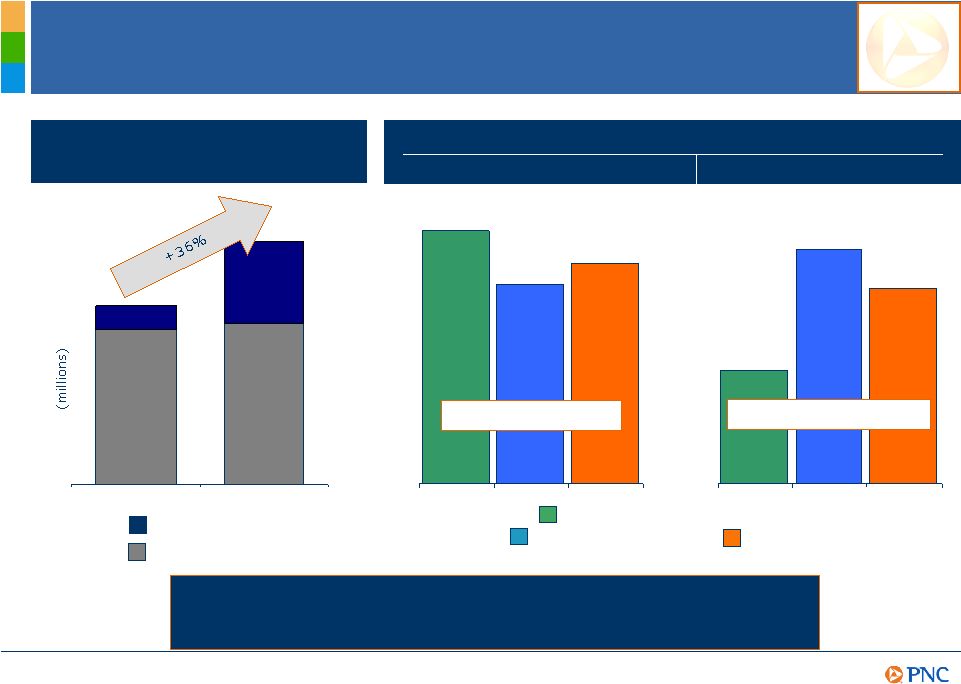
13 Diverse Revenue Streams and Well-Controlled Expenses PNC Is Recognized for Our Ability to Create Positive Operating PNC Is Recognized for Our Ability to Create Positive Operating Leverage in Anticipation of Increased Credit Costs. Leverage in Anticipation of Increased Credit Costs. Fund servicing Asset mgmnt Consumer services Corporate services Residential mortgage Deposit service charges 12% 12% 19% 20% 15% 14% Other 8% $7.9 $5.0 $2.9 $2.0 Six months ended June 30, 2009 43% 1H09 noninterest income $3.4B Executing Our Business Model $.7 Revenue Expense Pretax pre-provision earnings Provision (billions) Net income 1 (1) Total revenue less noninterest expense. Further information is provided in the
Appendix. |
14 Strengthening Capital Ratios 9.7% 4Q08 1Q09 4.8% 4.9% 4Q08 1Q09 Tier 1 common ratio Tier 1 risk-based ratio 5.3% 10.0% 10.5% 2Q09 2Q09 Increased common equity by $1.9 billion from 4Q08 to 2Q09 Stress test-related capital plan accepted by regulators Expect to continue to increase common equity through growth in retained earnings Executing Our Business Model PNC Is Focused on Disciplined Uses of Capital During this PNC Is Focused on Disciplined Uses of Capital During this Challenging Time. Challenging Time. Highlights Ratios and common equity as of quarter end. |
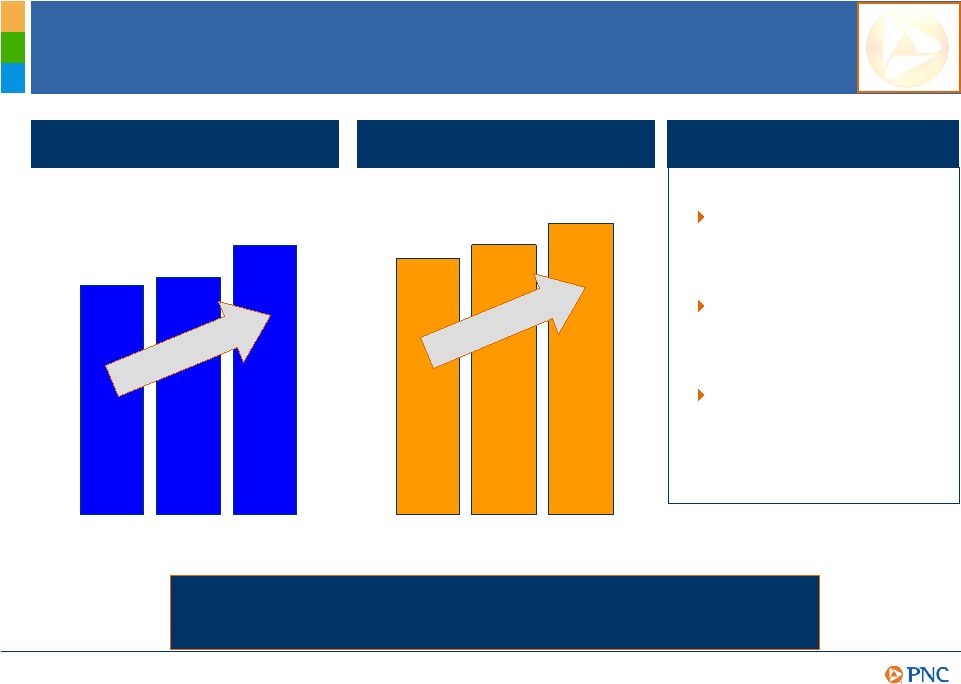
15 Economic recovery Realistic Opportunities for Growth Return to a moderate risk profile Achieve $1.2 billion in annualized cost saves Leverage product depth, cross sell capabilities, deposit franchise, balance sheet flexibility and improved markets Significant shareholder value Return on average assets target 1.30%+ Credit costs should be better relative to peers due to PNCs fair value marks Opportunity to create substantial positive operating leverage Growth Levers PNC Is Recognized for Delivering on Our Growth Initiatives. PNC Is Recognized for Delivering on Our Growth Initiatives. Credit Expenses Revenue Growth |
16 .25% .83% .50% .13% .49% 2.30% 1.39% .04% 2002 2003 2004 2005 2006 2007 2008 2009 Growth Levers Target range .3% - .5% Provision for credit losses to average loans Credit Cost Trend (1) Includes the $45 million conforming provision related to the Yardville acquisition. (2) Includes the $23 million conforming provision related to the Sterling acquisition. Excludes the conforming provision for credit losses of $504 million related to the National City acquisition. Including the National City conforming provision, the provision for credit
losses to average loans for 2008 was 2.09%. Further information is provided in the
Appendix. (3) Average loans reflect the National City acquisition beginning with 2009 as the acquisition closed on December 31, 2008. (4) For the six months ended June 30, 2009,
annualized. Recession 2,3 3,4 PNC Is Focused on Returning to a Moderate Risk Profile. PNC Is Focused on Returning to a Moderate Risk Profile. 1 Growth Levers |
17 Capturing Planned Expense Saves PNCs Culture Includes Focusing on Continuous Improvement. 1H09 annualized cost saves Growth Levers $1,200 (millions) $600 Total goal 2009 goal Captured $500 Implemented common vendor and expense policies and approval guidelines Implementing multi-year plan to help maximize the value of physical space owned and leased Began consolidation of 93 mortgage operations sites into two operations centers - Chicago and Pittsburgh Streamlining systems and support functions operations, marketing, communications, technology, finance, other staff Completed divestiture of 61 Western Pennsylvania National City branches in 3Q09 Highlights |
18 Strong Product Sales Across the Franchise Corporate Banking Wealth Management Institutional Investments Business Bank- Commercial June 09 YTD annualized sales contribution by region Total franchise 1H09 sales 123% of YTD goal 2Q09 sales up 28% vs. 1Q09 Legacy PNC markets 1 All markets above YTD goal Top contributors include Northern NJ, Greater Washington DC, Pittsburgh and Philadelphia Legacy National City markets 2 80% of markets above YTD goal Top contributors include Cleveland, Columbus, Cincinnati, Louisville and Chicago Sales highlights Products Legacy PNC markets 1 60% Legacy National City markets 2 40% PNC Has Significant Sales Momentum Going into the Second Half PNC Has Significant Sales Momentum Going into the Second Half of 2009. of 2009. Growth Levers (1) Includes overlap markets where PNC had a higher deposit share than National City prior to the
acquisition. (2) Includes overlap markets where National City had a higher deposit
share than PNC prior to the acquisition. |
19 Deepening Relationships and Growing Fees PNC Has Demonstrated an Ability to Deepen Relationships and PNC Has Demonstrated an Ability to Deepen Relationships and Grow Our Fee Based Revenue. Grow Our Fee Based Revenue. 1Q09 2Q09 Online bill pay Online banking 1Q09 2Q09 Growth Levers Asset management +10% Consumer services +4% Corporate services +8% Deposit charges +8% $1,566 $1,805 Focus areas Retail online active customers Noninterest income 0 1 2 3 |
20 Treasury Management, Capital Markets and Cross-Sell PNC Is Leading the Way in Delivering the Brand to Our Acquired PNC Is Leading the Way in Delivering the Brand to Our Acquired Markets. Markets. Growth Levers 1Q09 2Q09 Treasury Management and Capital Markets Revenue % of year-to-date cross sell goal through June 30, 2009 Treasury management Capital markets 140% 111% 122% Significant progress 64% 132% 110% Legacy National City markets 1 Legacy PNC markets 2 Total PNC (1) Includes overlap markets where National City had a higher deposit share than PNC prior to the
acquisition. (2) Includes overlap markets where PNC had a higher deposit share than
National City prior to the acquisition. Capital markets Treasury management Significant opportunity $275 $285 $43 $148 |

21 Virtual Wallet One of our fastest growing consumer bases Gen-Y will outnumber any other generation by 2017 Total income will surpass Baby Boomers by 2017 PNC Is Leading the Way in Product Innovation. PNC Is Leading the Way in Product Innovation. Average new accounts opened per day at 300+ year to date 2009 From 2Q08 to 2Q09 PNC has grown our Gen-Y customer base by 13% Gen-Y Virtual Wallet customers average higher balances and transactions than checking-only accounts High retention rates have greatly exceeded our expectations Continue to develop capabilities such as Virtual Wallet- specific iPhone app and extend product reach to younger Gen-Y via Virtual Wallet Student Edition A slick personal finance tool BUSINESSWEEK A truly inspired effort NETBANKER One of the boldest enhancements to the online banking experience CELENT Growth Levers |

22 PNC has an established framework for success The National City acquisition has added great value The execution of our business model across the franchise is delivering solid results PNCs growth levers provide an opportunity to deliver significant shareholder value as the economy recovers Summary PNC Continues to Build a Great Company. PNC Continues to Build a Great Company. |

23 Cautionary Statement Regarding Forward-Looking Information Appendix This presentation includes snapshot information about PNC used by way of illustration
and is not intended as a full business or financial review. It should not be viewed
in isolation but rather in the context of all of the information made available by PNC in its SEC filings. We also make statements in this presentation, and we may from time to time make other statements,
regarding our outlook or expectations for earnings, revenues, expenses, capital levels,
liquidity levels, asset quality and/or other matters regarding or affecting PNC that are forward-looking statements within the meaning of the Private Securities Litigation Reform Act. Forward-looking statements are
typically identified by words such as believe, plan, expect, anticipate, intend, outlook, estimate,
forecast, will, project and other similar words and expressions. Forward-looking statements are subject to numerous assumptions, risks and uncertainties, which change over time. Forward-looking statements speak only as of the date they are made. We do not assume any duty
and do not undertake to update our forward-looking statements. Actual results
or future events could differ, possibly materially, from those that we anticipated in our forward-looking statements, and future results could differ materially from our historical performance. Our forward-looking statements are subject to the following principal risks and
uncertainties. We provide greater detail regarding some of these factors in our 2008 Form 10-K and 2009 Form 10-Qs, including in the Risk Factors and Risk Management
sections of those reports, and in our other SEC filings. Our forward- looking
statements may also be subject to other risks and uncertainties, including those that we may discuss elsewhere in this presentation or in our filings with the SEC, accessible on the SECs website at www.sec.gov and on or through our corporate website
at www.pnc.com/secfilings. We have included these web addresses as inactive textual
references only. Information on these websites is not part of this document. Our businesses and
financial results are affected by business and economic conditions, both generally and specifically in the principal markets in which we
operate. In particular, our businesses and financial results may be impacted by: o
Changes in interest rates and valuations in the debt, equity and other financial markets.
o
Disruptions in the liquidity and other functioning of financial markets, including such disruptions
in the markets for real estate and other assets commonly securing financial products.
o
Actions by the Federal Reserve and other government agencies, including those that impact
money supply and market interest rates. o
Changes in our customers,
suppliers and other counterparties performance in general and their creditworthiness in particular. o
Changes in levels of unemployment. o
Changes in customer preferences and behavior, whether as a result of changing business and economic
conditions or other factors. A continuation of recent turbulence in significant portions of the US and global financial markets, particularly if it worsens, could impact our
performance, both
directly by affecting our revenues and the value of our assets
and liabilities and indirectly by affecting our counterparties and the economy generally.
Our business and financial performance could be impacted as the financial industry restructures in the current environment, both by changes in the
creditworthiness and performance of our counterparties and by changes in the competitive and
regulatory landscape. Given current economic and financial market conditions, our forward-looking financial statements
are subject to the risk that these conditions will be substantially different than we are
currently expecting. These statements are based on our current expectations that interest rates will remain low through 2009 with continued wide market credit spreads, and our view that national economic trends currently
point to a continuation of severe recessionary conditions in 2009 followed by a subdued
recovery in 2010.
|

24 Cautionary Statement Regarding Forward-Looking Information (continued)
Appendix Legal and regulatory developments could have an impact on our ability to operate
our businesses or our financial condition or results of operations or our
competitive position or reputation. Reputational impacts, in turn, could affect matters such as
business generation and retention, our ability to attract and retain management,
liquidity, and funding. These legal and regulatory developments could include: o
Changes resulting from legislative and regulatory responses to the current economic and financial
industry environment, including current and future conditions or restrictions imposed as
a result of our participation in the TARP Capital Purchase Program. o
Other legislative and regulatory reforms, including broad-based restructuring of financial
industry regulation as well as changes to laws and regulations involving tax, pension,
bankruptcy, consumer protection, and other aspects of the financial institution industry. o
Increased litigation risk from recent regulatory and other governmental developments. o
Unfavorable resolution of legal proceedings or other claims or regulatory and other governmental
inquiries. o
The results of the regulatory examination and supervision process, including our
failure to satisfy the requirements of agreements with governmental agencies. o
Changes in accounting policies and principles. Our issuance of securities to the US Department of the Treasury may limit our
ability to return capital to our shareholders and is dilutive to our common shares.
If we are unable previously to redeem the shares, the dividend rate increases substantially after
five years. Our business and operating results are affected by our
ability to identify and effectively manage risks inherent in our businesses, including, where appropriate,
through the effective use of third-party insurance, derivatives, and capital management
techniques, and by our ability to meet evolving regulatory capital standards. The adequacy of our intellectual property protection, and the extent of any
costs associated with obtaining rights in intellectual property claimed by others, can
impact our business and operating results. Our ability to anticipate and respond to technological changes can have an
impact on our ability to respond to customer needs and to meet competitive
demands. Our ability to implement our business
initiatives and strategies could affect our financial performance over the next several years.
Competition can have an impact on customer acquisition, growth and retention, as
well as on our credit spreads and product pricing, which can affect market
share, deposits and revenues. Our business and operating results can also be affected by widespread natural
disasters, terrorist activities or international hostilities, either as a result of the
impact on the economy and capital and other financial markets generally or on us or on our
customers, suppliers or other counterparties specifically. Also,
risks and uncertainties that could affect the results anticipated in forward-looking statements or from historical performance relating to our
equity interest
in BlackRock, Inc. are discussed in more detail in
BlackRocks filings with the SEC, including in the Risk Factors sections of BlackRocks reports. BlackRocks SEC filings are accessible on the SECs website and on or through BlackRocks website at
www.blackrock.com. This material is referenced for informational purposes only and
should not be deemed to constitute a part of this document. In addition, our recent acquisition of National City Corporation (National City)
presents us with a number of risks and uncertainties related both to the acquisition
itself and to the integration of the acquired businesses into PNC. These risks and uncertainties include the following: The anticipated benefits of the transaction, including anticipated cost savings and strategic gains,
may be significantly harder or take longer to achieve than expected or may not be
achieved in their entirety as a result of unexpected factors or events.
|

25 Cautionary Statement Regarding Forward-Looking Information (continued)
Appendix Our ability to achieve anticipated results from this transaction is dependent on
the state going forward of the economic and financial markets, which have been
under significant stress recently. Specifically, we may incur more credit losses from National
Citys loan portfolio than expected. Other issues related to achieving anticipated financial results include the possibility that deposit attrition or attrition in key
client, partner and other relationships may be greater than expected. Legal proceedings or other claims made and governmental investigations currently pending against National City, as well as others that may be filed, made or
commenced relating to National Citys business and activities before the acquisition, could
adversely impact our financial results. Our ability to achieve
anticipated results is also dependent on our ability to bring National Citys systems, operating models, and controls into conformity with
ours and to do so on our planned time schedule. The integration of National Citys
business and operations into PNC, which will include conversion of National Citys
different systems and procedures, may take longer than anticipated or be more costly than anticipated or have unanticipated adverse results relating to National Citys or PNCs existing businesses. PNCs ability to integrate
National City successfully may be adversely affected by the fact that this transaction has resulted in PNC entering several markets where PNC did not previously have any meaningful retail
presence. In addition to the National City transaction, we grow our business from time to time by acquiring
other financial services companies. Acquisitions in general present us with risks,
in addition to those presented by the nature of the business acquired, similar to some or all of those described above relating to the National City acquisition. Any annualized, proforma, estimated, third party or consensus numbers in this presentation are used
for illustrative or comparative purposes only and may not reflect actual results.
Any consensus earnings estimates are calculated based on the earnings projections made by analysts who cover that company. The analysts opinions, estimates or forecasts (and therefore the consensus earnings estimates) are
theirs alone, are not those of PNC or its management, and may not reflect PNCs or
other companys actual or anticipated results.
|

26 Non-GAAP to GAAP Reconcilement Appendix Six months ended March 31, 2009 June 30, 2009 June 30, 2009 in millions Total revenue $3,871 $3,987 $7,858 Noninterest expense 2,328 2,658 4,986 Pretax pre-provision earnings $1,543 $1,329 $2,872 Three months ended PNC believes that pretax pre-provision earnings is useful as a tool to help evaluate ability to
provide for credit costs through operations. Three months ended, in millions
June 30, 2009
Net income $207 After-tax impact of: Special FDIC assessment 86 Integration costs 91 Net income excluding selected items $384 Three months ended June 30, 2009 Earnings per diluted share $.14 EPS impact of: Special FDIC assessment .19 Integration costs .20 EPS excluding selected items $.53 PNC believes that information adjusted for the impact of these items may be useful due to the
extent to which the items are not indicative of our ongoing operations.
|

27 Non-GAAP to GAAP Reconcilement Appendix As of June 30, 2009, in millions
Reported loans Remaining fair value mark (a) Total Allowance Remaining fair value mark and allowance as a % of total Commercial real estate $24,865 $1,878 $26,743 $1,027 11% Commercial and equipment lease finanancing 66,686 1,153 67,839 2,104 5% Residential real estate 21,521 2,395 23,916 494 12% Consumer 51,937 2,079 54,016 944 6% Total $165,009 $7,505 $172,514 $4,569 7% (a) Relates to loans acquired from National City that were impaired per FASB ASC 310-30.
In millions, for the three months ended Pretax Net income Reported net income (loss) ($248) National City conforming provision for credit losses $504 328 Net income (loss) excluding National City conforming provision for credit losses $80 December 31, 2008 PNC believes that information adjusted for the impact of this item may be useful due to the extent
to which the item is not indicative of our ongoing operations. As of June 30, 2009, in
millions Total PNC Loans assigned to the Distressed Assets Portfolio segment Total PNC after reassigning Distressed Asset Portfolio loans % of PNC loan portfolio Commercial and equipment leasing $66,686 $978 $65,708 40% Commerical real estate 24,865 3,002 21,863 13% Other consumer 15,218 - 15,218 9% Home equity 36,719 6,936 29,783 18% Residential real estate 21,521 10,337 11,184 7% Distressed 21,253 13% Total loans $165,009 $21,253 $165,009 100% |

28 Non-GAAP to GAAP Reconcilement Appendix Accruing loans past due in millions (a)(b) December 31, 2008 June 30, 2009 30 - 89 days $2,283 $2,310 Government insured/guaranteed (c) 102 123 Excluding government insured/guaranteed $2,181 $2,187 90 days or more (a)(d) $1,241 $2,078 Government insured/guaranteed (c) 428 1,400 Excluding government insured/guaranteed $813 $678 (a) Does not include loans acquired from National City that were impaired per FASB ASC 310-30.
These loans are not included as they were recorded at estimated fair value when
acquired and are currently considered performing loans due to the accretion of interest in purchase accounting. (b) Loans acquired from National City totaled $1.6 billion at December 31, 2008 and $1.7 billion at
June 30, 2009. (c) Primarily residential mortgages. Included for regulatory
reporting. (d) Loans acquired from National City totaled $1.1 billion at December 31,
2008 and $1.5 billion at June 30, 2009. Average loans Provision to average loans $1,517 $72,744 2.09% 504 $1,013 $72,744 1.39% Provision excluding National City conforming provision Year ended December 31, 2008 in millions Provision for credit losses Conforming provision - National City PNC believes that information adjusted for the impact of this item may be useful due to the extent
to which the item is not indicative of our ongoing operations. Average loans for
2008 do not reflect National City as the acquisition closed on December 31, 2008. |