425: Filing under Securities Act Rule 425 of certain prospectuses and communications in connection with business combination transactions
Published on January 31, 2007
Filed by The PNC Financial Services Group, Inc.
Pursuant to Rule 425 under the Securities Act of 1933 and
deemed filed pursuant to Rule 14a-12 of the Securities Exchange Act of 1934
Subject Company: Mercantile Bankshares Corporation
Commission File No. 0-5127
On January 31, 2007, Joseph C. Guyaux, President of The PNC Financial Services Group, Inc. (the Corporation), gave a presentation to investors at the Citigroup Financial Services Conference. This presentation was accompanied by a series of electronic slides that include information pertaining to the financial results and business strategies of the Corporation. A copy of the slides follows below.

The PNC
Financial Services Group, Inc. Citigroup Financial Services Conference January 31, 2007 EXHIBIT 99.1 |

This presentation contains forward-looking statements regarding our outlook or
expectations relating to PNCs future business, operations, financial
condition, financial performance and asset quality. Forward-looking statements are necessarily subject to numerous assumptions, risks and uncertainties,
which change over time. The forward-looking statements in this presentation are qualified by the factors
affecting forward-looking statements identified in the more detailed
Cautionary Statement included in the Appendix, which is in the version of
the presentation materials posted on our corporate website at www.pnc.com under About PNC Investor Relations.
We provide greater detail regarding those factors in our 2005 Form 10-K, including
in the Risk Factors and Risk Management sections, and in our 2006 Form
10-Qs and other SEC reports (accessible on the SECs website at
www.sec.gov and on or through our corporate website). Future events or
circumstances may change our outlook or expectations and may also affect the nature of the assumptions, risks and uncertainties to which our forward-looking statements are
subject. The forward- looking statements in this presentation speak
only as of the date of this presentation. We do not assume any duty
and do not undertake to update those statements. In this presentation, we will sometimes refer to adjusted results to help illustrate (1) the impact of BlackRock deconsolidation near the end of third quarter 2006 and the application of the equity method accounting for our investment in BlackRock and (2) the impact of certain significant 2006 items due to the magnitude of the aggregate of these items. These items include the BlackRock/MLIM transaction gain and integration costs and the costs of balance sheet repositionings that we have disclosed earlier. We provide details of the adjustments in the Appendix. While we have not provided other adjustments for the periods discussed, this is not intended to imply that there could not have been other similar types of adjustments, but any such adjustments would not have been similar in magnitude to the amount of the adjustments shown. This presentation may also include a discussion of non-GAAP financial measures,
which, to the extent not so qualified therein or in the Appendix, is
qualified by GAAP reconciliation information available on our corporate website at www.pnc.com under About PNC - Investor Relations. Cautionary Statement Regarding Forward-Looking Information |

Todays
Discussion PNC overview Retail Banking - High performing model - Our framework for winning in 2007 - Investing to drive growth |
Record net income Closed on BlackRock/Merrill transaction $1.6 billion increase in capital Strong client activity business segment earnings* grew 9% Balance sheet well positioned for this interest rate environment Overall asset quality remained very strong Mercantile acquisition will continue expansion into attractive region Total business segment earnings are reconciled to total GAAP consolidated earnings in the attached Appendix 2006 Highlights Net income $2.6 billion Net income adjusted $1.5 billion ROCE 28% ROCE adjusted 16% Noninterest income to total revenue 74% Noninterest income to total revenue adjusted 61% Loans to deposits 76% Loans to deposits as of December 31, 2006 * Adjusted net income and ROCE exclude the after-tax gain on BlackRock/MLIM
transaction of $1.293 billion, the securities portfolio rebalancing after-tax
loss of $127 million, BlackRock/MLIM integration costs of $47 million
after-tax, and the mortgage loan portfolio repositioning after-tax
loss of $31 million due to the magnitude of the aggregate of those items
and are reconciled to GAAP in the Appendix. (1) (2) (1) (2) (1) 2006 Financial Highlights (3) Reconciled to GAAP in Appendix (3) |
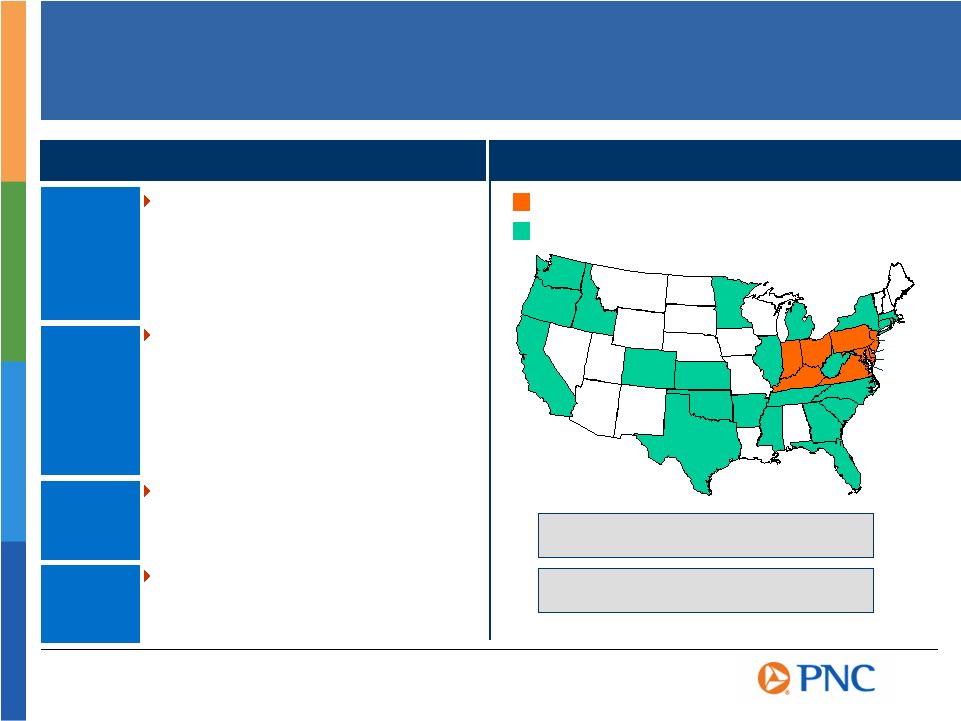
Regional, National and International Businesses International investment management: BlackRock with offices in 18 countries PNC A Diversified Financial Services Company Business Leadership Retail Banking - A leading community bank in PNC major markets - Top 10 SBA lender in the U.S. - One of the nations largest bank wealth management firms Corporate & Institutional Banking - Top 10 Treasury Management business - The nations second largest lead arranger of asset-based loan syndications - Harris Williams - one of the nations largest M&A advisory firms for middle- market companies BlackRock - A global asset management company with over $1.1 trillion in assets under management PFPC - Among the largest providers of mutual fund transfer agency and accounting and administration services in the U.S. PNC Bank Branches PNC Employees / Offices Outside of Retail Footprint IN OH PA KY NJ DE VA DC MD Winning in the Payments Space A Premier Middle- market Franchise A Leading Global Servicing Platform World Class Asset Manager International fund processing: PFPC with offices in U.S., Ireland & Luxembourg |
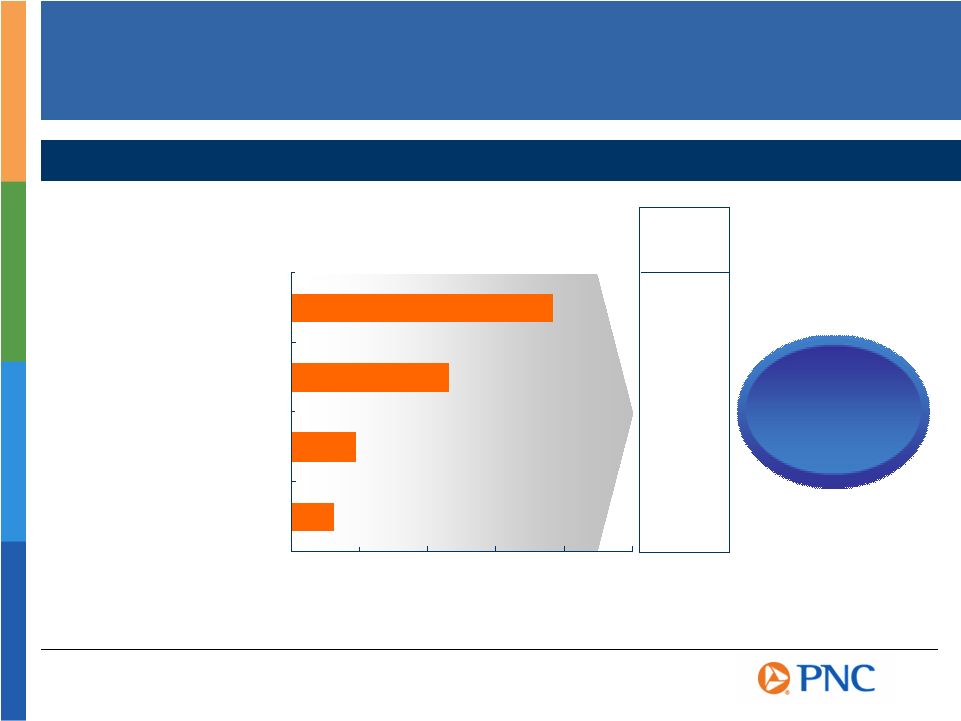
$0 $200 $400 $600 $800 $1,000 Business Results Twelve Months Ended December 31, 2006 Retail Banking Corporate & Institutional Banking BlackRock PFPC Business earnings, earnings growth and return on capital reconciled to GAAP net income,
growth and returns in attached Appendix. Percentage for PFPC reflects return
on average equity. Certain prior period amounts have been reclassified to
conform with the current period presentation. Business Earnings * $ millions * (1) Return on Average Capital (1) 26% 23% N/A 29% PNCs High Return Business Mix Total business segment earnings grew 9% compared to the twelve months ended 12/31/05 $124 $187 $463 $765 |

2006
Retail Banking Revenue Generated by Product Segment Retail Banks Deposit Franchise
is a Primary Source of Revenue Trust & Brokerage 21% Loans 19% Deposits 60% |

Retail Banking
Model is Relationship Driven The payments system Acquisition, retention and growth of checking relationships Capturing increased share of investable assets Opportunistically generating value-added loans Focused on: Focused on: |
Retail Banking
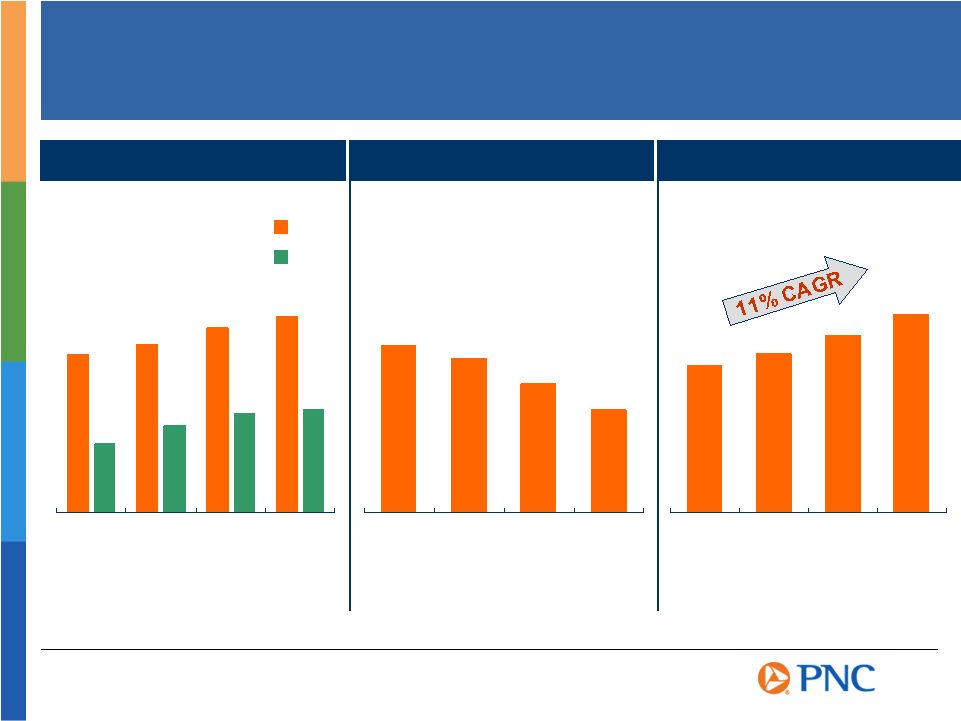
Model Has Been Delivering Superior Results Expanding Relationships Growing Earnings Improving Efficiency $37 $39 $43 $46 $16 $20 $23 $24 2003 2004 2005 2006 Average Deposits Average Loans 63% 62% 60% 58% 2003 2004 2005 2006 Efficiency Ratio $566 $610 $682 $765 2003 2004 2005 2006 Earnings Certain prior period amounts have been reclassified to conform with the current period
presentation. |
Retail Banking
Framework for Winning in 2007 Deliver Our Brand Promise of Ease and Confidence to Create a Sustainable Competitive Advantage and Win for Our Stakeholders Empowered, Committed Employees Exceptional Customer Service Retain and Grow Payments Business Customer Leverage Manage Risk Community Involvement Operational Leverage |
2006
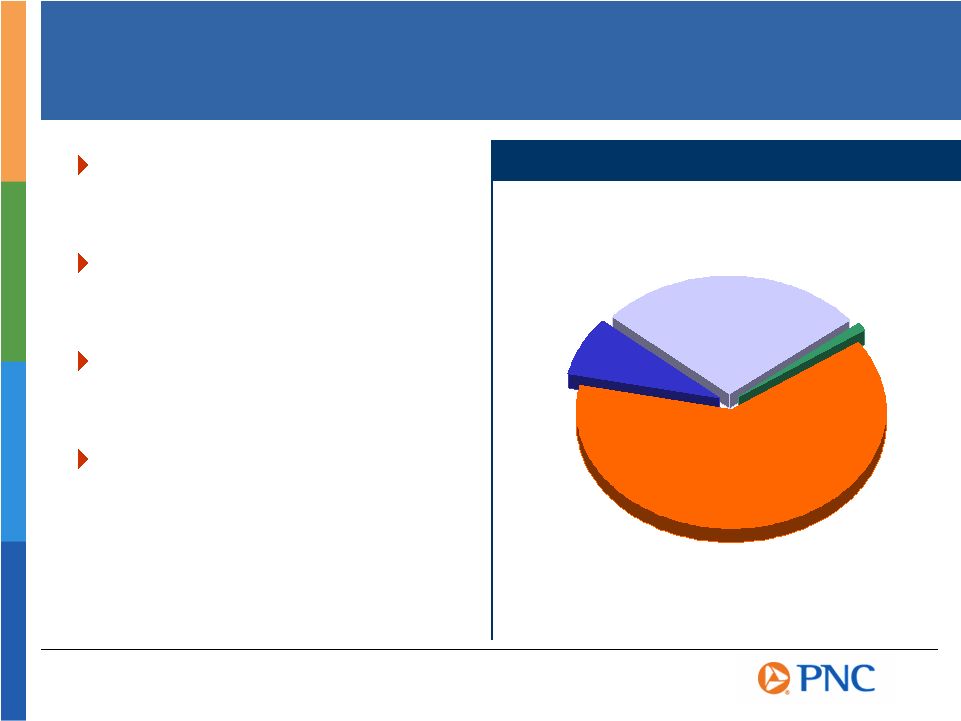
DDA Customer Acquisition by Channel Multiple Channels Drive Checking Acquisition Existing Branches 63% New Branches 8% Workplace & University 28% Web, NFSC, etc. 1% Expanding investment in new branches Upgrading our existing branch facilities Increasing commitment to alternative channels The Web as an expanded acquisition channel |
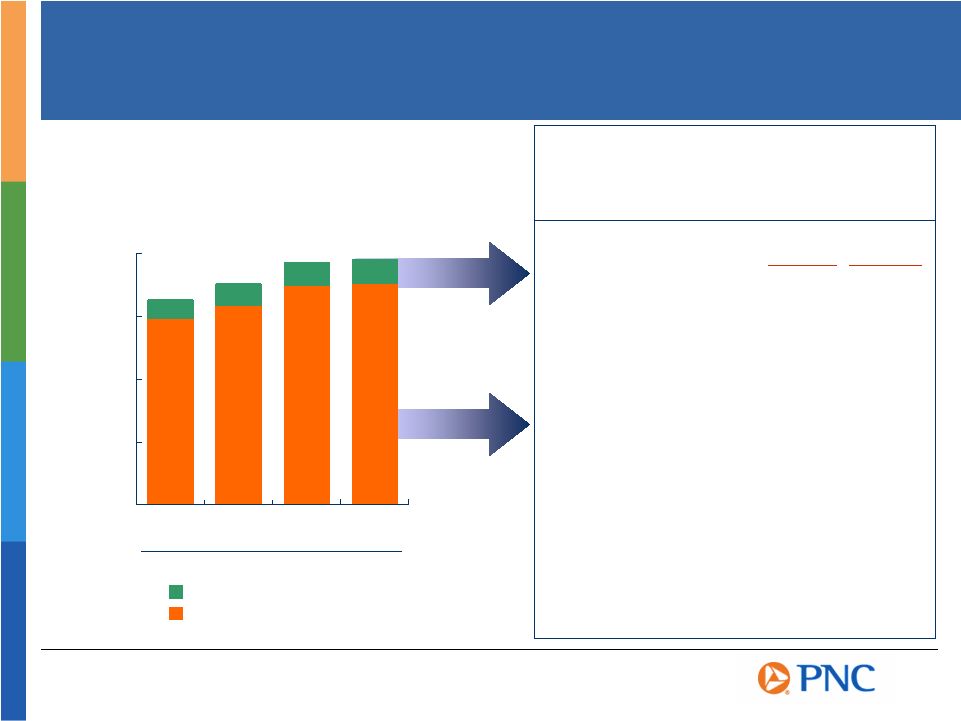
0.0 0.5 1.0 1.5 2.0 2003 2004 2005 2006 Increasing and Deepening Checking Relationships Retail Banking Checking Customer Base millions December 31 Small Business Consumer Small Business Small Business debit card revenue ($ millions)
$12.3 +24% Small Business online banking users 48% +17%
Consumer Consumer debit card revenue ($ millions)
$100.6 +17% Consumer online banking users 53% +10% Consumer online bill-pay users 23% +97%
Provides Opportunities to Leverage Increased Ownership in Payments Business Growth (1) Growth is for FY 2006 vs. FY 2005 Reflects growth in users FY 2006 (2) (2) (2) (1) (2) |

Differentiated
Customer Experience PNC Bank received the highest numerical score in the proprietary J.D. Power and Associates 2006 Small Business Banking Satisfaction StudySM. Study based on 4,996 total responses, measuring 13 financial institutions and measures opinions of small business customers with annual revenues from $100,000 to $10 million. Proprietary study results are based on experiences and perceptions of customers surveyed in July September 2006. Your experiences may vary. Visit jdpower.com. Highest in Customer Satisfaction with Small Business Banking PNC Ranked Highest in Inaugural J.D. Power and Associates Small Business Banking Satisfaction
Study |

Human Sigma program - Measurement, intervention and reward approach to improving customer and employee engagement Service excellence program - Focused on problem reduction and process simplification Employee selection, retention and development - Developing talented, motivated, committed and successful employees Initiatives to Further Differentiate the Customer Experience |

Banking made easy Mortgage origination Credit card Merchant services Private Client Group Investing to Drive Growth Recent Investments |




Focused on
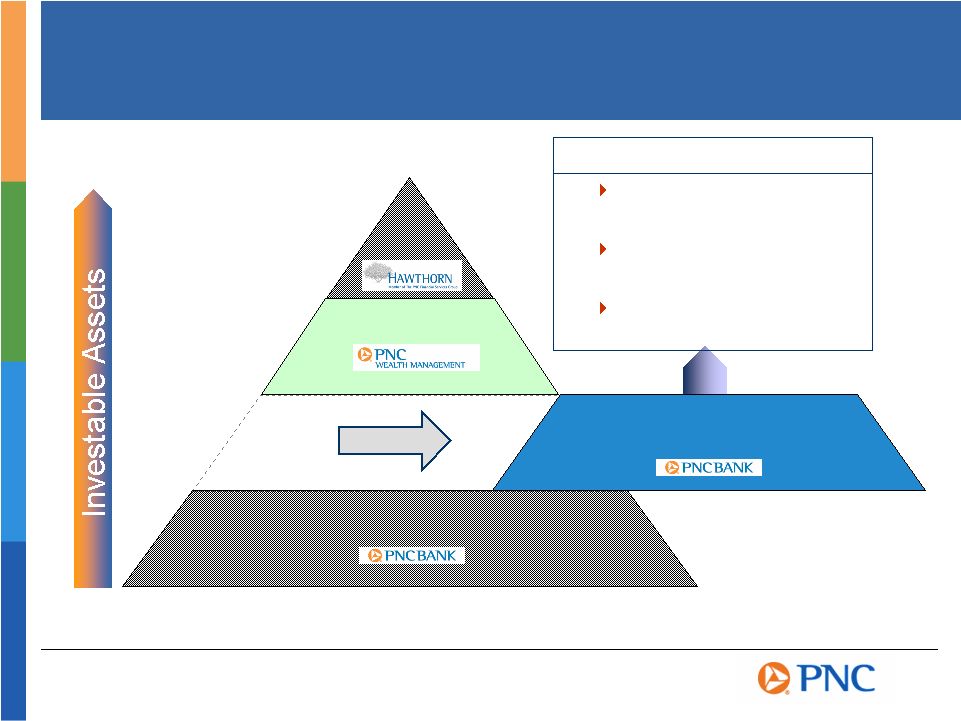
Winning in the Affluent Segment Mass Market Affluent Low High Opportunity Ultra- Affluent Mass Affluent Customer Defined: Mass Affluent Customer Defined: Investable assets from $100,000 to $1,000,000 682,000 existing PNC households (32%) 67% of consumer deposit base Mass Affluent Percentages in definition are as of December 31, 2006 |
Banking made easy Mortgage origination Credit card Merchant services Private Client Group Expanded 2007 marketing program Enhancing pnc.com Remote check capture Simplified business checking New branches M&A activity - Mercantile Investing to Drive Growth Continuing Investments Recent Investments |

Success in
Greater Washington, DC Market Highlights Scalability of Model Demonstrating Ease of PNC Client retention exceeded plan Leveraging successful technology platform Extended hours Free ATMs Established Business Banking team Improved Monthly Same Store Sales Production for PNCs Greater Washington Market Increase December 06 vs December 05 Consumer Checking relationships +14% Average deposits +6% Average home equity loans +17% Small Business Checking relationships +24% Average deposits +23% Average loans +140% |
Mercantile
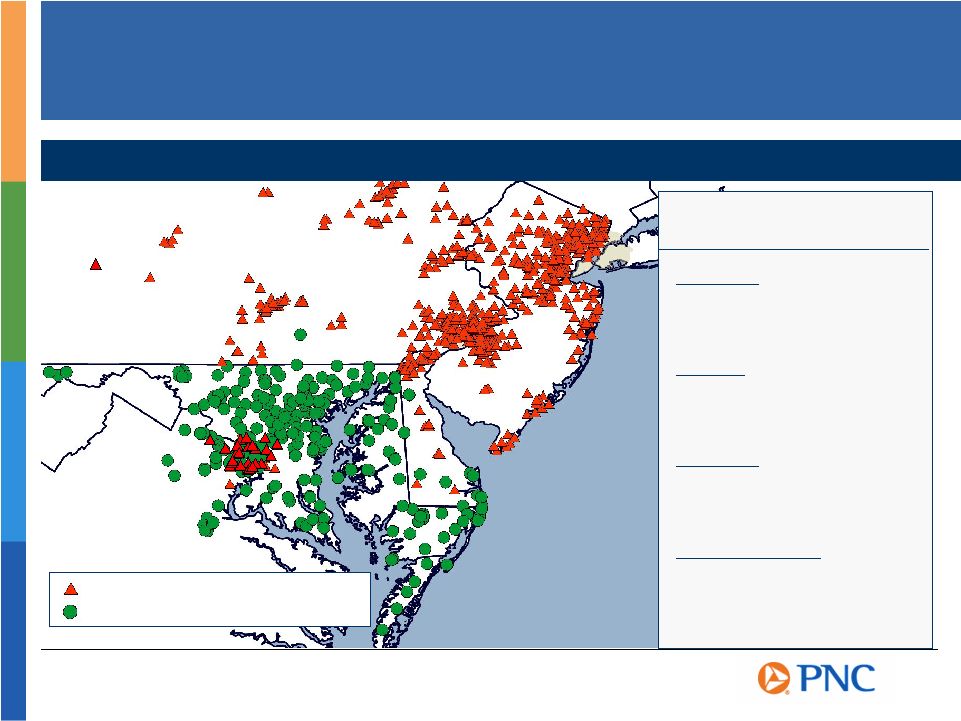
Acquisition Will Create a Mid-Atlantic Powerhouse Existing PNC Mid-Atlantic Branch Locations Existing Mercantile Branch Locations West Virginia West Virginia Virginia Virginia Maryland Maryland Delaware Delaware New Jersey New Jersey New York New York Pennsylvania Pennsylvania Combined Pro forma Combined Pro forma Market Share Market Share (1) (1) 69% of PNC Pro forma Branches Located in the Mid-Atlantic Region Deposit market share data as of 6/30/06 (1) Maryland Branches 203 Deposit market share 2 nd Virginia Branches 59 Deposit market share 6 th Delaware Branches 50 Deposit market share 2 nd Washington, DC Branches 32 Deposit market share 4 th |
Fast Growing
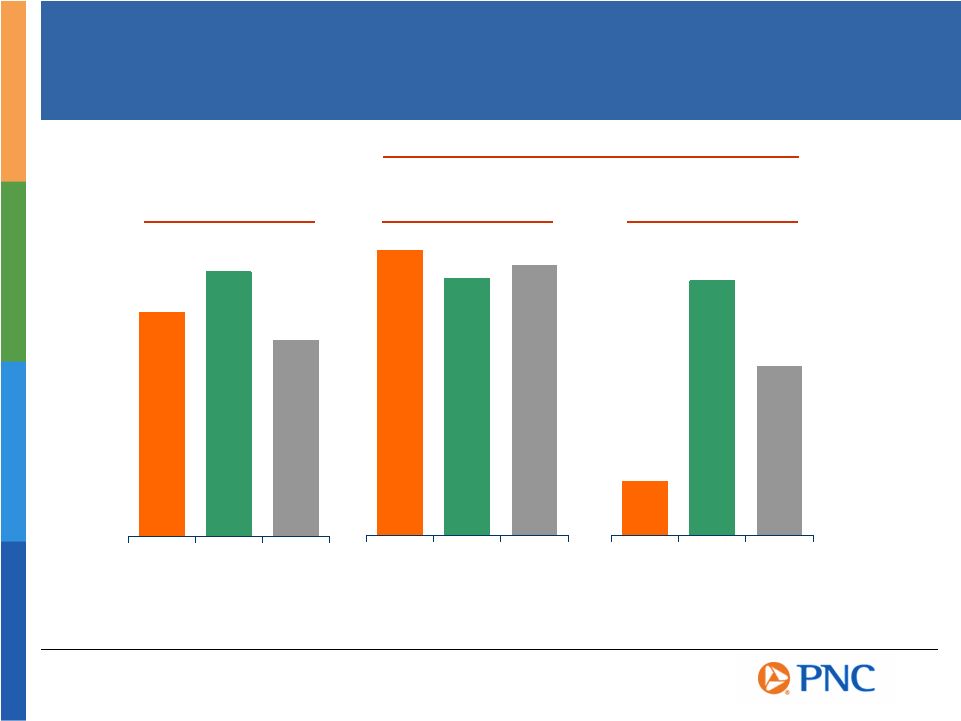
and Affluent Region PNC - 78 county footprint Mercantile 38 county footprint Source: SNL DataSource PNC MRBK PNC MRBK PNC MRBK Median Household Median Household Income Income Projected 5-Year Growth Projected 5-Year Growth Household Household Income Income Population Population $58,648 $69,363 18.8% 16.9% 2.1% 10.0% $51,546 17.8% 6.7% U.S. U.S. U.S. |

Mercantile
Opportunity Distribute broader deposit product set and increase Mercantiles online banking penetration Provide enhanced consumer offerings such as home equity and credit card lending Leverage PNCs small business technology capabilities across Mercantiles banking footprint Expand scale and product capability of Mercantiles Wealth Management business Deliver PNC Treasury Management, Capital Markets and other corporate services to Mercantiles corporate customers Expand the coverage of corporate customers Retail Banking Retail Banking Corporate & Institutional Banking Corporate & Institutional Banking |
Integration
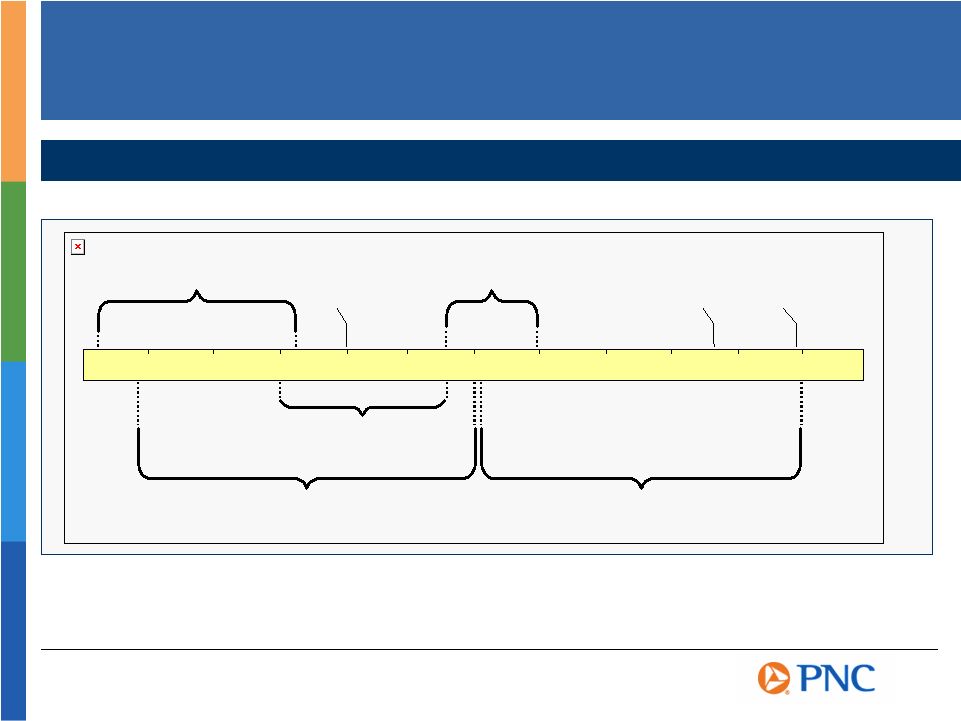
- Top Priority is Retaining Leadership and Clients November December January February March April May June July August September Discovery and Integration Strategy Development Systems Testing Mock Conversion Weekend Integration Strategies Final Bank Conversion 1 st Quarter 07 Regulatory & Shareholder Approvals Closing Oct 06 Sep 07 Develop Go to Market Strategy Employee Communications and Training Ongoing Customer Communications Key Milestones October |

Summary
Achieved remarkable 2006 results Built a differentiated Retail Banking franchise Designed strategies for winning in a difficult retail banking environment Investing to drive growth |

We make statements in this presentation, and we may from time to time make other statements, regarding our outlook or expectations for earnings, revenues, expenses and/or other matters regarding or affecting PNC that are forward-looking statements within the meaning of the Private Securities Litigation Reform Act. Forward-looking statements are typically identified by words such as believe, expect, anticipate, intend, outlook, estimate, forecast, project and other similar words and expressions. Forward-looking statements are subject to numerous assumptions, risks and uncertainties, which change over time. Forward-looking statements speak only as of the date they are made. We do not assume any duty and do not undertake to update our forward-looking statements. Because forward-looking statements are subject to assumptions and uncertainties, actual results or future events could differ, possibly materially, from those that we anticipated in our forward-looking statements, and future results could differ materially from our historical performance. Our forward-looking statements are subject to the following principal risks and uncertainties. We provide greater detail regarding some of these factors in our Form 10-K for the year ended December 31, 2005 and in our 2006 Form 10-Qs, including in the Risk Factors and Risk Management sections of those reports. Our forward-looking statements may also be subject to other risks and uncertainties, including those that we may discuss elsewhere in this presentation or in our filings with the SEC, accessible on the SECs website at www.sec.gov and on or through our corporate website at www.pnc.com under About PNC Investor Relations Financial Information. Our business and operating results are affected by business and economic conditions generally or specifically in the principal markets in which we do business. We are affected by changes in our customers financial performance, as well as changes in customer preferences and behavior, including as a result of changing economic conditions. The value of our assets and liabilities as well as our overall financial performance are affected by changes in interest rates or in valuations in the debt and equity markets. Actions by the Federal Reserve and other government agencies, including those that impact money supply and market interest rates, can affect our activities and financial results. Competition can have an impact on customer acquisition, growth and retention, as well as on our credit spreads and product pricing, which can affect market share, deposits and revenues. Our ability to implement our One PNC initiative, as well as other business initiatives and strategies we may pursue, could affect our financial performance over the next several years. Our ability to grow successfully through acquisitions is impacted by a number of risks and uncertainties related both to the acquisition transactions themselves and to the integration of the acquired businesses into PNC after closing. These uncertainties are present in transactions such as our pending acquisition of Mercantile Bankshares Corporation. Cautionary Statement Regarding Forward-Looking Information |

Legal and regulatory developments could have an impact on our ability to operate our businesses or our financial condition or results of operations or our competitive position or reputation. Reputational impacts, in turn, could affect matters such as business generation and retention, our ability to attract and retain management, liquidity and funding. These legal and regulatory developments could include: (a) the unfavorable resolution of legal proceedings or regulatory and other governmental inquiries; (b) increased litigation risk from recent regulatory and other governmental developments; (c) the results of the regulatory examination process, our failure to satisfy the requirements of agreements with governmental agencies, and regulators future use of supervisory and enforcement tools; (d) legislative and regulatory reforms, including changes to laws and regulations involving tax, pension, and the protection of confidential customer information; and (e) changes in accounting policies and principles. Our business and operating results are affected by our ability to identify and effectively manage risks inherent in our businesses, including, where appropriate, through the effective use of third-party insurance and capital management techniques. Our ability to anticipate and respond to technological changes can have an impact on our ability to respond to customer needs and to meet competitive demands. The adequacy of our intellectual property protection, and the extent of any costs associated with obtaining rights in intellectual property claimed by others, can impact our business and operating results. Our business and operating results can be affected by widespread natural disasters, terrorist activities or international hostilities, either as a result of the impact on the economy and financial and capital markets generally or on us or on our customers, suppliers or other counterparties specifically. Also, risks and uncertainties that could affect the results anticipated in forward-looking statements or from historical performance relating to our interest in BlackRock, Inc. are discussed in more detail in BlackRocks 2005 Form 10-K, including in the Risk Factors section, and in BlackRocks other filings with the SEC, accessible on the SECs website and on or through BlackRocks website at www.blackrock.com.
In addition, our pending acquisition of Mercantile Bankshares presents us with a number of risks and uncertainties related both to the acquisition transaction itself and to the integration of the acquired businesses into PNC after closing. These risks and uncertainties include the following: Completion of the transaction is dependent on, among other things, receipt of regulatory and Mercantile shareholder approvals, the timing of which cannot be predicted with precision at this point and which may not be received at all. The impact of the completion of the transaction on PNCs financial statements will be affected by the timing of the transaction. The transaction may be more expensive to complete than anticipated, including as a result of unexpected factors or events. Cautionary Statement Regarding Forward-Looking Information (continued)
|

The integration of Mercantiles business and operations with those of PNC, which will include conversion of Mercantiles different systems and procedures, may take longer than anticipated, may be more costly than anticipated, and may have unanticipated adverse results relating to Mercantiles or PNCs existing businesses. The anticipated benefits, including anticipated strategic gains and anticipated cost savings and other synergies of the transaction, may be significantly harder or take longer to be realized than anticipated or may not be achieved in their entirety, including as a result of unexpected factors or events, and attrition in key client, partner and other relationships relating to the transaction may be greater than expected. The anticipated benefits to PNC are dependent in part on Mercantiles business performance in the future, and there can be no assurance as to actual future results, which could be impacted by various factors, including the risks and uncertainties generally related to PNCs and Mercantiles performance (with respect to Mercantile, see Mercantiles SEC reports, accessible on the SECs website) or due to factors related to the acquisition of Mercantile and the process of integrating it into PNC. In addition to the pending Mercantile Bankshares transaction, we grow our business from time to time by acquiring other financial services companies. Acquisitions in general present us with risks other than those presented by the nature of the business acquired. In particular, acquisitions may be substantially more expensive to complete (including as a result of costs incurred in connection with the integration of the acquired company) and the anticipated benefits (including anticipated cost savings and strategic gains) may be significantly harder or take longer to achieve than expected. In some cases, acquisitions involve our entry into new businesses or new geographic or other markets, and these situations also present risks resulting from our inexperience in these new areas. As a regulated financial institution, our pursuit of attractive acquisition opportunities could be negatively impacted due to regulatory delays or other regulatory issues. Regulatory and/or legal issues related to the pre-acquisition operations of an acquired business may cause reputational harm to PNC following the acquisition and integration of the acquired business into ours and may result in additional future costs and expenses arising as a result of those issues. Any annualized, proforma, estimated, third party or consensus numbers in this presentation are used for illustrative or comparative purposes only and may not reflect actual results. Any consensus earnings estimates are calculated based on the earnings projections made by analysts who cover that company. The analysts opinions, estimates or forecasts (and therefore the consensus earnings estimates) are theirs alone, are not those of PNC or its management, and may not reflect PNCs, Mercantiles or other companys actual or anticipated results. Cautionary Statement Regarding Forward-Looking Information (continued)
|

The PNC Financial Services Group, Inc. and Mercantile Bankshares Corporation have filed a proxy statement/prospectus and other relevant documents concerning the merger with the United States Securities and Exchange Commission (the SEC). WE URGE INVESTORS TO READ THE PROXY STATEMENT/PROSPECTUS AND ANY OTHER DOCUMENTS FILED WITH THE SEC IN CONNECTION WITH THE MERGER OR INCORPORATED BY REFERENCE IN THE PROXY STATEMENT/PROSPECTUS BECAUSE THEY CONTAIN IMPORTANT INFORMATION. Investors may obtain these documents free of charge at the SECs website (www.sec.gov). In addition, documents filed with the SEC by The PNC Financial Services Group, Inc. are available free of charge from Shareholder Relations at (800) 843-2206. Documents filed with the SEC by Mercantile Bankshares are available free of charge from Mercantile Bankshares Corporation, 2 Hopkins Plaza, P.O. Box 1477, Baltimore, Maryland 21203, Attention: Investor Relations. The directors, executive officers, and certain other members of management and employees of Mercantile Bankshares Corporation are participants in the solicitation of proxies in favor of the merger from the shareholders of Mercantile Bankshares Corporation. Information about the directors and executive officers of Mercantile Bankshares Corporation is set forth in the proxy statement for its 2006 annual meeting of shareholders, which was filed with the SEC on March 29, 2006. Additional information regarding the interests of such participants is included in the proxy statement/prospectus filed with the SEC. Additional Information About The PNC/Mercantile Transaction |

Appendix |

Non-GAAP
to GAAP Reconcilement Net interest income $2,245 ($10) $2,235 Noninterest income 6,327 ($1,824) (1,087) $144 3,560 Total revenue 8,572 (1,824) (1,097) 144 5,795 Noninterest expense 4,443 (91) (765) 3,587 Pretax, pre-provision income 4,129 (1,733) (332) 144 2,208 Provision 124 124 Income before minority interest and income taxes 4,005 (1,733) (332) 144 2,084 Minority interest in income of BlackRock 47 18 (65) - Income taxes 1,363 (663) (130) 7 577 Net income $2,595 ($1,088) ($137) $137 $1,507 Reported, GAAP Basis Adjustments (b) $ millions (except per share data) Appendix Income Statement and Selected Ratios (a) Year Ended December 31, 2006 BlackRock Deconsolidation & Other Adjustments As Adjusted BlackRock Equity Method (c) The table above represents a reconciliation of certain GAAP disclosures to adjusted amounts for the year ended December 31, 2006. This reconciliation is provided for informational purposes only and reflects historical consolidated financial information of PNC (1) with amounts adjusted for the impact of certain significant 2006 items and (2) as if we had recorded our investment in BlackRock on the equity method for all of 2006. We have provided these adjusted amounts and reconciliation so that shareholders, investor analysts, regulators and otherswill be better able to evaluate the impact of certain significant items on our GAAP results for the twelve months ended December 31, 2006 in addition to providing a basis of comparability for the impact of BlackRock. This information supplements our results as reported in accordancewith GAAP and should not be viewed in isolation from, or as a substitute for, our GAAP results. The absence of other adjustments is not intended to imply that there could not have been other similar types of adjustments, but any such adjustments would not have been similar in magnitude to the amount of the adjustments shown. Our third quarter 2006 Form 10-Q includes additional information regarding our BlackRock/Merrill Lynch Investment Managers transaction accounting, securities portfolio rebalancing and mortgage loan portfolio repositioning. Includes the impact of the following items, all on a pretax basis: $2,078 million gain on BlackRock/MLIM transaction, $196 million securities portfolio rebalancing loss, $101 million of BlackRock/MLIM transaction integration costs, and $48 million mortgage loan portfolio repositioning loss. BlackRock investment revenue represents PNCs ownership interest in earnings of BlackRock excluding our share of pretax BlackRock/MLIM transaction integration costs totaling $101 million. The income taxes amount represents additional income taxes recorded by PNC related to BlackRock earnings. (a) (b) (c) |

Non-GAAP
to GAAP Reconcilement Noninterest income $6,327 ($1,824) ($1,087) $144 $3,560 Total revenue $8,572 ($1,824) ($1,097) $144 $5,795 Net income $2,595 ($1,088) ($137) $137 $1,507 Average common shareholders equity $9,275 $9,275 Return on average common shareholders equity 27.97% 16.24% Noninterest income to total revenue 74% 61% Reported, GAAP Basis $ millions (except per share data) Appendix Income Statement and Selected Ratios (a) Year Ended December 31, 2006 BlackRock Deconsolidation & Other Adjustments As Adjusted Adjustments (b) BlackRock Equity Method (c) The table above represents a reconciliation of certain GAAP disclosures to adjusted amounts for the year ended December 31, 2006. This reconciliation is provided for informational purposes only and reflects historical consolidated financial information of PNC (1) with amounts adjusted for the impact of certain significant 2006 items and (2) as if we had recorded our investment in BlackRock on the equity method for all of 2006. We have provided these adjusted amounts and reconciliation so that shareholders, investor analysts, regulators and otherswill be better able to evaluate the impact of certain significant items on our GAAP results for the twelve months ended December 31, 2006 in addition to providing a basis of comparability for the impact of BlackRock. This information supplements our results as reported in accordancewith GAAP and should not be viewed in isolation from, or as a substitute for, our GAAP results. The absence of other adjustments is not intended to imply that there could not have been other similar types of adjustments, but any such adjustments would not have been similar in magnitude to the amount of the adjustments shown. Our third quarter 2006 Form 10-Q includes additional information regarding our BlackRock/Merrill Lynch Investment Managers transaction accounting, securities portfolio rebalancing and mortgage loan portfolio repositioning. Includes the impact of the following items, all on a pretax basis: $2,078 million gain on BlackRock/MLIM transaction, $196 million securities portfolio rebalancing loss, $101 million of BlackRock/MLIM transaction integration costs, and $48 million mortgage loan portfolio repositioning loss. BlackRock investment revenue represents PNCs ownership interest in earnings of BlackRock excluding our share of pretax BlackRock/MLIM transaction integration costs totaling $101 million. The income taxes amount represents additional income taxes recorded by PNC related to BlackRock earnings. (a) (b) (c) |

Retail Banking $765 $682 12% 26% Corporate & Institutional Banking 463 480 (4)% 23% BlackRock (a)(b)(c) 187 152 23% N/A PFPC (e) 124 104 19% 29% Total business segment earnings 1,539 1,418 9% Other (c)(d) 1,056 (93) Total consolidated net income $2,595 $1,325 96% 28% Earnings (Loss) $ millions Year Ended December 31 2006 2005 Growth (a) PNCs ownership interest in BlackRock was approximately 69%-70% for 2005 and
through the first nine months of 2006. Effective September 29, 2006,
PNCs ownership interest in BlackRock dropped to approximately 34%. (b) These amounts have been reduced by minority interest in income of BlackRock, excluding
MLIM integration costs, totaling $65 million and $71 million for the years
ended December 31, 2006 and 2005, respectively. (c) For this PNC business segment reporting presentation, integration costs incurred by
BlackRock for the MLIM transaction totaling $47 million for 2006 have been
reclassified from BlackRock to Other. These amounts are after-tax and, as applicable, net of minority interest. (d) Other for 2006 includes the after-tax impact of the net gain on the BlackRock/MLIM
transaction, MLIM integration costs and costs associated with the
securities portfolio rebalancing and mortgage loan portfolio repositioning. (e) 2006 return percentage for PFPC reflects return on average equity. Certain prior period amounts have been reclassified to conform with the current period
presentation Non-GAAP to GAAP Reconcilement Appendix Business Earnings Summary 2006 Return on Average Capital |

BB&T Corporation BBT Comerica CMA Fifth Third Bancorp FITB KeyCorp KEY National City Corporation NCC The PNC Financial Services Group, Inc. PNC Regions Financial RF SunTrust Banks, Inc. STI U.S. Bancorp USB Wachovia Corporation WB Wells Fargo & Company WFC Ticker Peer Group of Super-Regional Banks Appendix |
ADDITIONAL INFORMATION ABOUT THE PNC/MERCANTILE TRANSACTION
The PNC Financial Services Group, Inc. and Mercantile Bankshares Corporation have filed a proxy statement/prospectus and other relevant documents concerning the merger with the United States Securities and Exchange Commission (the SEC). WE URGE INVESTORS TO READ THE PROXY STATEMENT/PROSPECTUS AND ANY OTHER DOCUMENTS FILED WITH THE SEC IN CONNECTION WITH THE MERGER OR INCORPORATED BY REFERENCE IN THE PROXY STATEMENT/PROSPECTUS BECAUSE THEY CONTAIN IMPORTANT INFORMATION.
Investors may obtain these documents free of charge at the SECs website (www.sec.gov). In addition, documents filed with the SEC by The PNC Financial Services Group, Inc. are available free of charge from Shareholder Relations at (800) 843-2206. Documents filed with the SEC by Mercantile Bankshares are available free of charge from Mercantile Bankshares Corporation, 2 Hopkins Plaza, P.O. Box 1477, Baltimore, Maryland 21203, Attention: Investor Relations.
The directors, executive officers, and certain other members of management and employees of Mercantile Bankshares Corporation are participants in the solicitation of proxies in favor of the merger from the shareholders of Mercantile Bankshares Corporation. Information about the directors and executive officers of Mercantile Bankshares Corporation is set forth in the proxy statement for its 2006 annual meeting of shareholders, which was filed with the SEC on March 29, 2006. Additional information regarding the interests of such participants is included in the proxy statement/prospectus filed with the SEC.