SLIDE PRESENTATION
Published on September 12, 2006

The PNC
Financial Services Group, Inc. Lehman Brothers 2006 Financial Services Conference September 12, 2006 EXHIBIT 99.1 |

This presentation contains forward-looking statements regarding our outlook or
expectations relating to PNCs future business, operations, financial
condition, financial performance and asset quality.
Forward-looking statements are necessarily subject to numerous
assumptions, risks and uncertainties, which change over time. The forward-looking statements in this presentation are qualified by the factors
affecting forward-looking statements identified in the more detailed
Cautionary Statement included in the Appendix and in the version of the presentation materials posted on our corporate website at www.pnc.com. We provide greater detail regarding those factors
in our 2005 Form 10-K, including in the Risk Factors and Risk Management
sections, and in our 2006 Form 10-Qs and other SEC reports (accessible
on the SECs website at www.sec.gov and on or through our corporate
website). Future events or circumstances may change our outlook or
expectations and may also affect the nature of the assumptions, risks and uncertainties to which our forward-looking statements are subject. The forward-looking statements in this presentation
speak only as of the date of this presentation. We do not assume any
duty and do not undertake to update those statements. This presentation may also include a discussion of non-GAAP financial measures,
which, to the extent not so qualified therein or in the Appendix, is
qualified by GAAP reconciliation information available on our corporate website at www.pnc.com under About PNC - Investor Relations. Cautionary Statement Regarding Forward-Looking Information |

Key
Messages Delivered on our strategies Business initiatives to drive continued momentum PNC has: |
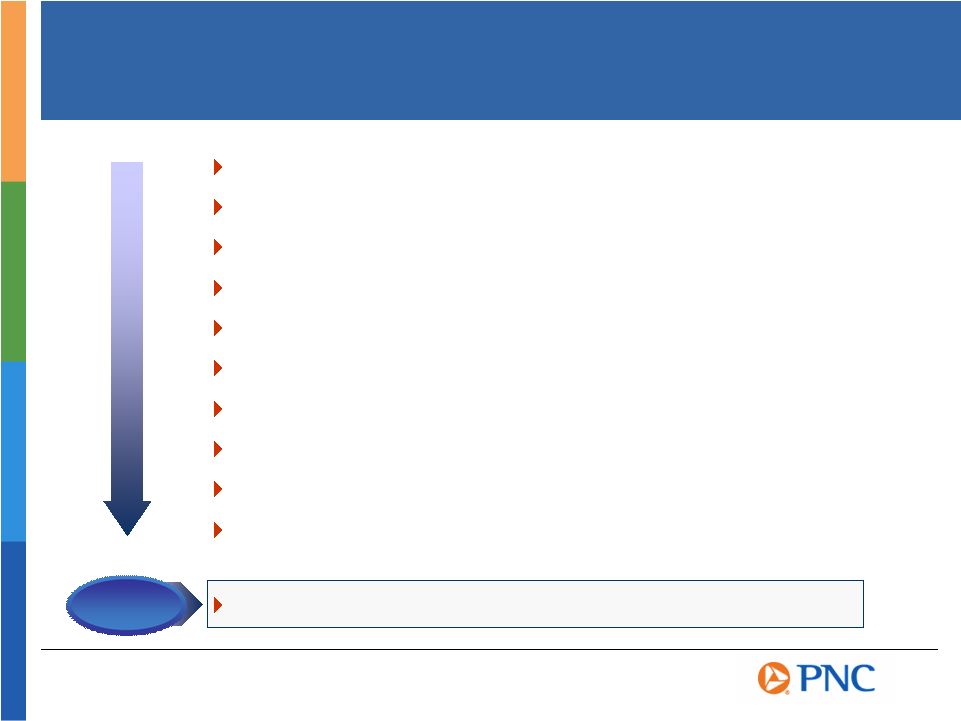
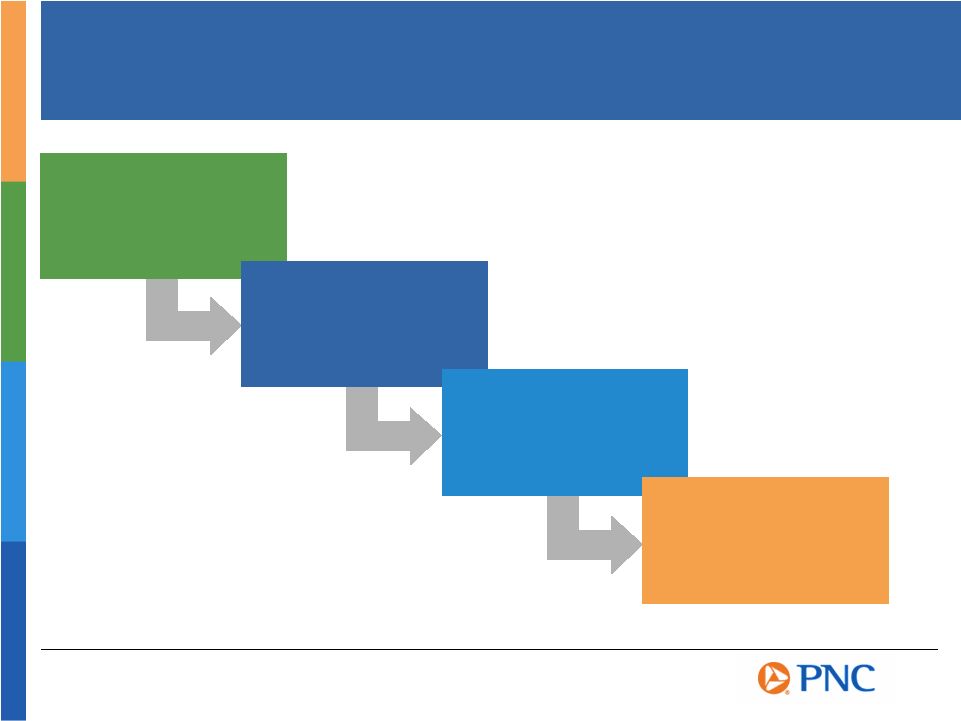
Our Journey to
Build a Great Company Invested in industry leading technology platform Built a diversified business mix Expanded distribution capabilities Improved employee and customer satisfaction Enhanced risk management capabilities Developed strong corporate governance Expanded into higher growth markets and products Deepened customer relationships Focused on expense management Managed capital in a disciplined manner Create differentiated brand 1990s Opportunity Today |
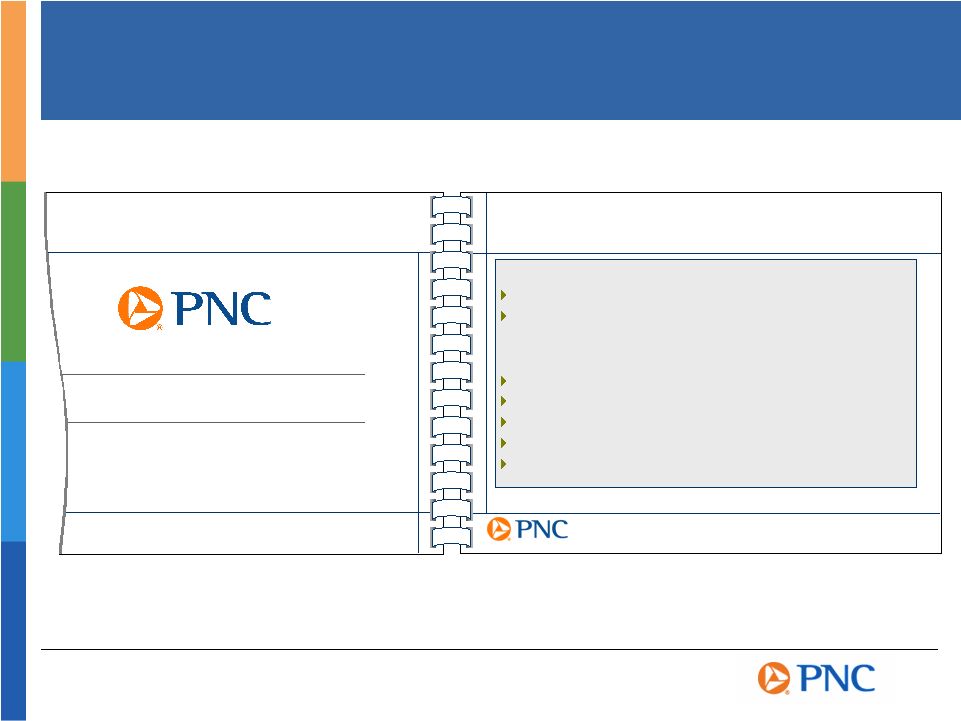
The PNC Financial Services Group, Inc. Lehman Brothers 2005 Financial Services Conference New York, NY September 13, 2005 PNC Financial Services Group, Inc. Lehman Brothers 2005 Financial Services Conference New York, NY September 13, 2005 Keys to Success in the Current Environment Keys to Success in the Current Environment A Solid Platform Diversified business mix Strong risk management Executable Growth Strategies Invest in and grow fee-based businesses Continue to grow low-cost deposit franchise Generate value-added loans Improve asset yields Make operating efficiency a core competency What We Told Investors Last Year |
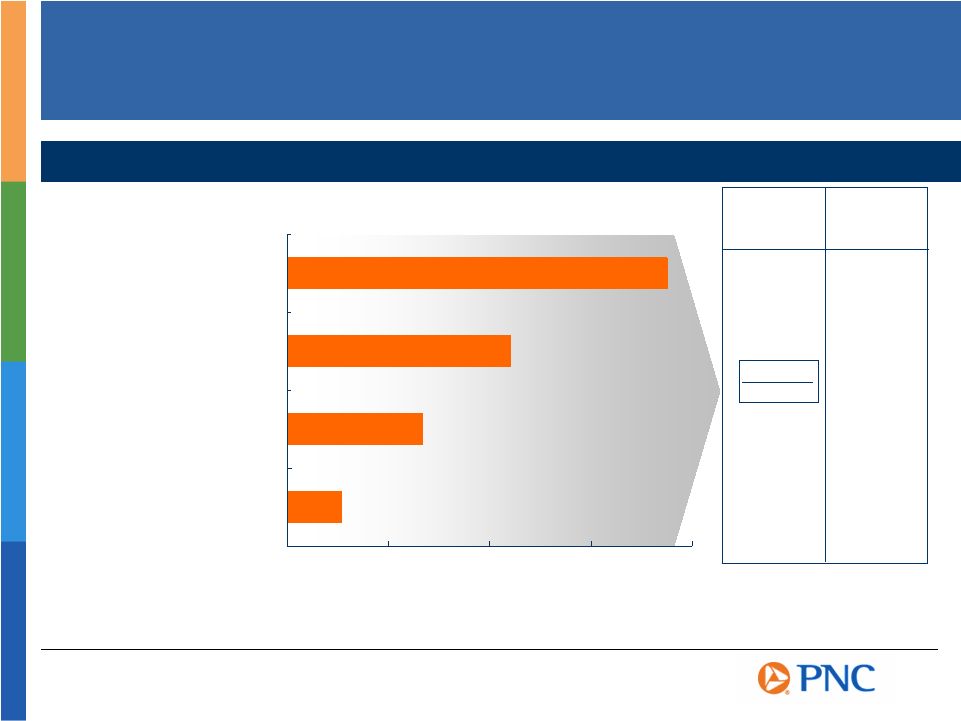
$0 $100 $200 $300 $400 Business Results Six Months Ended June 30, 2006 Retail Banking Corporate & Institutional Banking BlackRock PFPC Business earnings, earnings growth and return on capital reconciled to GAAP net income,
growth and returns in Appendix. Percentages for BlackRock and PFPC reflect
return on average equity. Corporate & Institutional Banking adjusted
earnings growth excludes impact of a loan recovery in 2Q05 of $34 million after-tax and is reconciled to GAAP in the Appendix Business Earnings $ millions $53 $134 $221 $375 (1) (2) Earnings Growth 1H06 vs 1H05 21% (13)% 34% 13% Return on Average Capital (1) 26% 22% 29% 29% Adjusted (2) 0% PNCs High Return Business Mix |

Diverse - No large industry concentration Limited large non-investment grade exposure - Only 2% is non-investment
grade and >$50 million Targeted - Focused on clients that meet risk-adjusted return criteria Home equity portfolio statistics - % of first lien positions 45% - Weighted average loan to value ratio 69% - Weighted average FICO scores 728 Disciplined Approach Leads to Strong Credit Risk Profile Strong Asset Quality Lending Profile (As of June 30, 2006)
PNC June 30, 2006 Nonperforming loans to loans 0.41% 0.35% Net charge-offs to average loans YTD 0.18% 0.23% Allowance for loan and lease losses to loans 1.21% 1.15% Peer Group Source: SNL DataSource; PNC as reported Peer group represents average of super-regional banks identified in the Appendix. Peer group excludes PNC. Commercial Consumer |
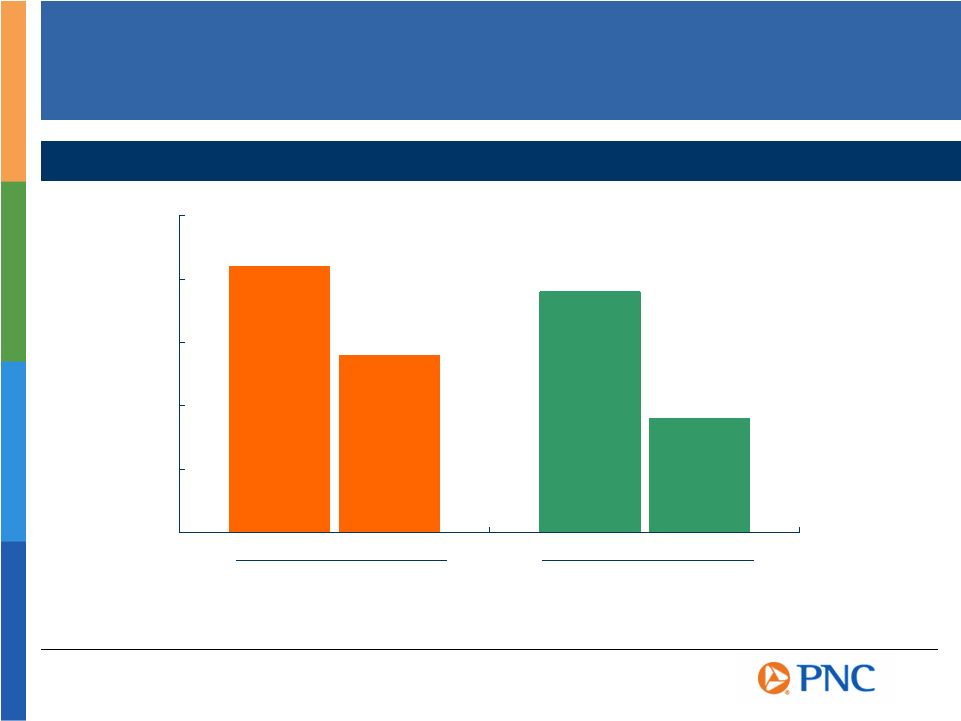
Impact of
Expense Management Becoming More Visible Efficiency Ratios Improving 50% 55% 60% 65% 70% 75% Bank efficiency ratio represents the consolidated (GAAP basis) efficiency ratio excluding the effect of BlackRock and PFPC and is reconciled to GAAP in the Appendix. Efficiency equals noninterest expense divided by the sum of net interest income and noninterest income. * Consolidated Efficiency Bank Efficiency* 2Q05 2Q06 2Q05 2Q06 71% 64% 69% 59% |
Innovative
Technology Platform PNC Named to 2006 'CIO' 100 for Technology Achievement U.S. Banks PNC Wells Fargo |
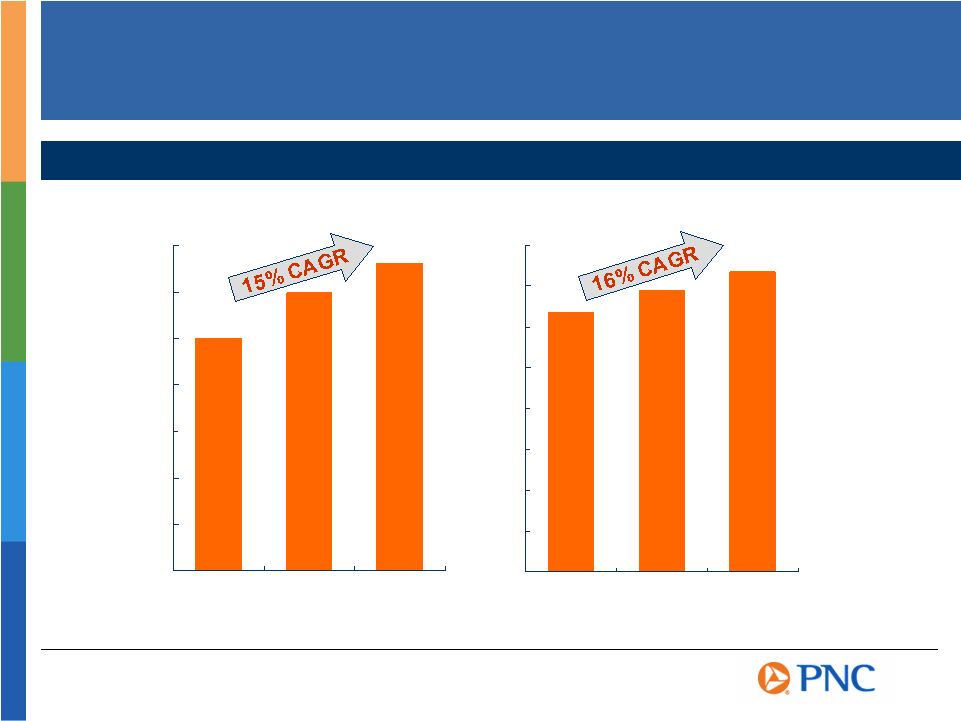
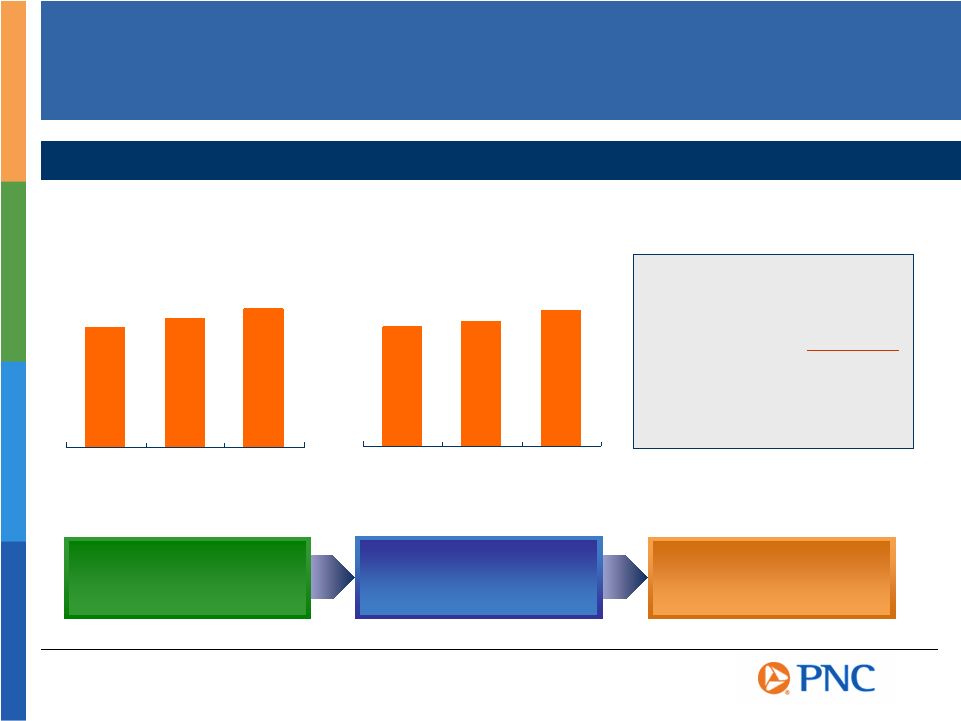
$0 $200 $400 $600 $800 $1,000 $1,200 $1,400 2003 2004 2005 $0 $100 $200 $300 $400 $500 $600 $700 $800 1H05 2H05 1H06 Weve Been Delivering Results
$ millions Consolidated Net Income |

Rebalanced
Securities Portfolio to Improve Total Return Manage portfolio to optimize total return performance Objective Performed comprehensive portfolio review Sold approximately $6 billion of securities likely to underperform on a relative value basis Purchased $3 billion of securities expected to outperform on a relative value basis and added $3 billion notional value of interest rate swaps Recognized pretax loss of approximately $200 million Actions Improved net interest income and margin No impact to duration of equity while maintaining flexibility to extend duration through the economic cycle Tangible common equity ratio improves Benefits |

Key
Messages Delivered on our strategies Business initiatives to drive continued momentum - Retail Banking Winning in the payments space - C&I Banking Building a premier middle market franchise - PFPC Expanding core clients and investing in growth opportunities - BlackRock Building a world-class asset manager PNC has: |
Creating a
Differentiated Brand Deliver Exceptional Service Demonstrate Ease Build Confidence Ask for the Business |
Driving Solid
Growth in Retail Banking Checking Relationships The Value Profit Chain is Working Consumer +7% Small business +10% Checking Relationships 12/31/03 to 6/30/06 CAGR Business Growth Committed Employees 59% 63% 68% 2002 2003 2004 Employees Willingness to Recommend PNC Products and Services Satisfied Customers 64% 67% 73% 2003 2004 2005 Customers Rating PNC Consumer Banking Excellent* * Percentage rated 6 or 7 on 7 point scale Source: PNC proprietary surveys conducted by independent third party
|
Increasing and
Deepening Checking Relationships Retail Banking Retail Banking Checking Customer Base Checking Customer Base 0.0 0.5 1.0 1.5 2.0 2003 2004 2005 6/30/06 millions December 31 Small Business Consumer Small Business Small Business debit card revenue ($ millions)
$5.8 +27% Small Business online banking users 45% +21%
Consumer Consumer debit card revenue ($ millions)
$48.9 +21% Consumer online banking users 51% +13% Consumer online bill-pay users 17% +83%
Provides Opportunities to
Provides Opportunities to Leverage Increased Ownership Leverage Increased Ownership in Payments Business in Payments Business Growth (1) Growth is for 1H06 vs. 1H05 Reflects growth in users 1H06 (2) (2) (2) (1) (2) |

Growing
Deposits Faster Than Our Peers Deposit Increase Compared to Peers Total interest-bearing deposits 12% 9% Total noninterest-bearing deposits 7% 1% Total deposits 11% 8% Average Balances 2Q06 vs. 2Q05 PNC Peers Source: SNL DataSource Peers reflects median of super-regional banks identified in the Appendix excluding
PNC |
WFC 21 % PNC 18 RF 17 KEY 16 USB 16 STI 15 BK 14 FITB 14 WB 14 NCC 14 BBT 13 0.00% 0.10% 0.20% 0.30% 0.40% 0.50% 0.60% 0.70% 1Q 2Q 3Q 4Q 1Q 2Q 3Q 4Q 1Q 2Q Noninterest-Bearing Deposits Becoming More Valuable PNCs High Percentage of Noninterest-Bearing Funding Average Noninterest-Bearing Deposits to Average Earning Assets Rising Interest Rates Increase Value of PNCs Noninterest-Bearing Deposits 2004 2005 Impact of Noninterest-Bearing Sources on PNCs Net Interest Margin 2Q06 Source: SNL DataSource, PNC as reported 2006 |


Investing in Our
Brand to Drive Growth Redesigned and simplified checking product Redesigned and simplified checking product National marketing campaign to expand National marketing campaign to expand checking product reach beyond branch checking product reach beyond branch footprint footprint Launched regional credit card product Launched regional credit card product Investing to enhance the customer Investing to enhance the customer experience in mortgage and merchant experience in mortgage and merchant services services Leveraging existing relationships with Leveraging existing relationships with affluent clients affluent clients Ease. Confidence. Achievement |

|

Success in
Greater Washington DC Market Highlights Scalability of Model Demonstrating Ease of PNC Leveraging successful technology platform Extended hours Free ATMs Opened five new branches - Plan to open approximately 35 more by end of 2008 Established Business Banking team Improved Monthly Same Store Improved Monthly Same Store Sales Production Sales Production Change June 06 vs June 05 Consumer Checking relationships +19% Average deposits +15% Average home equity loans +15% Small Business Checking relationships +29% Average deposits +22% Average loans +207% |
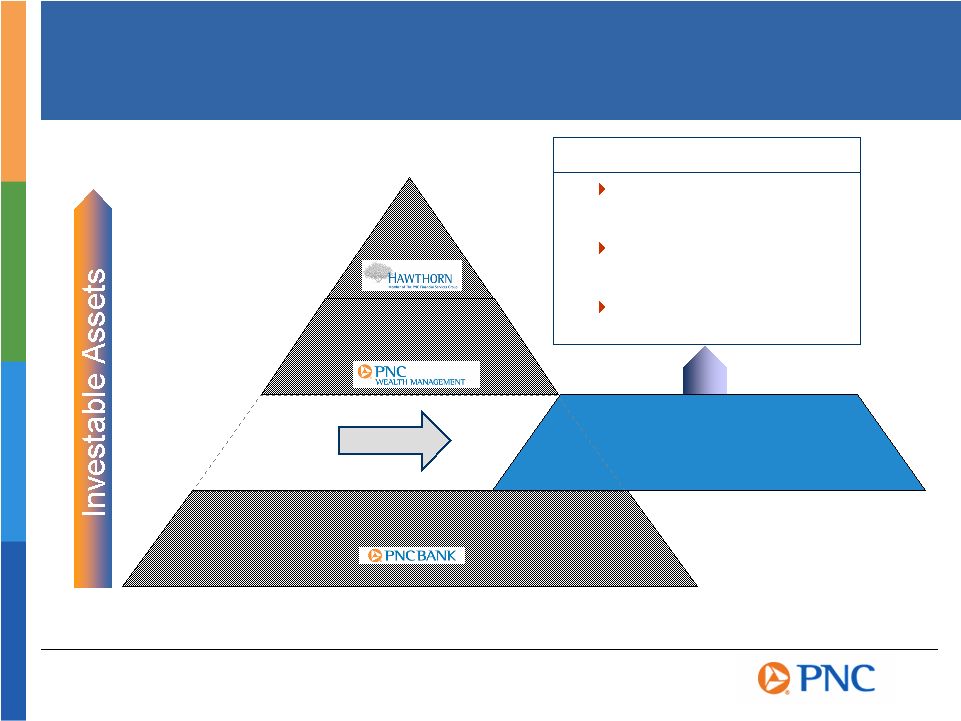


Focused on
Winning in the Affluent Segment Mass Affluent Low High Mass Market Wealth Management Opportunity Ultra- Affluent Mass Mass Affluent Affluent Customer Customer Defined: Defined: Investable assets from $100,000 to $1,000,000 668,000 existing PNC households (31%) 66% of Retail Banking deposit base |
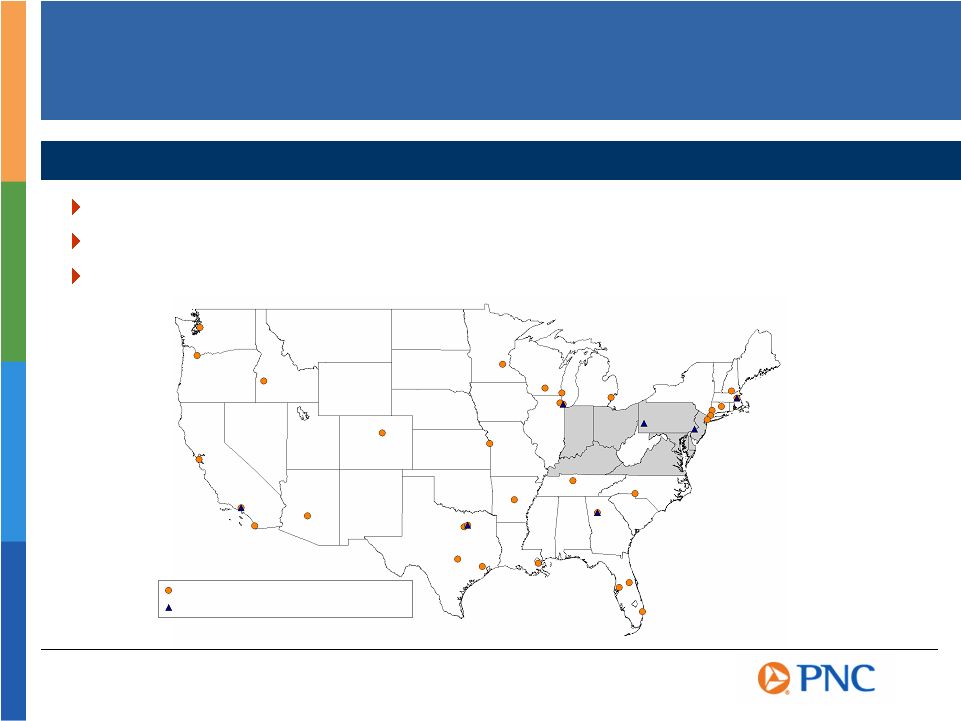
Corporate
& Institutional Banking: Building a Premier Middle Market Franchise Whats Our Competitive Advantage? Focused on middle market Extensive product offering Established national origination and servicing capabilities Corporate & Institutional Banking Location Lock Box Location |
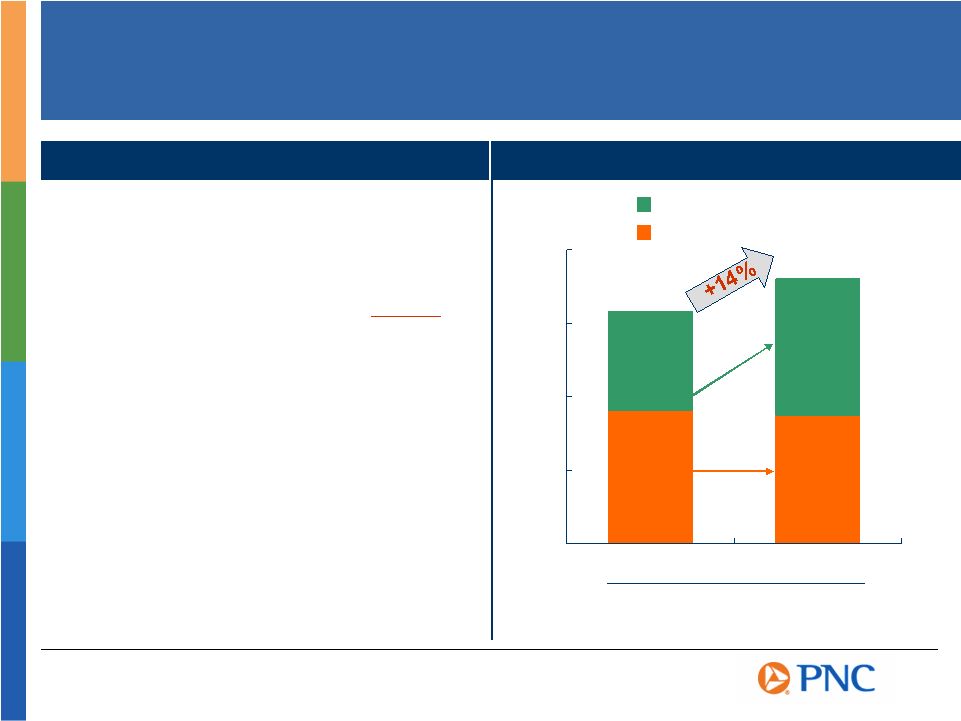
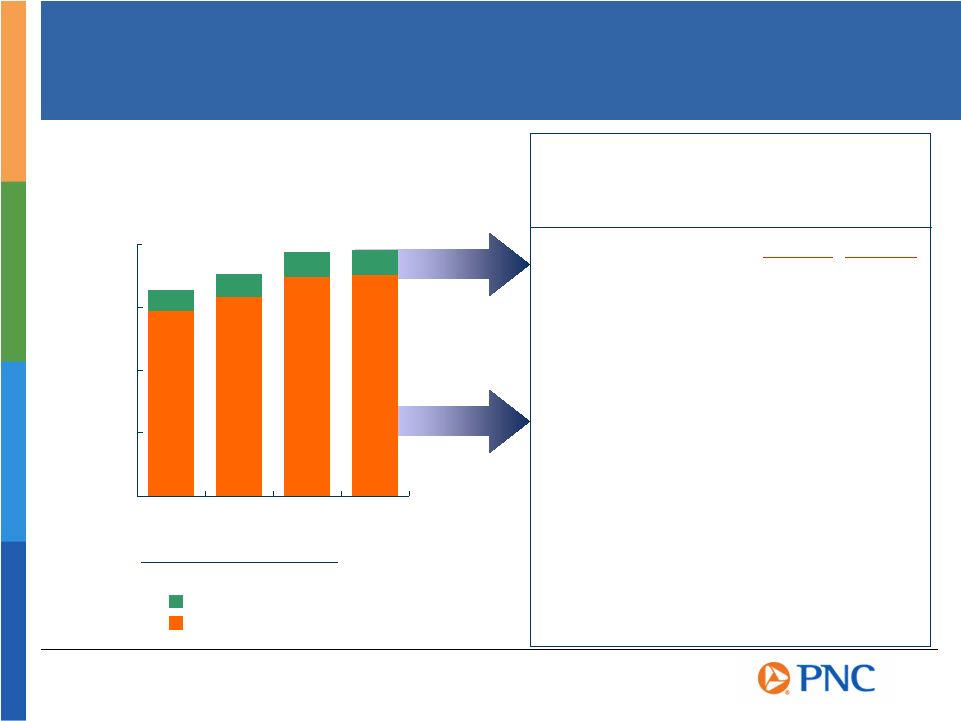
Successfully
Deepening C&I Banking Relationships Cross-sell Results Driving Strong Fee Revenue Growth $ billions $0.0 $0.2 $0.4 $0.6 $0.8 2005 2006 +39% -4% Net Interest Income* Noninterest Income Six Months Ended June 30, Product Penetration of Primary Product Penetration of Primary Clients with a Credit Relationship Clients with a Credit Relationship Treasury Management 75% Capital Markets 38% Leasing 9% April 2006 Net interest income on taxable-equivalent basis and is reconciled to GAAP in Appendix * |
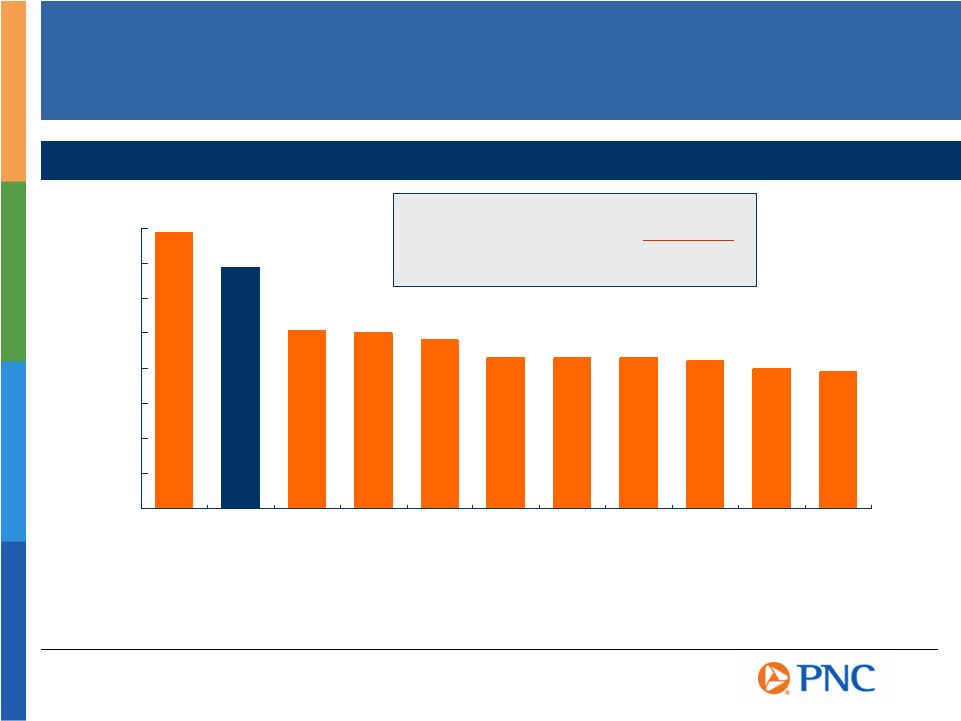
Fee-Based
Businesses Differentiate PNC Noninterest Income to Total Revenue Information for the quarter ended 6/30/06 Source: SNL DataSource, PNC as reported 0% 10% 20% 30% 40% 50% 60% 70% 80% BK PNC USB WB FITB WFC KEY STI BBT NCC RF Noninterest Income 15% PNC 3-Year CAGR |

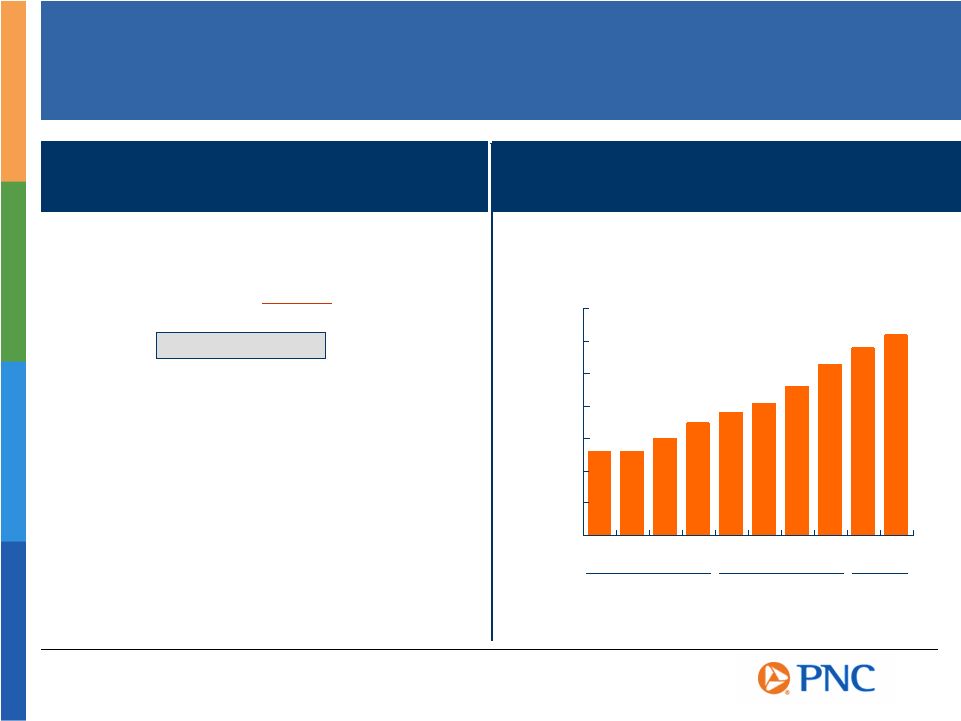
PFPC
Benefiting from Investments in High Growth Products Servicing Statistics Assets serviced ($ billions) Accounting / administration $743 -3% Domestic $671 -4% Offshore $72 +7% Shareholder accounts (in millions) Total 65 +12% Transfer agency 18 -10% Subaccounting 47 +24% YTD Earnings ($ millions)
$53 +13% % Change vs. 2005 2006 June 30 |
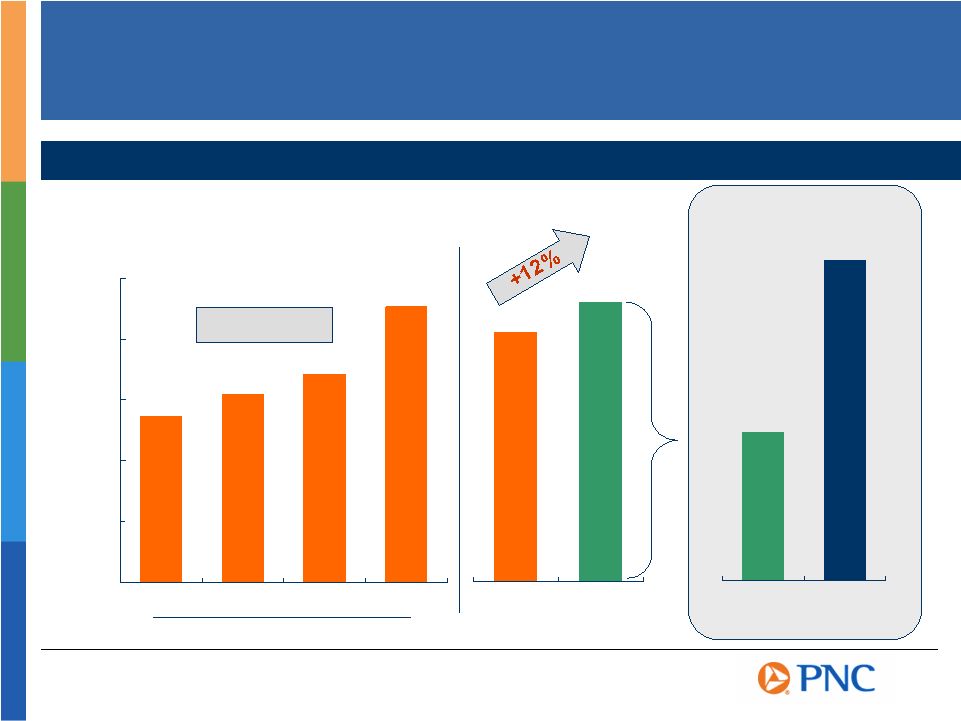
BlackRock
Strong Record of Growth Assets Under Management $0 $100 $200 $300 $400 $500 2002 2003 2004 2005 $ billions 18% CAGR 18% CAGR $273 $342 $453 $309 6/30/05 6/30/06 $464 $414 6/30/06 6/30/06 $1.046 Trillion $464 Proforma BlackRock/MLIM will Create One of the Largest Asset Managers in the World December 31 |
Improving
Capital Flexibility PNC (Pro forma)
7+ % FITB 6.9% RF 6.7% KEY 6.7% NCC 6.6% WFC 6.2% STI 5.8% USB 5.6% BBT 5.4% PNC 5.2% BK 5.2% WB 4.5% As of June 30, 2006 Pro forma after giving effect to anticipated BlackRock/Merrill Lynch transaction and is reconciled to GAAP in Appendix. Source: SNL DataSource, PNC as reported Tangible Common Equity Ratio Invest in and grow our businesses Disciplined approach to acquisitions Return to shareholders Capital Management Priorities |

Summary
Diversified business mix delivering high fee revenue contribution Balance sheet characterized by strong asset quality and significant flexibility in current environment Executing on strategies to maintain momentum Improved capital position anticipated |

We make statements in this presentation, and we may from time to time make other statements, regarding our outlook or expectations for earnings, revenues, expenses and/or other matters regarding or affecting PNC that are forward-looking
statements within the meaning of the Private Securities Litigation Reform Act. Forward-looking statements are typically identified by words such as believe, expect, anticipate, intend, outlook, estimate, forecast, project and other similar words and expressions. Forward-looking statements are subject to numerous assumptions, risks and
uncertainties, which change over time. Forward-looking statements speak only as of the date they are made. We do not assume any duty and do not undertake to update
our forward-looking statements. Actual results or future events could differ, possibly materially, from those that we anticipated in our forward-looking
statements, and future results could differ materially from our historical performance. Our forward-looking statements are subject to the following principal risks and
uncertainties. We provide greater detail regarding these factors in our Form 10-K for the year ended December 31, 2005, including in the Risk Factors and Risk Management
sections, and in our Form 10-Q for the quarter ended March 31, 2006. Our
forward-looking statements may also be subject to other risks and uncertainties, including those that we may discuss elsewhere in this presentation or in our filings with the SEC, accessible on the SECs website at www.sec.gov and on or through our corporate website at www.pnc.com under About PNC - Investor Relations - Investor Events Our business and operating results are affected by business and economic conditions
generally or specifically in the principal markets in which we do business. We are affected by changes in our customers financial performance, as well as changes in customer preferences and behavior,
including as a result of changing economic conditions. The value of our assets and liabilities as well as our overall financial performance
are affected by changes in interest rates or in valuations in the debt and
equity markets. Actions by the Federal Reserve and other government agencies, including those that impact money supply and market interest rates, can affect our activities and financial results. Competition can have an impact on customer acquisition, growth and retention, as well
as on our credit spreads and product pricing, which can affect market
share, deposits and revenues. Our ability to implement our One PNC initiative, as well as other business initiatives
and strategies we may pursue, could affect our financial performance over
the next several years. Our ability to grow successfully through acquisitions is impacted by a number of risks
and uncertainties related both to the acquisition transactions themselves
and to the integration of the acquired businesses into PNC after closing. These uncertainties are present in transactions such as the pending acquisition by BlackRock of Merrill Lynchs investment management
business. Cautionary Statement Regarding Forward-Looking Information |

Legal and regulatory developments could have an impact on our ability to operate our
businesses or our financial condition or results of operations or our
competitive position or reputation. Reputational impacts, in turn, could affect matters such as business generation and retention, our ability to attract and retain management, liquidity and funding. These legal and regulatory
developments could include: (a) the resolution of legal proceedings or regulatory and other governmental inquiries; (b) increased litigation risk
from recent regulatory and other governmental developments; (c) the results of the regulatory examination process, our failure to satisfy the requirements of agreements with governmental agencies, and regulators future use of supervisory and enforcement tools; (d) legislative and regulatory reforms,
including changes to laws and regulations involving tax, pension, and the
protection of confidential customer information; and (e) changes in accounting policies and principles. Our business and operating results are affected by our ability to identify and
effectively manage risks inherent in our businesses, including, where appropriate, through the effective use of third-party insurance and capital
management techniques. Our ability to anticipate and respond to technological changes can have an impact on
our ability to respond to customer needs and to meet competitive
demands. The adequacy of our intellectual property protection, and the extent of any costs
associated with obtaining rights in intellectual property claimed by others, can also impact our business and operating results. Our business and operating results can be affected by widespread natural disasters, terrorist activities or international hostilities, either as a result of the impact on the economy and financial and capital markets generally or on us or on
our customers, suppliers or other counterparties specifically. Also, risks
and uncertainties that could affect the results anticipated in forward-looking statements or from historical performance relating to our majority-owned subsidiary BlackRock, Inc. are discussed in more detail in BlackRocks 2005 Form
10-K, including in the Risk Factors section, and in BlackRocks other filings with the SEC, accessible on the SECs website and on or through BlackRocks
website at www.blackrock.com. Any annualized, proforma, estimated, third
party or consensus numbers in this presentation are used for illustrative or comparative purposes only and may not reflect actual results. Any consensus earnings estimates are calculated based on
the earnings projections made by analysts who cover that company. The analysts opinions, estimates or forecasts (and therefore the consensus earnings estimates) are theirs alone, are not those of PNC or its management, and may not reflect PNCs actual or anticipated results. Cautionary Statement Regarding Forward-Looking Information (continued)
|

Appendix |

Non-GAAP
to GAAP Reconcilement Business segments Retail Banking $375 $311 21% 26% Corporate & Institutional Banking 221 254 (13)% 22% BlackRock 134 100 34% 29% PFPC 53 47 13% 29% Total business segments 783 712 25% Minority interest in income of BlackRock (41) (30) Other (7) (46) Total consolidated $735 $636 16% 17% Corporate & Institutional Banking $221 $254 (13)% Adjustment 2005 loan recovery (34) Corporate & Institutional Banking , adjusted $221 $220 0% $ millions Growth Return on Avg Capital * 2006 * Percentages for BlackRock and PFPC reflect return on average equity Appendix Business Earnings and Return on Capital Six Months Ended June 30 2006 2005 Earnings |
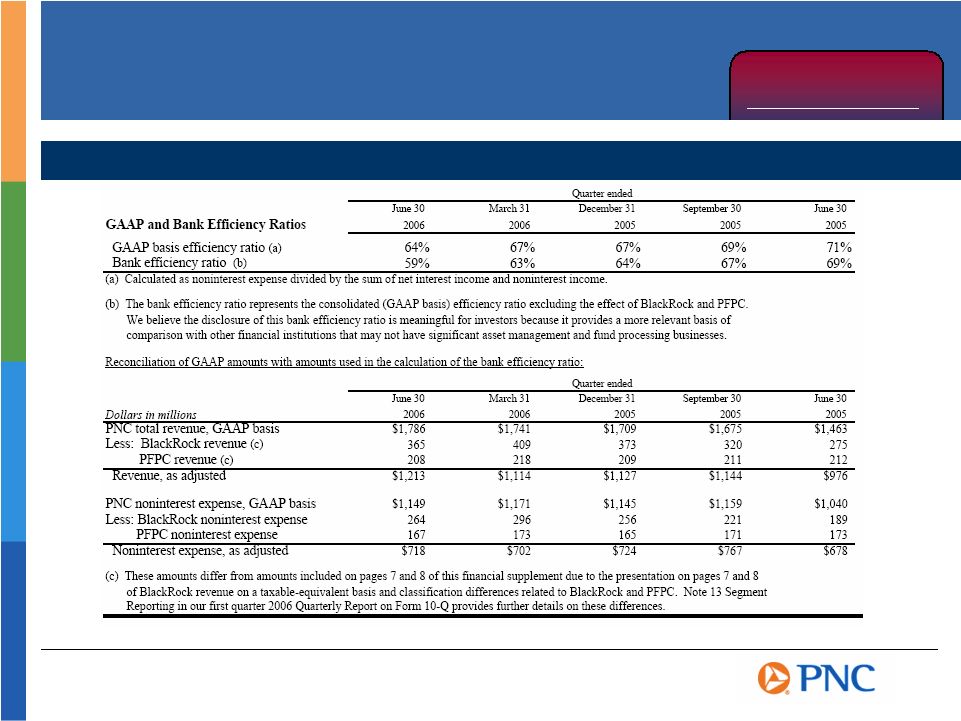
Non-GAAP
to GAAP Reconcilement Appendix Source: Page 10 of The PNC Financial Services Group, Inc. second quarter 2006 Earnings Release Financial Supplement Efficiency Ratios |

Non-GAAP
to GAAP Reconcilement Appendix Tangible Common Equity Ratio Common shareholders equity $8.8 $1.6(a) $10.4 Goodwill & other intangible assets 4.1 ($0.5) 3.6 Tangible common equity $4.7 $6.8 Total assets $94.9 ($1.2) $2.5(b) $96.2 Goodwill & other intangible assets 4.1 (0.5) 3.6 Tangible assets $90.8 $92.6 Tangible common equity ratio 5.2% 7.3% $ billions PNC Consolidated 6/30/06 BlackRock Deconsolidating Adjustments (a) Increase equals the expected after-tax gain to be recorded on this transaction,
subject to adjustments, at closing (b) PNCs Investment equals its expected ownership percentage of BlackRocks pro forma book equity PNC Pro forma 6/30/06 Transaction Adjustments |

BB&T Corporation BBT The Bank of New York Company, Inc. BK Fifth Third Bancorp FITB KeyCorp KEY National City Corporation NCC The PNC Financial Services Group, Inc. PNC Regions Financial RF SunTrust Banks, Inc. STI U.S. Bancorp USB Wachovia Corporation WB Wells Fargo & Company WFC Ticker Peer Group of Super-Regional Banks Appendix |