PRESS RELEASE
Published on April 5, 2004

EXHIBIT 99.1
The PNC Financial Services Group, Inc.
Segment Reporting
Investor Conference Call
April 5, 2004

Cautionary Statement Regarding Forward-Looking Information
This presentation may contain forward-looking statements with respect to PNCs outlook or expectations relating to its future business, operations, financial condition, financial performance and asset quality. Forward-looking statements are necessarily subject to numerous assumptions, risks and uncertainties.
Any forward-looking statements in this presentation are qualified by the factors affecting forward-looking statements identified in the more detailed Cautionary Statement included in the appendix to these slides as well as those factors previously disclosed in PNCs SEC reports (accessible on the SECs website at www.sec.gov and on PNCs website at www.pnc.com).
Future events or circumstances may change PNCs outlook or expectations and may also affect the nature of the assumptions, risks and uncertainties to which the forward-looking statements are subject. The forward-looking statements in this presentation speak only as of the date of this presentation, and PNC assumes no duty and does not undertake to update them.

Todays Discussion
Enhancing PNC segment Bill Demchak
reporting Vice Chairman & CFO
Reviewing management
accounting and reporting Rick Johnson
methodologies Director of Finance
Questions and answers
Enhancing PNC Segment Reporting
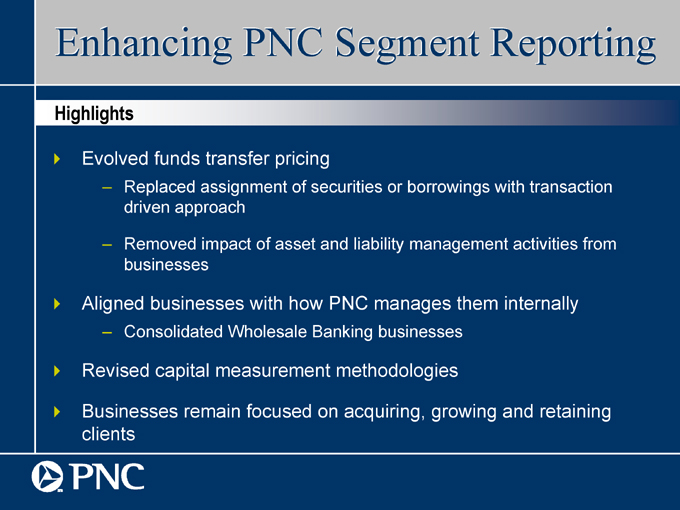
Highlights
Evolved funds transfer pricing
Replaced assignment of securities or borrowings with transaction driven approach
Removed impact of asset and liability management activities from businesses
Aligned businesses with how PNC manages them internally
Consolidated Wholesale Banking businesses
Revised capital measurement methodologies
Businesses remain focused on acquiring, growing and retaining clients
Enhancing PNC Segment Reporting
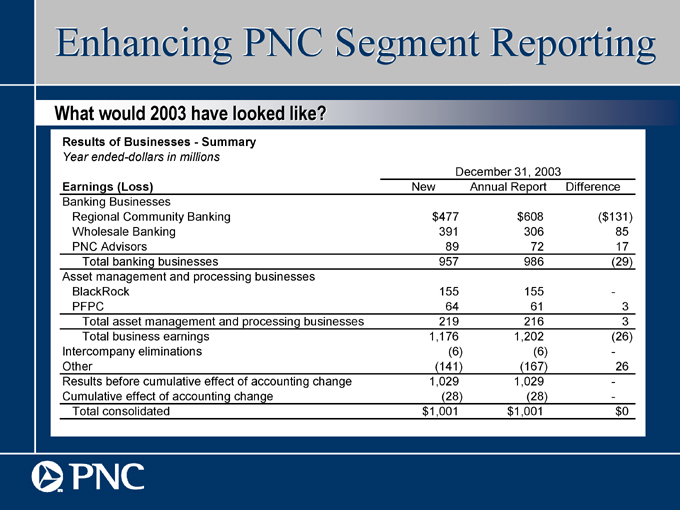
What would 2003 have looked like?
Results of BusinessesSummary
Year ended-dollars in millions
December 31, 2003
Earnings (Loss) New Annual Report Difference
Banking Businesses
Regional Community Banking $ 477 $ 608 ($ 131)
Wholesale Banking 391 306 85
PNC Advisors 89 72 17
Total banking businesses 957 986 (29)
Asset management and processing businesses
BlackRock 155 155 -
PFPC 64 61 3
Total asset management and processing businesses 219 216 3
Total business earnings 1,176 1,202 (26)
Intercompany eliminations (6) (6) - -
Other (141) (167) 26
Results before cumulative effect of accounting change 1,029 1,029 -
Cumulative effect of accounting change (28) (28) -
Total consolidated $ 1,001 $ 1,001 $ 0

Todays Discussion
Enhancing PNC segment Bill Demchak
reporting Vice Chairman & CFO
Reviewing management
accounting and reporting Rick Johnson
methodologies Director of Finance
Questions and answers
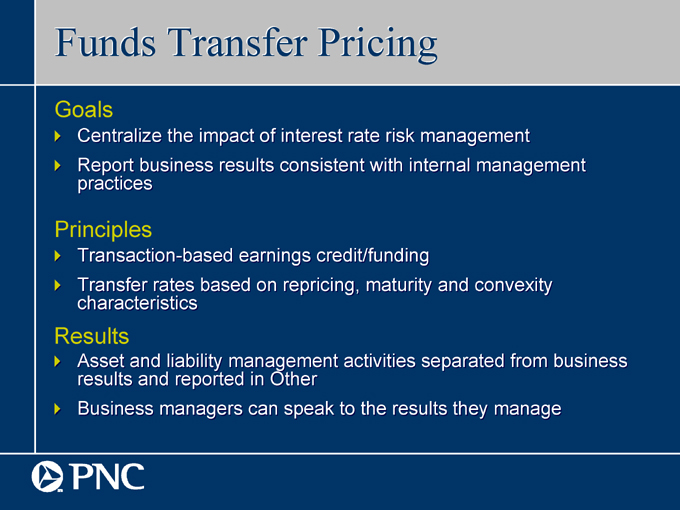
Funds Transfer Pricing
Goals
Centralize the impact of interest rate risk management
Report business results consistent with internal management practices
Principles
Transaction-based earnings credit/funding
Transfer rates based on repricing, maturity and convexity characteristics
Results
Asset and liability management activities separated from business results and reported in Other
Business managers can speak to the results they manage
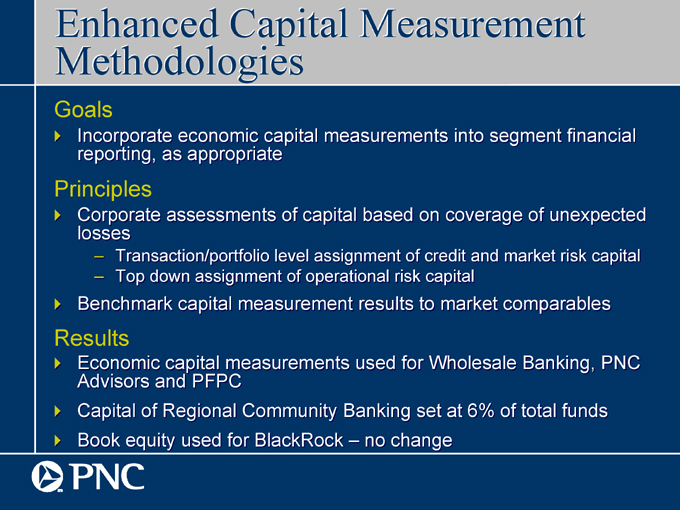
Enhanced Capital Measurement Methodologies
Goals
Incorporate economic capital measurements into segment financial reporting, as appropriate
Principles
Corporate assessments of capital based on coverage of unexpected losses
Transaction/portfolio level assignment of credit and market risk capital
Top down assignment of operational risk capital
Benchmark capital measurement results to market comparables
Results
Economic capital measurements used for Wholesale Banking, PNC Advisors and PFPC
Capital of Regional Community Banking set at 6% of total funds
Book equity used for BlackRock no change
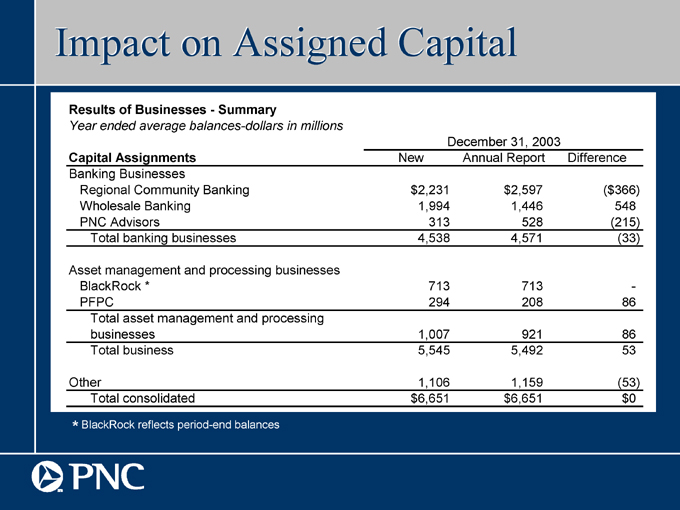
Impact on Assigned Capital
Results of BusinessesSummary
Year ended average balances-dollars in millions
December 31, 2003
Capital Assignments New Annual Report Difference
Banking Businesses
Regional Community Banking $ 2,231 $ 2,597 ($ 366)
Wholesale Banking 1,994 1,446 548
PNC Advisors 313 528 (215)
Total banking businesses 4,538 4,571 (33)
Asset management and processing businesses
BlackRock * 713 713 -
PFPC 294 208 86
Total asset management and processing
businesses 1,007 921 86
Total business 5,545 5,492 53
Other 1,106 1,159 (53)
Total consolidated $ 6,651 $ 6,651 $ 0
* BlackRock reflects period-end balances
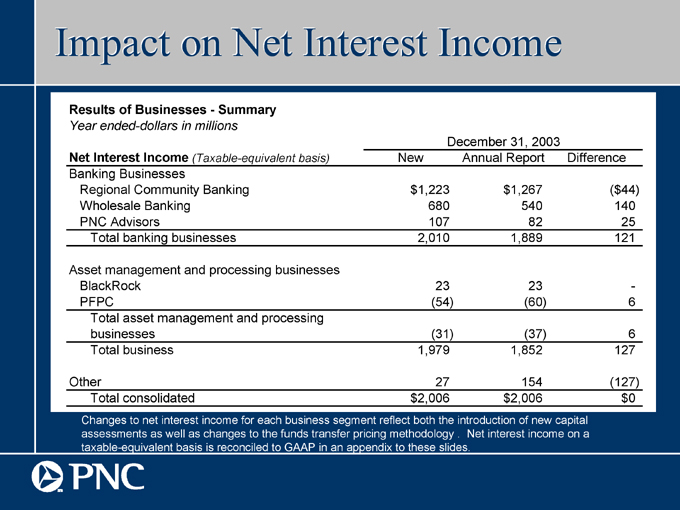
Impact on Net Interest Income
Results of BusinessesSummary
Year ended-dollars in millions
December 31, 2003
Net Interest Income (Taxable-equivalent basis) New Annual Report Difference
Banking Businesses
Regional Community Banking $ 1,223 $ 1,267 ($ 44)
Wholesale Banking 680 540 140
PNC Advisors 107 82 25
Total banking businesses 2,010 1,889 121
Asset management and processing businesses
BlackRock 23 23 -
PFPC (54) (60) 6
Total asset management and processing
businesses (31) (37) 6
Total business 1,979 1,852 127
Other 27 154 (127)
Total consolidated $ 2,006 $ 2,006 $ 0
Changes to net interest income for each business segment reflect both the introduction of new capital assessments as well as changes to the funds transfer pricing methodology . Net interest income on a taxable-equivalent basis is reconciled to GAAP in an appendix to these slides.
Other Changes to Noninterest Income and Expenses
Net securities gains and other noninterest income related to A&L activities moved from Regional Community Banking to Other
Certain other reclassifications have been made for comparative purposes related to our vehicle leasing and retail brokerage businesses

Todays Discussion
Enhancing PNC segment Bill Demchak
reporting Vice Chairman & CFO
Reviewing management
accounting and reporting Rick Johnson
methodologies Director of Finance
Questions and answers


Appendix

Cautionary Statement Regarding Forward-Looking Information
This presentation and other statements that the Corporation may make may contain forward-looking statements with respect to the Corporations outlook or expectations for earnings, revenues, expenses, capital levels, asset quality or other future financial or business performance, strategies or expectations, or the impact of legal, regulatory or supervisory matters on the Corporations business operations or performance. Forward-looking statements are typically identified by words or phrases such as believe, feel, expect, anticipate, intend, outlook, estimate, forecast, project, position, target, assume, achievable, potential, strategy, goal, objective, plan, aspiration, outcome, continue, remain, maintain, seek, strive, trend, and variations of such words and similar expressions, or future or conditional verbs such as will, would, should, could, might, can, may or similar expressions.
The Corporation cautions that forward-looking statements are subject to numerous assumptions, risks and uncertainties, which change over time. Forward-looking statements speak only as of the date they are made, and the Corporation assumes no duty and does not undertake to update forward-looking statements. Actual results or future events could differ, possibly materially, from those anticipated in forward-looking statements and future results could differ materially from historical performance.
The factors previously disclosed in the Corporations SEC reports (accessible on PNCs website at www.pnc.com and on the SECs website at www.sec.gov) and the following factors, among others, could cause actual results or future events to differ materially from those anticipated in forward-looking statements or from historical performance:
(1) changes in political, economic or industry conditions, the interest rate environment or financial and capital markets (including as a result of actions of the Federal Reserve Board affecting interest rates, money supply or otherwise reflecting changes in monetary policy), which could affect: (a) credit quality and the extent of credit losses; (b) the extent of funding of unfunded loan commitments and letters of credit; (c) allowances for credit losses and unfunded loan commitments and letters of credit; (d) demand for credit or fee-based products and services; (e) net interest income; (f) value of assets under management and assets serviced, of private equity investments, of other debt and equity investments, of loans held for sale, or of other on-balance sheet and off-balance sheet assets; or (g) the availability and terms of funding necessary to meet PNCs liquidity needs;
(2) the impact of legal and regulatory developments (including (a) the resolution of legal proceedings or regulatory and other governmental inquiries; (b) increased litigation risk from recent regulatory and other governmental developments; (c) the results of regulatory examination process, PNCs failure to satisfy the requirements of agreements with governmental agencies, and regulators future use of supervisory and enforcement tools; (d) legislative and regulatory reforms; and (e) changes in accounting policies and principles), with the impact of any such developments possibly affecting the ability of PNC to operate its businesses, PNCs financial condition, results of operations, or reputation, which in turn could have an impact on such matters as business generation and retention, the ability to attract and retain management, liquidity and funding;
(3) the impact of changes in the nature or extent of competition;
(4) the introduction, withdrawal, success and timing of business initiatives and strategies;

Cautionary Statement Regarding Forward-Looking Information (continued)
(5) customer acceptance of PNCs products and services and their borrowing, repayment, investment and deposit practices;
(6) the impact of changes in the extent of customer or counterparty delinquencies, bankruptcies or defaults that could affect, among other things, credit and asset quality risk and the provision for credit losses;
(7) the ability to identify and effectively manage risks inherent in PNCs business;
(8) how PNC chooses to redeploy available capital, including the extent and timing of any share repurchases and acquisitions or other investments in PNC businesses;
(9) the impact, extent and timing of technological changes, the adequacy of intellectual property protection and costs associated with obtaining rights in intellectual property claimed by others;
(10) the timing and pricing of any sales of loans or other financial assets held for sale;
(11) the ability of PNC to obtain desirable levels of insurance and whether or not insurance coverage for claims by PNC is denied;
(12) relative and absolute investment performance of assets under management; and
(13) the extent of terrorist activities and international hostilities, increases or continuations of which may adversely affect the economy and financial and capital markets generally or PNC specifically.
In addition, PNCs forward-looking statements are also subject to risks and uncertainties related to the United National Bancorp acquisition and the expected consequences of the integration of its business into that of PNC, including the following: (a) the integration of United Nationals business and operations into PNC, which will include conversion of UnitedTrust Banks different systems and procedures, may take longer than anticipated or be more costly than anticipated or have unanticipated adverse results relating to PNCs businesses, including those acquired in the acquisition; (b) the anticipated cost savings of the acquisition may take longer than expected to be realized, may not be achieved, or may not be achieved in their entirety; and (c) the anticipated benefits to PNC are dependent in part on the performance of United Nationals business in the future, and there can be no assurance as to actual future results, which could be impacted by various factors, including the risks and uncertainties generally related to the performance of PNCs and United Nationals businesses (with respect to United National, see United Nationals SEC reports, also accessible on the SECs website) or due to factors related to the acquisition of United National and the process of integrating it into PNC. Any future mergers, acquisitions, restructurings, divestitures or related transactions will also be subject to similar risks and uncertainties related to the ability to realize expected cost savings or revenue enhancements or to implement integration plans.
Any annualized, proforma, estimated, third party or consensus numbers in this presentation are used for illustrative or comparative purposes only and may not reflect actual results. Any consensus earnings estimates are calculated based on the earnings projections made by analysts who cover that company. The analysts opinions, estimates or forecasts (and therefore the consensus earnings estimates) are theirs alone, are not those of PNC or its management, and may not reflect PNCs actual or anticipated results.
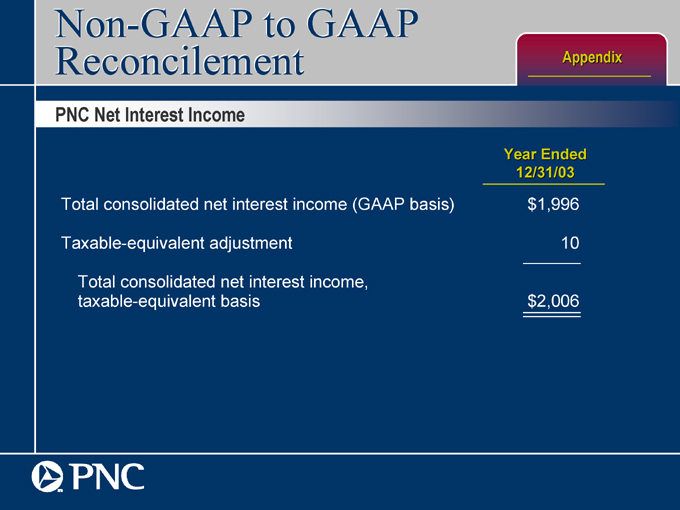
Non-GAAP to GAAP
Reconcilement Appendix
PNC Net Interest Income
Year Ended
12/31/03
Total consolidated net interest income (GAAP basis) $ 1,996
Taxable-equivalent adjustment 10
Total consolidated net interest income,
taxable-equivalent basis $ 2,006
THE PNC FINANCIAL SERVICES GROUP, INC.
Results of BusinessesSummary
Year endeddollars in millions
|
Earnings (Loss) |
Revenue (a) |
Return on Capital (b) |
Average Assets (c) |
|||||||||||||||||||||||||||
| Earnings (Loss) |
2003 |
2002 |
2003 |
2002 |
2003 |
2002 |
2003 |
2002 |
||||||||||||||||||||||
| Banking Businesses |
||||||||||||||||||||||||||||||
| Regional Community Banking |
$ | 477 | $ | 469 | $ | 1,892 | $ | 1,830 | 21 | % | 21 | % | $ | 16,749 | $ | 16,024 | ||||||||||||||
| Wholesale Banking |
391 | 387 | 1,282 | 1,369 | 20 | 16 | 21,023 | 22,460 | ||||||||||||||||||||||
| PNC Advisors |
89 | 98 | 607 | 618 | 28 | 29 | 2,714 | 2,970 | ||||||||||||||||||||||
| Total banking businesses |
957 | 954 | 3,781 | 3,817 | 21 | 19 | 40,486 | 41,454 | ||||||||||||||||||||||
| Asset management and processing businesses |
||||||||||||||||||||||||||||||
| BlackRock |
155 | 133 | 598 | 577 | 23 | 24 | 967 | 864 | ||||||||||||||||||||||
| PFPC |
64 | 69 | 762 | 817 | 22 | 22 | 1,909 | 1,888 | ||||||||||||||||||||||
| Total asset management and processing businesses |
219 | 202 | 1,360 | 1,394 | 22 | 23 | 2,876 | 2,752 | ||||||||||||||||||||||
| Total business earnings |
1,176 | 1,156 | 5,141 | 5,211 | 21 | 20 | 43,362 | 44,206 | ||||||||||||||||||||||
| Intercompany eliminations |
(6 | ) | (9 | ) | (89 | ) | (101 | ) | (1,898 | ) | (1,971 | ) | ||||||||||||||||||
| Other |
(141 | ) | 53 | 211 | 297 | 25,815 | 24,354 | |||||||||||||||||||||||
| Results from continuing operations |
1,029 | 1,200 | 5,263 | 5,407 | 15 | 19 | 67,279 | 66,589 | ||||||||||||||||||||||
| Discontinued operations |
(16 | ) | ||||||||||||||||||||||||||||
| Results before cumulative effect of accounting change |
1,029 | 1,184 | 5,263 | 5,407 | 15 | 19 | 67,279 | 66,589 | ||||||||||||||||||||||
| Cumulative effect of accounting change |
(28 | ) | ||||||||||||||||||||||||||||
| Total consolidated |
$ | 1,001 | $ | 1,184 | $ | 5,263 | $ | 5,407 | 15 | 19 | $ | 67,279 | $ | 66,589 | ||||||||||||||||
| (a) | Business revenue is presented on a taxable-equivalent basis except for BlackRock and PFPC, which are presented on a book (GAAP) basis. The interest income earned on certain assets is completely or partially exempt from federal income tax. As such, these tax-exempt instruments typically yield lower returns than a taxable investment. In order to provide accurate comparisons of yields and margins for all earning assets, the interest income earned on tax-exempt assets has been increased to make them fully equivalent to other taxable interest income investments. A reconciliation of total consolidated revenue on a book basis to total consolidated revenue on a taxable-equivalent basis is as follows (in millions): |
|
2003 |
2002 |
|||||
| Total consolidated revenue, book (GAAP) basis |
$ | 5,253 | $ | 5,394 | ||
| Taxable-equivalent adjustment |
10 | 13 | ||||
| Total consolidated revenue, taxable-equivalent basis |
$ | 5,263 | $ | 5,407 | ||
| (b) | Percentages for BlackRock reflect return on equity. |
| (c) | Period-end balances for BlackRock. |
THE PNC FINANCIAL SERVICES GROUP, INC.
Results of BusinessesSummary (Unaudited) (a)
Quarter endeddollars in millions
| Earnings (Loss) |
December 31 2003 |
September 30 2003 |
June 30 2003 |
March 31 2003 |
December 31 2002 |
September 30 2002 |
June 30 2002 |
March 31 2002 |
||||||||||||||||||||||||
| Banking Businesses |
||||||||||||||||||||||||||||||||
| Regional Community Banking |
$ | 127 | $ | 122 | $ | 122 | $ | 106 | $ | 124 | $ | 111 | $ | 125 | $ | 109 | ||||||||||||||||
| Wholesale Banking |
117 | 97 | 83 | 94 | 106 | 84 | 112 | 85 | ||||||||||||||||||||||||
| PNC Advisors |
20 | 25 | 24 | 20 | 13 | 21 | 31 | 33 | ||||||||||||||||||||||||
| Total banking businesses |
264 | 244 | 229 | 220 | 243 | 216 | 268 | 227 | ||||||||||||||||||||||||
| Asset management and processing businesses |
||||||||||||||||||||||||||||||||
| BlackRock |
41 | 40 | 39 | 35 | 34 | 33 | 35 | 31 | ||||||||||||||||||||||||
| PFPC |
18 | 17 | 16 | 13 | 9 | 19 | 23 | 18 | ||||||||||||||||||||||||
| Total asset management and processing businesses |
59 | 57 | 55 | 48 | 43 | 52 | 58 | 49 | ||||||||||||||||||||||||
| Total business earnings |
323 | 301 | 284 | 268 | 286 | 268 | 326 | 276 | ||||||||||||||||||||||||
| Intercompany eliminations |
(1 | ) | (2 | ) | (1 | ) | (2 | ) | (2 | ) | (4 | ) | (1 | ) | (2 | ) | ||||||||||||||||
| Other |
(20 | ) | (18 | ) | (99 | ) | (4 | ) | (6 | ) | 21 | (5 | ) | 43 | ||||||||||||||||||
| Results from continuing operations |
302 | 281 | 184 | 262 | 278 | 285 | 320 | 317 | ||||||||||||||||||||||||
| Discontinued operations |
(16 | ) | ||||||||||||||||||||||||||||||
| Results before cumulative effect of accounting change |
302 | 281 | 184 | 262 | 262 | 285 | 320 | 317 | ||||||||||||||||||||||||
| Cumulative effect of accounting change |
(28 | ) | ||||||||||||||||||||||||||||||
| Total consolidated |
$ | 274 | $ | 281 | $ | 184 | $ | 262 | $ | 262 | $ | 285 | $ | 320 | $ | 317 | ||||||||||||||||
| Revenue (b) |
December 31 2003 |
September 30 2003 |
June 30 2003 |
March 31 2003 |
December 31 2002 |
September 30 2002 |
June 30 2002 |
March 31 2002 |
||||||||||||||||||||||||
| Banking Businesses |
||||||||||||||||||||||||||||||||
| Regional Community Banking |
$ | 489 | $ | 478 | $ | 479 | $ | 446 | $ | 470 | $ | 455 | $ | 461 | $ | 444 | ||||||||||||||||
| Wholesale Banking |
330 | 328 | 300 | 324 | 343 | 316 | 377 | 333 | ||||||||||||||||||||||||
| PNC Advisors |
157 | 154 | 152 | 144 | 143 | 143 | 163 | 169 | ||||||||||||||||||||||||
| Total banking businesses |
976 | 960 | 931 | 914 | 956 | 914 | 1,001 | 946 | ||||||||||||||||||||||||
| Asset Management and Processing Businesses |
||||||||||||||||||||||||||||||||
| BlackRock |
161 | 150 | 144 | 143 | 137 | 137 | 157 | 146 | ||||||||||||||||||||||||
| PFPC |
194 | 188 | 187 | 193 | 195 | 192 | 217 | 213 | ||||||||||||||||||||||||
| Total asset management and processing businesses |
355 | 338 | 331 | 336 | 332 | 329 | 374 | 359 | ||||||||||||||||||||||||
| Total business revenue |
1,331 | 1,298 | 1,262 | 1,250 | 1,288 | 1,243 | 1,375 | 1,305 | ||||||||||||||||||||||||
| Intercompany eliminations |
(21 | ) | (21 | ) | (25 | ) | (22 | ) | (22 | ) | (27 | ) | (23 | ) | (29 | ) | ||||||||||||||||
| Other |
39 | 37 | 62 | 73 | 27 | 87 | 76 | 107 | ||||||||||||||||||||||||
| Total consolidated |
$ | 1,349 | $ | 1,314 | $ | 1,299 | $ | 1,301 | $ | 1,293 | $ | 1,303 | $ | 1,428 | $ | 1,383 | ||||||||||||||||
THE FINANCIAL SERVICES GROUP, INC.
Results of BusinessSummary (Unaudited) (a)
Quarter endeddollars in millions
| (a) | See Review of Businesses within the Financial Review section of the Corporation's 2002 Annual Report to Shareholders included as Exhibit 13 in the Corporation's 2002 Annual Report on Form 10-K for additional information regarding presentation of results for the Corporation's major businesses. The Corporation's line of business information is based on management information systems, assumptions and methodologies that are under review on an ongoing basis. |
| (b) | Business revenue is presented on a taxable-equivalent basis except for BlackRock and PFPC, which are presented on a book (GAAP) basis. The interest income earned on certain assets is completely or partially exempt from federal income tax. As such, these tax-exempt instruments typically yield lower returns than a taxable investment. In order to provide accurate comparisons of yields and margins for all earning assets, the interest income earned on tax-exempt assets has been increased to make them fully equivalent to other taxable interest income investments. A reconciliation of total consolidated revenue on a book basis to total consolidated revenue on a taxable-equivalent basis is as follows (in millions): |
| December 31 2003 |
September 30 2003 |
June 30 2003 |
March 31 2003 |
December 31 2002 |
September 30 2002 |
June 30 2002 |
March 31 2002 |
|||||||||||||||||
| Total consolidated revenue, book (GAAP) basis |
$ | 1,346 | $ | 1,312 | $ | 1,297 | $ | 1,298 | $ | 1,290 | $ | 1,299 | $ | 1,425 | $ | 1,380 | ||||||||
| Taxable-equivalent adjustment |
3 | 2 | 2 | 3 | 3 | 4 | 3 | 3 | ||||||||||||||||
| Total consolidated revenue, taxable-equivalent basis |
$ | 1,349 | $ | 1,314 | $ | 1,299 | $ | 1,301 | $ | 1,293 | $ | 1,303 | $ | 1,428 | $ | 1,383 | ||||||||
THE PNC FINANCIAL SERVICES GROUP, INC.
Regional Community Banking (Unaudited)
Quarter ended
| Taxable-equivalent basis Dollars in millions |
December 31 2003 |
September 30 2003 |
June 30 2003 |
March 31 2003 |
December 31 2002 |
September 30 2002 |
June 30 2002 |
March 31 2002 |
||||||||||||||||||||||||
| INCOME STATEMENT |
||||||||||||||||||||||||||||||||
| Net interest income |
$ | 314 | $ | 310 | $ | 307 | $ | 292 | $ | 297 | $ | 290 | $ | 297 | $ | 290 | ||||||||||||||||
| Noninterest income |
175 | 168 | 172 | 154 | 173 | 165 | 164 | 154 | ||||||||||||||||||||||||
| Total revenue |
489 | 478 | 479 | 446 | 470 | 455 | 461 | 444 | ||||||||||||||||||||||||
| Provision for credit losses |
14 | 9 | 11 | 6 | 13 | 14 | 9 | 10 | ||||||||||||||||||||||||
| Noninterest expense |
276 | 277 | 276 | 273 | 262 | 265 | 255 | 261 | ||||||||||||||||||||||||
| Pretax earnings |
199 | 192 | 192 | 167 | 195 | 176 | 197 | 173 | ||||||||||||||||||||||||
| Income taxes |
72 | 70 | 70 | 61 | 71 | 65 | 72 | 64 | ||||||||||||||||||||||||
| Earnings |
$ | 127 | $ | 122 | $ | 122 | $ | 106 | $ | 124 | $ | 111 | $ | 125 | $ | 109 | ||||||||||||||||
| AVERAGE BALANCE SHEET |
||||||||||||||||||||||||||||||||
| Loans |
||||||||||||||||||||||||||||||||
| Consumer |
||||||||||||||||||||||||||||||||
| Home equity |
$ | 8,926 | $ | 8,476 | $ | 8,047 | $ | 7,675 | $ | 7,395 | $ | 7,238 | $ | 7,031 | $ | 6,733 | ||||||||||||||||
| Indirect |
510 | 492 | 468 | 438 | 457 | 508 | 567 | 633 | ||||||||||||||||||||||||
| Other consumer |
474 | 504 | 516 | 546 | 584 | 611 | 641 | 698 | ||||||||||||||||||||||||
| Total consumer |
9,910 | 9,472 | 9,031 | 8,659 | 8,436 | 8,357 | 8,239 | 8,064 | ||||||||||||||||||||||||
| Commercial |
3,934 | 3,911 | 4,001 | 3,939 | 3,856 | 3,754 | 3,576 | 3,511 | ||||||||||||||||||||||||
| Other |
526 | 586 | 633 | 676 | 736 | 967 | 1,054 | 1,115 | ||||||||||||||||||||||||
| Total loans |
14,370 | 13,969 | 13,665 | 13,274 | 13,028 | 13,078 | 12,869 | 12,690 | ||||||||||||||||||||||||
| Securities |
||||||||||||||||||||||||||||||||
| Education and other loans held for sale |
1,158 | 1,105 | 1,197 | 1,197 | 1,215 | 1,180 | 1,397 | 1,488 | ||||||||||||||||||||||||
| Other assets |
1,750 | 1,808 | 1,738 | 1,750 | 1,752 | 1,804 | 1,767 | 1,828 | ||||||||||||||||||||||||
| Total assets |
$ | 17,278 | $ | 16,882 | $ | 16,600 | $ | 16,221 | $ | 15,995 | $ | 16,062 | $ | 16,033 | $ | 16,006 | ||||||||||||||||
| Deposits |
||||||||||||||||||||||||||||||||
| Noninterest-bearing demand |
$ | 5,799 | $ | 5,739 | $ | 5,471 | $ | 5,264 | $ | 5,228 | $ | 5,103 | $ | 4,999 | $ | 4,879 | ||||||||||||||||
| Interest-bearing demand |
6,601 | 6,397 | 6,136 | 6,112 | 6,191 | 6,008 | 6,002 | 6,053 | ||||||||||||||||||||||||
| Money market |
12,140 | 12,307 | 12,407 | 12,361 | 12,182 | 12,299 | 12,348 | 12,292 | ||||||||||||||||||||||||
| Total transaction deposits |
24,540 | 24,443 | 24,014 | 23,737 | 23,601 | 23,410 | 23,349 | 23,224 | ||||||||||||||||||||||||
| Savings |
2,020 | 2,050 | 2,046 | 1,976 | 1,949 | 1,979 | 1,995 | 1,924 | ||||||||||||||||||||||||
| Certificates |
8,047 | 8,234 | 8,666 | 9,360 | 9,670 | 10,017 | 10,207 | 10,310 | ||||||||||||||||||||||||
| Total deposits |
34,607 | 34,727 | 34,726 | 35,073 | 35,220 | 35,406 | 35,551 | 35,458 | ||||||||||||||||||||||||
| Other liabilities |
147 | 158 | 177 | 190 | 196 | 209 | 231 | 264 | ||||||||||||||||||||||||
| Capital |
2,218 | 2,227 | 2,228 | 2,251 | 2,261 | 2,273 | 2,284 | 2,280 | ||||||||||||||||||||||||
| Total funds |
$ | 36,972 | $ | 37,112 | $ | 37,131 | $ | 37,514 | $ | 37,678 | $ | 37,888 | $ | 38,065 | $ | 38,002 | ||||||||||||||||
| PERFORMANCE RATIOS |
||||||||||||||||||||||||||||||||
| Return on capital |
23 | % | 22 | % | 22 | % | 19 | % | 22 | % | 19 | % | 22 | % | 19 | % | ||||||||||||||||
| Noninterest income to total revenue |
36 | 35 | 36 | 35 | 37 | 36 | 36 | 35 | ||||||||||||||||||||||||
| Efficiency |
56 | 58 | 58 | 61 | 56 | 58 | 55 | 59 | ||||||||||||||||||||||||
| OTHER INFORMATION (a) |
||||||||||||||||||||||||||||||||
| Total nonperforming assets |
$ | 85 | $ | 72 | $ | 73 | $ | 83 | $ | 79 | $ | 63 | $ | 60 | $ | 55 | ||||||||||||||||
| Net charge-offs |
$ | 12 | $ | 10 | $ | 11 | $ | 11 | $ | 14 | $ | 14 | $ | 10 | $ | 10 | ||||||||||||||||
| Home equity portfolio credit statistics: |
||||||||||||||||||||||||||||||||
| Percentage of first lien positions |
51 | % | 50 | % | 46 | % | 43 | % | 40 | % | 37 | % | 36 | % | 34 | % | ||||||||||||||||
| Weighted average loan-to-value ratios |
70 | % | 70 | % | 72 | % | 70 | % | 70 | % | 70 | % | 73 | % | 69 | % | ||||||||||||||||
| Weighted average FICO scores |
713 | 712 | 712 | 709 | 709 | 708 | 710 | 691 | ||||||||||||||||||||||||
| Gains on sales of education loans (b) |
$ | 8 | $ | 4 | $ | 7 | $ | 1 | $ | 10 | $ | 3 | $ | 9 | $ | 1 | ||||||||||||||||
| Average FTE staff |
9,589 | 9,643 | 9,559 | 9,461 | 9,644 | 9,754 | 9,638 | 9,732 | ||||||||||||||||||||||||
| ATMs |
3,600 | 3,664 | 3,660 | 3,594 | 3,550 | 3,450 | 3,350 | 3,300 | ||||||||||||||||||||||||
| Branches |
719 | 715 | 713 | 713 | 714 | 714 | 713 | 714 | ||||||||||||||||||||||||
| Financial consultants |
797 | 805 | 795 | 768 | 753 | 734 | 760 | 707 | ||||||||||||||||||||||||
| Business banking centers |
208 | 208 | 193 | 193 | 193 | 188 | 158 | 140 | ||||||||||||||||||||||||
| Checking relationships |
1,611,000 | 1,606,000 | 1,575,000 | 1,555,000 | 1,542,000 | 1,538,000 | 1,494,000 | 1,465,000 | ||||||||||||||||||||||||
| Online banking users |
762,000 | 728,000 | 684,000 | 647,000 | 607,000 | 563,471 | 508,608 | 466,213 | ||||||||||||||||||||||||
| Deposit households using online banking |
43.2 | % | 41.7 | % | 40.2 | % | 38.6 | % | 36.6 | % | 34.7 | % | 32.6 | % | 30.8 | % | ||||||||||||||||
| (a) | Presented as of period-end, except for net charge-offs, gains on sales of education loans and average FTEs. |
| (b) | Included in other noninterest income above. |
THE PNC FINANCIAL SERVICES GROUP, INC.
Regional Community Banking (Unaudited)
Year ended
| Taxable-equivalent basis Dollars in millions |
December 31 2003 |
December 31 2002 |
||||||
| INCOME STATEMENT |
||||||||
| Net interest income |
$ | 1,223 | $ | 1,174 | ||||
| Noninterest income |
669 | 656 | ||||||
| Total revenue |
1,892 | 1,830 | ||||||
| Provision for credit losses |
40 | 46 | ||||||
| Noninterest expense |
1,102 | 1,043 | ||||||
| Pretax earnings |
750 | 741 | ||||||
| Income taxes |
273 | 272 | ||||||
| Earnings |
$ | 477 | $ | 469 | ||||
| AVERAGE BALANCE SHEET |
||||||||
| Loans |
||||||||
| Consumer |
||||||||
| Home equity |
$ | 8,285 | $ | 7,101 | ||||
| Indirect |
477 | 541 | ||||||
| Other consumer |
510 | 633 | ||||||
| Total consumer |
9,272 | 8,275 | ||||||
| Commercial |
3,946 | 3,675 | ||||||
| Other |
605 | 967 | ||||||
| Total loans |
13,823 | 12,917 | ||||||
| Education and other loans held for sale |
1,164 | 1,319 | ||||||
| Other assets |
1,762 | 1,788 | ||||||
| Total assets |
$ | 16,749 | $ | 16,024 | ||||
| Deposits |
||||||||
| Noninterest-bearing demand |
$ | 5,570 | $ | 5,053 | ||||
| Interest-bearing demand |
6,313 | 6,064 | ||||||
| Money market |
12,303 | 12,280 | ||||||
| Total transaction deposits |
24,186 | 23,397 | ||||||
| Savings |
2,023 | 1,962 | ||||||
| Certificates |
8,572 | 10,049 | ||||||
| Total deposits |
34,781 | 35,408 | ||||||
| Other liabilities |
168 | 225 | ||||||
| Capital |
2,231 | 2,274 | ||||||
| Total funds |
$ | 37,180 | $ | 37,907 | ||||
| PERFORMANCE RATIOS |
||||||||
| Return on capital |
21 | % | 21 | % | ||||
| Noninterest income to total revenue |
35 | 36 | ||||||
| Efficiency |
58 | 57 | ||||||
| OTHER INFORMATION (a) |
||||||||
| Total nonperforming assets |
$ | 85 | $ | 79 | ||||
| Net charge-offs |
$ | 44 | $ | 48 | ||||
| Home equity portfolio credit statistics: |
||||||||
| Percentage of first lien positions |
51 | % | 40 | % | ||||
| Weighted average loan-to-value ratios |
70 | % | 70 | % | ||||
| Weighted average FICO scores |
713 | 709 | ||||||
| Gains on sales of education loans (b) |
$ | 20 | $ | 23 | ||||
| Average FTE staff |
9,564 | 9,692 | ||||||
| ATMs |
3,600 | 3,550 | ||||||
| Branches |
719 | 714 | ||||||
| Financial consultants |
797 | 753 | ||||||
| Business banking centers |
208 | 193 | ||||||
| Checking relationships |
1,611,000 | 1,542,000 | ||||||
| Online banking users |
762,000 | 607,000 | ||||||
| Deposit households using online banking |
43.2 | % | 36.6 | % | ||||
| (a) | Presented as of period-end, except for net charge-offs, gains on sales of education loans and average FTEs. |
| (b) | Included in other noninterest income above. |
THE PNC FINANCIAL SERVICES GROUP, INC.
Wholesale Banking (Unaudited)
Quarter ended
| Taxable-equivalent basis Dollars in millions |
December 31 2003 |
September 30 2003 |
June 30 2003 |
March 31 2003 |
December 31 2002 |
September 30 2002 |
June 30 2002 |
March 31 2002 |
||||||||||||||||||||||||
| INCOME STATEMENT |
||||||||||||||||||||||||||||||||
| Net interest income |
$ | 170 | $ | 172 | $ | 167 | $ | 171 | $ | 180 | $ | 190 | $ | 199 | $ | 199 | ||||||||||||||||
| Noninterest income |
160 | 156 | 133 | 153 | 163 | 126 | 178 | 134 | ||||||||||||||||||||||||
| Total revenue |
330 | 328 | 300 | 324 | 343 | 316 | 377 | 333 | ||||||||||||||||||||||||
| Provision for credit losses |
9 | 38 | 45 | 29 | 54 | 55 | 77 | 70 | ||||||||||||||||||||||||
| Noninterest expense |
167 | 161 | 144 | 162 | 142 | 149 | 140 | 147 | ||||||||||||||||||||||||
| Pretax earnings |
154 | 129 | 111 | 133 | 147 | 112 | 160 | 116 | ||||||||||||||||||||||||
| Noncontrolling interests in income of consolidated entities |
(8 | ) | (11 | ) | (2 | ) | 0 | 0 | (2 | ) | 0 | 0 | ||||||||||||||||||||
| Income taxes |
45 | 43 | 30 | 39 | 41 | 30 | 48 | 31 | ||||||||||||||||||||||||
| Earnings |
$ | 117 | $ | 97 | $ | 83 | $ | 94 | $ | 106 | $ | 84 | $ | 112 | $ | 85 | ||||||||||||||||
| AVERAGE BALANCE SHEET |
||||||||||||||||||||||||||||||||
| Loans |
||||||||||||||||||||||||||||||||
| Corporate banking |
$ | 7,848 | $ | 8,017 | $ | 8,262 | $ | 8,604 | $ | 8,824 | $ | 9,180 | $ | 9,656 | $ | 9,901 | ||||||||||||||||
| Commerical real estate |
1,647 | 1,841 | 1,953 | 2,052 | 2,167 | 2,279 | 2,241 | 2,224 | ||||||||||||||||||||||||
| Commericalreal estate related |
1,350 | 1,431 | 1,438 | 1,397 | 1,464 | 1,407 | 1,466 | 1,559 | ||||||||||||||||||||||||
| Business Credit |
3,658 | 3,633 | 3,528 | 3,381 | 3,489 | 3,525 | 3,641 | 3,484 | ||||||||||||||||||||||||
| Total loans |
14,503 | 14,922 | 15,181 | 15,434 | 15,944 | 16,391 | 17,004 | 17,168 | ||||||||||||||||||||||||
| Purchased customer receivables |
2,384 | 2,496 | 0 | 0 | 0 | 0 | 0 | 0 | ||||||||||||||||||||||||
| Loans held for sale |
549 | 436 | 628 | 678 | 910 | 1,172 | 2,206 | 3,140 | ||||||||||||||||||||||||
| Other assets |
4,575 | 4,294 | 4,081 | 3,894 | 4,222 | 4,052 | 3,894 | 3,780 | ||||||||||||||||||||||||
| Total assets |
$ | 22,011 | $ | 22,148 | $ | 19,890 | $ | 20,006 | $ | 21,076 | $ | 21,615 | $ | 23,104 | $ | 24,088 | ||||||||||||||||
| Deposits |
$ | 6,641 | $ | 6,543 | $ | 6,120 | $ | 6,106 | $ | 5,879 | $ | 5,534 | $ | 5,344 | $ | 5,140 | ||||||||||||||||
| Commercial paper |
2,386 | 2,502 | 0 | 0 | 0 | 0 | 0 | 0 | ||||||||||||||||||||||||
| Other liabilities |
3,707 | 3,405 | 3,152 | 2,720 | 2,829 | 2,727 | 2,510 | 2,370 | ||||||||||||||||||||||||
| Capital |
1,942 | 2,001 | 2,019 | 2,013 | 2,300 | 2,384 | 2,519 | 2,519 | ||||||||||||||||||||||||
| Total funds |
$ | 14,676 | $ | 14,451 | $ | 11,291 | $ | 10,839 | $ | 11,008 | $ | 10,645 | $ | 10,373 | $ | 10,029 | ||||||||||||||||
| PERFORMANCE RATIOS |
||||||||||||||||||||||||||||||||
| Return on capital |
24 | % | 19 | % | 16 | % | 19 | % | 18 | % | 14 | % | 18 | % | 14 | % | ||||||||||||||||
| Noninterest income to total revenue |
48 | 48 | 44 | 47 | 48 | 40 | 47 | 40 | ||||||||||||||||||||||||
| Efficiency |
51 | 49 | 48 | 50 | 41 | 47 | 37 | 44 | ||||||||||||||||||||||||
| COMMERCIAL MORTGAGE SERVICING PORTFOLIO (a) |
||||||||||||||||||||||||||||||||
| Beginning of period |
$ | 80 | $ | 79 | $ | 75 | $ | 74 | $ | 74 | $ | 71 | $ | 69 | $ | 68 | ||||||||||||||||
| Acquisitions/additions |
6 | 5 | 7 | 5 | 4 | 6 | 5 | 4 | ||||||||||||||||||||||||
| Repayments/transfers |
(3 | ) | (4 | ) | (3 | ) | (4 | ) | (4 | ) | (3 | ) | (3 | ) | (3 | ) | ||||||||||||||||
| End of period |
$ | 83 | $ | 80 | $ | 79 | $ | 75 | $ | 74 | $ | 74 | $ | 71 | $ | 69 | ||||||||||||||||
| OTHER INFORMATION |
||||||||||||||||||||||||||||||||
| Total nonperforming assets |
$ | 227 | $ | 311 | $ | 324 | $ | 317 | $ | 331 | $ | 340 | $ | 431 | $ | 375 | ||||||||||||||||
| Net charge-offs |
$ | 34 | $ | 51 | $ | 50 | $ | 23 | $ | 21 | $ | 54 | $ | 60 | $ | 28 | ||||||||||||||||
| NBOC put option liability |
$ | 0 | $ | 0 | $ | 43 | $ | 49 | $ | 57 | $ | 78 | $ | 86 | $ | 107 | ||||||||||||||||
| NBOC put option valuation income (b) |
$ | 0 | $ | 1 | $ | 1 | $ | 6 | $ | 9 | $ | 4 | $ | 10 | $ | 5 | ||||||||||||||||
| Average FTE staff |
2,873 | 2,876 | 2,884 | 2,991 | 3,138 | 3,123 | 3,135 | 3,215 | ||||||||||||||||||||||||
| Net carrying amount of commercial mortgage servicing rights |
$ | 209 | $ | 200 | $ | 199 | $ | 201 | $ | 201 | $ | 201 | $ | 200 | $ | 199 | ||||||||||||||||
| Institutional lending repositioning |
||||||||||||||||||||||||||||||||
| Loans held for sale |
||||||||||||||||||||||||||||||||
| Credit exposure |
$ | 104 | $ | 150 | $ | 199 | $ | 344 | $ | 626 | $ | 1,078 | $ | 2,019 | $ | 3,874 | ||||||||||||||||
| Outstandings |
$ | 70 | $ | 98 | $ | 126 | $ | 181 | $ | 298 | $ | 495 | $ | 1,066 | $ | 1,975 | ||||||||||||||||
| Exit portfolio |
||||||||||||||||||||||||||||||||
| Credit exposure |
$ | 51 | $ | 61 | $ | 251 | $ | 374 | $ | 438 | $ | 636 | $ | 1,203 | $ | 1,970 | ||||||||||||||||
| Outstandings |
$ | 0 | $ | 10 | $ | 11 | $ | 9 | $ | 4 | $ | 25 | $ | 18 | $ | 113 | ||||||||||||||||
| Net gains on loans held for sale (b) |
$ | 16 | $ | 23 | $ | 15 | $ | 15 | $ | 52 | $ | 17 | $ | 55 | $ | 23 | ||||||||||||||||
| (a) | Dollars in billions. |
| (b) | Included in noninterest income above. |
THE PNC FINANCIAL SERVICES GROUP, INC.
Wholesale Banking (Unaudited)
| Year ended Taxable-equivalent basis Dollars in millions |
December 31 2003 |
December 31 2002 |
||||||
| INCOME STATEMENT |
||||||||
| Net interest income |
$ | 680 | $ | 768 | ||||
| Noninterest income |
602 | 601 | ||||||
| Total revenue |
1,282 | 1,369 | ||||||
| Provision for credit losses |
121 | 256 | ||||||
| Noninterest expense |
634 | 578 | ||||||
| Pretax earnings |
527 | 535 | ||||||
| Noncontrolling interests in income of consolidated entities |
(21 | ) | (2 | ) | ||||
| Income taxes |
157 | 150 | ||||||
| Earnings |
$ | 391 | $ | 387 | ||||
| AVERAGE BALANCE SHEET |
||||||||
| Loans |
||||||||
| Corporate banking |
$ | 8,180 | $ | 9,387 | ||||
| Commerical real estate |
1,872 | 2,228 | ||||||
| Commericalreal estate related |
1,404 | 1,473 | ||||||
| Business Credit |
3,551 | 3,535 | ||||||
| Total loans |
15,007 | 16,623 | ||||||
| Purchased customer receivables |
1,230 | 0 | ||||||
| Loans held for sale |
572 | 1,849 | ||||||
| Other assets |
4,214 | 3,988 | ||||||
| Total assets |
$ | 21,023 | $ | 22,460 | ||||
| Deposits |
$ | 6,354 | $ | 5,477 | ||||
| Commercial paper |
1,232 | 0 | ||||||
| Other liabilities |
3,250 | 2,610 | ||||||
| Capital |
1,994 | 2,430 | ||||||
| Total funds |
$ | 12,830 | $ | 10,517 | ||||
| PERFORMANCE RATIOS |
||||||||
| Return on capital |
20 | % | 16 | % | ||||
| Noninterest income to total revenue |
47 | 44 | ||||||
| Efficiency |
49 | 42 | ||||||
| COMMERCIAL MORTGAGE SERVICING PORTFOLIO (a) |
||||||||
| January 1 |
$ | 74 | $ | 68 | ||||
| Acquisitions/additions |
23 | 19 | ||||||
| Repayments/transfers |
(14 | ) | (13 | ) | ||||
| December 31 |
$ | 83 | $ | 74 | ||||
| OTHER INFORMATION |
||||||||
| Total nonperforming assets |
$ | 227 | $ | 331 | ||||
| Net charge-offs |
$ | 158 | $ | 163 | ||||
| NBOC put option liability |
$ | 0 | $ | 57 | ||||
| NBOC put option valuation income (b) |
$ | 8 | $ | 28 | ||||
| Average FTE staff |
2,885 | 3,153 | ||||||
| Net carrying amount of commercial mortgage servicing rights |
$ | 209 | $ | 201 | ||||
| Institutional lending repositioning |
||||||||
| Loans held for sale |
||||||||
| Credit exposure |
$ | 104 | $ | 626 | ||||
| Outstandings |
$ | 70 | $ | 298 | ||||
| Exit portfolio |
||||||||
| Credit exposure |
$ | 51 | $ | 438 | ||||
| Outstandings |
$ | 0 | $ | 4 | ||||
| Net gains on loans held for sale (b) |
$ | 69 | $ | 147 | ||||
| (a) | Dollars in billions. |
| (b) | Included in noninterest income above. |
THE PNC FINANCIAL SERVICES GROUP, INC.
PNC Advisors (Unaudited)
| Quarter ended Taxable-equivalent basis Dollars in millions |
December 31 2003 |
September 30 2003 |
June 30 2003 |
March 31 2003 |
December 31 2002 |
September 30 2002 |
June 30 2002 |
March 31 2002 |
|||||||||||||||||||||||
| INCOME STATEMENT |
|||||||||||||||||||||||||||||||
| Net interest income |
$ | 27 | $ | 27 | $ | 27 | $ | 26 | $ | 26 | $ | 25 | $ | 28 | $ | 27 | |||||||||||||||
| Noninterest income |
|||||||||||||||||||||||||||||||
| Investment management and trust |
81 | 78 | 78 | 76 | 76 | 77 | 89 | 92 | |||||||||||||||||||||||
| Brokerage |
29 | 25 | 25 | 22 | 22 | 22 | 28 | 27 | |||||||||||||||||||||||
| Other |
20 | 24 | 22 | 20 | 19 | 19 | 18 | 23 | |||||||||||||||||||||||
| Total noninterest income |
130 | 127 | 125 | 118 | 117 | 118 | 135 | 142 | |||||||||||||||||||||||
| Total revenue |
157 | 154 | 152 | 144 | 143 | 143 | 163 | 169 | |||||||||||||||||||||||
| Provision for credit losses |
1 | 1 | 1 | 0 | 1 | 2 | 1 | 0 | |||||||||||||||||||||||
| Noninterest expense |
124 | 114 | 113 | 113 | 121 | 108 | 113 | 117 | |||||||||||||||||||||||
| Pretax earnings |
32 | 39 | 38 | 31 | 21 | 33 | 49 | 52 | |||||||||||||||||||||||
| Income taxes |
12 | 14 | 14 | 11 | 8 | 12 | 18 | 19 | |||||||||||||||||||||||
| Earnings |
$ | 20 | $ | 25 | $ | 24 | $ | 20 | $ | 13 | $ | 21 | $ | 31 | $ | 33 | |||||||||||||||
| AVERAGE BALANCE SHEET |
|||||||||||||||||||||||||||||||
| Loans |
|||||||||||||||||||||||||||||||
| Consumer |
$ | 1,371 | $ | 1,331 | $ | 1,284 | $ | 1,280 | $ | 1,263 | $ | 1,251 | $ | 1,226 | $ | 1,170 | |||||||||||||||
| Residential mortgage |
173 | 216 | 263 | 327 | 392 | 464 | 535 | 613 | |||||||||||||||||||||||
| Commercial |
415 | 463 | 435 | 439 | 438 | 433 | 515 | 499 | |||||||||||||||||||||||
| Other |
291 | 287 | 286 | 284 | 282 | 313 | 341 | 349 | |||||||||||||||||||||||
| Total loans |
2,250 | 2,297 | 2,268 | 2,330 | 2,375 | 2,461 | 2,617 | 2,631 | |||||||||||||||||||||||
| Other assets |
411 | 434 | 429 | 437 | 442 | 433 | 448 | 477 | |||||||||||||||||||||||
| Total assets |
$ | 2,661 | $ | 2,731 | $ | 2,697 | $ | 2,767 | $ | 2,817 | $ | 2,894 | $ | 3,065 | $ | 3,108 | |||||||||||||||
| Deposits |
$ | 2,175 | $ | 2,181 | $ | 2,098 | $ | 2,108 | $ | 2,039 | $ | 1,979 | $ | 2,023 | $ | 2,077 | |||||||||||||||
| Assigned funds and other liabilities |
262 | 260 | 253 | 261 | 252 | 277 | 321 | 336 | |||||||||||||||||||||||
| Capital |
305 | 308 | 314 | 326 | 329 | 338 | 345 | 345 | |||||||||||||||||||||||
| Total funds |
$ | 2,742 | $ | 2,749 | $ | 2,665 | $ | 2,695 | $ | 2,620 | $ | 2,594 | $ | 2,689 | $ | 2,758 | |||||||||||||||
| PERFORMANCE RATIOS |
|||||||||||||||||||||||||||||||
| Return on assigned capital |
26 | % | 32 | % | 31 | % | 25 | % | 16 | % | 25 | % | 36 | % | 39 | ||||||||||||||||
| Noninterest income to total revenue |
83 | 82 | 82 | 82 | 82 | 83 | 83 | 84 | |||||||||||||||||||||||
| Efficiency |
79 | 74 | 74 | 78 | 85 | 76 | 69 | 69 | |||||||||||||||||||||||
| ASSETS UNDER ADMINISTRATION (in billions) (a) (b) |
|
||||||||||||||||||||||||||||||
| Assets under management |
|||||||||||||||||||||||||||||||
| Personal |
$ | 44 | $ | 42 | $ | 42 | $ | 40 | $ | 41 | $ | 40 | $ | 45 | $ | 48 | |||||||||||||||
| Institutional |
9 | 9 | 9 | 9 | 9 | 10 | 11 | 12 | |||||||||||||||||||||||
| Total |
$ | 53 | $ | 51 | $ | 51 | $ | 49 | $ | 50 | $ | 50 | $ | 56 | $ | 60 | |||||||||||||||
| Asset Type |
|||||||||||||||||||||||||||||||
| Equity |
$ | 31 | $ | 28 | $ | 28 | $ | 25 | $ | 26 | $ | 26 | $ | 31 | $ | 36 | |||||||||||||||
| Fixed income |
16 | 16 | 16 | 16 | 17 | 17 | 18 | 17 | |||||||||||||||||||||||
| Liquidity/other |
6 | 7 | 7 | 8 | 7 | 7 | 7 | 7 | |||||||||||||||||||||||
| Total |
$ | 53 | $ | 51 | $ | 51 | $ | 49 | $ | 50 | $ | 50 | $ | 56 | $ | 60 | |||||||||||||||
| Nondiscretionary assets under administration |
|||||||||||||||||||||||||||||||
| Personal |
$ | 22 | $ | 23 | $ | 20 | $ | 20 | $ | 20 | $ | 20 | $ | 22 | $ | 21 | |||||||||||||||
| Institutional |
65 | 63 | 65 | 61 | 62 | 62 | 66 | 68 | |||||||||||||||||||||||
| Total |
$ | 87 | $ | 86 | $ | 85 | $ | 81 | $ | 82 | $ | 82 | $ | 88 | $ | 89 | |||||||||||||||
| Asset Type |
|||||||||||||||||||||||||||||||
| Equity |
$ | 30 | $ | 30 | $ | 29 | $ | 27 | $ | 27 | $ | 27 | $ | 31 | $ | 34 | |||||||||||||||
| Fixed income |
30 | 29 | 29 | 28 | 29 | 28 | 29 | 28 | |||||||||||||||||||||||
| Liquidity/other |
27 | 27 | 27 | 26 | 26 | 27 | 28 | 27 | |||||||||||||||||||||||
| Total |
$ | 87 | $ | 86 | $ | 85 | $ | 81 | $ | 82 | $ | 82 | $ | 88 | $ | 89 | |||||||||||||||
| OTHER INFORMATION (b) |
|||||||||||||||||||||||||||||||
| Total nonperforming assets |
$ | 11 | $ | 11 | $ | 5 | $ | 5 | $ | 5 | $ | 4 | $ | 4 | $ | 4 | |||||||||||||||
| Brokerage assets administered (in billions) |
$ | 23 | $ | 22 | $ | 21 | $ | 20 | $ | 20 | $ | 19 | $ | 21 | $ | 23 | |||||||||||||||
| Full service brokerage offices |
76 | 77 | 77 | 80 | 84 | 86 | 87 | 89 | |||||||||||||||||||||||
| Financial consultants |
445 | 458 | 475 | 491 | 507 | 513 | 534 | 542 | |||||||||||||||||||||||
| Margin loans |
$ | 256 | $ | 257 | $ | 253 | $ | 247 | $ | 260 | $ | 257 | $ | 297 | $ | 301 | |||||||||||||||
| Average FTE staff |
2,810 | 2,906 | 2,945 | 3,012 | 3,087 | 3,078 | 3,095 | 3,141 | |||||||||||||||||||||||
| (a) | Excludes brokerage assets administered. |
| (b) | Presented as of period-end, except for average FTEs. |
THE PNC FINANCIAL SERVICES GROUP, INC.
PNC Advisors (Unaudited)
| Year ended Taxable-equivalent basis Dollars in millions |
December 31 2003 |
December 31 2002 |
||||||
| INCOME STATEMENT |
||||||||
| Net interest income |
$ | 107 | $ | 106 | ||||
| Noninterest income |
||||||||
| Investment management and trust |
313 | 334 | ||||||
| Brokerage |
101 | 99 | ||||||
| Other |
86 | 79 | ||||||
| Total noninterest income |
500 | 512 | ||||||
| Total revenue |
607 | 618 | ||||||
| Provision for credit losses |
3 | 4 | ||||||
| Noninterest expense |
464 | 460 | ||||||
| Pretax earnings |
140 | 155 | ||||||
| Income taxes |
51 | 57 | ||||||
| Earnings |
$ | 89 | $ | 98 | ||||
| AVERAGE BALANCE SHEET |
||||||||
| Loans |
||||||||
| Consumer |
$ | 1,317 | $ | 1,228 | ||||
| Residential mortgage |
244 | 500 | ||||||
| Commercial |
438 | 471 | ||||||
| Other |
287 | 321 | ||||||
| Total loans |
2,286 | 2,520 | ||||||
| Other assets |
428 | 450 | ||||||
| Total assets |
$ | 2,714 | $ | 2,970 | ||||
| Deposits |
$ | 2,141 | $ | 2,029 | ||||
| Assigned funds and other liabilities |
259 | 296 | ||||||
| Capital |
313 | 339 | ||||||
| Total funds |
$ | 2,713 | $ | 2,664 | ||||
| PERFORMANCE RATIOS |
||||||||
| Return on assigned capital |
28 | % | 29 | % | ||||
| Noninterest income to total revenue |
82 | 83 | ||||||
| Efficiency |
76 | 74 | ||||||
| ASSETS UNDER ADMINISTRATION (in billions) (a) (b) |
|
|||||||
| Assets under management |
||||||||
| Personal |
$ | 44 | $ | 41 | ||||
| Institutional |
9 | 9 | ||||||
| Total |
$ | 53 | $ | 50 | ||||
| Asset Type |
||||||||
| Equity |
$ | 31 | $ | 26 | ||||
| Fixed income |
16 | 17 | ||||||
| Liquidity/other |
6 | 7 | ||||||
| Total |
$ | 53 | $ | 50 | ||||
| Nondiscretionary assets under administration |
||||||||
| Personal |
$ | 22 | $ | 20 | ||||
| Institutional |
65 | 62 | ||||||
| Total |
$ | 87 | $ | 82 | ||||
| Asset Type |
||||||||
| Equity |
$ | 30 | $ | 27 | ||||
| Fixed income |
30 | 29 | ||||||
| Liquidity/other |
27 | 26 | ||||||
| Total |
$ | 87 | $ | 82 | ||||
| OTHER INFORMATION (b) |
||||||||
| Total nonperforming assets |
$ | 11 | $ | 5 | ||||
| Brokerage assets administered (in billions) |
$ | 23 | $ | 20 | ||||
| Full service brokerage offices |
76 | 84 | ||||||
| Financial consultants |
445 | 507 | ||||||
| Margin loans |
$ | 256 | $ | 260 | ||||
| Average FTE staff |
2,918 | 3,100 | ||||||
| (a) | Excludes brokerage assets administered. |
| (b) | Presented as of period-end, except for average FTEs. |
THE PNC FINANCIAL SERVICES GROUP, INC.
PFPC (Unaudited)
| Quarter ended Taxable-equivalent basis Dollars in millions |
December 31 2003 |
September 30 2003 |
June 30 2003 |
March 31 2003 |
December 31 2002 |
September 30 2002 |
June 30 2002 |
March 31 2002 |
||||||||||||||||||||||||
| INCOME STATEMENT |
||||||||||||||||||||||||||||||||
| Fund servicing revenue |
$ | 194 | $ | 188 | $ | 187 | $ | 193 | $ | 195 | $ | 192 | $ | 217 | $ | 213 | ||||||||||||||||
| Operating expense |
155 | 150 | 151 | 162 | 168 | 145 | 167 | 170 | ||||||||||||||||||||||||
| (Accretion)/amortization of other intangibles, net |
(4 | ) | (6 | ) | (4 | ) | (4 | ) | (5 | ) | (4 | ) | (5 | ) | (5 | ) | ||||||||||||||||
| Operating income |
43 | 44 | 40 | 35 | 32 | 51 | 55 | 48 | ||||||||||||||||||||||||
| Nonoperating income (a) |
3 | 3 | 4 | 4 | 3 | 4 | 4 | 6 | ||||||||||||||||||||||||
| Debt financing |
16 | 18 | 18 | 17 | 21 | 22 | 22 | 23 | ||||||||||||||||||||||||
| Pretax earnings |
30 | 29 | 26 | 22 | 14 | 33 | 37 | 31 | ||||||||||||||||||||||||
| Income taxes |
12 | 12 | 10 | 9 | 5 | 14 | 14 | 13 | ||||||||||||||||||||||||
| Earnings |
$ | 18 | $ | 17 | $ | 16 | $ | 13 | $ | 9 | $ | 19 | $ | 23 | $ | 18 | ||||||||||||||||
| AVERAGE BALANCE SHEET |
||||||||||||||||||||||||||||||||
| Goodwill and other intangibles |
$ | 1,034 | $ | 1,034 | $ | 1,055 | $ | 1,025 | $ | 1,022 | $ | 1,025 | $ | 1,030 | $ | 1,036 | ||||||||||||||||
| Other assets |
949 | 862 | 836 | 840 | 857 | 868 | 902 | 812 | ||||||||||||||||||||||||
| Total assets |
$ | 1,983 | $ | 1,896 | $ | 1,891 | $ | 1,865 | $ | 1,879 | $ | 1,893 | $ | 1,932 | $ | 1,848 | ||||||||||||||||
| Debt financing |
$ | 1,248 | $ | 1,290 | $ | 1,290 | $ | 1,290 | $ | 1,290 | $ | 1,290 | $ | 1,290 | $ | 1,290 | ||||||||||||||||
| Assigned funds and other liabilities |
467 | 306 | 298 | 269 | 281 | 288 | 330 | 246 | ||||||||||||||||||||||||
| Capital |
268 | 300 | 303 | 306 | 308 | 315 | 312 | 312 | ||||||||||||||||||||||||
| Total funds |
$ | 1,983 | $ | 1,896 | $ | 1,891 | $ | 1,865 | $ | 1,879 | $ | 1,893 | $ | 1,932 | $ | 1,848 | ||||||||||||||||
| PERFORMANCE RATIOS |
||||||||||||||||||||||||||||||||
| Return on assigned capital |
27 | % | 22 | % | 21 | % | 17 | % | 12 | % | 24 | % | 30 | % | 23 | % | ||||||||||||||||
| Operating margin (b) |
22 | 23 | 21 | 18 | 16 | 27 | 25 | 23 | ||||||||||||||||||||||||
| SERVICING STATISTICS (c) |
||||||||||||||||||||||||||||||||
| Accounting/administration net assets (d) |
||||||||||||||||||||||||||||||||
| Domestic |
$ | 622 | $ | 593 | $ | 583 | $ | 542 | $ | 481 | $ | 464 | $ | 485 | $ | 520 | ||||||||||||||||
| Foreign (e) |
45 | 41 | 35 | 31 | 29 | 25 | 28 | 23 | ||||||||||||||||||||||||
| Total |
$ | 667 | $ | 634 | $ | 618 | $ | 573 | $ | 510 | $ | 489 | $ | 513 | $ | 543 | ||||||||||||||||
| Custody assets (d) |
$ | 401 | $ | 384 | $ | 371 | $ | 347 | $ | 336 | $ | 311 | $ | 323 | $ | 339 | ||||||||||||||||
| Shareholder accounts (in millions) |
||||||||||||||||||||||||||||||||
| Transfer agency |
21 | 21 | 20 | 21 | 26 | 28 | 29 | 29 | ||||||||||||||||||||||||
| Subaccounting |
32 | 29 | 28 | 27 | 25 | 24 | 22 | 20 | ||||||||||||||||||||||||
| Total |
53 | 50 | 48 | 48 | 51 | 52 | 51 | 49 | ||||||||||||||||||||||||
| OTHER INFORMATION |
||||||||||||||||||||||||||||||||
| Average FTEs |
4,801 | 4,760 | 5,328 | 5,437 | 5,538 | 5,772 | 5,979 | 6,046 | ||||||||||||||||||||||||
| (a) | Net of nonoperating expense. |
| (b) | Operating income divided by total fund servicing revenue. |
| (c) | Period end. |
| (d) | In billions. |
| (e) | Represents net assets serviced offshore. |
THE PNC FINANCIAL SERVICES GROUP, INC.
PFPC (Unaudited)
| Year ended Taxable-equivalent basis Dollars in millions |
December 31 2003 |
December 31 2002 |
||||||
| INCOME STATEMENT |
||||||||
| Fund servicing revenue |
$ | 762 | $ | 817 | ||||
| Operating expense |
618 | 650 | ||||||
| (Accretion)/amortization of other intangibles, net |
(18 | ) | (19 | ) | ||||
| Operating income |
162 | 186 | ||||||
| Nonoperating income (a) |
14 | 17 | ||||||
| Debt financing |
69 | 88 | ||||||
| Pretax earnings |
107 | 115 | ||||||
| Income taxes |
43 | 46 | ||||||
| Earnings |
$ | 64 | $ | 69 | ||||
| AVERAGE BALANCE SHEET |
||||||||
| Goodwill and other intangibles |
$ | 1,037 | $ | 1,028 | ||||
| Other assets |
872 | 860 | ||||||
| Total assets |
$ | 1,909 | $ | 1,888 | ||||
| Debt financing |
$ | 1,279 | $ | 1,290 | ||||
| Assigned funds and other liabilities |
336 | 286 | ||||||
| Capital |
294 | 312 | ||||||
| Total funds |
$ | 1,909 | $ | 1,888 | ||||
| PERFORMANCE RATIOS |
||||||||
| Return on assigned capital |
22 | % | 22 | % | ||||
| Operating margin (b) |
21 | 23 | ||||||
| SERVICING STATISTICS (c) |
||||||||
| Accounting/ administration net assets (d) |
||||||||
| Domestic |
$ | 622 | $ | 481 | ||||
| Foreign (e) |
45 | 29 | ||||||
| Total |
$ | 667 | $ | 510 | ||||
| Custody assets (d) |
$ | 401 | $ | 336 | ||||
| Shareholder accounts (in millions) |
||||||||
| Transfer agency |
21 | 26 | ||||||
| Subaccounting |
32 | 25 | ||||||
| Total |
53 | 51 | ||||||
| OTHER INFORMATION |
||||||||
| Average FTEs |
5,081 | 5,834 | ||||||
| (a) | Net of nonoperating expense. |
| (b) | Operating income divided by total fund servicing revenue. |
| (c) | Period end. |
| (d) | In billions. |
| (e) | Represents net assets serviced offshore. |
THE PNC FINANCIAL SERVICES GROUP, INC.
BlackRock (Unaudited)
| Three months ended | December 31 | September 30 | June 30 | March 31 | December 31 | September 30 | June 30 | March 31 | ||||||||||||||||||||||||
| Dollars in millions except as noted |
2003 |
2003 |
2003 |
2003 |
2002 |
2002 |
2002 |
2002 |
||||||||||||||||||||||||
| INCOME STATEMENT |
||||||||||||||||||||||||||||||||
| Investment advisory and administration fees |
$ | 141 | $ | 133 | $ | 128 | $ | 127 | $ | 122 | $ | 122 | $ | 143 | $ | 132 | ||||||||||||||||
| Other income |
20 | 17 | 16 | 16 | 15 | 15 | 14 | 14 | ||||||||||||||||||||||||
| Total revenue |
161 | 150 | 144 | 143 | 137 | 137 | 157 | 146 | ||||||||||||||||||||||||
| Operating expense |
90 | 84 | 81 | 81 | 74 | 74 | 89 | 83 | ||||||||||||||||||||||||
| Fund administration and servicing costs |
9 | 8 | 8 | 8 | 8 | 8 | 13 | 13 | ||||||||||||||||||||||||
| Total expense |
99 | 92 | 89 | 89 | 82 | 82 | 102 | 96 | ||||||||||||||||||||||||
| Operating income |
62 | 58 | 55 | 54 | 55 | 55 | 55 | 50 | ||||||||||||||||||||||||
| Nonoperating income |
5 | 6 | 8 | 3 | 2 | 0 | 4 | 3 | ||||||||||||||||||||||||
| Pretax earnings |
67 | 64 | 63 | 57 | 57 | 55 | 59 | 53 | ||||||||||||||||||||||||
| Income taxes |
26 | 24 | 24 | 22 | 23 | 22 | 24 | 22 | ||||||||||||||||||||||||
| Earnings |
$ | 41 | $ | 40 | $ | 39 | $ | 35 | $ | 34 | $ | 33 | $ | 35 | $ | 31 | ||||||||||||||||
| PERIOD-END BALANCE SHEET |
||||||||||||||||||||||||||||||||
| Goodwill and other intangible assets |
$ | 192 | $ | 192 | $ | 192 | $ | 183 | $ | 183 | $ | 181 | $ | 181 | $ | 181 | ||||||||||||||||
| Other assets |
775 | 728 | 709 | 653 | 681 | 609 | 553 | 486 | ||||||||||||||||||||||||
| Total assets |
$ | 967 | $ | 920 | $ | 901 | $ | 836 | $ | 864 | $ | 790 | $ | 734 | $ | 667 | ||||||||||||||||
| Other liabilities |
$ | 254 | $ | 223 | $ | 192 | $ | 168 | $ | 229 | $ | 194 | $ | 173 | $ | 144 | ||||||||||||||||
| Stockholders equity |
713 | 697 | 709 | 668 | 635 | 596 | 561 | 523 | ||||||||||||||||||||||||
| Total liabilities and stockholders equity |
$ | 967 | $ | 920 | $ | 901 | $ | 836 | $ | 864 | $ | 790 | $ | 734 | $ | 667 | ||||||||||||||||
| PERFORMANCE DATA |
||||||||||||||||||||||||||||||||
| Return on equity |
23 | % | 23 | % | 23 | % | 22 | % | 22 | % | 23 | % | 25 | % | 25 | % | ||||||||||||||||
| Operating margin (a) |
41 | 41 | 40 | 40 | 43 | 43 | 38 | 38 | ||||||||||||||||||||||||
| Diluted earnings per share |
$ | .63 | $ | .61 | $ | .58 | $ | .54 | $ | .52 | $ | .51 | $ | .53 | $ | .48 | ||||||||||||||||
| ASSETS UNDER MANAGEMENT (in billions) |
||||||||||||||||||||||||||||||||
| Separate accounts |
||||||||||||||||||||||||||||||||
| Fixed income |
$ | 190 | $ | 178 | $ | 175 | $ | 168 | $ | 157 | $ | 146 | $ | 141 | $ | 124 | ||||||||||||||||
| Liquidity |
6 | 6 | 5 | 6 | 6 | 5 | 6 | 5 | ||||||||||||||||||||||||
| Liquiditysecurities lending |
10 | 10 | 8 | 6 | 6 | 6 | 6 | 10 | ||||||||||||||||||||||||
| Equity |
9 | 9 | 9 | 9 | 10 | 8 | 10 | 9 | ||||||||||||||||||||||||
| Alternative investment products |
7 | 7 | 6 | 6 | 5 | 6 | 5 | 6 | ||||||||||||||||||||||||
| Total separate accounts |
222 | 210 | 203 | 195 | 184 | 171 | 168 | 154 | ||||||||||||||||||||||||
| Mutual funds (b) |
||||||||||||||||||||||||||||||||
| Fixed income |
24 | 23 | 22 | 20 | 19 | 19 | 17 | 16 | ||||||||||||||||||||||||
| Liquidity |
59 | 58 | 58 | 56 | 66 | 52 | 59 | 60 | ||||||||||||||||||||||||
| Equity |
4 | 3 | 3 | 3 | 4 | 4 | 6 | 8 | ||||||||||||||||||||||||
| Total mutual funds |
87 | 84 | 83 | 79 | 89 | 75 | 82 | 84 | ||||||||||||||||||||||||
| Total assets under management |
$ | 309 | $ | 294 | $ | 286 | $ | 274 | $ | 273 | $ | 246 | $ | 250 | $ | 238 | ||||||||||||||||
| OTHER INFORMATION |
||||||||||||||||||||||||||||||||
| Average FTE staff |
991 | 976 | 943 | 944 | 938 | 918 | 869 | 844 | ||||||||||||||||||||||||
|
(a) Calculated as operating income divided by total revenue less administration and servicing costs. A reconciliation of this presentation to operating margin calculated on a GAAP basis (operating income divided by total revenue) follows in millions:
|
|
|||||||||||||||||||||||||||||||
| Operating income |
$ | 62 | $ | 58 | $ | 55 | $ | 54 | $ | 55 | $ | 55 | $ | 55 | $ | 50 | ||||||||||||||||
| Total revenue |
$ | 161 | $ | 150 | $ | 144 | $ | 143 | $ | 137 | $ | 137 | $ | 157 | $ | 146 | ||||||||||||||||
| Less fund administration and servicing costs |
9 | 8 | 8 | 8 | 8 | 8 | 13 | 13 | ||||||||||||||||||||||||
| Revenue used for operating margin calculation, as reported |
$ | 152 | $ | 142 | $ | 136 | $ | 135 | $ | 129 | $ | 129 | $ | 144 | $ | 133 | ||||||||||||||||
| Operating margin, as reported |
41 | % | 41 | % | 40 | % | 40 | % | 43 | % | 43 | % | 38 | % | 38 | % | ||||||||||||||||
| Operating margin, GAAP basis |
38 | % | 38 | % | 38 | % | 38 | % | 40 | % | 40 | % | 35 | % | 34 | % | ||||||||||||||||
PNC believes that operating margin, as reported, is an effective indicator of managements ability to effectively employ BlackRocks resources.
Fund administration and servicing costs have been excluded from the operating margin calculation because these costs are a fixed, asset-based expense which can fluctuate based on the discretion of a third party.
| (b) | Includes BlackRock Funds, BlackRock Provident Institutional Funds, BlackRock Closed End Funds, Short Term Investment Fund and BlackRock Global Series. |
THE PNC FINANCIAL SERVICES GROUP, INC.
BlackRock (Unaudited)
| Year ended | December 31 | December 31 | ||||||
| Dollars in millions except as noted |
|
2003 |
|
|
2002 |
|
||
| INCOME STATEMENT |
||||||||
| Investment advisory and administrative fees |
$ | 529 | $ | 519 | ||||
| Other income |
69 | 58 | ||||||
| Total revenue |
598 | 577 | ||||||
| Operating expense |
337 | 320 | ||||||
| Fund administration and servicing costs |
33 | 42 | ||||||
| Total expense |
370 | 362 | ||||||
| Operating income |
228 | 215 | ||||||
| Nonoperating income |
23 | 9 | ||||||
| Pretax earnings |
251 | 224 | ||||||
| Income taxes |
96 | 91 | ||||||
| Earnings |
$ | 155 | $ | 133 | ||||
| PERIOD-END BALANCE SHEET |
||||||||
| Goodwill and other intangible assets |
$ | 192 | $ | 183 | ||||
| Other assets |
775 | 681 | ||||||
| Total assets |
$ | 967 | $ | 864 | ||||
| Other liabilities |
$ | 254 | $ | 229 | ||||
| Stockholders equity |
713 | 635 | ||||||
| Total liabilities and stockholders equity |
$ | 967 | $ | 864 | ||||
| PERFORMANCE DATA |
||||||||
| Return on equity |
23 | % | 24 | % | ||||
| Operating margin (a) |
40 | 40 | ||||||
| Diluted earnings per share |
$ | 2.36 | $ | 2.04 | ||||
| ASSETS UNDER MANAGEMENT (in billions) |
||||||||
| Separate accounts |
||||||||
| Fixed income |
$ | 190 | $ | 157 | ||||
| Liquidity |
6 | 6 | ||||||
| Liquiditysecurities lending |
10 | 6 | ||||||
| Equity |
9 | 10 | ||||||
| Alternative investment products |
7 | 5 | ||||||
| Total separate accounts |
222 | 184 | ||||||
| Mutual funds (b) |
||||||||
| Fixed income |
24 | 19 | ||||||
| Liquidity |
59 | 66 | ||||||
| Equity |
4 | 4 | ||||||
| Total mutual funds |
87 | 89 | ||||||
| Total assets under management |
$ | 309 | $ | 273 | ||||
| OTHER INFORMATION |
||||||||
| Average FTE staff |
962 | 894 | ||||||
|
(a) Calculated as operating income divided by total revenue less administration and servicing costs. A reconciliation of this presentation to operating margin calculated on a GAAP basis (operating income divided by total revenue) follows in millions:
|
|
|||||||
| Operating income |
$ | 228 | $ | 215 | ||||
| Total revenue |
$ | 598 | $ | 577 | ||||
| Less fund administration and servicing costs |
33 | 42 | ||||||
| Revenue used for operating margin calculation, as reported |
$ | 565 | $ | 535 | ||||
| Operating margin, as reported |
40 | % | 40 | % | ||||
| Operating margin, GAAP basis |
38 | % | 37 | % | ||||
PNC believes that operating margin, as reported, is an effective indicator of managements ability to effectively employ BlackRocks resources.
Fund administration and servicing costs have been excluded from the operating margin calculation because these costs are a fixed, asset-based expense which can fluctuate based on the discretion of a third party.
| (b) | Includes BlackRock Funds, BlackRock Provident Institutional Funds, BlackRock Closed End Funds, Short Term Investment Fund and BlackRock Global Series. |